assessing the role of dissolved organic nitrogen in...
TRANSCRIPT
Assessing the role of dissolved organic nitrogen in
different aquatic ecosystems
Dissertation
zur Erlangung des Doktorgrades
der Naturwissenschaften im Department
Geowissenschaften
der Universität Hamburg
vorgelegt von
Tim Knut Schlarbaum
aus Hamburg
Hamburg
2011

als Dissertation angenommen
vom Department für Geowissenschaften der Universität Hamburg
auf Grund der Gutachten von
Prof. Dr. Kay-Christian Emeis
Und
Dr. Alejandro Spitzy
Hamburg, den 15.04.2011
Prof. Dr. Jürgen Oßenbrügge Leiter des Department Geowissenschaften


Für meine Familie

Zusammenfassung ___________________________________________________________________________
I
Zusammenfassung
Gelöster organischer Stickstoff (engl.: dissolved organic nitrogen, DON) repräsentiert in
Gewässern oft einen der größten Anteile an reaktiven Stickstoff. Allerdings sind die
Bedeutung und die Rolle des DON im aquatischen Stickstoffkreislauf bisher noch nicht
hinreichend geklärt. Bis vor einiger Zeit war die vornehmliche Meinung, dass DON ein für
Organismen ungeeigneter, abbauresistenter Stickstoffpool sei. Dieser Standpunkt hat sich in
den letzten Jahren geändert und DON ist zunehmend in den Fokus gerückt, eine wichtige
Quelle und aktiver Teil in Umsetzungsprozessen von reaktivem Stickstoff zu sein.
Untersuchungen der Verteilung stabiler Stickstoffisotope in DON sowie in
Umsetzungsprozessen, die mit ausgeprägten Isotopenfraktionierungen einhergehen, haben
ihren Anteil dazu beigetragen.
In der vorliegenden Arbeit beurteile ich anhand von Konzentrationsmessungen und
anhand der Analytik stabiler Stickstoffisotope in kombiniertem DON und Ammonium, sowie
zusätzlich von partikulärem Stickstoff (particulate nitrogen, PN) und Nitrat, die Rolle von
DON im Stickstoffkreislauf zweier sehr unterschiedlicher aquatischer Ökosysteme. Die Elbe
und das Elbeästuar repräsentieren hierbei ein eutrophes Ökosystem, charakterisiert durch
einen sehr großen Nitratüberschuss, der die Umsetzung von DON durch Phytoplankton und
heterotrophe Organismen unnötig machen sollte. Diese beiden Szenarien werden in den
Kapiteln 3 (Elbeästuar) und 4 (Elbe) betrachtet. Im Gegensatz dazu ist das östliche Mittelmeer
ein extrem oligotrophes Ökosystem, von dem vermutet wird, dass DON dort eine quantitativ
signifikante Rolle als Stickstoffspeicher und –quelle einnimmt; Ergebnisse aus diesem System
werden in Kapitel 5 präsentiert.
Im Elbeästuar wurden Proben analysiert, die zu verschiedenen Jahreszeiten (Oktober
2005, Juni 2006 und Dezember 2006) entlang des Salzgradienten von 0 bis 32 genommen
wurden. Die daraus resultierenden Daten zeigen, dass DON, im Gegensatz zu Nitrat, nicht-
konservatives Mischungsverhalten im Salzgradienten des Ästuars aufweist. Im
Zusammenhang mit sich ebenfalls verändernden Isotopen-Verhältnissen ist dies ein Hinweis
auf Umsetzungsprozesse im Ästuar und auf die Existenz von Quellen und Senken für DON.
Adsorptions- und Desorptionsprozesse sind vermutlich die Ursache für den signifikanten
Konzentrationsabfall und das Absinken der Isotopen-Verhältnisse in der ästuaren
Trübungsmaximumszone (TMZ) und dem steilen Anstieg dieser beiden Parameter auf der
Zusammenfassung ___________________________________________________________________________
II
flussabwärts gelegenen Seite der TMZ. Dieses Verhaltensmuster konnte in allen beobachteten
Jahreszeiten nachgewiesen werden. Bei Vergleichen mit Daten älterer Studien zeigt sich, dass
DON-Frachten im Elbeästuar in den letzten 25 Jahren unverändert geblieben sind.
Am Geesthachter Wehr wurden gelöste und partikuläre Stickstofffrachten und ihre
Isotopenverhältnisse in der Tide-freien Elbe über mehr als zwei Jahre in monatlicher
Auflösung analysiert (Juni 2005 bis Dezember 2007). Die Daten für Nitrat weisen einen
Jahreszyklus mit zwei Perioden auf, bedingt durch saisonal variierende biologische Aktivität.
Die Daten für kombiniertes DON und Ammonium zeichnen sich durch einen komplexeren
Zyklus mit vier Perioden pro Jahr aus. Das Auswaschen von organischen Düngemitteln aus
den Böden im Elbumland wird als Ursache für diese Abweichung von dem erwarteten
natürlichen Jahreszyklus angenommen. Die ähnlichen Verläufe der δ15DON- und δ15PN-
Daten weisen dabei auf eine enge Verbindung dieser beiden Stickstoffgruppen hin.
Das östliche Mittelmeer ist ein nährstoffarmes oligotrophes Ökosystem mit im
Vergleich zu anderen Meeren ungewöhnlich niedrigen Isotopenverhältnissen in reaktiven
Stickstoffverbindungen. Im Januar und Februar 2007 wurden Proben an verschieden
Stationen des östlichen Mittelmeeres genommen und auf Isotopenverhältnisse in Nitrat,
gesamt gelösten reduzierten Stickstoff (total dissolved reduced nitrogen, TRN, d.h.
hauptsächlich DON) und suspendiertem partikulären Stickstoff analysiert. Im Tiefenwasser
war Nitrat stärker an 15N abgereichert als in anderen vergleichbaren Meeren. Da TRN und PN
an 15N angereichert waren, wird extensive Mineralisation von PN als Ursache für die
Isotopenzusammensetzungen des reaktiven Stickstoffs im Tiefenwasser angenommen. Das
Isotopenverhältnis von TRN lässt darauf schließen, dass TRN zum einen ein Nebenprodukt
dieser Mineralisation im Tiefenwasser ist, und zum anderen in der euphotischen Zone als
Nebenprodukt von Phytoplankton-Assimilation bzw. Phytoplankton-Fraß entsteht.
Abstract ______________________________________________________________________________
III
Abstract
Dissolved organic nitrogen (DON) is often one of the largest pools of reactive nitrogen in
aquatic environments, but the significance and role of DON in the aquatic nitrogen cycle is still
under debate. Until recently, the prevailing view was that DON is a recalcitrant nitrogen pool
unavailable to organisms; this view changed in recent years, and DON is increasingly recognised
as an important pool and active participant in reactive nitrogen turnover processes. Part of this
recognition originated from investigations into stable nitrogen isotope distributions in DON and
transformation processes that are associated with distinct isotope fractionation.
In this thesis I used concentration and stable isotope analyses of combined DON and
ammonium, and in addition of particular nitrogen (PN) and nitrate to assess the role of DON in
the nitrogen cycle of two very different aquatic ecosystems. The Elbe River and estuary represent
a eutrophic ecosystem with a large nitrate surplus that may make the utilisation of DON by
phytoplankton or heterotrophic organisms unnecessary; these two settings are studied in Chapter 3
(Elbe estuary) and Chapter 4 (Elbe River). The eastern Mediterranean Sea, in contrast, is an
example for a highly oligotrophic ecosystem where DON is supposed a play a quantitatively
significant role as an N repository and source; results for this system are presented in Chapter 5.
In the Elbe estuary, measurements were made on samples taken along a salinity gradient
from 0 to 32 during different seasons (October 2005, June 2006, and December 2006). These data
show that in contrast to nitrate DON exhibits non-conservatively mixing in the salinity gradient of
the estuary. Combined with changing isotope ratios, this is an indicator for transformation
processes and for the existence of sources and sinks of DON in the Elbe estuary. Adsorption and
desorption processes are proposed to be the reason for the significant decrease of DON
concentrations and isotope ratios in the estuarine turbidity maximum zone (TMZ) and the sharp
increase of these parameters at the salty side of the TMZ, since these patterns could be observed
in all seasons sampled. Compared to older data, the DON load did not change in the last 25 years.
At the weir of Geesthacht, the dissolved and particulate N-loads and their isotopic
composition in the non-tidal part of the Elbe River has been monitored for more than two years
(June 2005 to December 2007) at monthly resolution. Nitrate data reveal a two-period annual
cycle due to seasonally varying biological productivity, data of combined DON and ammonium a
more complex four-period annual cycle. Elution of organic fertilizers from soils in the catchment
Abstract ______________________________________________________________________________
IV
of the Elbe River is the likely reason for observed differences from expected natural DON and
ammonium cycles. The similarities of the trends of δ15DON and δ15PN indicate a close coupling
of these nitrogen pools.
The eastern Mediterranean Sea (EMS) is a nutrient-poor oligotrophic ecosystem with
unusually low isotope ratios in reactive nitrogen pools compared to other oceanic environments.
In January and February 2007, samples were taken at different stations across the EMS and
analysed in terms of isotope ratios in nitrate, total dissolved reduced nitrogen (TRN, i.e. mainly
DON) and suspended PN. In deep water, nitrate was more depleted in 15N than in comparable
oceanic environments. Since PN and TRN were 15N-enriched, extensive mineralisation of PN
may be the cause of the isotopic makeup of reactive nitrogen in deep water, and isotopic
properties of TRN suggest that it is a by-product of these mineralisation processes in deep water,
and generated as a by-product of phytoplankton assimilation or phytoplankton grazing in the
euphotic zone.
Contents ___________________________________________________________________________
V
Contents
Zusammenfassung ………………………………………………………………………………………………………………I
Abstract ………………………………………………………………………………………………………………………………..III
Contents ………………………………………………………………………………………………………………………………..V
Chapter 1: Introduction ……………………………………………………………………………………………………1
Chapter 2: Study areas and thesis outlines ………………………………………………………………...10
Chapter 3: Turnover of combined dissolved organic nitrogen and ammoni-
um in the Elbe estuary/NW Europe: results of nitrogen isotope
investigations ……………………………………………………………………………………………...13
Chapter 4: Dissolved and particulate reactive nitrogen in the Elbe River/
NW Europe: a 2- year N-isotope study ………………………………………………..45
Chapter 5: Isotope ratios of nitrate, dissolved reduced and particulate nitro-
gen in the eastern Mediterranean Sea trace external N-inputs
and internal N-cycling ……………………………………………………………………………...65
Chapter 6: Conclusions and outlook …………………………………………………………………………...97
Acknowledgements ………………………………………………………………………………………………………..101
Figure captions ………………………………………………………………………………………………………………..102
Table captions ………………………………………………………………………………………………………………….105
List of abbreviations ………………………………………………………………………………………………………107
References ………………………………………………………………………………………………………………………...108
Data appendix ………………………………………………………………………………………………………………….121
Curriculum vitae ……………………………………………………………………………………………………………..126
List of papers ……………………………………………………………………………………………………………………127

Introduction ___________________________________________________________________________
1
1. Introduction
1.1 Dissolved organic nitrogen – general informatio n
The study of marine nutrient cycles is an important part of biogeochemistry. One of the
most important one is the marine nitrogen cycle, since nitrogen is an essential element for all
organisms. This cycle contains both inorganic and organic compounds of nitrogen, in which
the organic fraction can be separated into dissolved organic nitrogen (DON) and particular
nitrogen.
DON is the nitrogen-bearing part of the dissolved organic matter (DOM) in aquatic
environments, and it is defined as that part of the organic nitrogen that can be filtered through
a filter with 0.45 µm pore-size. The contribution of DON to total dissolved nitrogen (TDN) in
natural environments varies between 15% and 90%: Lowest DON concentrations are found in
the deep ocean and high concentrations in rivers, where highest DON dominance characterise
unpolluted rivers (Wiegner et al., 2006). DON forms a potential source of nitrogen, carbon,
and energy (Bronk, 2002), which are essential for organisms. But even though the DON
contribution to most N-pools in marine and freshwater ecosystems is relatively high, it has
been considered to be a largely inert pool of heterogeneous composition without any relevant
function as a nitrogen source (William and Druffel, 1987). This point of view changed over
the last years with numerous studies that specifically dealt with biological processes in which
DON was involved. Stepanauskas et al. (1999 a, b) found that a substantially larger fraction of
DON is assimilated by marine than by freshwater bacterioplankton, and Bronk et al. (2007)
investigated the influence of DON on harmful algal blooms in seasons when the inorganic
nitrogen pools are exhausted. Seitzinger and Sanders (1997) and Seitzinger et al. (2002)
studied the bioavailability of DON and observed that the proportion of DON that is utilizable
by phytoplankton varies by source and land use pattern in the catchment.
Compositionally, DON is a heterogeneous mixture of biologically labile moieties
(turnover times on the order of days to weeks) and refractory components which persist for
months to hundreds of years. While the refractory matter dominates quantitatively, the labile
forms are supposed to be relevant nitrogen sources for biological systems. The composition of
DON varies, and a considerable part is still unidentified. The main identified compounds are
urea with a proportion of ~ 5% of DON, dissolved free amino acids (DFAA, ~ 6%), dissolved
Chapter 1 ___________________________________________________________________________
2
combined amino acids (DCAA, ~ 7%), and humic and fulvic acids. The DCAA fraction can
be divided into three categories (Keil and Kirchman, 1993). The first category with the lowest
contribution of less than 10% of DCAA includes proteins, similar to that freshly extracted
from phytoplankton, with turnover times of hours to days. In eutrophic waters proteins are the
dominant form of DCAA (Billen, 1991). Proteins kinetically similar to abiotically
glycosylated proteins are part of the second category. They account for almost 50% of
DCAA; the turnover time of this category is much slower than that of biotically produced
proteins. Nonproteinaceous DCAA belong to the last category with an amount of almost 50%
of DCAA. These amino acids are linked to humic or fulvic compounds (Lytle and Perdue,
1981) or adsorbed on clays or other materials (Hedges and Hare, 1987). They are
characterized by resistance to standard liquid hydrolysis and by unknown turnover times.
The fraction of humic and fulvic acids, the most hydrophobic components of DON,
contains organic acids with molecular weights of 500 to 10000 MW, and can also be
separated into three categories. The first category encompasses humic acids, which are not
soluble at a pH of less than 2. This category represents 10% to 20% of DOM. Fulvic acids,
the second category, are hydrophilic acids and are soluble under natural pH conditions. This is
the biggest fraction of DOM with a contribution of equal or more than 50% (Thurman, 1985).
Humins, which are mostly insoluble, but may from colloids (Ishiwatari, 1992), form the third
category. In addition, other organic compounds have been identified, like nucleic acids,
purines, pyrimidines, pteridines, methylamines and creatine (Antia et al., 1991). However,
these compounds represent only a small fraction of DON.
In many studies DON is separated by ultracentrifugation through a 1-kDa ultrafilter and
thus is differentiated in two fractions: low molecular weight DON (LMW DON, < 1-kDa) and
high molecular weight DON (HMW DON, >1-kDa). Most labile DON belongs to LMW
DON, and the recalcitrant part of DON is part of HMW DON (Benner et al., 1992, 1997;
Kerner and Spitzy, 2001).
1.2 DON as part of the nitrogen cycle
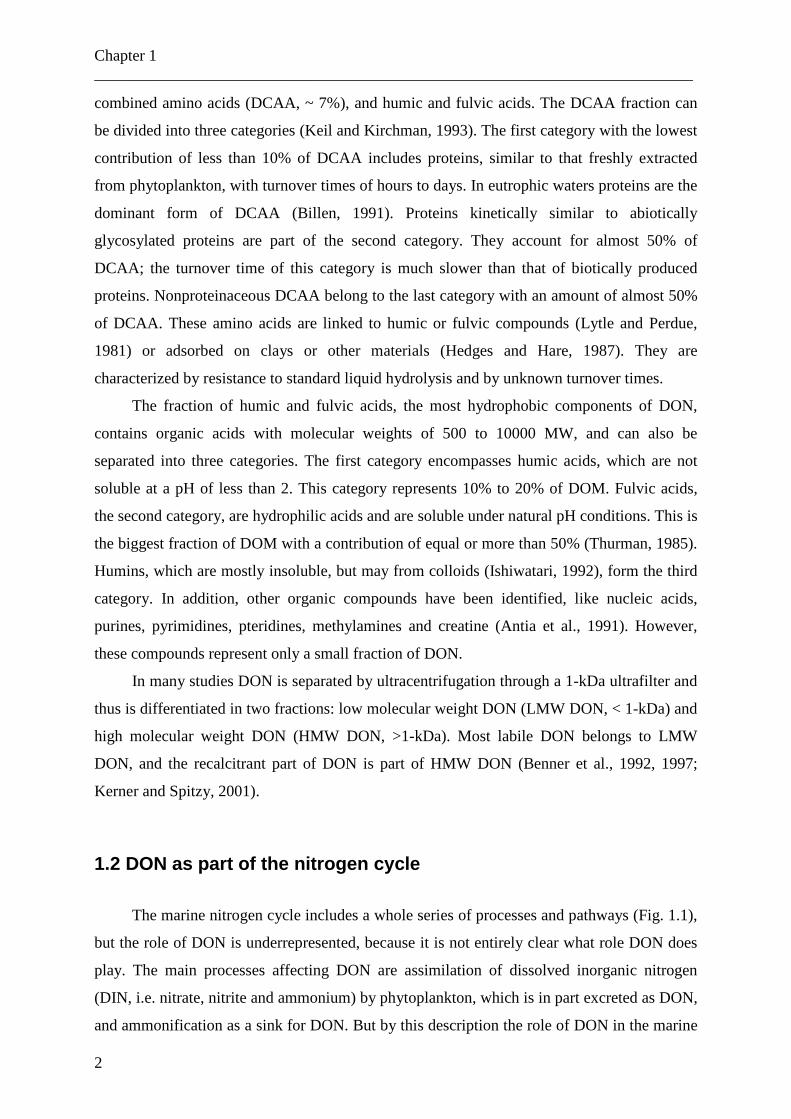
The marine nitrogen cycle includes a whole series of processes and pathways (Fig. 1.1),
but the role of DON is underrepresented, because it is not entirely clear what role DON does
play. The main processes affecting DON are assimilation of dissolved inorganic nitrogen
(DIN, i.e. nitrate, nitrite and ammonium) by phytoplankton, which is in part excreted as DON,
and ammonification as a sink for DON. But by this description the role of DON in the marine
Introduction ___________________________________________________________________________
3
nitrogen cycle is not well represented, since many different sources (Fig. 1.2) and sinks (Fig.
1.3) of DON do exist.
Figure 1.1: The marine nitrogen cycle. X and Y represent intracellular intermediates that are not accumulated in
the water column (from Codispoti et al., 2001).
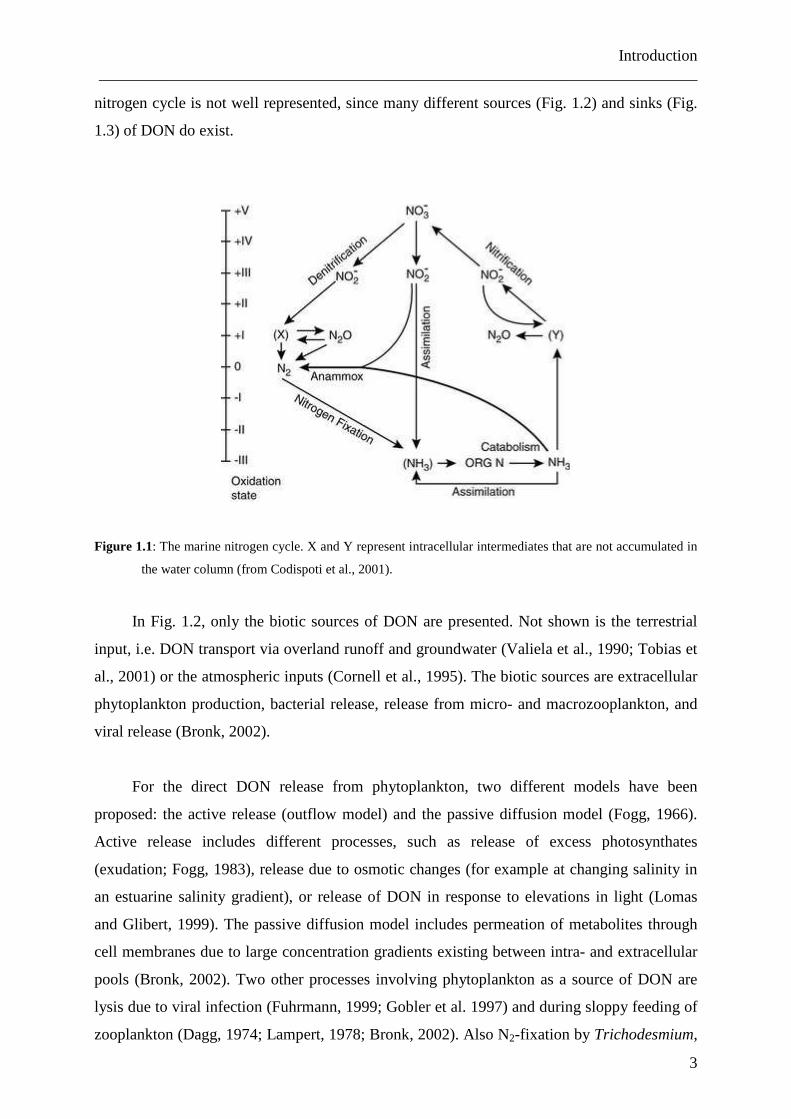
In Fig. 1.2, only the biotic sources of DON are presented. Not shown is the terrestrial
input, i.e. DON transport via overland runoff and groundwater (Valiela et al., 1990; Tobias et
al., 2001) or the atmospheric inputs (Cornell et al., 1995). The biotic sources are extracellular
phytoplankton production, bacterial release, release from micro- and macrozooplankton, and
viral release (Bronk, 2002).
For the direct DON release from phytoplankton, two different models have been
proposed: the active release (outflow model) and the passive diffusion model (Fogg, 1966).
Active release includes different processes, such as release of excess photosynthates
(exudation; Fogg, 1983), release due to osmotic changes (for example at changing salinity in
an estuarine salinity gradient), or release of DON in response to elevations in light (Lomas
and Glibert, 1999). The passive diffusion model includes permeation of metabolites through
cell membranes due to large concentration gradients existing between intra- and extracellular
pools (Bronk, 2002). Two other processes involving phytoplankton as a source of DON are
lysis due to viral infection (Fuhrmann, 1999; Gobler et al. 1997) and during sloppy feeding of
zooplankton (Dagg, 1974; Lampert, 1978; Bronk, 2002). Also N2-fixation by Trichodesmium,
Chapter 1 ___________________________________________________________________________
4
a cyanobacterium, can be a source of DON, since up to 50% of fixed N2 is released directly as
DON during growth in natural populations of Trichodesmium in the Atlantic Ocean and
Caribbean Sea (Capone et al., 1994; Glibert and Bronk, 1994).
Figure 1.2: Conceptual diagram of biotic processes involved in DON release in aquatic systems (from Bronk,
2002).
Bacterial release is primarily related to LMW DON such as urea (Berman et al., 1999),
and two mechanisms exist: Active release of exoenzymes or passive diffusion. Release of
DON through mineralization of organic aggregates by bacteria has also been observed (Smith
et al., 1992).
Processes involving micro- and macrozooplankton as a DON source are release via
sloppy feeding (Dagg, 1974; Lampert, 1978; Bronk, 2002), via bactivory, when dissolved
intracellular compounds are released due to broken cells (Bronk, 2002), via release of waste
containing DON (excretion; Miller and Glibert, 1998), or via diffusion away from or the
dissolution of fecal pellets (Jumars et al., 1989).
Viral release is a DON source because in the final stages of a viral infection, when the
cell bursts due to an increase of phage, cellular contents are released. Due to this mechanism,
viruses do not only affect the quantity of DON, but also the quality (Fuhrmann, 1999, 2000).
Introduction ___________________________________________________________________________
5
Other sources of DON include the release from excretion of macroorganisms (Tupas and
Koike, 1990), the direct release from macroalgae (Mann, 1982; Branch and Griffith, 1988), as
well as release from detrital particles via dissolution (Carlson, 2002) or the diagenetic release
from sediments (Burdige, 2002).
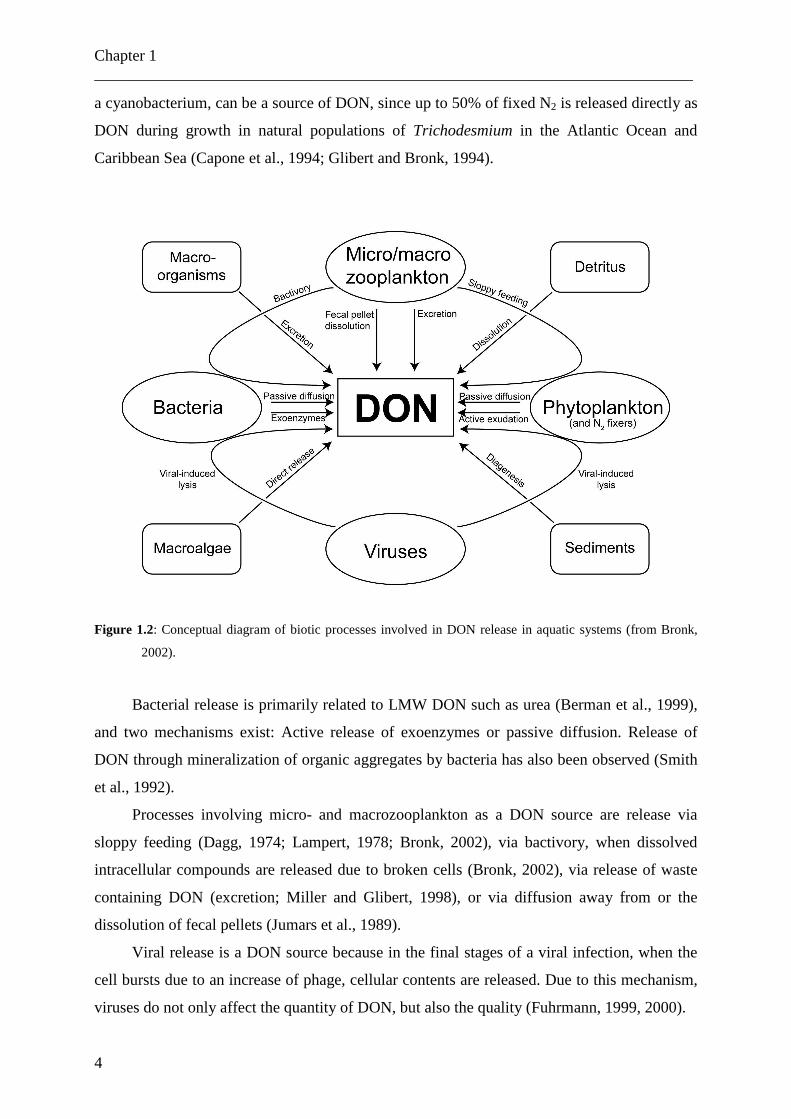
Figure 1.3: Conceptual diagram of processes involved in DON utilization in aquatic systems (from Bronk, 2002)
In Fig. 1.3, the main sinks for DON are presented: Heterotrophic uptake, autotrophic
uptake and abiotic photochemical decomposition (Bronk, 2002).
Heterotrophic bacteria possess the ability for the utilization of dissolved proteins,
DCAA and DFAA for growth (Carlson, 2002; Veuger et al., 2004), but most bacteria can take
up only small organic components (Antia et al., 1991). For the utilization of bigger DON
compounds, extracellular hydrolysis of these compounds is necessary (Münster and De Haan,
1998).
Two possible mechanisms of DON utilization by autotrophs exist: One is bacterial
degradation of DON followed by phytoplankton uptake of the released nitrogen. The second
is the direct incorporation of DON compounds via surface enzymes (Bronk, 2002). Several
studies dealt with the bacterial DON degradation (Berman et al., 1991; Antia et al., 1991;
Chapter 1 ___________________________________________________________________________
6
Palenik and Hensen, 1997). When the process results in the release of ammonium, it is known
as ammonification.
For the direct uptake of DON the presence of cell surface enzymes like amine oxidases
is necessary to cleave amino groups from amino acids and primary amines (Palenik and
Morel, 1990a, b; 1991). A number of dinoflagellate species have the ability to use organic
nutrients either via cell surface enzymes (Palenik and Morel, 1990a, b), or direct assimilation
(Butler et al., 1979; Berg et al., 1997).
A third observed sink of DON is photochemical decomposition, which can promote the
release of labile nitrogen components from DOM (Bushaw et al., 1996). This photoproduction
of ammonium, DFAA, DCAA and nitrite has been studied predominantly in fresh or brackish
water environments, but this process is not ubiquitous (Bertilsson et al., 1999). Especially the
aromatic humic substances with their ability to absorb UV light are important substrates for
photochemical decomposition (Valiela and Teal, 1979; Stevenson, 1994).
1.3 DON – Analytical problems and stable isotopes
To study DON and its role in the nitrogen cycle it is necessary to use a suitable method
to measure DON concentrations with high precision (Bronk et al., 2000), but it is difficult to
measure DON directly, since DIN (i.e. ammonium, nitrate and nitrite) may interfere with
most analytical methods. So the current method is to determine the concentration of total
dissolved nitrogen (TDN) and to subtract the concentrations of separately measured
ammonium and combined nitrate/nitrite, with the residual being defined as DON (Bronk,
2002).
)/()()()( 234−−+ −−= NONOcNHcTDNcDONc (Eq. 1.1)
For the measurement of TDN concentration three different methods are common:
ultraviolet oxidation (Armstrong et al, 1966), high-temperature oxidation (Sharp, 1973) and
persulfate oxidation (Menzel and Vaccaro, 1964; Sharp, 1973; Solórzano and Sharp, 1980). In
a broad community comparison of the three methods, no one emerged as clearly superior
(Sharp et al., 2002).
Concentration changes in natural systems are often inconclusive as indicators for
sources, sinks, and internal turnover, and the measurement of stable isotope ratios has greatly
increased our ability to identify processes and turnover rates in N cycling. Table 1.1 lists
Introduction ___________________________________________________________________________
7
elements and their isotopes that are often used in ecosystem studies. Many elements exist in
different isotopes, i.e. they differ in the number of their neutrons, but in chemical reactions
they react identically. However, a slight discrimination against the heavier isotope may occur
in non-equilibrium reactions due to their lower reactivity, since their vibrational frequencies
are lower and thereby their molecular bonds are stronger (Kendall, 1998). This slight
discrimination leads to a fractionation of the stable isotopes during many biological processes,
so that substrates and products differ slightly in the isotopic ratios.
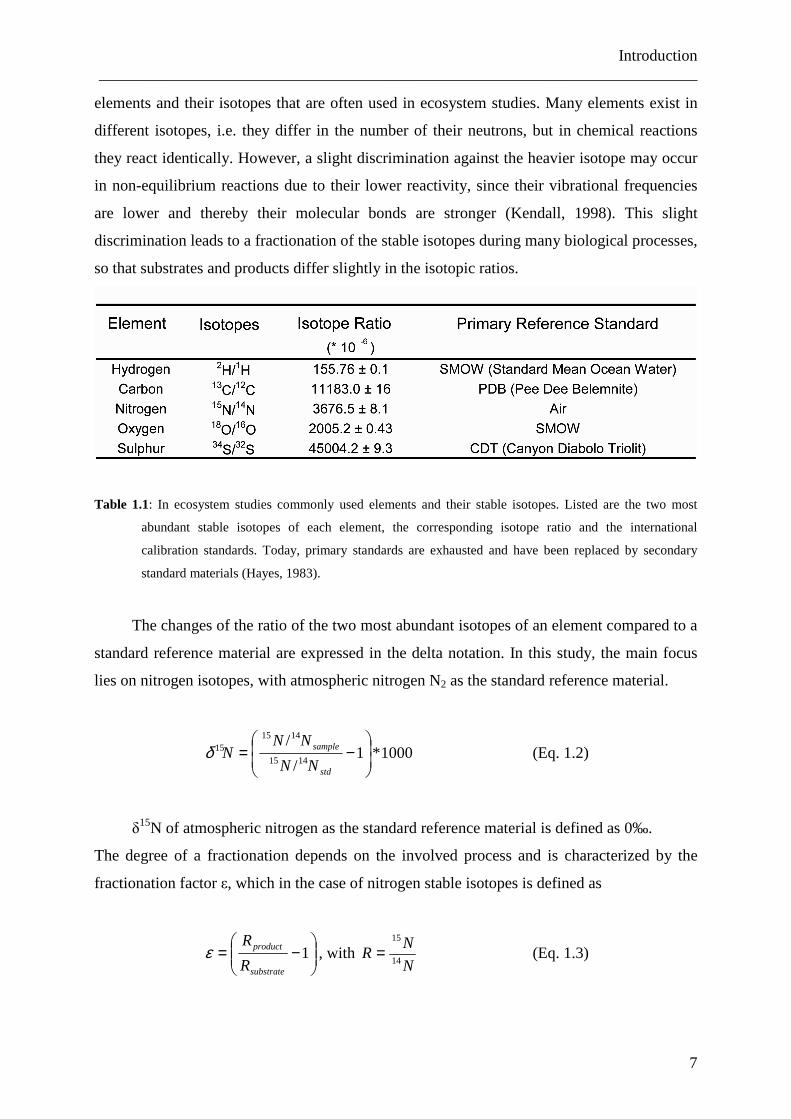
Table 1.1: In ecosystem studies commonly used elements and their stable isotopes. Listed are the two most
abundant stable isotopes of each element, the corresponding isotope ratio and the international
calibration standards. Today, primary standards are exhausted and have been replaced by secondary
standard materials (Hayes, 1983).
The changes of the ratio of the two most abundant isotopes of an element compared to a
standard reference material are expressed in the delta notation. In this study, the main focus
lies on nitrogen isotopes, with atmospheric nitrogen N2 as the standard reference material.
1000*1/
/1415
141515
−=
std
sample
NN
NNNδ (Eq. 1.2)
δ15N of atmospheric nitrogen as the standard reference material is defined as 0‰.
The degree of a fractionation depends on the involved process and is characterized by the
fractionation factor ε, which in the case of nitrogen stable isotopes is defined as
−= 1
substrate
product
R
Rε , with
N
NR
14
15
= (Eq. 1.3)
Chapter 1 ___________________________________________________________________________
8
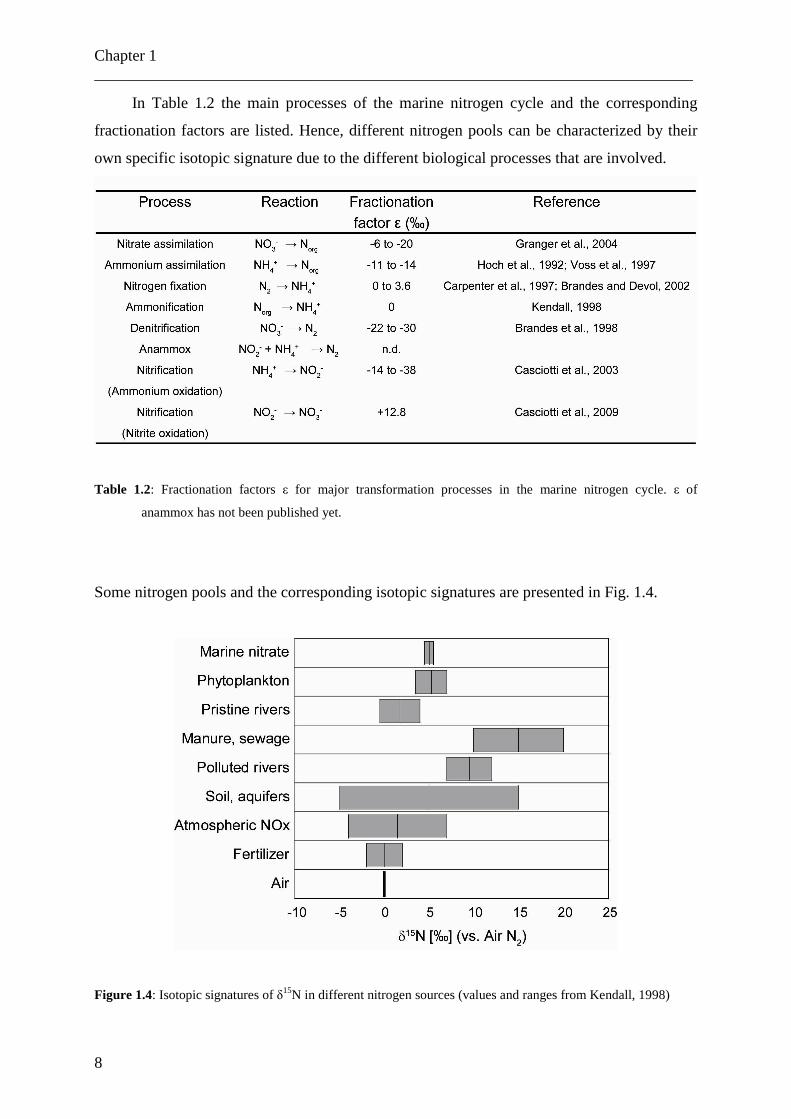
In Table 1.2 the main processes of the marine nitrogen cycle and the corresponding
fractionation factors are listed. Hence, different nitrogen pools can be characterized by their
own specific isotopic signature due to the different biological processes that are involved.
Table 1.2: Fractionation factors ε for major transformation processes in the marine nitrogen cycle. ε of
anammox has not been published yet.
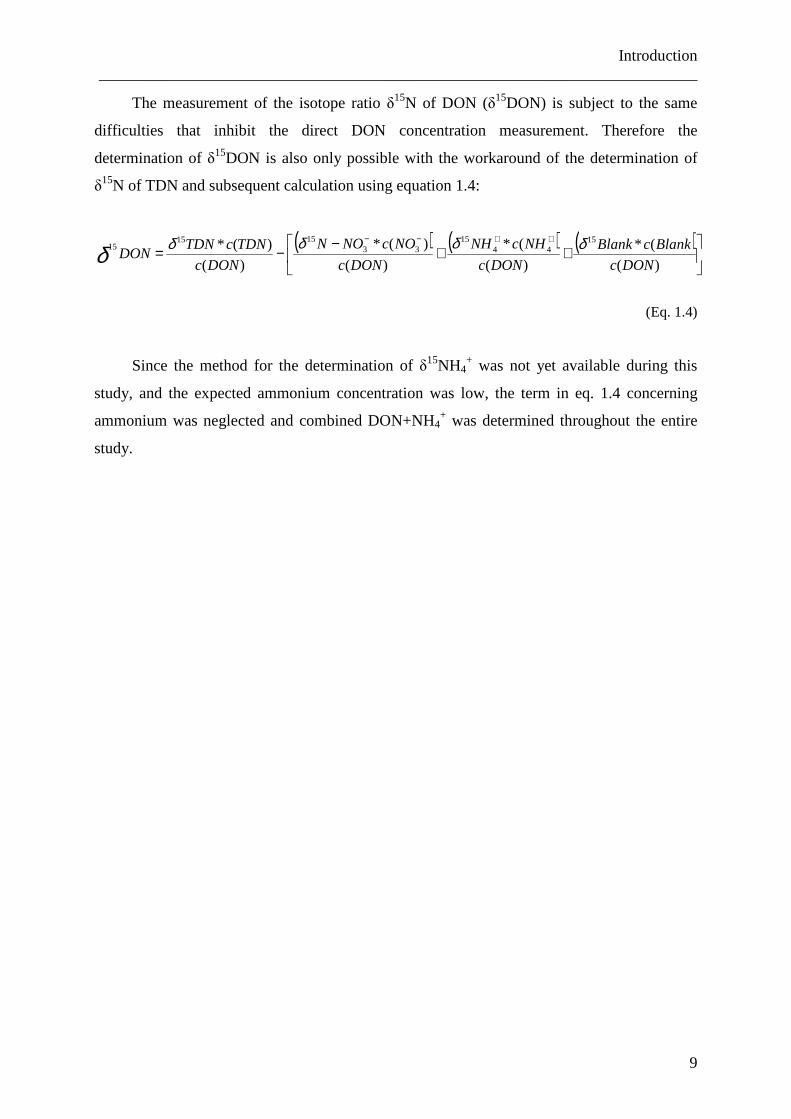
Some nitrogen pools and the corresponding isotopic signatures are presented in Fig. 1.4.
Figure 1.4: Isotopic signatures of δ15N in different nitrogen sources (values and ranges from Kendall, 1998)
Introduction ___________________________________________________________________________
9
The measurement of the isotope ratio δ15N of DON (δ15DON) is subject to the same
difficulties that inhibit the direct DON concentration measurement. Therefore the
determination of δ15DON is also only possible with the workaround of the determination of
δ15N of TDN and subsequent calculation using equation 1.4:
( ) ( ) ( )
++
−−=
++−−
)(
(*
)(
(*
)(
)(*
)(
)(* 1544
1533
151515
DONc
BlankcBlank
DONc
NHcNH
DONc
NOcNON
DONc
TDNcTDNDON
δδδδδ
(Eq. 1.4)
Since the method for the determination of δ15NH4
+ was not yet available during this
study, and the expected ammonium concentration was low, the term in eq. 1.4 concerning
ammonium was neglected and combined DON+NH4+ was determined throughout the entire
study.
Chapter 2 ___________________________________________________________________________
10
2. Study areas and thesis outlines
For a better understanding of the role of DON in the aquatic nitrogen cycle, this thesis
investigates concentrations and δ15N of combined DON and ammonium (DON+NH4+; in
chapter 5 termed total reduced dissolved nitrogen; TRN) in aquatic ecosystems of different
trophic level to identify differences and/or similarities. Relations to other forms of reactive
nitrogen like nitrate and particular nitrogen (PN), their correlations, anti-correlations or the
absence of these relationships should help to clarify the mechanisms DON is involved.
2.1 A eutrophic ecosystem using the example of the Elbe River / NW Europe
A eutrophic ecosystem is characterized by high nutrient concentrations, either from
natural or anthropogenic sources, leading to an increase in primary production over pristine
conditions. Many ecological effects can arise from stimulating primary production, but some
effects may strongly influence the entire ecosystem: Among these are decreased biodiversity
and toxicity effects (Horrigan et al., 2002; Anderson, 1994).
In aquatic ecosystems, the increase in nutrient supply leads to an increase in algal
population growth and biomass produced. On the one hand, nutrient-stimulated algal blooms
limit the sunlight available to bottom-dwelling organisms, and on the other hand cause the
oxygen demand of sinking organic matter to rise, often resulting in decreases in the amount of
dissolved oxygen in deeper water. Oxygen is required by all respiring plants and animals and
it is produced in daylight by photosynthesizing algae. Under eutrophic conditions, dissolved
oxygen in the surface layer increases strongly during daylight, but it is also strongly reduced
after dark by the respiring algae and by microorganisms that respire the increasing mass of
dead algae. When dissolved oxygen levels decline to hypoxic levels, fish and other marine
animals suffocate. As a result, creatures such as fish, shrimp, and especially immobile bottom
dwellers die off (Horrigan et al., 2002).
Some algal blooms are toxic to animals and plants (so called harmful algal blooms), and
the toxic compounds produced may be passed up through the food chain, resulting in animal
mortality. When the algae die or are eaten, their toxins are released which can kill animals and
may also pose a threat to humans (Lawton and Codd, 1991; Martin and Cooke, 1994).
Study areas and thesis outlines ___________________________________________________________________________
11
The Elbe River with a length of 1094 km is the second largest river discharging into the
North Sea. The estuary extends over 142 km and enters into the German Bight, the south-
eastern part of the North Sea, at the city of Cuxhaven. This part of the Elbe is continuously
dredged and channelled to enable access for large container ships to the port of Hamburg, one
of the largest container ports in the world. The tidal Elbe estuary is separated from the
upstream river system by the only barrage along the entire river, the weir at the city of
Geesthacht at stream kilometre 585. The average fresh water discharge is 861m3/s at the Elbe
mouth (Cuxhaven) and 700m³/s at the weir of Geesthacht. The water residence time in the
estuary ranges from ~ 10 days during mean high water flow (2000 m3/s) and ~ 72 days during
mean low water flow (300 m3/s) with ~ 32 days during mean tide level (IKSE, 2005). Nearly
25 million people live in the entire catchment area of 148 268 km2 (Behrendt et al., 2004).
The Elbe River is the largest source of total dissolved nitrogen (TDN) and nitrate of the inner
German Bight (Brockmann and Pfeiffer, 1990), which is that part of the North Sea most
affected by eutrophication (OSPAR, 2008).
2.2 An oligotrophic ecosystem using the example of the eastern Mediterranean Sea
An oligotrophic ecosystem is characterized by low nutrient concentrations and therefore
only low primary production. Thus, there are only small populations of flora and fauna in
oligotrophic ecosystems due to very low food supply.
The eastern Mediterranean Sea is an oligotrophic ecosystem (Antoine et al., 1995;
Béthoux, 1989) with relatively fast turn over rates of limiting nutrients and a primary
production level of approximately half the level observed in the Sargasso Sea or the Northeast
Pacific (Krom et al., 2003). The low productivity is due to the special flow conditions in this
basin: Modified Atlantic Water flows in through the Strait of Sicily at the surface and sinks in
the eastern part of the basin. The high temperature, high salinity Levantine Intermediate
Water at depths between 200 and 500 m is fed by this flow that leaves the basin as a westward
current through the Sicily Strait. Mineralisation products sinking out of the mixed layer are
collected and transported by this Levantine Intermediate Water. The deep water below this
circulation cell is depleted in nutrients compared to deep water in all other parts of the global
ocean (Malanotte-Rizzolli and Bergamasco, 1989; Krom et al., 1991).
Another remarkable feature of the eastern Mediterranean Sea is the δ15N levels of deep-
water nitrate, suspended matter and surface sediments, because they are unusually depleted
Chapter 2 ___________________________________________________________________________
12
compared to values in other oceanic ecosystems (Coban-Yildiz et al., 2006; Pantoja et al.,
2002; Struck et al., 2001). The low interexchange of Mediterranean Deep Water with other
oceanic water masses increases the impact of regional sources of reactive nitrogen.
2.3 Thesis outline
This thesis is based on three publications, which are presented in the following chapters.
Chapter 3
Schlarbaum, T., Dähnke, K., and Emeis, K., 2010: Turnover of combined dissolved organic
nitrogen and ammonium in the Elbe estuary / NW Europe: Results of nitrogen isotopes
investigations. Mar. Chem. 119, 91-107
Chapter 4
Schlarbaum, T., Dähnke, K., and Emeis, K., 2010: Dissolved and particulate reactive nitrogen
in the Elbe River / NW Europe: a 2-year N-isotope study. Biogeoscience Discuss. 7, 7543-
7574, doi:10.5194/bgd-7-7543-2010
Chapter 5
Emeis, K.-C., Mara, P., Schlarbaum, T., Möbius, J., Dähnke, K., Struck, U., Mihalopoulos,
N., and Krom, M., 2010: N-isotope ratios of nitrate, dissolved organic nitrogen and
particulate nitrogen in the Eastern Mediterranean Sea. In press in Journal of
Geophysical Research – Biogeochemistry
My contribution to chapter 5 was recovery and filtration of the nutrient samples, digestion and
analysis plus interpretation of the TDN samples, and determination of the isotope ratios δ15N
and δ18O in nitrate (parts of the data set).
Turnover of combined DON+NH4+ in the Elbe estuary
___________________________________________________________________________
13
3. Turnover of combined dissolved organic nitrogen and
ammonium in the Elbe estuary/NW Europe: results of
nitrogen isotope investigations
Abstract
Dissolved organic nitrogen (DON) is often the dominant form of reactive nitrogen
transported from land to sea by rivers, but is considered to be largely recalcitrant and behaves
conservatively in many estuaries. We measured the concentration and the isotope ratio δ15N of
combined DON and ammonium (δ15DON+NH4+) in the Elbe River estuary (SE North Sea,
NW Europe) by a combination of a modified persulfate digestion and the denitrifier method.
Measurements were made on samples taken along the salinity gradient from 1 to 32 during
different seasons, in order to gauge the effects of internal biological processes and external
signatures (such as pollution). Combined DON and ammonium concentrations ranged from
20 to 60 µM, and δ15DON+NH4+ from 0 to 11‰. The results show that DON+NH4
+
contributes < 20% to total reactive nitrogen in the river end-member and rises to 50% in the
outer estuary. By comparison with older data, the DON load in the Elbe River did not change
since the 1980´s, when nitrate and phosphate pollution was maximal. We find evidence that
DON and/or ammonium or reactive components in DON are both consumed and produced in
the estuary, indicated by changing isotope ratios and non-conservative mixing gradients. The
estuarine turbidity maximum zone (TMZ) at salinities <5, which today is a significant source
of nitrate from nitrification, coincides with significantly decreased DON+NH4+ concentrations
and δ15DON+NH4+ in all seasons sampled. Whether this is due to selective
absorption/desorption of 15N enriched moieties onto particle surfaces, or to selective
heterotrophic assimilation and nitrification is yet unclear, and the loss of DON+NH4+ does not
balance the added nitrate. Because DON+NH4+ concentrations and δ15DON+NH4
+ rise
sharply seaward of the TMZ, we consider adsorption/desorption processes most likely. In the
salinity gradient 5 to 30, DON+NH4+ behaves conservatively in both concentration and
isotopic composition.
Key words: Dissolved organic nitrogen, stable isotopes, estuary, particulate nitrogen
Chapter 3 ___________________________________________________________________________
14
3.1 Introduction
Dissolved organic nitrogen (DON) is a major (between 15% and 90%) component of
total dissolved nitrogen (TDN) transported to the coastal ocean by rivers, with highest DON
dominance in unpolluted rivers (Wiegner et al., 2006). DON has until recently been
considered to be a largely inert pool of heterogeneous composition that is not a relevant N-
source for estuarine and coastal ecosystems. This view is changing: Although only parts of
the heterogeneous DON pool in estuarine environments apparently are bioavailable (Bronk et
al., 2007; Seitzinger and Sanders, 1997; Seitzinger et al., 2002), labile moieties of DON are
now seen as potentially important nitrogen sources for assimilatory and dissimilatory
biological processes in coastal environments, and in particular in those situations, when
dissolved inorganic nitrogen (DIN) is exhausted (Bronk, 2002). Significantly, there is some
evidence that a decrease in the DIN/DON ratio of coastal waters (due to decreasing ratios in
river loads or to seasonal depletion of DIN) may be favourable to dinoflagellates and
cyanobacteria and may be implicated in the triggering of harmful algal blooms (Bronk et al.,
2007).
Our interest here is to investigate the fate of DON in the extended estuarine salinity
gradient of the Elbe River/NW Europe between a well-defined riverine (weir at Geesthacht)
and marine end member in the German Bight/southeastern North Sea (Fig. 1). The estuary has
been monitored continuously over the last decades for changes in water quality (ARGE,
2008), and data are available that offer a long-term view of the estuarine biogeochemistry of
DON. The role of DON may have changed as a result of pollution reduction measures in the
watershed, and since the mid-1980´s, TDN and DIN loads of the river have decreased by 30%
(Radach and Paetsch, 2007). The first objective of the present study was to investigate
whether the combined concentration of DON and ammonium and the NO3-/DON+NH4
+ ratio
in this river have changed as well.
Secondly, we present (to our knowledge) a first systematic and seasonally resolved data
set on the 15N/14N composition of combined DON and ammonium (expressed as the δ value in
‰ = [(Rsample/Rstandard)-1]*1000, R = 15N/14N in DON+NH4+ and in the international standard
atmospheric dinitrogen) of an estuary, allowing us to better evaluate whether or not
DON+NH4+ behaves conservatively in the mixing zone between marine and fresh waters than
concentrations alone. This was motivated by the fact that decreased DIN loads were
accompanied by significant changes in estuarine nitrate turnover: The estuary changed from
being a nitrate sink to being a nitrate source (Dähnke et al., 2008), and the nitrate source was
Turnover of combined DON+NH4+ in the Elbe estuary
___________________________________________________________________________
15
associated with the estuarine turbidity maximum zone (TMZ) that forms at salinities between
0.4 and 2 (Bergemann, 1995). That nitrate increase was most pronounced in June 2006, when
the internal addition doubled the original riverine nitrate concentration (Dähnke et al., 2008).
Based on a concomitant decrease in δ18O of nitrate, the source of the added nitrate was most
likely nitrification of ammonium: The increase in nitrate concentrations was not associated
with substantial changes in δ15N-NO3-, but only by a pronounced drop in δ18O. Because
ammonium levels in the Elbe estuary are too low to account for an input of this magnitude, it
was suggested that local nitrification of ammonium derived from the degradation of organic
matter and its subsequent rapid oxidation by particle-associated nitrifying bacteria within the
TMZ caused the nitrate peak. This would involve either DON or particulate nitrogen (PN) and
should thus be accompanied by changes in concentrations and/or isotopic composition of
DON and PN.
In summary, our objectives here are to 1) test if the NO3-/DON+NH4
+ ratio in the Elbe
river changed, and whether this is due to enhanced DON+NH4+ production, or decreasing
nitrate levels alone over the last decades, 2) to examine concentration and isotopic changes
versus salinity in the estuary for evidence of DON+NH4+ turnover, and in particular turnover
in the TMZ, and 3) to establish whether seasonal differences in DON+NH4+ turnover are
apparent in the estuary.
3.2 Materials and Methods
Our approach is based on determinations of combined DON and ammonium
concentrations and the isotope ratio δ15DON+NH4
+ along the salinity gradient during different
seasons in the Elbe estuary. Mixing diagrams of salinity versus DON+NH4+ concentrations, or
versus δ15DON+NH4+, help to determine whether DON+NH4
+ behaves conservatively in the
estuary or not. The mixing behaviour of dissolved compounds can be assessed by using a
mixing model for calculating concentrations (Liss, 1976):
( ) mrmix cfcfc *1* −+= (Eq. 3.1)
The indexes r and m denote riverine and marine concentrations, and f indicates the
fraction of freshwater in each sample calculated from salinity, with 32 as salinity of the
marine end member for German Bight water (f = (32- salinity)/32).
Chapter 3 ___________________________________________________________________________
16
For isotopic values a calculation of mixing with concentration-weighted isotopic values
is used (Fry, 2002):
( )[ ]mix
mmrrmix c
cfcf δδδ **1** −+= (Eq. 3.2)
Conservative mixing leads to linear mixing paths in the case of concentrations, whereas
salinity-based isotope mixing diagrams usually show curvilinear mixing behaviours,
reflecting concentration-based weighting of end member isotopic contributions.
3.2.1 Study site
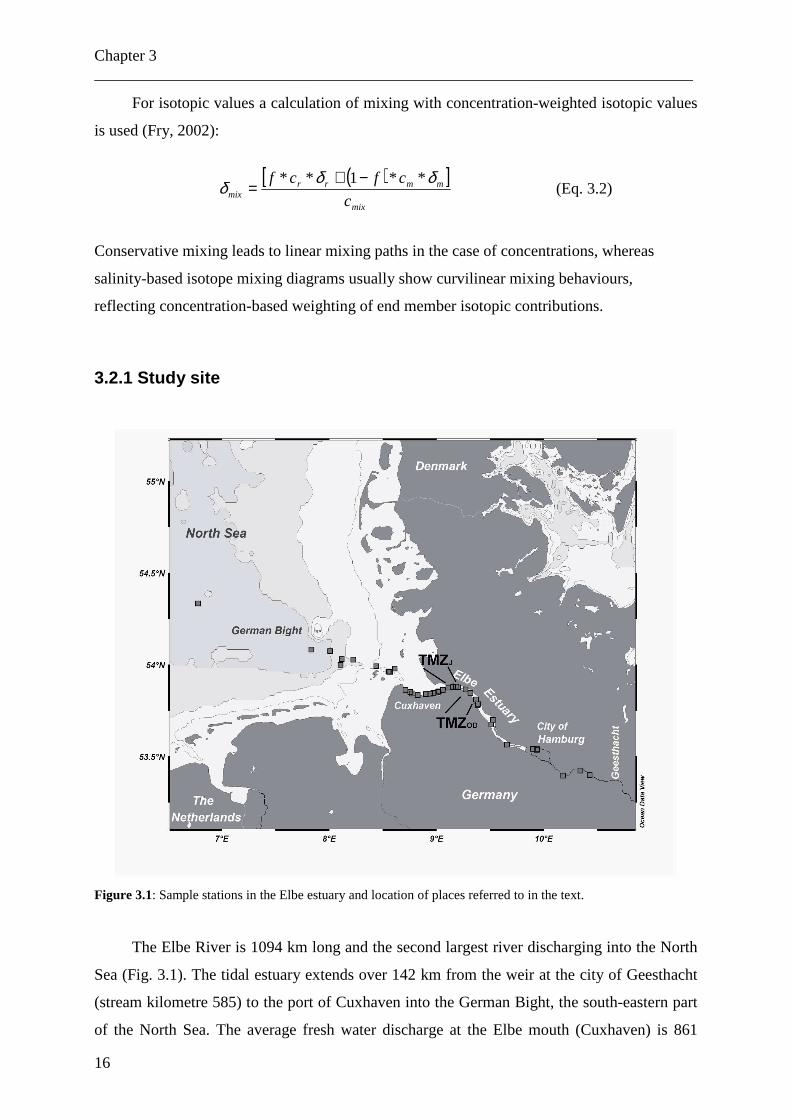
Figure 3.1: Sample stations in the Elbe estuary and location of places referred to in the text.
The Elbe River is 1094 km long and the second largest river discharging into the North
Sea (Fig. 3.1). The tidal estuary extends over 142 km from the weir at the city of Geesthacht
(stream kilometre 585) to the port of Cuxhaven into the German Bight, the south-eastern part
of the North Sea. The average fresh water discharge at the Elbe mouth (Cuxhaven) is 861
Turnover of combined DON+NH4+ in the Elbe estuary
___________________________________________________________________________
17
m3/s; nearly 25 million people live in the entire catchment area of 148 268 km2. The Elbe
River is the largest source of total dissolved nitrogen (TDN) and nitrate of the inner German
Bight (Brockmann and Pfeiffer, 1990), which is that part of the North Sea most affected by
eutrophication (OSPAR, 2008).
The Elbe tidal estuary is continuously dredged and channelled to enable access for large
container ships to the port of Hamburg, one of the largest container ports in the world. The
water residence time in the estuary ranges from ~ 10 days during mean high water flow (2000
m3/s) and ~ 72 days during mean low water flow (300 m3/s) with ~ 32 days during mean tide
level (IKSE, 2005).
3.2.2 Sampling
On three occasions, samples were collected along the salinity gradients from <5 to >28.
The sampling campaigns were conducted in October 2005, June 2006 and December 2006 on
board the R/V Ludwig Prandtl (Table 3.1). Samples from the open North Sea were taken on
board of the R/V Gauss and R/V Walther Herwig. In October 2005 and June 2006, water was
collected at each station from surface waters (1 – 2 m), from 5 m depth and from 1 m above
the ground for depth profiles in the Elbe estuary by using a multiprobe with rosette sampler,
which was also used to measure the salinity in-situ.
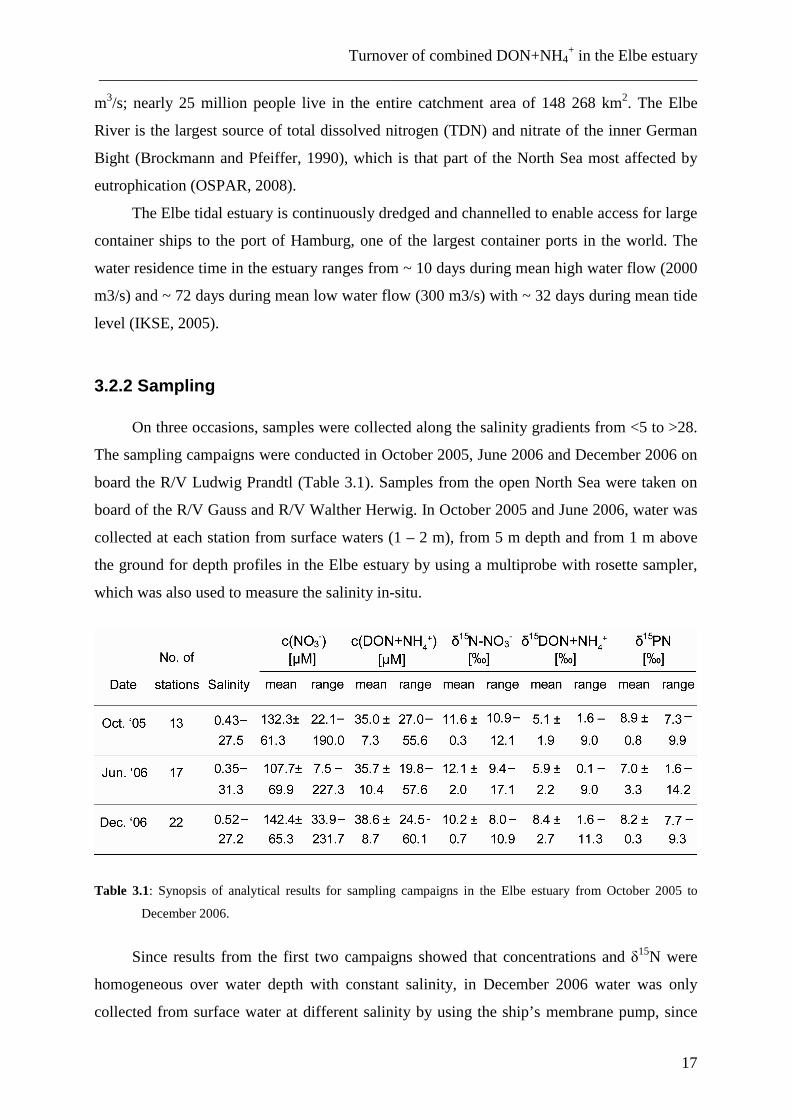
Table 3.1: Synopsis of analytical results for sampling campaigns in the Elbe estuary from October 2005 to
December 2006.
Since results from the first two campaigns showed that concentrations and δ15N were
homogeneous over water depth with constant salinity, in December 2006 water was only
collected from surface water at different salinity by using the ship’s membrane pump, since
Chapter 3 ___________________________________________________________________________
18
salinity well reflects the degree of mixing between marine and riverine water. Water samples
(200 - 1000 ml, volumes depending on suspended particulate matter concentrations; SPM)
were immediately filtered through precombusted GF/F filters (4.6 cm diameter, at constant
vacuum) and stored in PE bottles that had been soaked in acid (10% HCl) overnight and
rinsed with deionised water (DIW). Each bottle was rinsed with sample water before being
filled. Water samples and filters were frozen on board at -18°C until analysis. Before
analyses, filters were dried at 40-50°C and stored at 4°C.
3.2.3 Analytical Methods
Glassware was washed with deionised water (DIW), soaked in soap and 10% HCl baths,
and washed again with DIW after each single step. All non-volumetric glassware was
combusted at 450°C for at least 4 hours. Volumetric glassware and PE-bottles were washed
with DIW, soaked in a 10% HCl bath overnight, washed again with DIW, and dried at 50°C.
Concentration of total dissolved nitrogen (TDN) in DIW was determined using the
“persulfate oxidation method” (Knapp et al., 2005; Koroleff, 1976; Solórzano and Sharp,
1980) (see below) and yielded concentrations of < 1µM.
3.2.3.1 Nitrate and Nitrite concentrations
Concentrations of nitrate and nitrite were determined with an AutoAnalyzer3
(Bran+Luebbe, Hamburg) using standard colorimetric techniques (Grasshoff et al., 1999).
Measurements showed that nitrite concentrations could be neglected as they contributed less
than 1% to the total NOx pool. For our setup, the detection limit for the combined
determination of nitrate and nitrite is 0.05 µM.
3.2.3.2 Isotopic composition of nitrate
Nitrate δ15N (δ15N-NO3-) was analysed by the “denitrifier method” (Casciotti et al.,
2002; Sigman et al., 2001). Nitrate was quantitatively reduced to nitrous oxide (N2O) by using
a strain of denitrifier bacteria that lacks N2O reductase activity. N2O was automatically
extracted, purified in a Gasbench II (ThermoFinnigan) and analysed by a Finnigan Delta plus
XP mass spectrometer. The analysis of the samples were referenced to injections of N2O from
a pure N2O gas cylinder and then standardised using an internationally accepted nitrate
Turnover of combined DON+NH4+ in the Elbe estuary
___________________________________________________________________________
19
isotopic reference material (IAEA-N3, δ15N = 4.7‰). We also used an in-house potassium
nitrate standard for further validation of our results, which we measured with each batch of
samples. The standard deviation for replicate analyses (n = 4) was ± 0.2‰ at the high DON
concentrations found here.
3.2.3.3 DON+NH4+ concentration
Since we were not able to separate DON and ammonium for individual isotopic
compositions, we determined a combined signal of δ15DON and δ15NH4
+ (δ15DON+NH4+),
and also measured the concentration as a combined value. To determine the DON+NH4+
concentration and δ15DON+NH4+ we used a published method (Knapp et al., 2005), with
small modifications. The first step is the oxidation of total dissolved nitrogen (TDN, the sum
of nitrate, nitrite, ammonium and DON) to nitrate using the persulfate oxidation method
(Knapp et al., 2005; Koroleff, 1976; Solórzano and Sharp, 1980).
For the oxidation of TDN to nitrate, 20 ml of the sample was added to a Teflon bottle,
to which 5 ml of a persulfate oxidising reagent (POR) is added. The POR was made up daily
with 3.75 g certified ACS-grade sodium hydroxide (NaOH) dissolved in 250 ml of deionised
water, followed by 7.5 g certified ACS-grade boric acid (H3BO3) and 12.5 g certified ACS-
grade potassium persulfate, which was recrystallised three times (Grasshoff et al., 1999).
After adding the POR to the sample, Teflon caps were closed tightly and the Teflon bottles
were placed in a digestion rotor for microwave digestion. The samples were treated for 13
min in a MLS 1200 Mega digestion microwave oven following an application for acid
digestion. To determine the reagent blank, each batch of samples included one Teflon bottle
filled with only 5 ml POR. After digestion this bottle was filled with 20 ml deionised water.
Concentration and δ15N of the POR sample was treated as the reagent blank for the water
samples of the same batch. The reagent blank was always <2 µM.
DON+NH4+ concentrations were calculated by subtracting the concentrations of nitrate
and nitrite from analysed nitrate concentration of persulfate digested samples. Reagent blanks
were also subtracted and dilution steps considered by corrections.
To evaluate the yield of this procedure, we experimented with several standard
materials. Table 3.2 lists common DON standards (glycine, alanine, urea, 6-amino caproic
acid (ACA), EDTA and 4-aminoantipyrine (AAP) and the degree of completeness of
oxidation to nitrate using our digestion procedure. For comparison, other published values are
also listed (Bronk et al., 2000; Knapp et al., 2005).
Chapter 3 ___________________________________________________________________________
20
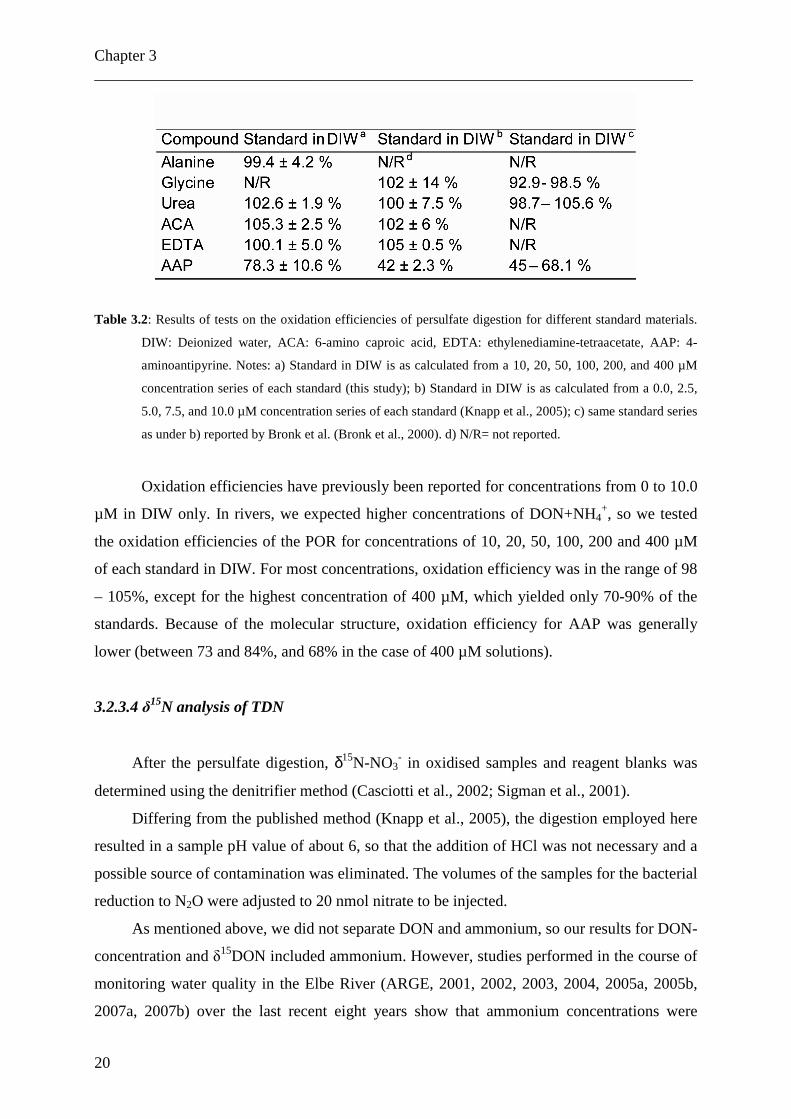
Table 3.2: Results of tests on the oxidation efficiencies of persulfate digestion for different standard materials.
DIW: Deionized water, ACA: 6-amino caproic acid, EDTA: ethylenediamine-tetraacetate, AAP: 4-
aminoantipyrine. Notes: a) Standard in DIW is as calculated from a 10, 20, 50, 100, 200, and 400 µM
concentration series of each standard (this study); b) Standard in DIW is as calculated from a 0.0, 2.5,
5.0, 7.5, and 10.0 µM concentration series of each standard (Knapp et al., 2005); c) same standard series
as under b) reported by Bronk et al. (Bronk et al., 2000). d) N/R= not reported.
Oxidation efficiencies have previously been reported for concentrations from 0 to 10.0
µM in DIW only. In rivers, we expected higher concentrations of DON+NH4+, so we tested
the oxidation efficiencies of the POR for concentrations of 10, 20, 50, 100, 200 and 400 µM
of each standard in DIW. For most concentrations, oxidation efficiency was in the range of 98
– 105%, except for the highest concentration of 400 µM, which yielded only 70-90% of the
standards. Because of the molecular structure, oxidation efficiency for AAP was generally
lower (between 73 and 84%, and 68% in the case of 400 µM solutions).
3.2.3.4 δ15N analysis of TDN
After the persulfate digestion, δ15N-NO3- in oxidised samples and reagent blanks was
determined using the denitrifier method (Casciotti et al., 2002; Sigman et al., 2001).
Differing from the published method (Knapp et al., 2005), the digestion employed here
resulted in a sample pH value of about 6, so that the addition of HCl was not necessary and a
possible source of contamination was eliminated. The volumes of the samples for the bacterial
reduction to N2O were adjusted to 20 nmol nitrate to be injected.
As mentioned above, we did not separate DON and ammonium, so our results for DON-
concentration and δ15DON included ammonium. However, studies performed in the course of
monitoring water quality in the Elbe River (ARGE, 2001, 2002, 2003, 2004, 2005a, 2005b,
2007a, 2007b) over the last recent eight years show that ammonium concentrations were
Turnover of combined DON+NH4+ in the Elbe estuary
___________________________________________________________________________
21
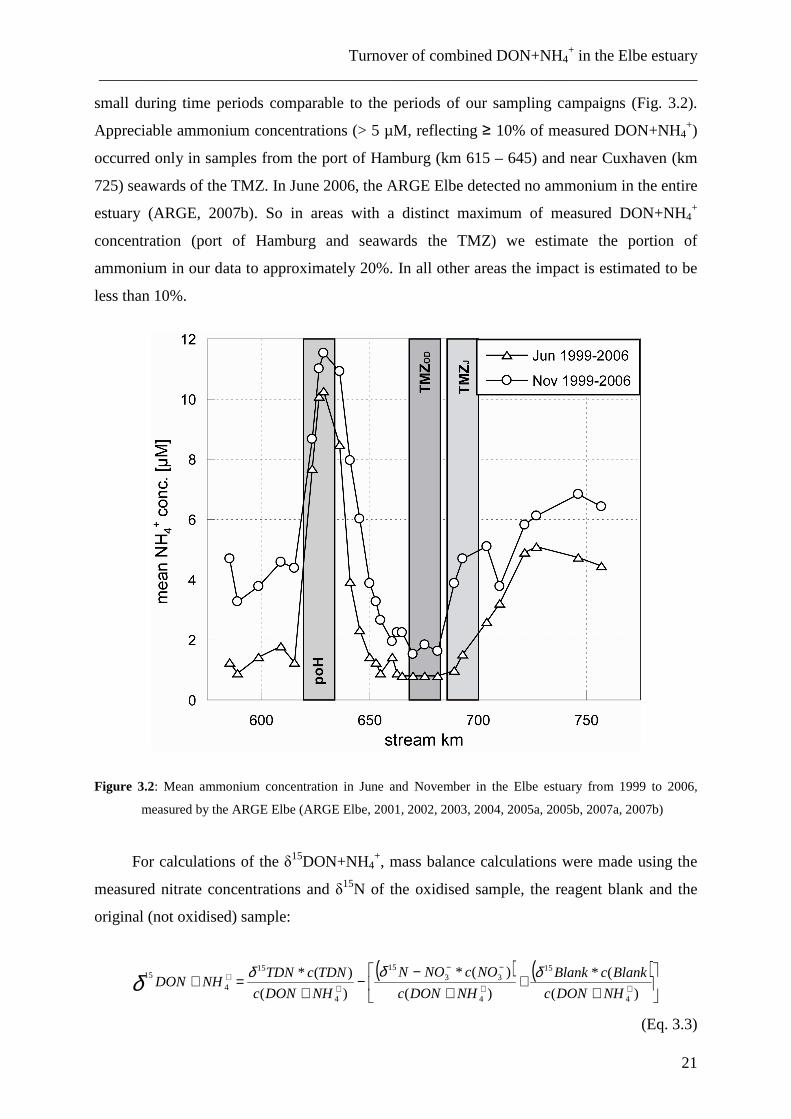
small during time periods comparable to the periods of our sampling campaigns (Fig. 3.2).
Appreciable ammonium concentrations (> 5 µM, reflecting ≥ 10% of measured DON+NH4+)
occurred only in samples from the port of Hamburg (km 615 – 645) and near Cuxhaven (km
725) seawards of the TMZ. In June 2006, the ARGE Elbe detected no ammonium in the entire
estuary (ARGE, 2007b). So in areas with a distinct maximum of measured DON+NH4+
concentration (port of Hamburg and seawards the TMZ) we estimate the portion of
ammonium in our data to approximately 20%. In all other areas the impact is estimated to be
less than 10%.
Figure 3.2: Mean ammonium concentration in June and November in the Elbe estuary from 1999 to 2006,
measured by the ARGE Elbe (ARGE Elbe, 2001, 2002, 2003, 2004, 2005a, 2005b, 2007a, 2007b)
For calculations of the δ15DON+NH4+, mass balance calculations were made using the
measured nitrate concentrations and δ15N of the oxidised sample, the reagent blank and the
original (not oxidised) sample:
( ) ( )
++
+−
−+
=+ ++
−−
++
)(
(*
)(
)(*
)(
)(*
4
15
4
3315
4
15
4
15
NHDONc
BlankcBlank
NHDONc
NOcNON
NHDONc
TDNcTDNNHDON
δδδδ
(Eq. 3.3)
Chapter 3 ___________________________________________________________________________
22
We tested the combination of persulfate digestion and denitrifier method to measure
δ15DON+NH4
+ by parallel analyses of urea standard solutions of different concentrations. The
δ15N of solid urea was measured by using a Flash EA 1112 elemental analyzer combined with
a Finnigan Delta plus XP mass spectrometer, yielding a δ15N value of 0.5‰ ± 0.2‰.
Measurements of the urea solutions after preparation as described above yielded in δ15N
values of 0.4 ± 0.2‰ (n = 21) after blank correction.
Repeated measurements of replicate water samples demonstrated the reproducibility of
our method for δ15DON+NH4+ analyses. The mean measured standard deviation of δ
15TDN
and δ15N-NO3- was 0.3‰ (3 to 4 repetitions). The mean standard deviation for TDN and
nitrate concentration was 1 µM. Because of error propagation, the calculated standard
deviation of δ15DON+NH4+ ranged from 0.3 to 2.0‰ with a mean value of 0.9‰, and the
calculated mean standard deviation for DON+NH4+ concentration was 1.7 µM.
3.2.3.5 Particulate nitrogen (PN)
δ15PN was analysed with a Flash EA 1112 elemental analyzer coupled to a Finnigan
Delta plus XP mass spectrometer. Analysed samples were standardised using the isotopic
reference materials “High organic sediment standard OAS” (Cat.no. B2151, Batch no. 2824,
δ15N = +4.4‰ ± 0.19‰), “Low Organic Content Soil Standard OAS” (Cat.no. B2153, Batch
no. 2822, δ15N = + 6.7‰ ± 0.15‰) and IAEA-N1 (δ15N = + 0.4‰). The standard deviation
for replicate analysis was 0.2‰ (n=3).
3.3 Results
The analytical results on samples of all three cruises are plotted in Figs. 3.3 to 3.10. Because
of poor weather conditions in October 2005 and December 2006, samples were taken only up
to a salinity of 28 at the Elbe mouth near Cuxhaven. In June 2006, samples were taken also in
the river plume in the German Bight up to a salinity of 32, representing typical German Bight
coastal water.
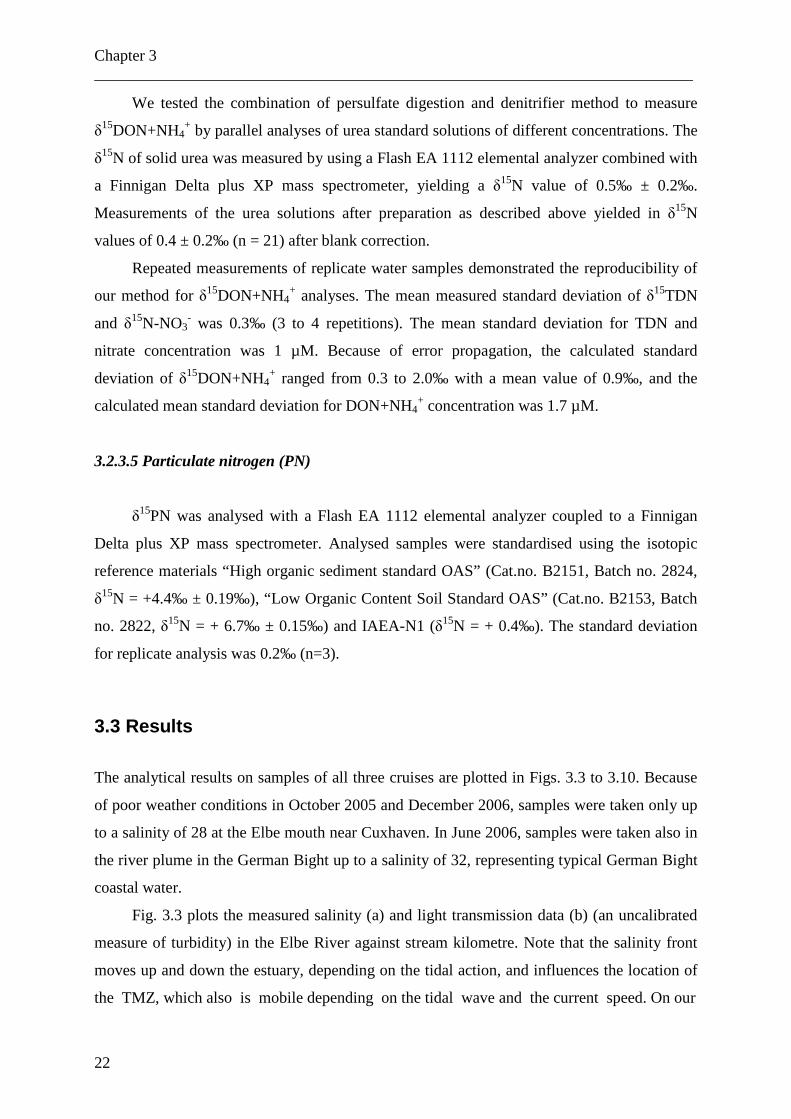
Fig. 3.3 plots the measured salinity (a) and light transmission data (b) (an uncalibrated
measure of turbidity) in the Elbe River against stream kilometre. Note that the salinity front
moves up and down the estuary, depending on the tidal action, and influences the location of
the TMZ, which also is mobile depending on the tidal wave and the current speed. On our
Turnover of combined DON+NH4+ in the Elbe estuary
___________________________________________________________________________
23
Figure 3.3: Salinity (a) and transmission (b) data in the Elbe estuary against stream kilometre. Indicated are the
Port of Hamburg (poH), and the location of the turbidity maximum zone in October 2005 and December
2006 (TMZOD) and in June 2006 (TMZJ). Lines in this and the following figures are best-fit curves using
the locally weighted Least Squared error method.
Chapter 3 ___________________________________________________________________________
24
sampling campaigns, the salinity front was always located near the town of Glückstadt
(~stream km 675), moving slightly downstream only in June 2006. During all sampling
campaigns, the turbidity maximum was situated between stream km 670 and 700,
corresponding to the salinity range from 0.5 to 2 (Fig. 3.3b).
Depth profiles at single stations taken during the campaigns in October 2005 and June
2006 showed no significant changes in the δ15N values of nitrate, TDN, and DON+NH4
+
when salinity profiles were homogeneous. Differences were small and in the range of
measurement uncertainty. Only when salinity changed with depth due to the mixing of denser
marine water from the German Bight near the bottom with buoyant river water in the brackish
water zone (Bergemann, 1995) δ15N of at least one of the analysed parameters (NO3-,
DON+NH4+) was observed to change.
3.3.1 DON+NH4+ concentrations
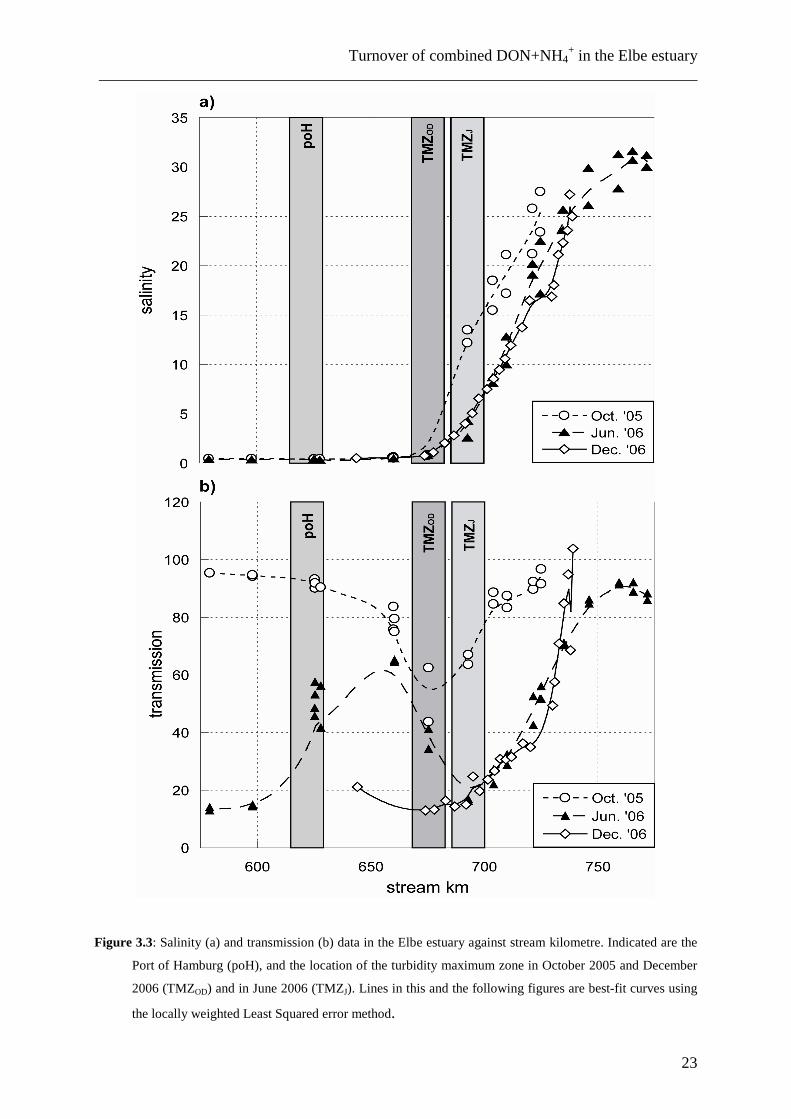
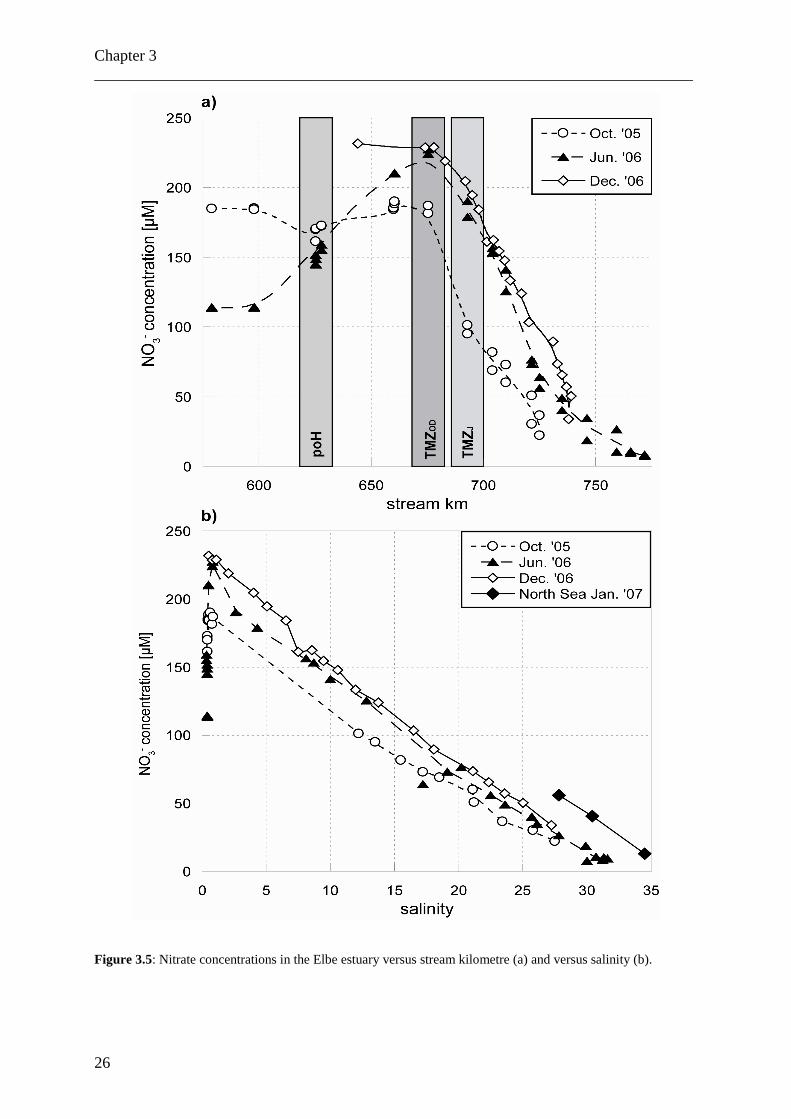
Concentrations of DON+NH4+ varied between 20 and 60 µM, with no significant
seasonal differences (Fig. 3.4). Unlike nitrate (Fig. 3.5), the DON+NH4+ concentration
differences between freshwater and saltwater end members are small, and the salinity vs.
DON+NH4+ plot gives no indication of conservative mixing for DON+NH4
+ in the entire Elbe
estuary from Geesthacht to the German Bight. Only at salinities higher than 10, DON mixed
nearly conservatively with German Bight water, but the slope of the mixing trend is much less
linear than that of nitrate concentrations (compare Figs. 3.4-3.7). We found maximum
DON+NH4+ concentrations in the port of Hamburg (35-58 µM at salinities < 1; km 615 to
635) and at salinities >7 seaward of the TMZ (40-50 µM in December and October, 30 µM in
June). In the TMZ between stream km 650 and 700, DON+NH4+ concentrations fluctuated
around 30 µM.
Upstream of Hamburg, DON+NH4+ concentrations ranged between 30 and 35 µM and
corresponded to the river concentration determined landward of the weir at Geesthacht
(Schlarbaum, unpublished data). Concentrations in the German Bight waters at salinities >32
were higher in winter (18.3 µM) than in summer (6.4 µM).
On average, estuarine DON+NH4+ concentrations in winter (38.6 ± 8.7 µM) were
slightly higher than in summer or autumn (35.7 ± 10.4 µM and 35.0 ± 7.3 µM, respectively).
Turnover of combined DON+NH4+ in the Elbe estuary
___________________________________________________________________________
25
Figure 3.4: DON+NH4+ (black symbols) and ammonium (grey symbols) concentrations in the Elbe estuary
versus stream kilometre (a) and versus salinity (b).
Chapter 3 ___________________________________________________________________________
26
Figure 3.5: Nitrate concentrations in the Elbe estuary versus stream kilometre (a) and versus salinity (b).
Turnover of combined DON+NH4+ in the Elbe estuary
___________________________________________________________________________
27
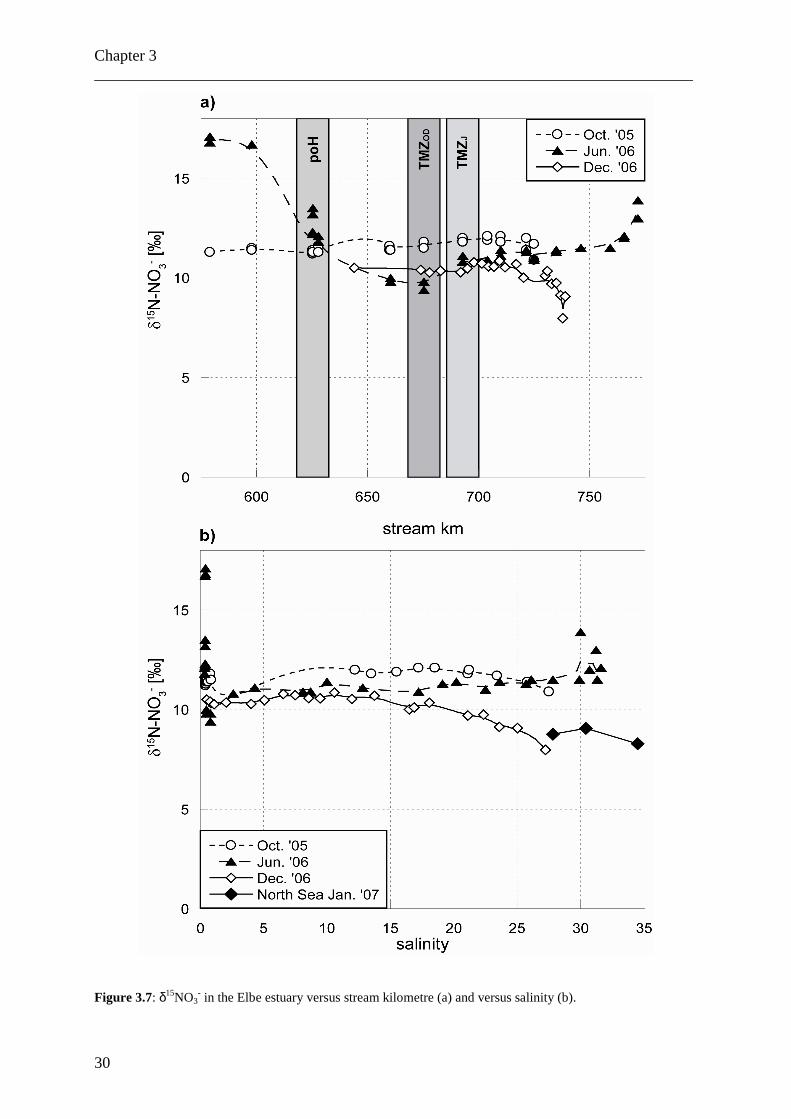
3.3.2 Isotopic composition of DON+NH4+
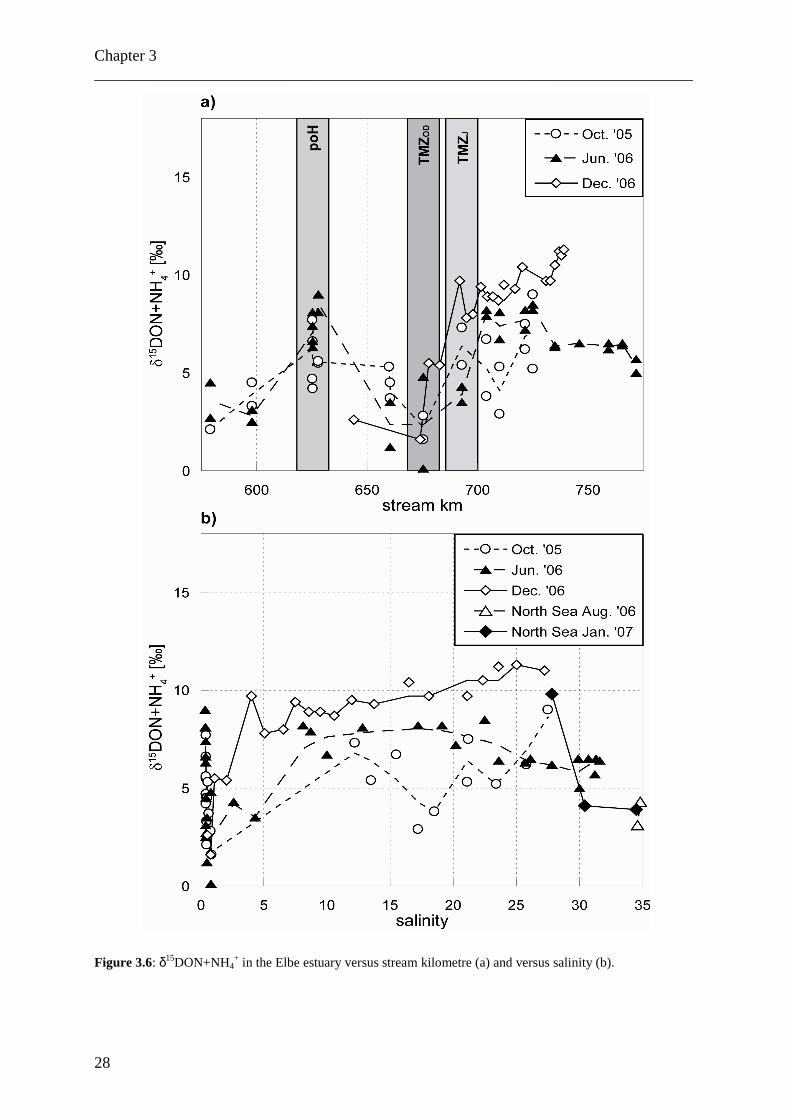
The δ15DON+NH4+ ranged from 0.1‰ to 11.3‰ (Fig. 3.6) and seasonal variations were
subtle. The data also suggest that both DON+NH4+ production and consumption occurred in
the estuary. The river end member δ15DON+NH4
+ ranged from 2 to 5‰, samples from the
North Sea taken at salinities >30 had uniform δ15DON+NH4
+ values in summer and winter
situations (range 3 - 4.5‰).
In a statistical evaluation of the entire data set (all data pooled), we sought for
correlations amongst parameters (see also Table 3.3 for an analysis of data for each season
separately). The δ15N of DIN does not appear to significantly covary with δ15DON+NH4+
(Fig. 3.9), but a weak positive (0.44, n=78) correlation exists between DON+NH4+
concentrations and δ15DON+NH4+ on the one hand, and δ15DON+NH4
+ is negatively
correlated with both PN concentrations (-0.47; n=53) and the δ15PN (-0.52; n=49) on the other
hand; all these are significant on the 0.01 level.
Table 3.3: Correlation coefficients (r) of variables in the salinity gradient >0.8 and for all stations sampled.
Significant values (α = 0.05) are printed in bold numbers.
Chapter 3 ___________________________________________________________________________
28
Figure 3.6: δ15DON+NH4
+ in the Elbe estuary versus stream kilometre (a) and versus salinity (b).
Turnover of combined DON+NH4+ in the Elbe estuary
___________________________________________________________________________
29
3.3.3 Seasonal patterns
In December 2006, δ15DON+NH4+ in the Elbe estuary was significantly enriched (about
2-5‰) over summer or autumn values (Fig. 3.6). This may due to the fact, that ammonium
concentrations were slightly higher in winter than in summer. In comparison to river waters
over the whole salinity gradient, DON+NH4+ in samples from the North Sea was more
depleted in 15N (3 – 4‰ compared to 3 – 9‰ in October 2005, 4 – 8‰ in June 2006 and 5 –
11% in December 2006, respectively), but in the same range as in samples from the river
water end member at the weir of Geesthacht at stream kilometre 585 (2‰ in October 2005,
2.5 – 3‰ in June 2006). In June 2006, δ15DON+NH4
+ was constant between 7 and 8‰ in the
salinity interval from 7 to 22. At higher salinity (23 – 30) δ15DON+NH4+ was between 6 and
7‰, at lower salinity (1 – 5), δ15DON+NH4+ was 3 – 4‰. In the port of Hamburg (salinity
~0.5), local sources of DON and/or ammonium resulted in elevated δ15N values between 6
and 9‰. Most depleted isotopic values for DON+NH4+ characterized the TMZ during all
seasons, which is also coupled to a pronounced drop in DON+NH4+ concentration (Figs. 3.5
and 3.6).
In the salinity range between 5 and 23, no clear deviation from conservative mixing
could be seen for the samples of June and December 2006. In the samples of October 2005 a
large scatter with no clear trend was found. Lowest mean δ15DON+NH4+ values were
measured in October 2005, highest values occurred in December 2006; in all three seasons
(June 2006 was intermediate) we see a tendency to increasing δ15DON+NH4+ with increasing
salinity. In June 2006 we found a minimum in δ15DON+NH4
+ at salinity > 23, approaching
the values measured in offshore waters with values below 5‰ (Fig. 3.6).
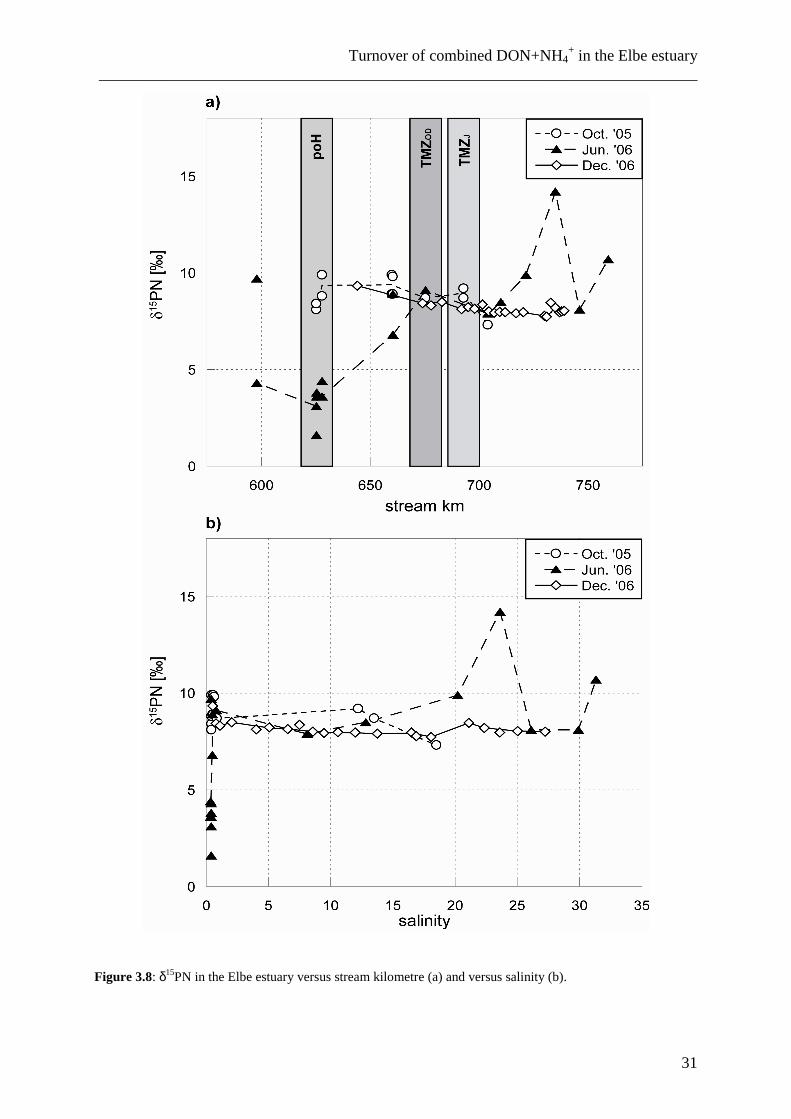
3.3.4 δ15N of particulate nitrogen
The isotopic composition of particulate nitrogen was remarkably uniform and nearly
constant throughout the entire river in both October 2005 and December 2006 (range of δ15PN
from 7 to 10‰; Fig. 3.8). The largest range in δ15PN was observed in samples from the June
2006 expedition: In the salinity interval from 1 to 15, δ15PN was ~ 8 to 9‰, whereas at higher
salinities, δ15PN values ranged between 8 and 14‰. Values < 5‰ were measured in samples
taken in the port of Hamburg, but adjacent samples upstream and downstream of the harbour
Chapter 3 ___________________________________________________________________________
30
Figure 3.7: δ15NO3
- in the Elbe estuary versus stream kilometre (a) and versus salinity (b).
Turnover of combined DON+NH4+ in the Elbe estuary
___________________________________________________________________________
31
Figure 3.8: δ15PN in the Elbe estuary versus stream kilometre (a) and versus salinity (b).
Chapter 3 ___________________________________________________________________________
32
had δ15PN between 9 and 10‰. We thus assume that PN here is influenced by local
sedimentation and resuspension, or assimilation of different N sources during the summer
season. It is likely that a large sewage treatment plant in the port of Hamburg has an effect
and may also affect N species differently at different seasons due to different concentrations
and different isotopic compositions of the sewage-derived nitrogen forms.
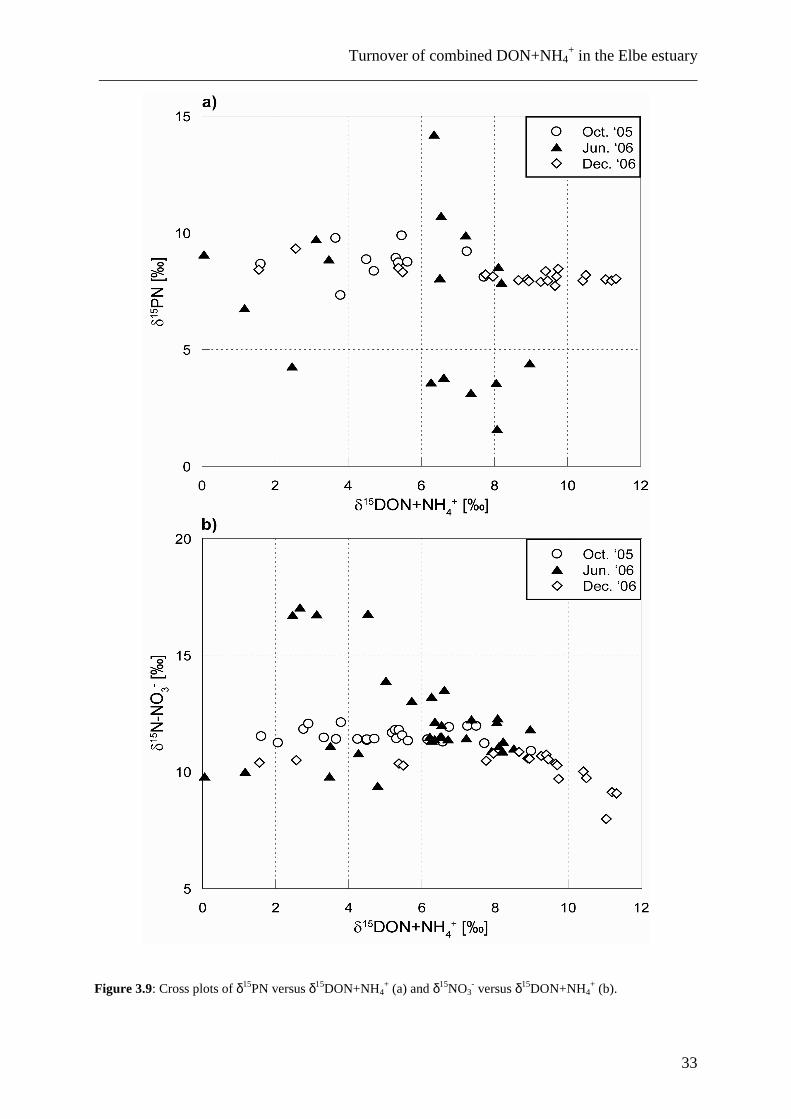
Besides the lack of seasonal variability, there also is a lack of correlation between the
isotopic composition of DIN, DON+NH4+ and PN. As shown in Table 3.3 and Fig. 3.9, the
correlation coefficients for the data of δ15DON+NH4+ and δ15PN indicate a significant
(α=0.05) negative correlation for the winter situation, and no correlation during the other
seasons. The significant negative correlation in winter may be due to the fact that all samples
at that time were taken in the brackish water interval, in which DON+NH4+ and PN are more
or less conservatively mixed (at salinities > 10, which accounts for approximately half of the
samples from December 2006). An important reason for the lack of correlation between PN
and DON+NH4+ may be that throughout the estuary, different processes contribute as sources
or sinks to either of these pools, so that samples from the port of Hamburg have a completely
different composition than those from the TMZ.
3.3.5 NO3-/DON+NH4
+ratios
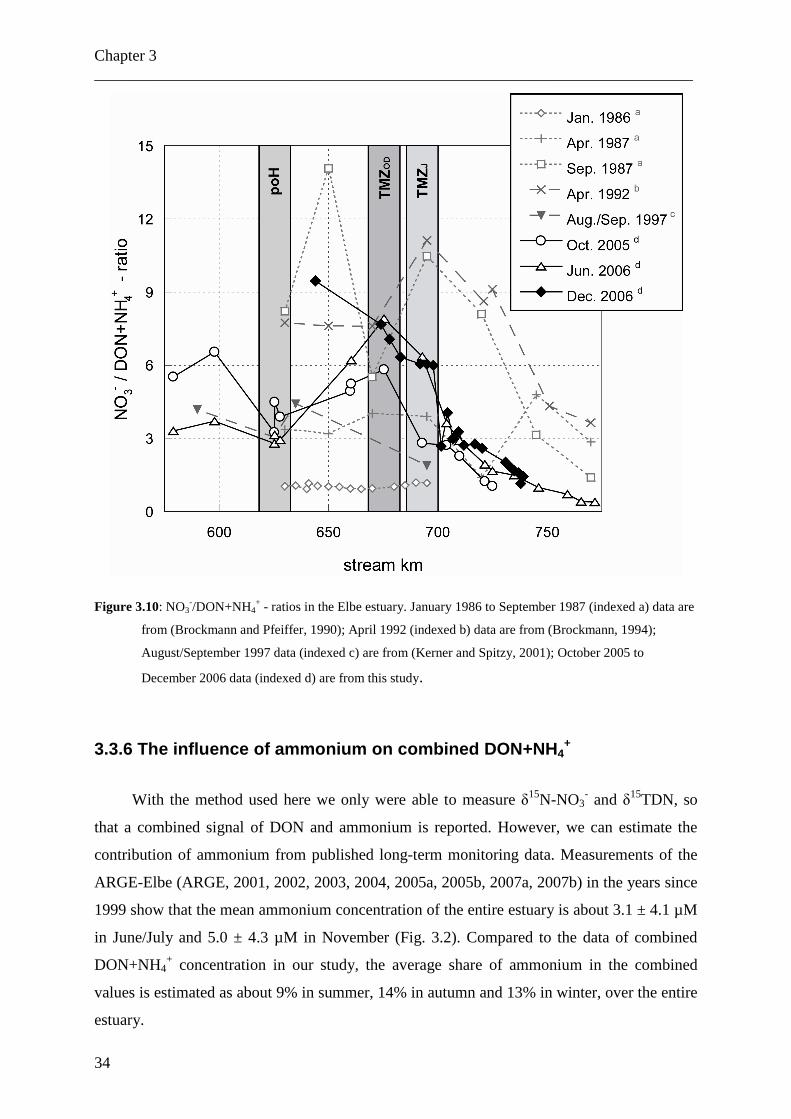
In Fig. 3.10, the ratios of nitrate to DON+NH4+ of our cruises and those of earlier
studies of the Elbe estuary are presented. In October 2005, the ratios varied between 3.2 and
6.6 in the low salinity part of the Elbe estuary, with a minimum of 3.2 in the port of Hamburg.
With increasing salinity, the ratio decreased to 1.0. In summer 2006 the ratio ranged between
2.8 and 3.7 in the low salinity areas of the Elbe estuary, but with only a slight minimum in the
port of Hamburg. In contrast to the data from October 2005, the ratio increased rapidly in the
TMZ to 7.9, before decreasing to 0.4 in high salinity waters of the German Bight. Highest
ratios of 9.5 were determined in December 2006 at a salinity of 0.52, the ratio then decreased
with increasing salinity to 1.4. Overall, the ratios range from < 1 to almost 10.
Studies from the 1980’s and 1990’s (Brockmann and Pfeiffer, 1990; Brockmann, 1994;
Kerner and Spitzy, 2001) showed comparable ratios (Fig. 3.10). Only in January 1986
Brockmann and Pfeiffer (1990) found very low ratios due to high ammonium concentrations.
In the same study the ratio did not decrease with increasing salinity in April 1987.
Turnover of combined DON+NH4+ in the Elbe estuary
___________________________________________________________________________
33
Figure 3.9: Cross plots of δ15PN versus δ15DON+NH4
+ (a) and δ15NO3- versus δ15DON+NH4
+ (b).
Chapter 3 ___________________________________________________________________________
34
Figure 3.10: NO3
-/DON+NH4+ - ratios in the Elbe estuary. January 1986 to September 1987 (indexed a) data are
from (Brockmann and Pfeiffer, 1990); April 1992 (indexed b) data are from (Brockmann, 1994);
August/September 1997 data (indexed c) are from (Kerner and Spitzy, 2001); October 2005 to
December 2006 data (indexed d) are from this study.
3.3.6 The influence of ammonium on combined DON+NH4+
With the method used here we only were able to measure δ15N-NO3- and δ15TDN, so
that a combined signal of DON and ammonium is reported. However, we can estimate the
contribution of ammonium from published long-term monitoring data. Measurements of the
ARGE-Elbe (ARGE, 2001, 2002, 2003, 2004, 2005a, 2005b, 2007a, 2007b) in the years since
1999 show that the mean ammonium concentration of the entire estuary is about 3.1 ± 4.1 µM
in June/July and 5.0 ± 4.3 µM in November (Fig. 3.2). Compared to the data of combined
DON+NH4+ concentration in our study, the average share of ammonium in the combined
values is estimated as about 9% in summer, 14% in autumn and 13% in winter, over the entire
estuary.
Turnover of combined DON+NH4+ in the Elbe estuary
___________________________________________________________________________
35
Ammonium concentrations in the Elbe estuary show the same characteristics as the
combined DON+NH4+ concentrations (Figs. 3.2 and 3.4a), but the increase of ammonium
concentration does not account for the increase of the combined DON+NH4+ signal in the port
of Hamburg and downstream of the TMZ.
In the port of Hamburg the mean annual ammonium concentration increases to a
maximum of 10.3 ± 4.9 µM in June/July and 11.5 ± 3.1 µM in November, which corresponds
to an ammonium fraction of 11% in summer and 18% in autumn. In winter we did not
measure near the city of Hamburg due to poor weather conditions.
Downstream of the TMZ the mean ammonium concentration has a maximum of 5.1 ±
3.7 µM in June/July and 6.8 ± 3.8 µM in November, representing ammonium contributions of
13% in summer, 16% in autumn and 12% in winter in this area of the Elbe estuary.
3.4 Discussion
Our objectives for this study were to see if DON+NH4+ concentrations have changed
over the past decades and to evaluate if DON+NH4+ is either conservatively mixed, or
affected by non-conservative processes. We also wished to identify distinct sources or sinks
for DON+NH4+ in the Elbe estuary, and whether seasonal differences in DON+NH4
+ load and
cycling are evident.
3.4.1 The influence of ammonium on combined DON+NH4+
For a rough estimate of the likely influence of δ15NH4
+ on the combined δ15DON+NH4+
signal, we turn to data of δ15NH4+ generated by other authors.
Ahad et al. (2006) measured δ15NH4+ in the Tyne and the Tweed estuaries in
northeastern England. Even if these estuaries are much smaller than the Elbe estuary, the
climatic conditions and catchment characteristics are similar and especially the data of the
Tyne estuary should represent the conditions in the Elbe estuary.
In the Tyne estuary, Ahad et al. (2006) measured δ15NH4
+ signatures from 7.9 to 11.3‰
in summer and 7.3 to 10.4‰ in winter with an average of 10.2 ± 0.9‰ and 9.6 ± 1.7‰ during
summer and winter, respectively. In the Tweed estuary, δ15NH4+ values also were slightly
Chapter 3 ___________________________________________________________________________
36
lower in winter (5.3 to 7.3‰) than in summer (7.8 to 10.1‰), with averages of 6.9 ± 0.6‰ in
winter and 9.5 ± 0.7‰ in summer.
Middelburg and Nieuwenhuize (2001) measured δ15NH4
+ in two other European
estuaries: the Loire estuary in France and the Thames estuary in England. δ15NH4+ values
ranged from -4 to 17‰ in the Loire and from 14 to 43‰ in the river Thames. Mariotti et al.
(1984) studied the isotopic composition of ammonium and nitrate in the Scheldt estuary in
Belgium and the Netherlands and found δ15NH4
+ values of 10 to 29‰. In both the Scheldt
estuary and the Thames estuary there were mid-estuarine maxima of δ15NH4+, which
coincided with a decrease in δ15NO3-. This combination was interpreted to be due to
nitrification (Mariotti et al.,1984; Middelburg and Nieuwenhuize, 2001). The low range of
δ15NH4
+ in the Loire estuary was explained by a lack of external ammonium supply.
If we take the mean ammonium concentration in the Elbe estuary measured by the
ARGE Elbe over the last eight years (ARGE, 2001, 2002, 2003, 2004, 2005a, 2005b, 2007a,
2007b) and the average δ15NH4+ values from the Tyne and the Tweed estuary (Ahad et al.,
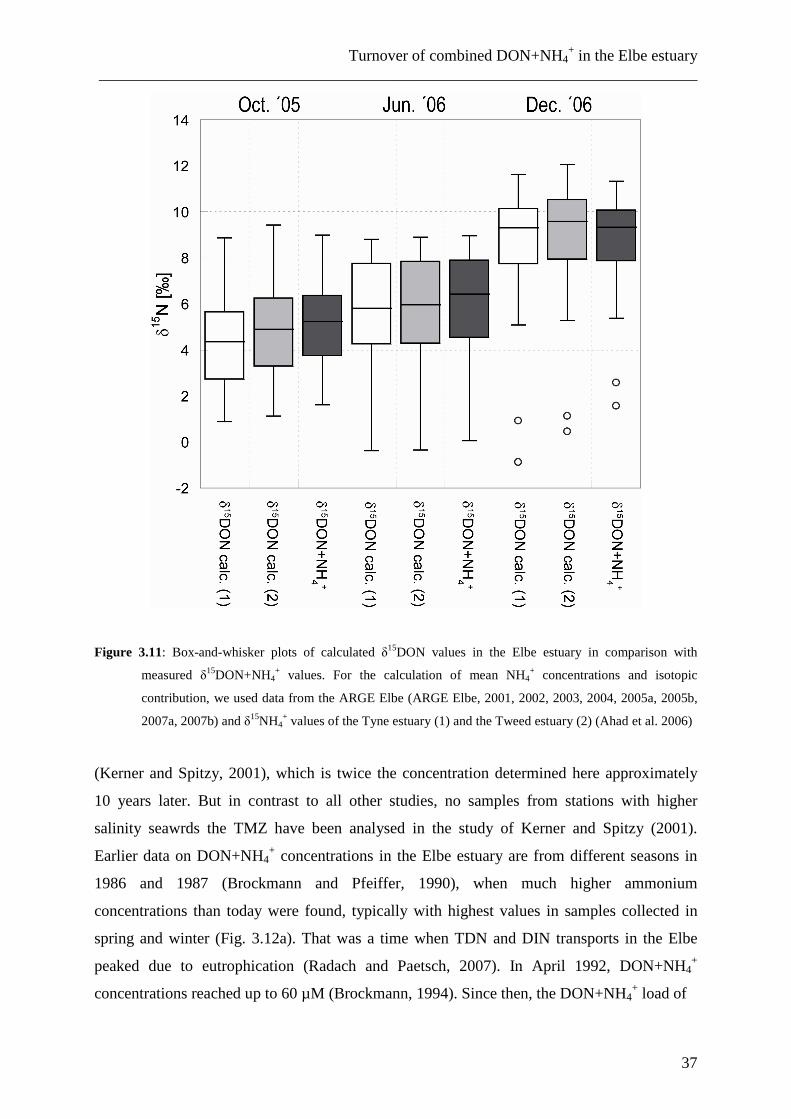
2006) for a rough calculation of δ15DON in the Elbe estuary, we see a decreased signal
compared to the combined δ15DON+NH4+ (Fig. 3.11), but the decrease of 0.36 ± 0.29‰ in
summer and 0.21 ± 0.79‰ in winter for the δ15NH4
+ data of the Tyne estuary is smaller than
the standard deviation calculated by error propagation of 0.9‰ (see Section 3.2.3.4). For the
δ15NH4
+ data of the Tweed estuary, the values are even smaller, with a decrease of 0.27 ±
0.26‰ in summer and an increase of 0.15 ± 0.61‰ in winter.
Even if this is only a rough estimation, the influence of ammonium on the combined
δ15DON+NH4
+ in the Elbe estuary is likely small and lies in the range of the standard
deviation of the used method.
3.4.2 Long-term changes in DON loads and ratios
How do combined DON+NH4+ concentrations in 2005/2006 compare to data available
from previous studies of DON in the Elbe estuary? Fig. 3.12a presents the combined DON
and ammonium concentrations measured in the Elbe estuary between Hamburg and the
German Bight in different studies over the last 20 years; Fig. 3.12b plots the mean DON and
the mean ammonium concentration in the same studies. DON+NH4+ concentrations were
between 50 µM and almost 90 µM in samples collected in summer and autumn of 1997
Turnover of combined DON+NH4+ in the Elbe estuary
___________________________________________________________________________
37
Figure 3.11: Box-and-whisker plots of calculated δ15DON values in the Elbe estuary in comparison with
measured δ15DON+NH4+ values. For the calculation of mean NH4
+ concentrations and isotopic
contribution, we used data from the ARGE Elbe (ARGE Elbe, 2001, 2002, 2003, 2004, 2005a, 2005b,
2007a, 2007b) and δ15NH4+ values of the Tyne estuary (1) and the Tweed estuary (2) (Ahad et al. 2006)
(Kerner and Spitzy, 2001), which is twice the concentration determined here approximately
10 years later. But in contrast to all other studies, no samples from stations with higher
salinity seawrds the TMZ have been analysed in the study of Kerner and Spitzy (2001).
Earlier data on DON+NH4+ concentrations in the Elbe estuary are from different seasons in
1986 and 1987 (Brockmann and Pfeiffer, 1990), when much higher ammonium
concentrations than today were found, typically with highest values in samples collected in
spring and winter (Fig. 3.12a). That was a time when TDN and DIN transports in the Elbe
peaked due to eutrophication (Radach and Paetsch, 2007). In April 1992, DON+NH4+
concentrations reached up to 60 µM (Brockmann, 1994). Since then, the DON+NH4+ load of
Chapter 3 ___________________________________________________________________________
38
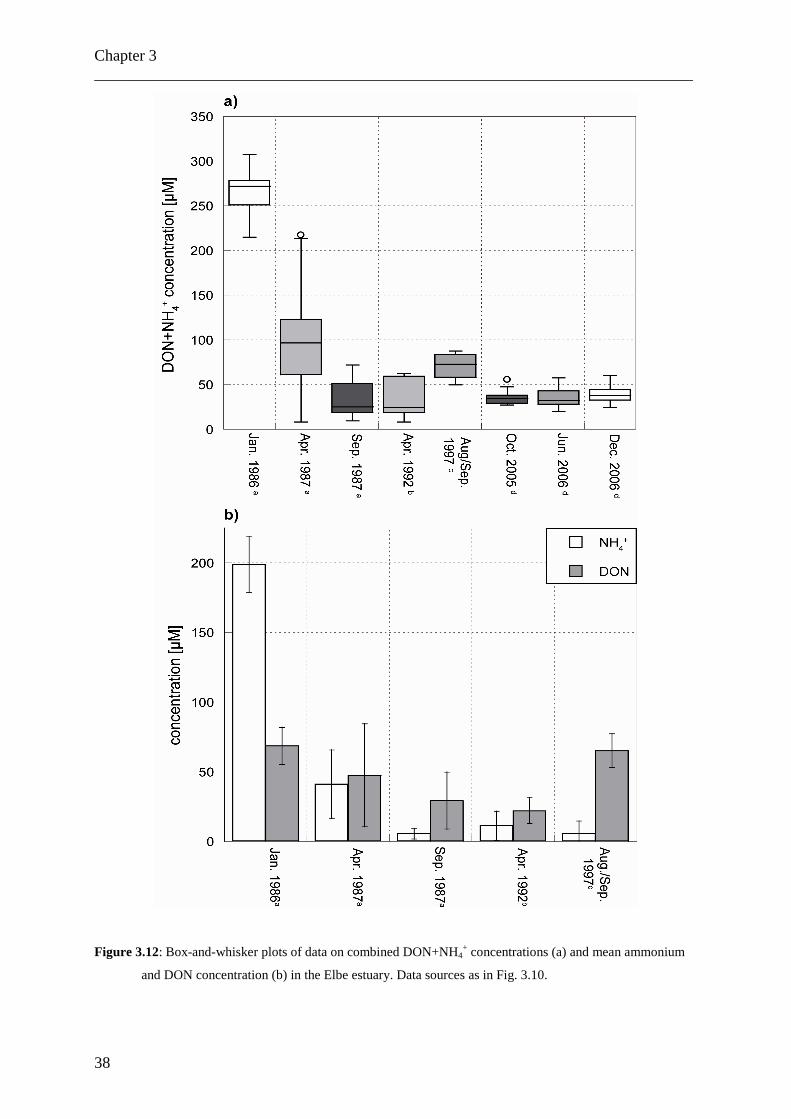
Figure 3.12: Box-and-whisker plots of data on combined DON+NH4+ concentrations (a) and mean ammonium
and DON concentration (b) in the Elbe estuary. Data sources as in Fig. 3.10.
Turnover of combined DON+NH4+ in the Elbe estuary
___________________________________________________________________________
39
the Elbe apparently has not changed systematically, but overall DON+NH4+ loads have
decreased from > 250 µM to < 50 µM in the period from 1986 to 1992. This decrease is due
to decreased ammonium concentrations, because a comparison of the pure DON
concentrations from these studies shows no systematic change in DON concentrations over
the last twenty years (Fig. 3.12b). The decrease in combined DON and ammonium
concentration also coincides with an intermittent, but significant decrease in TDN loads of the
Elbe, accompanied by an even more drastic and lasting increase in dissolved N:P ratios
(Radach and Paetsch, 2007) around 1987 due to the ban of phosphates in detergents.
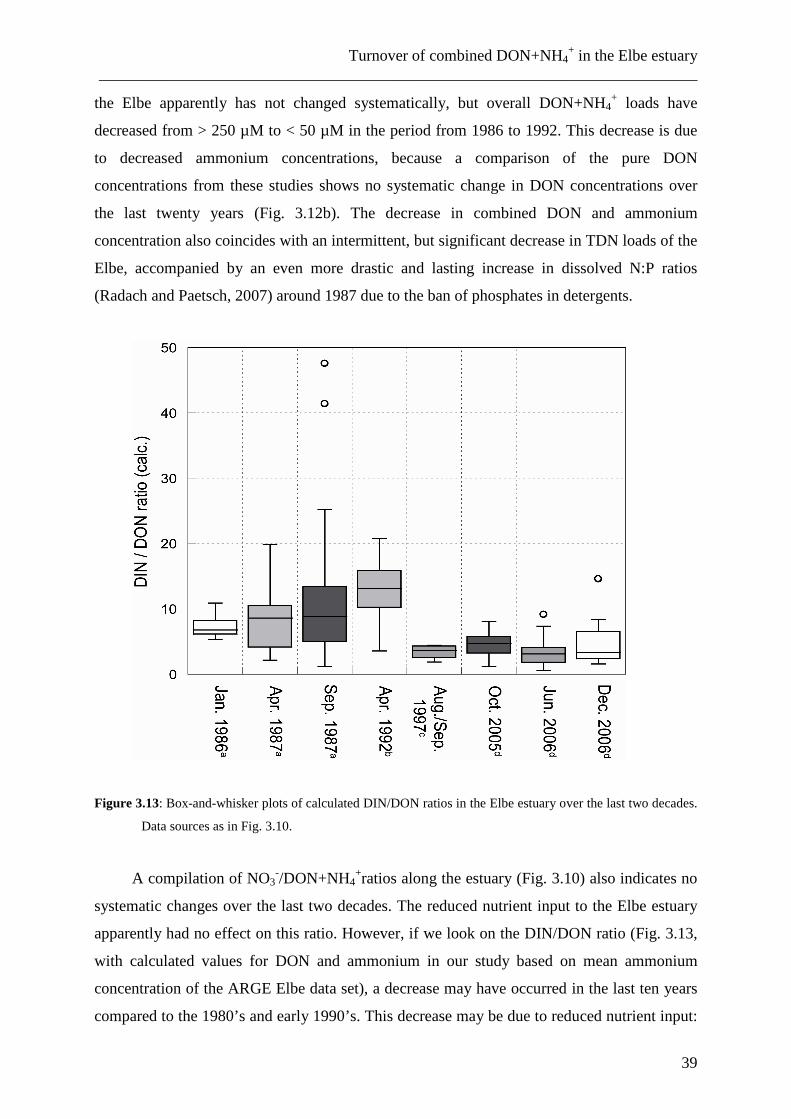
Figure 3.13: Box-and-whisker plots of calculated DIN/DON ratios in the Elbe estuary over the last two decades.
Data sources as in Fig. 3.10.
A compilation of NO3-/DON+NH4
+ratios along the estuary (Fig. 3.10) also indicates no
systematic changes over the last two decades. The reduced nutrient input to the Elbe estuary
apparently had no effect on this ratio. However, if we look on the DIN/DON ratio (Fig. 3.13,
with calculated values for DON and ammonium in our study based on mean ammonium
concentration of the ARGE Elbe data set), a decrease may have occurred in the last ten years
compared to the 1980’s and early 1990’s. This decrease may be due to reduced nutrient input:
Chapter 3 ___________________________________________________________________________
40
the ammonium concentrations in particular decreased from > 250 µM in winter months in the
early 1980’s to < 10 µM nowadays (ARGE, 2000). In contrast, DON concentration did not
exhibit any systematic changes over the same time period (Fig 3.12b).
In April 1992 DON was determined along the entire gradient of the Elbe estuary
(Brockmann, 1994): DON concentrations decreased, from 35 µM DON in the port of
Hamburg to less than 10 µM in the high salinity end-member of the German Bight. The
combined DON+NH4+ concentration decreased from 60 µM in the port of Hamburg to
approximately 12 µM in the German Bight. These concentrations are in the same range as
ours for the estuary, but lower for the saline water of the German Bight, which showed
seasonal variability in other studies (Brockmann et al., 1999). Both previous studies
(Brockmann, 1994; Brockmann and Pfeiffer, 1990) and ours found decreasing DON+NH4+
concentrations in the lower estuary due to dilution with marine water, consistent with
conservative mixing. As we will discuss below, however, the added information from
δ15DON+NH4
+ indicate a turnover of DON+NH4+ in the estuary.
3.4.3 Seasonality
The seasonal trend in DON+NH4+ concentrations and δ15DON+NH4
+ is subdued and
was only evident in somewhat higher concentrations and 15N enrichment in winter as
compared to autumn and summer in the Elbe estuarine salinity gradient from 5 to 25. This
seasonal difference (see Table 3.1) is not inherited from the upstream river, where
DON+NH4+ has a narrow range of δ15DON+NH4
+ in samples < stream kilometre 600 (Fig.
3.6). Likewise, significant seasonal variability in δ15PN was only observed in the TMZ, with
very low values in June 2006 (Fig. 3.8), which we will address in more detail later.
3.4.4 DON turnover in the Elbe estuary
Nitrate and DON+NH4+ behave differently in the estuary of Elbe River. Nitrate clearly
increased in the lower estuary and mixed conservatively at increasing salinity in the years
2006 and 2007 (Figs. 3.5 and 3.7). In contrast, it is hard to classify the mixing pattern of
DON+NH4+ for both mass and isotopic composition. While the overall pattern downstream of
a salinity of ~10 may be seen as mostly conservative, gradients in the upper estuary indicate
Turnover of combined DON+NH4+ in the Elbe estuary
___________________________________________________________________________
41
non-conservative behaviour and further pinpoint the TMZ of the Elbe estuary as both a sink
and a source for DON+NH4+.
We detected two zones with maximum DON+NH4+ concentrations in the Elbe estuary
(Fig. 3.4): one lies in the port of Hamburg, which is best explained by input from sewage
treatment plants or direct inputs (and high local ammonium concentrations). In the port area,
the ammonium concentration accounts for approximately 20% of measured DON+NH4+
concentrations (ARGE, 2007a; ARGE, 2007b) and thus is expected to have an effect on the
δ15DON+NH4
+ determined by our method. These assumptions are confirmed by isotopic
composition, since we also observed an increase of δ15DON+NH4
+ in the port of Hamburg
(Fig. 3.6), which is an indicator for waste water nitrogen input (McClelland and Valiela,
1998). Another mechanism may be responsible for the decrease in PN isotope values and the
according increase in δ15DON+NH4+: Badr et al (2008) found that in summer, release of DON
from bacterioplankton may account for a significant fraction of DON in the Plym estuary in
southwest England, Europe. The most pronounced shift in isotope values of both DON+NH4+
and PN in the port of Hamburg occurred in June 2006, and the observed increase of
δ15DON+NH4
+ and drop in δ15PN is in accord with DON turnover. δ15PN increased again
further down the estuary, which can be assigned to progressive ammonium uptake and isotope
fractionation (Middelburg and Herman, 2007). The other zone with a distinct maximum in
DON+NH4+ concentration was found seaward of the TMZ, at the upper limit of brackish
water (Bergemann, 1995).
The role of the turbidity maximum zone
Intriguingly, the landward head of the TMZ consistently coincided with a distinct
minimum of DON+NH4+ concentrations and δ15DON+NH4
+, coincident with sharply rising
DIN concentrations and a drop in δ15N-NO3- of nitrate (Dähnke et al., 2008). Seaward of the
TMZ (from stream km 700), both DON+NH4+ concentrations and δ15DON+NH4
+ increased
again.
Main potential sinks for DON are uptake by phytoplankton or heterotrophic bacteria
(Bronk et al., 2007; Veuger et al., 2004), adsorption to particles (Berman and Bronk, 2003),
conversion to ammonium followed by nitrification (Kerner and Spitzy, 2001), and
photochemical decomposition. Given that the main sink appears to be coupled to the TMZ,
where significant photochemical reactions are unlikely, we regard the latter as an improbable
explanation for the removal of DON. Likewise, a parallel decrease of concentrations and
Chapter 3 ___________________________________________________________________________
42
isotope values, as we observed it regardless of season at the head of the TMZ, is difficult to
explain by assimilation, as it is usually selective in favour of the light isotope. In addition,
nitrate is abundant in the estuarine waters and should preclude DON assimilation by
phytoplankton.
While the quantitative role of DON as a nitrogen source for autotrophs is debated
(Bronk et al., 2007), potential mechanisms of utilization, such as bacterial ammonification
and subsequent phytoplankton uptake of the released nitrogen (Antia et al., 1991; Berman et
al., 1991), are indicated for many estuarine settings. In a microcosm study on turnover of low-
(LMW-DON) and high-molecular weight DON (HMW-DON) in waters from the Elbe
estuary, LMW-DON was preferentially removed and nitrified over HMW-DON (Kerner and
Spitzy, 2001). However, the concentration changes in either DON compartment associated
with this conversion were small, and Kerner and Spitzy (2001) proposed that particulate N is
the source of ammonium that is immediately nitrified in the particle-rich environment of the
Elbe River TMZ. Support came from a correlation between the nitrification rate and
particulate matter content observed in their study, and was explained by the large numbers of
nitrifiers associated with the suspended matter. They conclude that heterotrophic degradation
of PN and chemoautotrophic processes must be intimately coupled in the particle-rich
turbidity zone to cover the N-demand for nitrification on the suspended aggregates.
But why would concentrations and δ15DON+NH4+ increase seaward of the TMZ? A
likely candidate process should remove DON in the inner Elbe estuary and liberate it again at
higher salinity to restore concentrations and isotopic composition. Such a process may be
abiotic and may be associated with flocculation and sorption to either detrital particles or
high-molecular weight DOC. This occurs at the head of many estuarine salinity gradients and
often coincides with the estuarine turbidity maximum (Eisma, 1986; Kranck, 1984), followed
by desorption at higher salinity. The DON+NH4+ concentration minimum in the Elbe TMZ
coincides with a minimum in δ15DON+NH4+ in our samples, and both increase rapidly at the
saline tail of the TMZ (Fig. 6). Previously, a mechanism which involves
adsorption/desorption as a control on DON concentrations in the Delaware Estuary has been
proposed (Mannino and Harvey, 1999). By analogy, one possible mechanism for the observed
change in DON+NH4+ concentrations and δ15DON+NH4
+ may thus be the selective
absorption onto particles in suspension of 15N- enriched DON moieties, which are removed
from the dissolved fraction. Although δ15PN is constant in the TMZ (where adsorption is
indicated) and in the upper limit of brackish water (where desorption would take place), this
may be due to the fact that PN and the adsorbed DON are isotopically similar and the
Turnover of combined DON+NH4+ in the Elbe estuary
___________________________________________________________________________
43
adsorbed mass of DON is small compared to the mass of the particles. A release of particle-
bound ammonium with increasing salinity has been found in sediments (Seitzinger et al.,
1991), which supports this hypothesis. In addition, the independence of season also argues for
a non-biological source of DON or ammonium in the case of the Elbe TMZ at its saline tail.
That the δ15DON+NH4+ recovered to that of PN at a salinity of 7 to 10 further implies that
particle-adsorbed DON may be an important source of dissolved organic nitrogen to the water
column in the outer Elbe estuary.
3.5 Summary and Conclusions
Differing from nitrate, DON+NH4+ does not behave entirely conservatively in the Elbe
estuary. The city of Hamburg and its port in the freshwater interval (salinity <0.2) are a clear
source of DON and/or ammonium, possibly due to input from direct discharges, local
biogenic sources or sewage treatment plants. While mixing appears to be mostly conservative
in the mid- to lower estuary (salinities >10), we see clear signals of input an active cycling in
the upper part of the estuary at salinities between 2 and 5. The decrease in DON+NH4+
concentration at the freshwater head of the estuarine turbidity maximum zone is best
explained by sorption of DON and/or ammonium onto particles in the particle rich
environment. Desorption at the salty tail of the TMZ restores concentrations and
δ15DON+NH4
+ to values seen upstream. Seasonal variations in DON+NH4+ and PN
concentration and δ15DON+NH4+ and δ15PN were only small and not significant. To our
knowledge, this is the first dataset on the estuarine mixing pattern of δ15DON+NH4+ in
seasonal resolution. Even though the interpretation is hampered by the lack of data on N-
cycling in the TMZ, the main conclusion is that most turnover of DON+NH4+ takes place in
the TMZ, just as it has been found for the turnover of nitrate.
Acknowledgements
We thank the master and crew of R/V Ludwig Prandtl for their efforts during sampling campaigns,
Tanja Pieplow for help with nutrient analyses, Uwe Brockmann for valuable discussions and Deborah
Bronk and an anonymous reviewer for constructive comments.

44
Dissolved and particulate reactive nitrogen in the Elbe River: a 2-year N-isotope study ___________________________________________________________________________
45
4. Dissolved and particulate reactive nitrogen in the Elbe
River/NW Europe: a 2-year N-isotope study
Abstract
Rivers collect and transport reactive nitrogen to coastal seas as nitrate, ammonium,
dissolved organic nitrogen (DON), or particulate nitrogen. DON is an important component of
reactive nitrogen in rivers and is suspected to contribute to coastal eutrophication, but little is
known about seasonality of DON loads and turnover within rivers. We measured the
concentrations and the isotope ratios 15N/14N of combined DON+NH4+ (δ15DON+NH4
+),
nitrate (δ15N-NO3-) and particulate nitrogen (δ15PN) in the non-tidal Elbe River (SE North
Sea, NW Europe) over a period of 2 years (June 2005 to December 2007) at monthly
resolution. Combined DON+NH4+ concentrations ranged from 22 to 75 µM and comprised
nearly 23% of total dissolved nitrogen in the Elbe River in annual mean; PN and nitrate
concentrations ranged from 11 to 127 µM, and 33 to 422 µM, respectively. Combined PN and
DON+NH4+ concentrations were, to a first approximation, inversely correlated to nitrate
concentrations. δ15DON+NH4+, which varied between from 0.8‰ to 11.5‰, changed in
parallel to δ15PN (range 6 to 10‰), and both were anti-correlated to δ15N-NO3- (range 6 to
23‰). Seasonal patterns of DON+NH4+ concentrations and δ15DON+NH4
+ diverge from
those expected from biological DON+NH4+ production in the river alone and suggest that the
elution of organic fertilisers significantly affects the DON+NH4+ pool in the Elbe River.
Key words: Dissolved organic nitrogen, nitrate, stable isotopes, river, seasonality, particulate
nitrogen
Chapter 4 ___________________________________________________________________________
46
4.1 Introduction
Dissolved organic nitrogen (DON) is a major contributor to total dissolved nitrogen
(TDN, the sum of nitrate, nitrite, ammonium and DON) discharged from land to the coastal
ocean. Meybeck (1993) estimated that nearly 70 % of the nitrogen entering coastal regions via
rivers is in the form of DON, and highest relative DON contributions characterize TDN loads
of unpolluted rivers (Wiegner et al., 2006). But although DON comprises a smaller fraction
than nitrate of the total N load in many eutrophied rivers, anthropogenic sources may
significantly increase the natural DON background (Agedah et al., 2009; Howarth, 2004) up
to a point where anthropogenic sources exceed wetland-derived DON in low-N streams
(Stanley and Maxted, 2008). DON is thought to be an inert pool of heterogeneous
composition that is not a relevant N-source for freshwater and estuarine ecosystems (Williams
and Druffel, 1987), but recent work suggests that labile fractions of DON are selectively
turned over in estuaries (Schlarbaum et al., 2010). When discharged to coastal seas, DON
may substitute for dissolved inorganic nitrogen (DIN) as a substrate for phytoplankton
assimilation. A substantially larger fraction of DON is assimilated by marine than by
freshwater bacterioplankton; the susceptibility of DON to mineralization by bacteria appears
to increase with increasing salinity during transport from fresh to marine water (Stepanauskas
et al., 1999a, 1999b). In seasons when the inorganic N pools are exhausted DON may in
particular promote harmful algal blooms (Bronk, 2002; Bronk et al., 2007).
The lack of knowledge on DON sources and turnover in rivers, as well as the potential
influence of coastal ecosystems near river discharge areas motivated our investigation into
DON dynamics in the Elbe river, possible seasonality of DON discharge into the adjacent
estuary and coastal sea, and use of isotopic indicators for origin, as well as for possible
sources and sinks of DON in the river.
As a sequel to a study on combined DON and ammonium dynamics in the Elbe estuary
(Schlarbaum et al., 2010), we here present a data set on concentrations and the 15N/14N
composition of combined DON and ammonium (DON+NH4+), particulate nitrogen (PN), and
nitrate (expressed as the δ value in ‰ = [(Rsample/Rstandard)-1]*1000, R = 15N/14N in
DON+NH4+, nitrate, or PN, and in the international standard atmospheric dinitrogen) of the
Elbe River. The first objective of this study is to investigate the seasonal pattern of combined
DON and ammonium in the river that drains an intensely farmed (70% agriculture) catchment
of 148,268 km2 in central Europe, and in which policy measures, such as a ban on organic
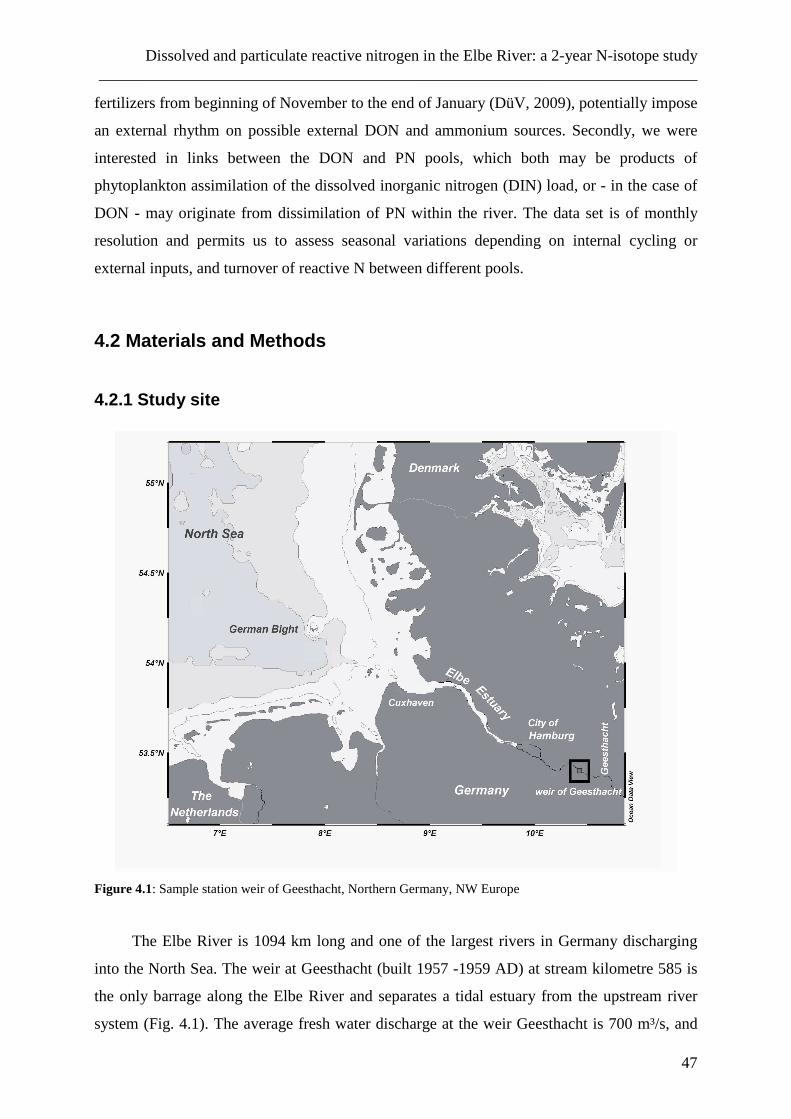
Dissolved and particulate reactive nitrogen in the Elbe River: a 2-year N-isotope study ___________________________________________________________________________
47
fertilizers from beginning of November to the end of January (DüV, 2009), potentially impose
an external rhythm on possible external DON and ammonium sources. Secondly, we were
interested in links between the DON and PN pools, which both may be products of
phytoplankton assimilation of the dissolved inorganic nitrogen (DIN) load, or - in the case of
DON - may originate from dissimilation of PN within the river. The data set is of monthly
resolution and permits us to assess seasonal variations depending on internal cycling or
external inputs, and turnover of reactive N between different pools.
4.2 Materials and Methods
4.2.1 Study site
Figure 4.1: Sample station weir of Geesthacht, Northern Germany, NW Europe
The Elbe River is 1094 km long and one of the largest rivers in Germany discharging
into the North Sea. The weir at Geesthacht (built 1957 -1959 AD) at stream kilometre 585 is
the only barrage along the Elbe River and separates a tidal estuary from the upstream river
system (Fig. 4.1). The average fresh water discharge at the weir Geesthacht is 700 m³/s, and
Chapter 4 ___________________________________________________________________________
48
can rise to 4000 m³/s during floods; nearly 25 million people live in the entire catchment area
of 148,268 km2 (Behrendt et al., 2004). The Elbe River is the largest nutrient source of the
German Bight (Brockmann and Pfeiffer, 1990), which is severely affected by eutrophication
(Osparcom, 2008). In 2007, the Elbe discharged 87 kt reactive N (85% nitrate, 15%
DON+NH4+ + PN) into the estuary (Arge, 2008).
4.2.2 Sampling
From June 2005 to December 2007, monthly water samples were collected at the weir
using a Ruttner sampler. Initially, samples were collected at two different water depths (0.5m
and 3m), which was reduced to only 1 sample from 1-2 m after initial analyses showed no
significant difference between the two depths. The river water was immediately filtered
through precombusted GF/F filters and stored in PE bottles that had been soaked in acid
overnight and rinsed with deionised water (DIW). Each bottle was rinsed with sample water
before being filled. Water samples were frozen at -18°C until analysis. Filters were dried at
60-70°C and stored at 4°C before analyses.
4.2.3 Methods
Glassware was washed with deionised water (DIW), soaked in soap and 10% HCl baths
and washed again with DIW after each single step. All non-volumetric glassware was
combusted at 450°C for at least 4 hours, volumetric glassware and PE-bottles were washed
with DIW, soaked in 10% HCl bath overnight, washed again with DIW and dried at 50°C.
Concentration of total dissolved nitrogen (TDN) in DIW was determined using the “persulfate
oxidation method” (Solórzano and Sharp, 1980; Koroleff, 1976; Knapp et al., 2005) (see
below) with a blank of < 1µmol/l.
4.2.3.1 Concentrations and δ15N analysis of Nitrate and Nitrite
Concentrations of nitrate and nitrite were measured with standard colorimetric
techniques (Grasshoff and Anderson, 1999) on an AutoAnalyzer3 by Bran & Luebbe.
Concentration of nitrite in the water samples was negligible (below 2% of the nitrate
concentration) at a detection limit of 0.05 µM. δ15N-NO3
- of nitrate was analysed by using the
“denitrifier method” (Sigman et al., 2001; Casciotti et al., 2002). Nitrate was quantitatively
Dissolved and particulate reactive nitrogen in the Elbe River: a 2-year N-isotope study ___________________________________________________________________________
49
reduced to nitrous oxide (N2O) by using a strain of denitrifier bacteria that lacks N2O
reductase activity. N2O was automatically extracted, purified in a Gasbench
(ThermoFinnigan) and analysed on a Finnigan Delta plus XP mass spectrometer. The sample
size was adjusted to 20 nmol nitrate in each sample. The samples were referenced to
injections of N2O from a pure N2O gas cylinder and then standardised using an internationally
accepted nitrate isotopic reference material (IAEA-N3, δ15N = 4.7‰). We used an internal
potassium nitrate standard for further validation of our results, which we measured with each
batch of samples. The standard deviation for replicate analyses (n = 4) was ± 0.2‰. The
method also permits determination of δ18O-NO3- (Sigman et al., 2001; Casciotti et al., 2002;
Dähnke et al., 2008), which is referenced to IAEA-N3 with a δ18O-NO3- of 22.7‰ versus
Vienna Standard Mean Ocean Water (VSMOW) (Böhlke et al., 2003). We note that this value
has recently been corrected and is now reported as 25.6‰, but decided to use the formerly
assigned value for a better comparison with previous studies (Johannsen et al., 2008;
Schlarbaum et al., 2010).
4.2.3.2 Concentration and δ15N analysis of TDN
To determine the TDN concentration and δ15TDN we used the method of Knapp et al.
(2005), with small modifications as described in Schlarbaum et al. (2010). In brief, total
dissolved nitrogen is oxidized to nitrate using the “persulfate oxidation method” (Solórzano
and Sharp, 1980; Koroleff, 1976; Knapp et al., 2005). Concentration of TDN was determined
as nitrate after oxidation by the method described above.
For the determination of δ15TDN nitrate in oxidised samples and reagent blanks was
converted to N2O using the denitrifier method (Sigman et al., 2001; Casciotti et al., 2002) as
described above.
4.2.3.3 Concentration and δ15N analysis of combined DON+NH4+
Concentration of combined DON+NH4+ was calculated by the difference between TDN
and nitrate, because concentration of nitrite was consistently negligible.
For the δ15DON+NH4+ mass balance calculations were made using the measured nitrate
concentrations and δ15N values of the oxidised sample, the reagent blank and the unoxidised
sample:
Chapter 4 ___________________________________________________________________________
50
( ) ( )
++
+−
−+
=+ ++
−−
++
)(
(*
)(
)(*
)(
)(*
4
15
4
3315
4
15
4
15
NHDONc
BlankcBlank
NHDONc
NOcNON
NHDONc
TDNcTDNNHDON
δδδδ
(Eq. 4.1)
The combination of persulfate digestion and denitrifier method to measure
δ15DON+NH4
+ has been tested by oxidation of urea standard solutions with a concentration
range of 10 to 400 µM. The δ15N of solid urea was measured by using a Flash EA 1112
elemental analyzer coupled to a Finnigan Delta plus XP mass spectrometer, yielding a δ15N
value of 0.5‰ ± 0.2‰. Measurements of the urea solutions after preparation as above yielded
in δ15N values of 0.4‰ ± 0.2‰ after blank correction.
Repeated measurements of the same water sample demonstrated the reproducibility of
the δ15N method for δ15DON+NH4+ analyses. The mean measured standard deviation of
δ15TDN and δ15N-NO3
- was 0.2‰ (3 to 4 repetitions). The mean standard deviation for TDN
and nitrate concentration was 1 µM. Because of error propagation, the calculated standard
deviation of δ15DON+NH4+ ranged from 0.1 to 2.8‰ with a mean value of 1.2‰, and the
calculated mean standard deviation for combined DON+NH4+ concentration was 2.2 µM.
The method does not separate DON and ammonium. However, in comparison with
DON concentration, ammonium concentrations were near to or below detection limit (< 2.9
µM) except for samples taken during winter seasons and in June 2007. During winter seasons,
ammonium concentrations occasionally increased up to 34 µM (February 2006), equalling 50
% of the combined DON+NH4+ loads; in June 2007, ammonium accounted for approximately
10% of combined DON+NH4+.
4.2.3.4 Concentration and δ15N analysis of PN
Particulate nitrogen was sampled by filtering the water samples through precombusted
(6 hours, 450°C) and tared GF/F filters. After filtration the filters were dried at 60°C and
stored dark at 4°C until analysed. The weight of particulate matter on the filters was
determined, and C and N weight % were analysed by using a Flash EA 1112 elemental
analyzer. The δ15PN was analysed with a Flash EA 1112 elemental analyzer coupled to a
Finnigan Delta plus XP mass spectrometer. Results were standardised using the
internationally accepted isotopic reference materials “High organic sediment standard OAS”
Dissolved and particulate reactive nitrogen in the Elbe River: a 2-year N-isotope study ___________________________________________________________________________
51
(Cat.no. B2151, Batch no. 2824, δ15N = + 4.4‰ ± 0.19‰), “Low Organic Content Soil
Standard OAS” (Cat.no. B2153, Batch no. 2822, δ15N = + 6.7‰ ± 0.15‰) and IAEA-N1
(δ15N = + 0.4‰). The standard deviation for replicate analysis was 0.2‰ (3 replicates).
4.2.4 Annual and seasonal loads and load-weighted isotopic values
For an estimate of the mass loads of DON+NH4+, TDN, PN, and nitrate and the average
N-isotope composition of these compounds, we used our analytical data and the discharge
rates of the sampling dates to calculate annual loads as:
iii flowcJL **∑= (Eq. 4.2)
The entire time interval J of 12 months for annual calculations (6 months for seasonal
calculations) was divided in n sampling intervals with the duration |Ji|, the concentration ci
and the discharge flowi. The annual load L is the sum of the single loads in the sampling
intervals Ji (Hebbel and Steuer, 2006; Johannsen et al., 2008).
For the calculation of the load-weighted annual average isotope composition, the
isotope values were multiplied with the respective concentration and weighted with the loads
according to the formulas:
∑∑=
ii
iiiwml flowc
flowcNN
*
**1515
δδ (Eq. 4.3)
∑∑=
ii
iiiwml flowc
flowcOO
*
**1818
δδ (Eq. 4.4)
where δ15Nwml and δ18Owml are the load-weighted annual isotope values, δ15Ni and δ18Oi are
the measured isotope values of individual samples, ci is the respective concentration, and
flow i the discharge flow.
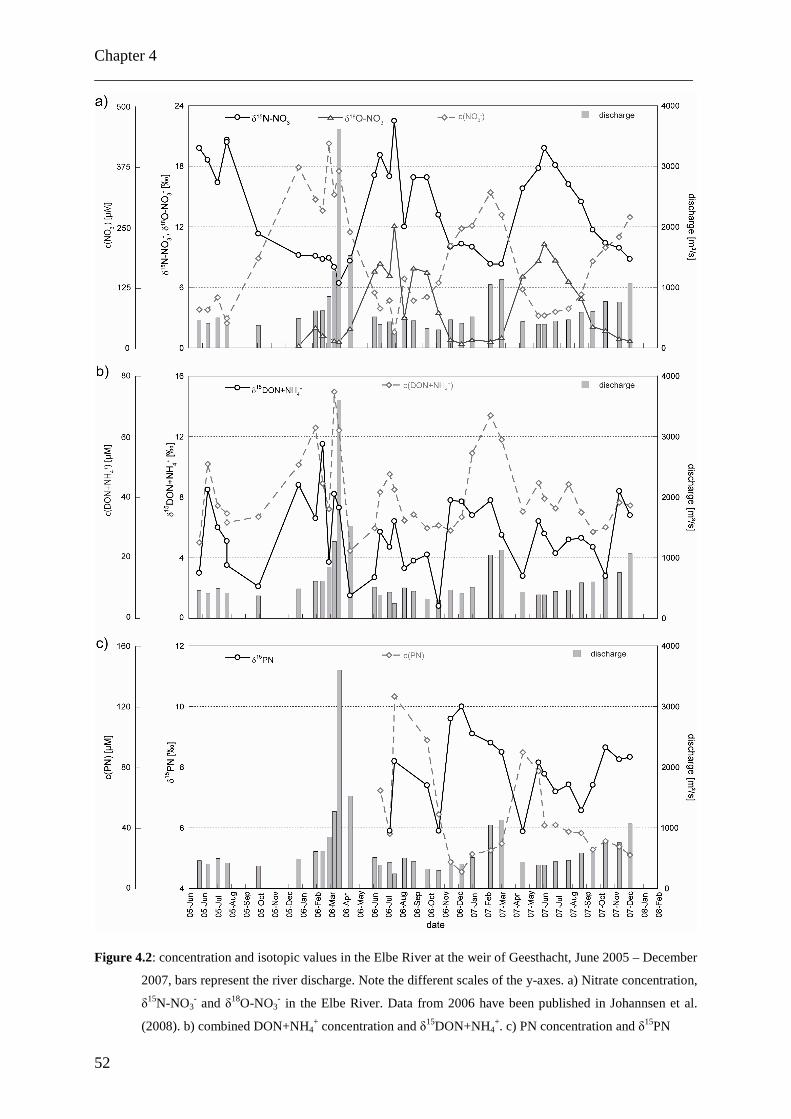
Chapter 4 ___________________________________________________________________________
52
Figure 4.2: concentration and isotopic values in the Elbe River at the weir of Geesthacht, June 2005 – December
2007, bars represent the river discharge. Note the different scales of the y-axes. a) Nitrate concentration,
δ15N-NO3
- and δ18O-NO3- in the Elbe River. Data from 2006 have been published in Johannsen et al.
(2008). b) combined DON+NH4+ concentration and δ15DON+NH4
+. c) PN concentration and δ15PN
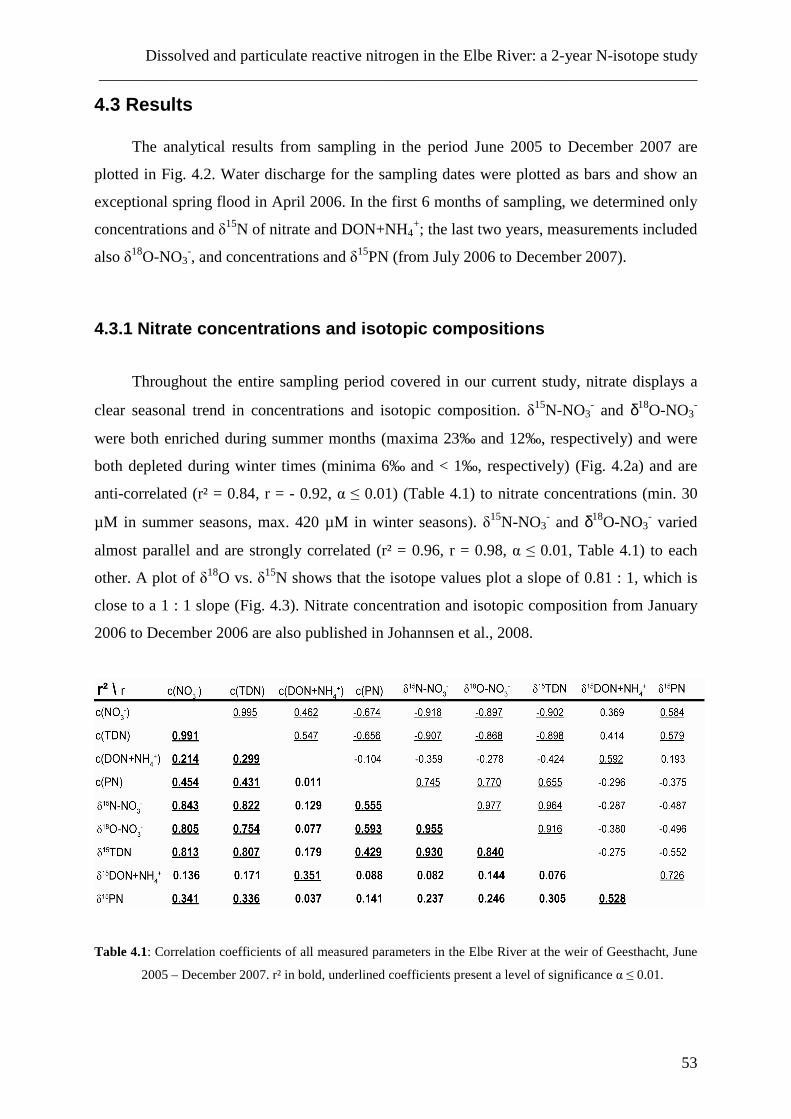
Dissolved and particulate reactive nitrogen in the Elbe River: a 2-year N-isotope study ___________________________________________________________________________
53
4.3 Results
The analytical results from sampling in the period June 2005 to December 2007 are
plotted in Fig. 4.2. Water discharge for the sampling dates were plotted as bars and show an
exceptional spring flood in April 2006. In the first 6 months of sampling, we determined only
concentrations and δ15N of nitrate and DON+NH4+; the last two years, measurements included
also δ18O-NO3-, and concentrations and δ15PN (from July 2006 to December 2007).
4.3.1 Nitrate concentrations and isotopic compositions
Throughout the entire sampling period covered in our current study, nitrate displays a
clear seasonal trend in concentrations and isotopic composition. δ15N-NO3- and δ18O-NO3
-
were both enriched during summer months (maxima 23‰ and 12‰, respectively) and were
both depleted during winter times (minima 6‰ and < 1‰, respectively) (Fig. 4.2a) and are
anti-correlated (r² = 0.84, r = - 0.92, α ≤ 0.01) (Table 4.1) to nitrate concentrations (min. 30
µM in summer seasons, max. 420 µM in winter seasons). δ15N-NO3- and δ18O-NO3
- varied
almost parallel and are strongly correlated (r² = 0.96, r = 0.98, α ≤ 0.01, Table 4.1) to each
other. A plot of δ18O vs. δ15N shows that the isotope values plot a slope of 0.81 : 1, which is
close to a 1 : 1 slope (Fig. 4.3). Nitrate concentration and isotopic composition from January
2006 to December 2006 are also published in Johannsen et al., 2008.
Table 4.1: Correlation coefficients of all measured parameters in the Elbe River at the weir of Geesthacht, June
2005 – December 2007. r² in bold, underlined coefficients present a level of significance α ≤ 0.01.
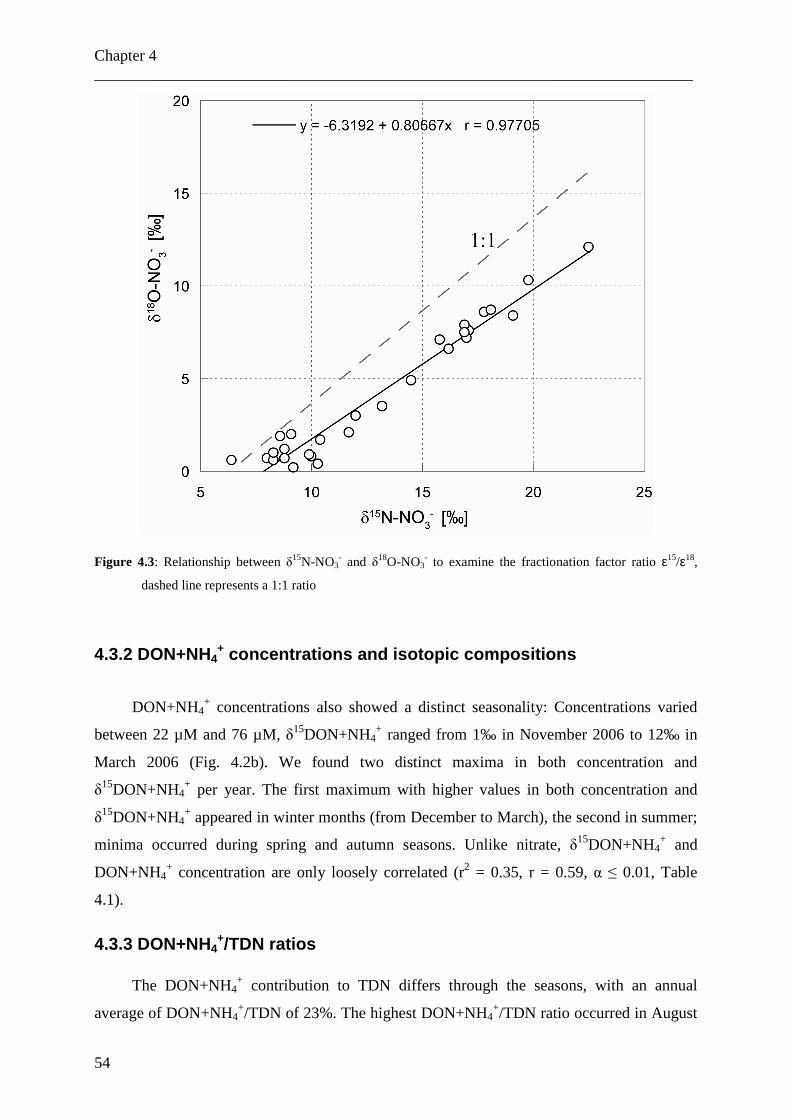
Chapter 4 ___________________________________________________________________________
54
Figure 4.3: Relationship between δ15N-NO3
- and δ18O-NO3- to examine the fractionation factor ratio ε15/ε18,
dashed line represents a 1:1 ratio
4.3.2 DON+NH4+ concentrations and isotopic compositions
DON+NH4+ concentrations also showed a distinct seasonality: Concentrations varied
between 22 µM and 76 µM, δ15DON+NH4+ ranged from 1‰ in November 2006 to 12‰ in
March 2006 (Fig. 4.2b). We found two distinct maxima in both concentration and
δ15DON+NH4
+ per year. The first maximum with higher values in both concentration and
δ15DON+NH4
+ appeared in winter months (from December to March), the second in summer;
minima occurred during spring and autumn seasons. Unlike nitrate, δ15DON+NH4+ and
DON+NH4+ concentration are only loosely correlated (r2 = 0.35, r = 0.59, α ≤ 0.01, Table
4.1).
4.3.3 DON+NH4+/TDN ratios
The DON+NH4
+ contribution to TDN differs through the seasons, with an annual
average of DON+NH4+/TDN of 23%. The highest DON+NH4
+/TDN ratio occurred in August
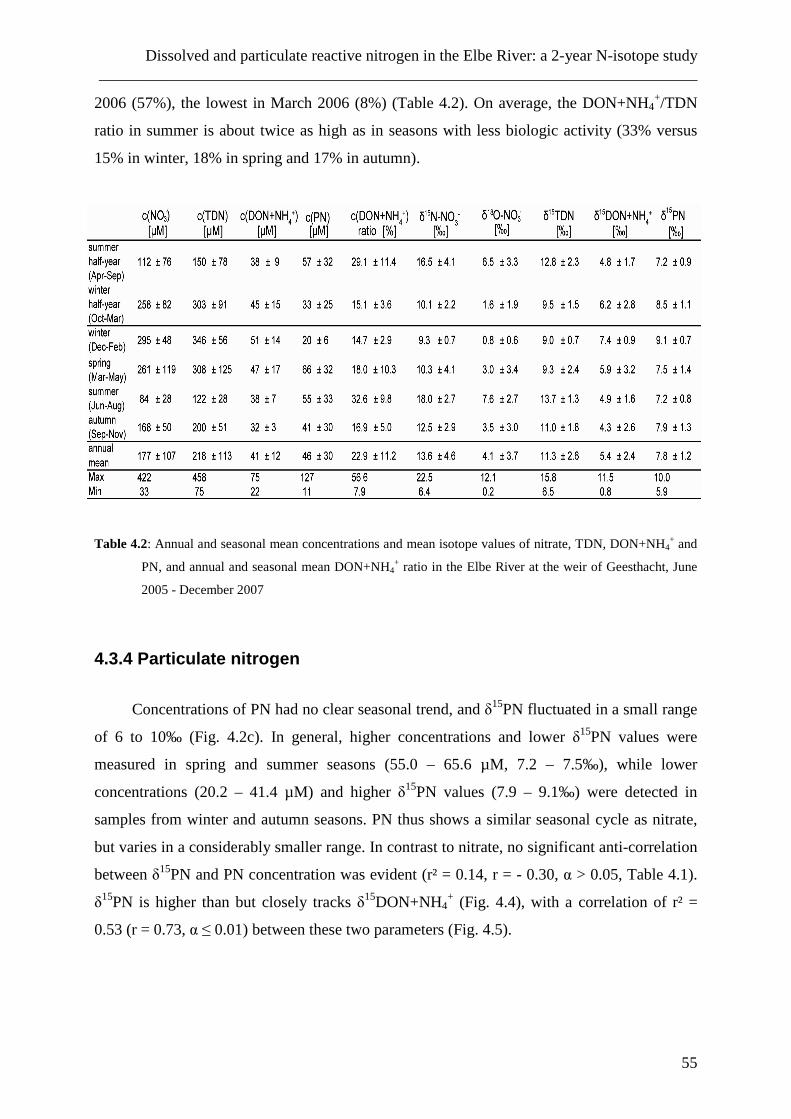
Dissolved and particulate reactive nitrogen in the Elbe River: a 2-year N-isotope study ___________________________________________________________________________
55
2006 (57%), the lowest in March 2006 (8%) (Table 4.2). On average, the DON+NH4+/TDN
ratio in summer is about twice as high as in seasons with less biologic activity (33% versus
15% in winter, 18% in spring and 17% in autumn).
Table 4.2: Annual and seasonal mean concentrations and mean isotope values of nitrate, TDN, DON+NH4+ and
PN, and annual and seasonal mean DON+NH4+ ratio in the Elbe River at the weir of Geesthacht, June
2005 - December 2007
4.3.4 Particulate nitrogen
Concentrations of PN had no clear seasonal trend, and δ15PN fluctuated in a small range
of 6 to 10‰ (Fig. 4.2c). In general, higher concentrations and lower δ15PN values were
measured in spring and summer seasons (55.0 – 65.6 µM, 7.2 – 7.5‰), while lower
concentrations (20.2 – 41.4 µM) and higher δ15PN values (7.9 – 9.1‰) were detected in
samples from winter and autumn seasons. PN thus shows a similar seasonal cycle as nitrate,
but varies in a considerably smaller range. In contrast to nitrate, no significant anti-correlation
between δ15PN and PN concentration was evident (r² = 0.14, r = - 0.30, α > 0.05, Table 4.1).
δ15PN is higher than but closely tracks δ15DON+NH4
+ (Fig. 4.4), with a correlation of r² =
0.53 (r = 0.73, α ≤ 0.01) between these two parameters (Fig. 4.5).
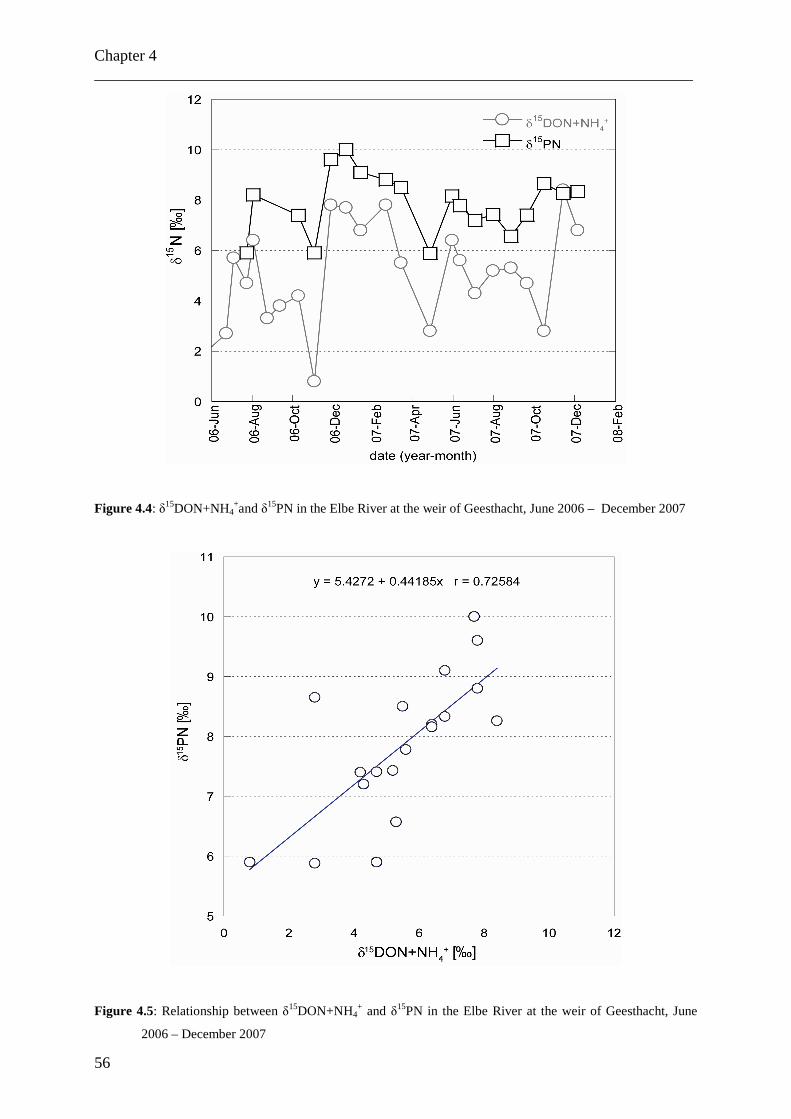
Chapter 4 ___________________________________________________________________________
56
Figure 4.4: δ15DON+NH4+and δ15PN in the Elbe River at the weir of Geesthacht, June 2006 – December 2007
Figure 4.5: Relationship between δ15DON+NH4+ and δ15PN in the Elbe River at the weir of Geesthacht, June
2006 – December 2007
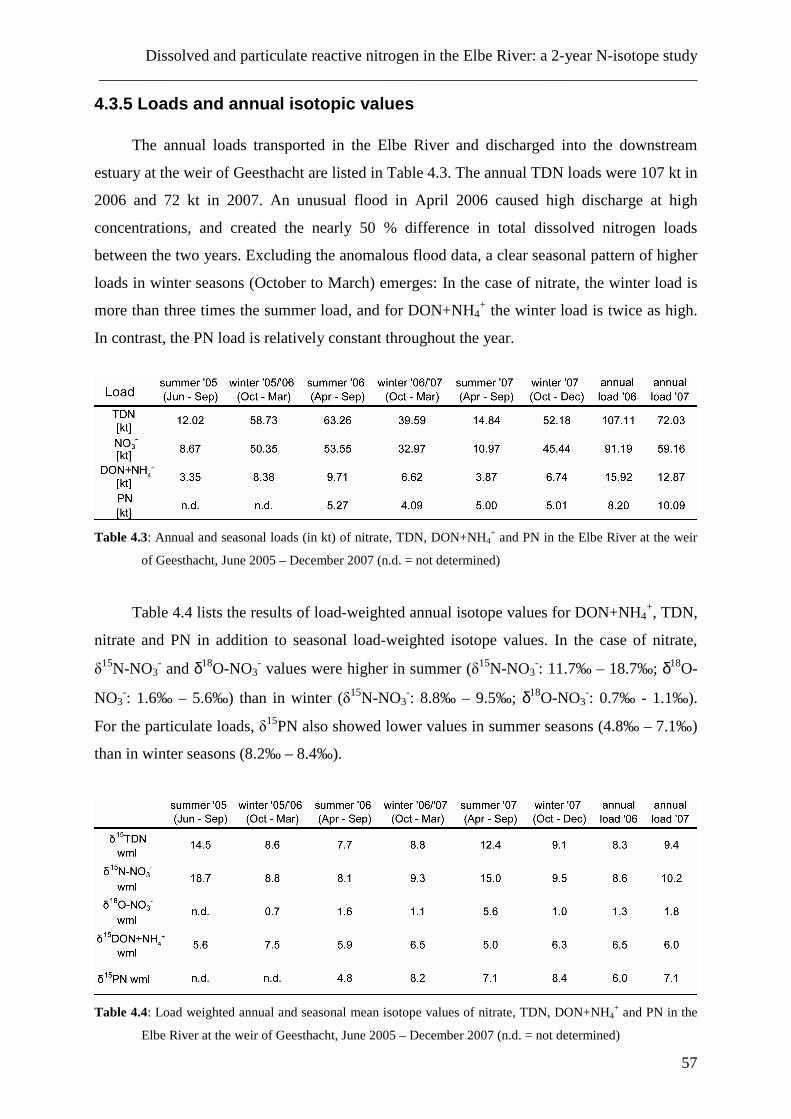
Dissolved and particulate reactive nitrogen in the Elbe River: a 2-year N-isotope study ___________________________________________________________________________
57
4.3.5 Loads and annual isotopic values
The annual loads transported in the Elbe River and discharged into the downstream
estuary at the weir of Geesthacht are listed in Table 4.3. The annual TDN loads were 107 kt in
2006 and 72 kt in 2007. An unusual flood in April 2006 caused high discharge at high
concentrations, and created the nearly 50 % difference in total dissolved nitrogen loads
between the two years. Excluding the anomalous flood data, a clear seasonal pattern of higher
loads in winter seasons (October to March) emerges: In the case of nitrate, the winter load is
more than three times the summer load, and for DON+NH4+ the winter load is twice as high.
In contrast, the PN load is relatively constant throughout the year.
Table 4.3: Annual and seasonal loads (in kt) of nitrate, TDN, DON+NH4
+ and PN in the Elbe River at the weir
of Geesthacht, June 2005 – December 2007 (n.d. = not determined)
Table 4.4 lists the results of load-weighted annual isotope values for DON+NH4+, TDN,
nitrate and PN in addition to seasonal load-weighted isotope values. In the case of nitrate,
δ15N-NO3
- and δ18O-NO3- values were higher in summer (δ15N-NO3
-: 11.7‰ – 18.7‰; δ18O-
NO3-: 1.6‰ – 5.6‰) than in winter (δ15N-NO3
-: 8.8‰ – 9.5‰; δ18O-NO3-: 0.7‰ - 1.1‰).
For the particulate loads, δ15PN also showed lower values in summer seasons (4.8‰ – 7.1‰)
than in winter seasons (8.2‰ – 8.4‰).
Table 4.4: Load weighted annual and seasonal mean isotope values of nitrate, TDN, DON+NH4
+ and PN in the
Elbe River at the weir of Geesthacht, June 2005 – December 2007 (n.d. = not determined)
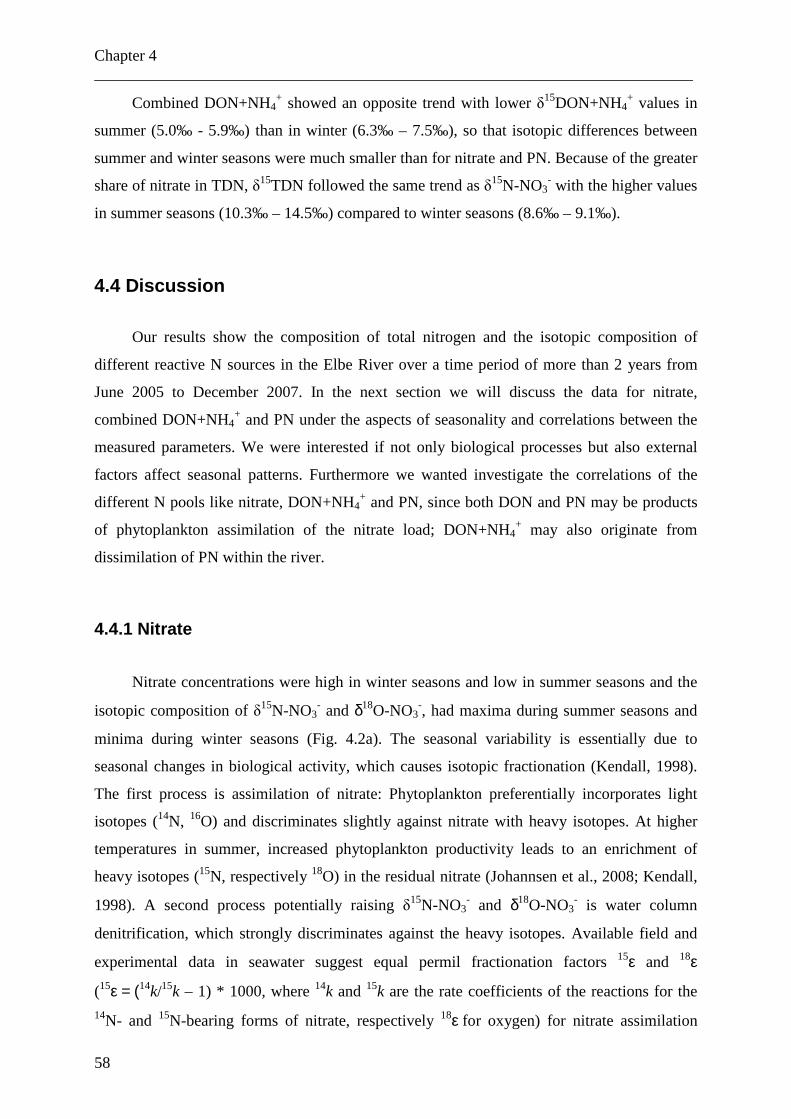
Chapter 4 ___________________________________________________________________________
58
Combined DON+NH4+ showed an opposite trend with lower δ
15DON+NH4+ values in
summer (5.0‰ - 5.9‰) than in winter (6.3‰ – 7.5‰), so that isotopic differences between
summer and winter seasons were much smaller than for nitrate and PN. Because of the greater
share of nitrate in TDN, δ15TDN followed the same trend as δ15N-NO3- with the higher values
in summer seasons (10.3‰ – 14.5‰) compared to winter seasons (8.6‰ – 9.1‰).
4.4 Discussion
Our results show the composition of total nitrogen and the isotopic composition of
different reactive N sources in the Elbe River over a time period of more than 2 years from
June 2005 to December 2007. In the next section we will discuss the data for nitrate,
combined DON+NH4+ and PN under the aspects of seasonality and correlations between the
measured parameters. We were interested if not only biological processes but also external
factors affect seasonal patterns. Furthermore we wanted investigate the correlations of the
different N pools like nitrate, DON+NH4+ and PN, since both DON and PN may be products
of phytoplankton assimilation of the nitrate load; DON+NH4+ may also originate from
dissimilation of PN within the river.
4.4.1 Nitrate
Nitrate concentrations were high in winter seasons and low in summer seasons and the
isotopic composition of δ15N-NO3- and δ18O-NO3
-, had maxima during summer seasons and
minima during winter seasons (Fig. 4.2a). The seasonal variability is essentially due to
seasonal changes in biological activity, which causes isotopic fractionation (Kendall, 1998).
The first process is assimilation of nitrate: Phytoplankton preferentially incorporates light
isotopes (14N, 16O) and discriminates slightly against nitrate with heavy isotopes. At higher
temperatures in summer, increased phytoplankton productivity leads to an enrichment of
heavy isotopes (15N, respectively 18O) in the residual nitrate (Johannsen et al., 2008; Kendall,
1998). A second process potentially raising δ15N-NO3
- and δ18O-NO3- is water column
denitrification, which strongly discriminates against the heavy isotopes. Available field and
experimental data in seawater suggest equal permil fractionation factors 15ε and 18ε
(15ε = (14k/15k – 1) * 1000, where 14k and 15k are the rate coefficients of the reactions for the 14N- and 15N-bearing forms of nitrate, respectively 18ε for oxygen) for nitrate assimilation
Dissolved and particulate reactive nitrogen in the Elbe River: a 2-year N-isotope study ___________________________________________________________________________
59
(Casciotti et al., 2002; Granger et al., 2004) and denitrification (Granger et al., 2004; Sigman
et al., 2003), but little is known about the fractionation factors associated with nitrate
assimilation in fresh water; in the case of denitrification, 18ε : 15ε ratios of ~0.5-0.6 have been
reported (Bottcher et al., 1990; Lehmann et al., 2003; Mengis et al. 1999). However, water
column denitrification is unlikely given the oxygen concentrations in the study area, so we
expect that coupled enrichment of oxygen and nitrogen isotopes will be mainly associated to
assimilation. In Fig. 4.3 we plotted δ15N-NO3- versus δ18O-NO3
- and obtain a slope of 0.81.
This slope represents the ratio of the fractionation factors 15ε and 18ε as described by Granger
et al. (2004) in their experiments of coupled nitrogen and oxygen isotope fractionation
and indicates a major influence of nitrate assimilation, because both isotopes have almost the
same fractionation factor (Granger et al., 2004). In July 2005 Deutsch et al. (2009) measured
a ratio of 1.12 in the Elbe River. In combination with increased concentrations of chlorophyll
a and particulate organic carbon they demonstrated that nitrate assimilation by phytoplankton
plays a major role in nitrogen transformation processes in the Elbe River (Deutsch et al.,
2009).
4.4.2 Particulate nitrogen
Because of the relative short sampling period and the lack of seasonality in both
concentration and δ15PN, it is difficult to establish the role of PN in the nitrogen cycle in the
Elbe River, which is further complicated by its heterogeneous composition: PN consists both
of detritus and newly produced phytoplankton, with presumably large differences in δ15PN.
The higher mean concentrations in spring and summer (65.6 µM and 55.0 µM, Table 4.2) are
accompanied by low δ15PN values (7.5‰ in spring, 7.2‰ in summer) and decreasing DIN
concentration. This pattern is consistent with PN originating from internal phytoplankton
production (Raabe et al., 2004), and fits well with data from July 2005, when a PN
concentration of 61 µM and a δ15PN value of ~7‰ was determined (Deutsch et al., 2009).
Assimilation of low-δ15N ammonium in the beginning of the phytoplankton bloom in spring
could be the reason for the decreasing δ15PN, since ammonium is the preferred N source when
abundant (Hadas et al., 2009). After ammonium is exhausted, 15N-enriched DON and nitrate
were assimilated, leading to increasing δ15PN. Resuspension of particulate matter from
surface sediments should result in an increase in both concentration and δ15PN, thus
explaining our observations in summer 2006, when both δ15PN and PN concentration reach a
maximum value.
Chapter 4 ___________________________________________________________________________
60
The increase in δ15PN and decrease in concentration in autumn and winter indicates
consumption during this period, coupled to resuspension of low-N sedimentary organic matter
due to increased flow rates. This suspended matter can be degraded due to biological activity
in the sediments and have low N content, but high δ15PN values. The similar curve
progression of δ15PN and δ15DON+NH4+ indicates a relationship between the dissolved and
the particulate matter fraction (Fig. 4.4), mirrored in the correlation coefficient of r² = 0.53 (α
≤ 0.01) (Fig. 4.5). The lower δ15DON+NH4+ compared to δ15PN suggest that particulate
matter is, at any time of year, a significant source for DON and/or ammonium, so DON
and/or ammonium are produced by release of small soluble fractions of PN (see next section).
4.4.3 DON+NH4+
The combined DON+NH4+ load of the Elbe River at the weir of Geesthacht apparently
is fed by both external and internal sources. The abiotic external sources of DON+NH4+
include terrestrial runoff, such as DON and/or ammonium input by surface runoff, tributaries,
groundwater (Valiela et al., 1990; Tobias et al., 2001) and from the atmosphere (Cornell et al.,
1995). These external sources are often dominated by discharge of sewage treatment plants,
and elution of slurry and liquid manure from farmland.
During our observation period, we found seasonal differences in both DON+NH4+
concentration and δ15DON+NH4+ (Fig. 4.2b). In contrast to nitrate dynamics, the annual
DON+NH4+ cycle appears to be more differentiated and can be separated into four seasonal
phases: DON+NH4++ concentrations and δ15DON+NH4
+ decreasing in concert (spring), a
coupled increase of both parameters (summer), decreasing DON+NH4+ concentration and
isotope values in autumn and then another increase of both in winter.
4.4.3.1 Spring
During spring, decreasing DON+NH4+ concentration may be explained by
heterotrophic and autotrophic uptake of reactive low-molecular-weight DON (LMW DON)
(Bronk et al., 2007) and ammonium. Only small fractions of the heterogeneous DON pool in
river water are bioavailable (Bronk et al., 2007, Seitzinger and Sanders, 1997, Seitzinger et
al., 2002). The proportion of DON that is utilizable by phytoplankton varies by source and
land use pattern in the catchment: up to 59% of DON from urban/suburban stormwater runoff
and 30% from agriculture sources can be bioavailable (Seitzinger et al., 2002). Incubation
Dissolved and particulate reactive nitrogen in the Elbe River: a 2-year N-isotope study ___________________________________________________________________________
61
experiments by Berman et al. (1999) showed that LMW DON, composed mainly urea, is
easily degraded by indigenous bacteria and/or free dissolved enzymes. The portion of this
labile fraction is variable: In a study about fifty rivers draining a major part of the Baltic Sea
watershed (Stepanauskas et al., 2002) total nitrogen was composed by 48% dissolved
inorganic nitrogen (DIN), 41% DON and 11% particulate nitrogen (PN). The labile fraction
of DON was composed of urea and dissolved combined amino acids (DCAA) with 4–20% of
DON each, and <3% dissolved free amino acids (DFAA).
Besides land use pattern, the bioavailability of DON appears to depend also on seasonal
influences that may determine the type of DON. Highest uptake rates of DON originating
from urban/suburban stormwater runoffs and agriculture sources were observed in spring
times (Seitzinger et al., 2002). The decreasing δ15DON+NH4
+ values observed in spring
apparently reflect that uptake of the bioavailable fraction is complete to the point that we have
no apparent isotope effect, and the low δ15DON+NH4
+ value measured in the remaining pool
is due to recalcitrant DON that remains in the water column.
4.4.3.2 Summer
In the second distinct phase in DON+NH4+ seasonal cycling (June to August) both
concentration and δ15DON+NH4+ increase. In 2005 Deutsch et al. (2009) measured low δ15N-
NH4+ values of 2-3‰ in the Elbe River, so this increase in δ15DON+NH4
+ should mainly be
due to increasing δ15DON. In summer, elution of organic fertilisers in the form of slurry and
liquid manure dispersed on farmland during the first main fertilisation period in spring leads
to an increase in DON concentration and δ15DON (Heaton, 1996), in accord with our data.
The data from monitoring at the weir also indicate a limitation of biological production
in the river by ammonium and phosphate during summer (Table 4.5). This seasonal lack of
nutrients apparently leads to high rates of DON release by phytoplankton: When
phytoplankton cells are stressed by nutrient limitation, they react by high release rates of
organic matter (Carlson et al., 1994; Larsson and Hagström, 1979). Furthermore, such
nutrient limitation induces an uptake of DON as an alternative N-source (Jackson and
Williams, 1985). Kaushal and Lewis Jr. (2005) examined two streams in Colorado and found
highest uptake rates of bioavailable DON, when concentration of DIN in stream water was
lowest. In incubation experiments they showed that 40% of the DON could be consumed by
microbes in stream sediment. This suggested that DON has the potential to be used biotical at
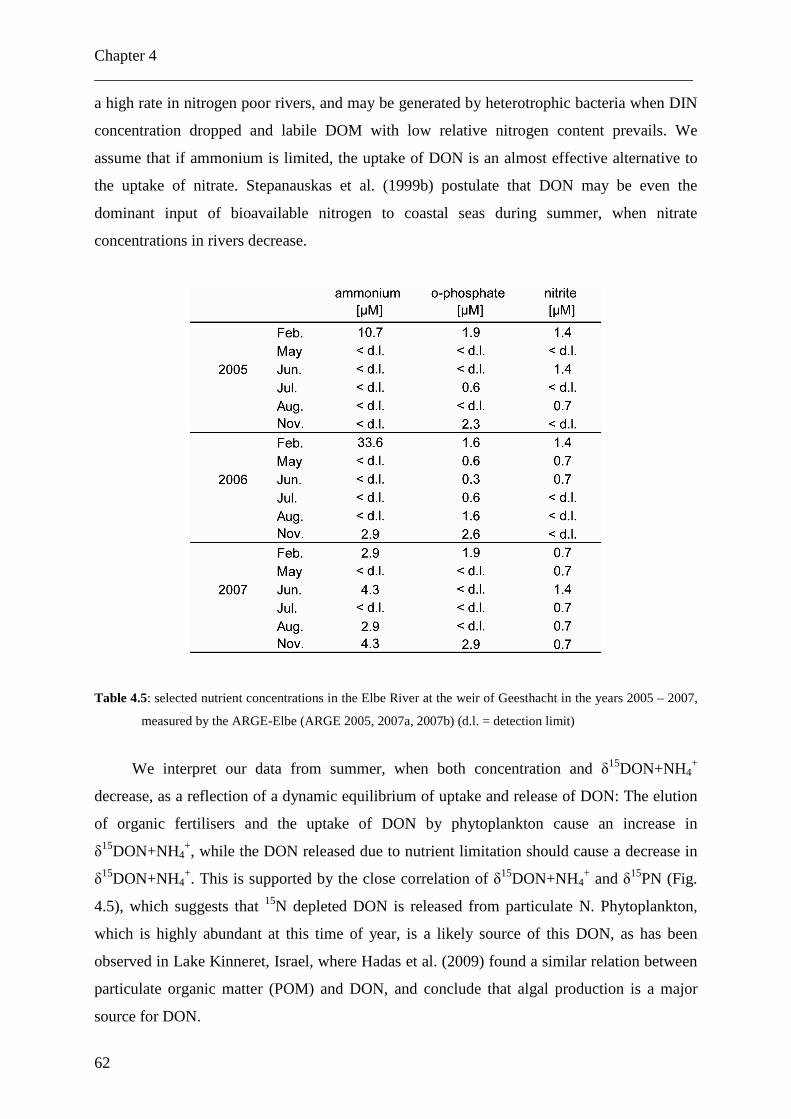
Chapter 4 ___________________________________________________________________________
62
a high rate in nitrogen poor rivers, and may be generated by heterotrophic bacteria when DIN
concentration dropped and labile DOM with low relative nitrogen content prevails. We
assume that if ammonium is limited, the uptake of DON is an almost effective alternative to
the uptake of nitrate. Stepanauskas et al. (1999b) postulate that DON may be even the
dominant input of bioavailable nitrogen to coastal seas during summer, when nitrate
concentrations in rivers decrease.
Table 4.5: selected nutrient concentrations in the Elbe River at the weir of Geesthacht in the years 2005 – 2007,
measured by the ARGE-Elbe (ARGE 2005, 2007a, 2007b) (d.l. = detection limit)
We interpret our data from summer, when both concentration and δ15DON+NH4+
decrease, as a reflection of a dynamic equilibrium of uptake and release of DON: The elution
of organic fertilisers and the uptake of DON by phytoplankton cause an increase in
δ15DON+NH4
+, while the DON released due to nutrient limitation should cause a decrease in
δ15DON+NH4
+. This is supported by the close correlation of δ15DON+NH4
+ and δ15PN (Fig.
4.5), which suggests that 15N depleted DON is released from particulate N. Phytoplankton,
which is highly abundant at this time of year, is a likely source of this DON, as has been
observed in Lake Kinneret, Israel, where Hadas et al. (2009) found a similar relation between
particulate organic matter (POM) and DON, and conclude that algal production is a major
source for DON.
Dissolved and particulate reactive nitrogen in the Elbe River: a 2-year N-isotope study ___________________________________________________________________________
63
4.4.3.3 Autumn
In autumn, from September to October, we again observed a decrease in DON+NH4+
concentration and δ15DON+NH4+, followed by parallel increases in winter months to higher
values in both concentration and δ15DON+NH4
+ than in summer.
In autumn, at the end of the biological production period, there is still a lack of
phosphate in the river water, so that the release of 15N-depleted DON is still in progress.
However, due to sinking algal production, DON+NH4+ concentration is decreasing. The
remaining DON is isotopically depleted. We infer that sedimentation is also a major sink of
DON as an explanation for decreasing DON+NH4+ concentration and δ15DON+NH4
+. In the
Colne River (which has a TDN composition comparable to the Elbe River), Agedah et al.
(2009) observed a similar decrease when 15N enriched DON is removed from the water
column. The low PN concentrations further support this assumption.
4.4.3.4 Winter
The increase of DON+NH4+ concentration and δ15DON+NH4
+ in winter is due to the
elution of organic fertilisers of the second main fertilisation period in autumn after the last
harvest in October before the blocking period starts (from beginning of November until the
end of January, DüV, 2009). Recent measurements of δ15N-NH4
+ in January 2010 showed low
values of 0 – 1‰ at concentrations of ~13 µM (Schlarbaum et al., unpublished data), so DON
must be highly enriched in 15N to obtain measured δ15DON+NH4+ values. The elevated
concentration in comparison to summer is due to high ammonium concentrations in winter
(10 – 30 µM, Table 4.5).
4.5 Summary and conclusions
In our study about different forms of nitrogen in the Elbe River at the weir of
Geesthacht we measured both concentration and stable isotope signatures of nitrate, combined
DON+NH4+ and PN. On an annual basis, nearly 23 % of TDN is in the form of DON+NH4
+.
For nitrate the seasonal pattern has two periods with a contrasting development of
concentration and dual nitrate isotopes, due to biological processes. We attribute this to nitrate
Chapter 4 ___________________________________________________________________________
64
assimilation during biological activity, as is supported by the co-variance of δ15N-NO3- and
δ18O-NO3
-.
In contrast, the seasonal cycling of combined DON+NH4+ is more complex and is
influenced by many different factors, both biotic and abiotic. The annual DON+NH4+ cycle
can be separated into four periods, with an increase in both concentration and δ15DON+NH4+
in summer and winter, and a decrease in spring and autumn. As the main abiotic source, we
assume the elution of 15N-enriched organic fertiliser, after the main fertilisation periods in
spring and after the harvest in autumn, to have an important influence on DON in the Elbe
River. In summer, this is accompanied by DON release by phytoplankton due to nutrient
limitation, indicated by the similar, almost parallel progression of δ15DON+NH4+ and δ15PN.
The decrease in spring and autumn is on the one hand due to autotrophic and heterotrophic
uptake (springtime) and on the other hand due to lower biological production in autumn. Our
measurements suggest that the recalcitrant high-molecular-weight DON fraction in the Elbe
River is isotopically depleted in 15N, compared to the reactive low-molecular-weight DON.
Isotope ratios of NO3-, TRN and PN in the EMS trace external N-inputs and internal N-cycling
______________________________________________________________________________
65
5. Isotope ratios of nitrate, dissolved reduced and particulate
nitrogen in the eastern Mediterranean Sea trace external N-
inputs and internal N-cycling
Abstract
The eastern Mediterranean Sea is an unusually nutrient-poor ocean basin where the 15N/14N
isotope ratios in many compartments of reactive nitrogen are lower than in comparable oceanic
settings. To elucidate possible reasons, we determined stable isotope ratios in nitrate, suspended
particulate and total dissolved reduced nitrogen for stations across the eastern Mediterranean Sea
occupied in January and February 2007; sinking PN was collected at one of the stations in the
period from February to September 2007. The δ15N levels of all reactive N compartments in
waters of the basin is very low (grand average 2.6 ‰) compared to other oceanic environments.
Deep-water nitrate below 500 m water depth (δ15N=2.2±0.3‰) was more depleted in 15N than
nitrate generally found in deep water nitrate pools of other oceans (δ15N ranges from 4.7-5.4 ‰),
whereas 15N was enriched in suspended particulate N (δ15N = 7.3±0.8‰) and reduced dissolved N
(δ15N =5.7±3.8‰) compared to nitrate and sinking particulate N intercepted in sediment traps
(δ15N= 0.9±0.8‰). We infer that extensive mineralisation is the cause of the isotopic makeup of
reactive N in deep water, in concert with the lack of water column denitrification. Nitrogen and
oxygen isotope ratios in nitrate of the mixed layer suggest an external source of nitrate depleted in 15N, probably anthropogenic NOx rather than fixed nitrogen. To explain the observed isotope
anomaly in the mixed layer, either the ammonium formed by the breakdown of organic matter
must be predominantly nitrified, or atmospheric NOx characteristically enriched in 18O was
present.
Chapter 5 ______________________________________________________________________________
66
5.1 Introduction
The modern eastern Mediterranean Sea is a highly oligotrophic oceanic environment
(Antoine et al., 1995; Béthoux, 1989) where primary production is approximately half that
observed in the Sargasso Sea or the Northeast Pacific (Krom et al., 2003). This low productivity is
caused by the anti-estuarine circulation in the basin: Modified Atlantic Water flows in through the
Strait of Sicily at the surface, sinks in the eastern part of the basin and feeds the Levantine
Intermediate Water, a high temperature, high salinity water mass at depths between 200 and 500
m that leaves the basin as a westward current through the Sicily Strait. This intermediate water
mass collects and exports the bulk of mineralisation products sinking out of the mixed layer.
Below (>500 m) this surface circulation cell is the eastern Mediterranean Deep Water (Malanotte-
Rizzolli and Bergamasco, 1989; Wüst, 1961) which forms when the intermediate water mass is
entrained into surface waters of the two northern sub-basins (Aegean or Adriatic Seas) and gains
sufficient density after winter cooling (Lascaratos et al., 1999).
The export of nutrients with outflowing intermediate water causes the deep waters of the
eastern Mediterranean Sea to be nutrient depleted relative to the deep water in all other parts of
the global ocean: Nitrate concentrations in deep water are 4-6 µM compared to 8 µM in deep
water of the adjacent Western Mediterranean Sea, and 20 µM at similar depths in the Atlantic
Ocean. The eastern Mediterranean Sea is also unusual in that it has a high nitrate:phosphate ratio
(28:1) in the deep water and is phosphate-starved (Krom et al., 2005b). As a result, primary
production during the winter phytoplankton bloom is limited by phosphate rather than by nitrate
(Krom et al., 1991). In winter, the phosphate in the surface water is entirely depleted while excess
nitrate remains (Kress and Herut, 2001). However, soon after the seasonal thermocline develops
in spring, both nitrate and phosphate become depleted in the photic zone (Kress and Herut, 2001;
Krom et al., 2005a) and phytoplankton productivity becomes N- and P- co-limited (Thingstad et
al., 2005; Zohary and Robarts, 1998). The reason is that all P respired is available for assimilation,
whereas part of the N respired enters the pool of dissolved organic nitrogen and subsequently is
not available for assimilation (Thingstad et al., 2005; Zohary and Robarts, 1998).
Another unusual feature of the eastern Mediterranean Sea is the 15N depletion of deep-
water nitrate, suspended matter, and surface sediments in the basin (Coban-Yildiz et al., 2006;
Pantoja et al., 2002; Struck et al., 2001) compared to values in other open-ocean environments.
The isotope ratio is commonly expressed as δ15N, which is the ratio in the abundance of 15N and
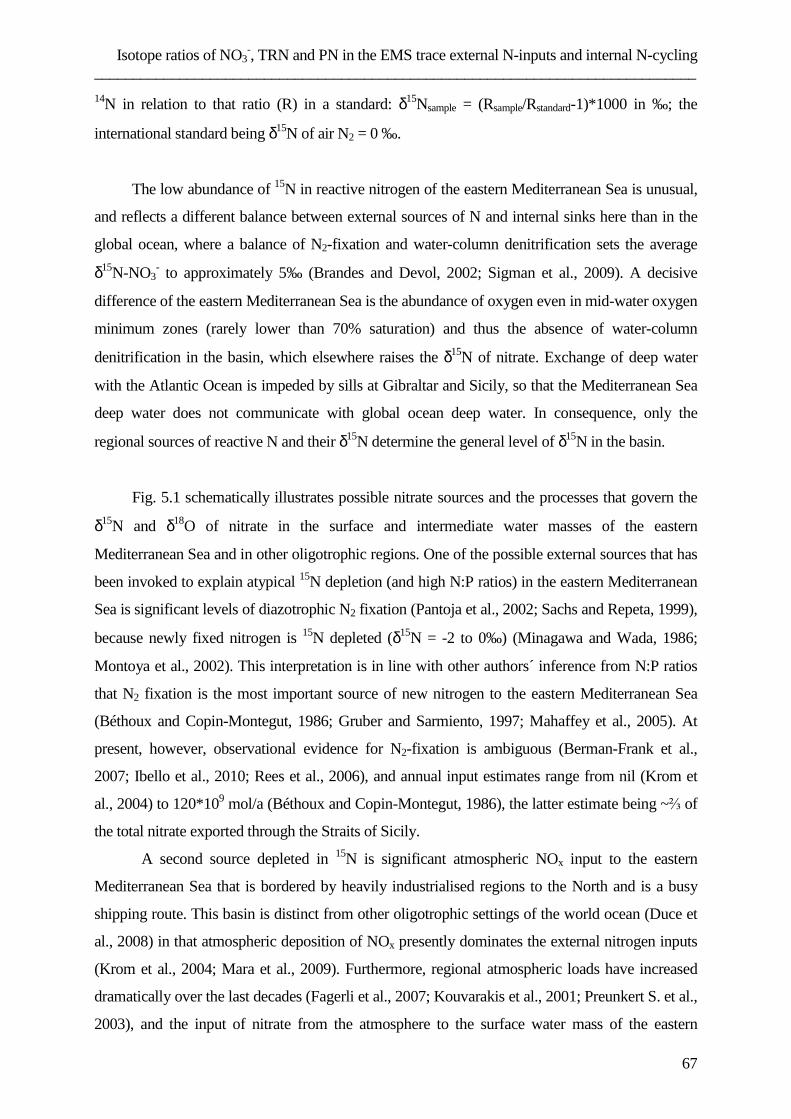
Isotope ratios of NO3-, TRN and PN in the EMS trace external N-inputs and internal N-cycling
______________________________________________________________________________
67
14N in relation to that ratio (R) in a standard: δ15Nsample = (Rsample/Rstandard-1)*1000 in ‰; the
international standard being δ15N of air N2 = 0 ‰.
The low abundance of 15N in reactive nitrogen of the eastern Mediterranean Sea is unusual,
and reflects a different balance between external sources of N and internal sinks here than in the
global ocean, where a balance of N2-fixation and water-column denitrification sets the average
δ15N-NO3- to approximately 5‰ (Brandes and Devol, 2002; Sigman et al., 2009). A decisive
difference of the eastern Mediterranean Sea is the abundance of oxygen even in mid-water oxygen
minimum zones (rarely lower than 70% saturation) and thus the absence of water-column
denitrification in the basin, which elsewhere raises the δ15N of nitrate. Exchange of deep water
with the Atlantic Ocean is impeded by sills at Gibraltar and Sicily, so that the Mediterranean Sea
deep water does not communicate with global ocean deep water. In consequence, only the
regional sources of reactive N and their δ15N determine the general level of δ15N in the basin.
Fig. 5.1 schematically illustrates possible nitrate sources and the processes that govern the
δ15N and δ18O of nitrate in the surface and intermediate water masses of the eastern
Mediterranean Sea and in other oligotrophic regions. One of the possible external sources that has
been invoked to explain atypical 15N depletion (and high N:P ratios) in the eastern Mediterranean
Sea is significant levels of diazotrophic N2 fixation (Pantoja et al., 2002; Sachs and Repeta, 1999),
because newly fixed nitrogen is 15N depleted (δ15N = -2 to 0‰) (Minagawa and Wada, 1986;
Montoya et al., 2002). This interpretation is in line with other authors´ inference from N:P ratios
that N2 fixation is the most important source of new nitrogen to the eastern Mediterranean Sea
(Béthoux and Copin-Montegut, 1986; Gruber and Sarmiento, 1997; Mahaffey et al., 2005). At
present, however, observational evidence for N2-fixation is ambiguous (Berman-Frank et al.,
2007; Ibello et al., 2010; Rees et al., 2006), and annual input estimates range from nil (Krom et
al., 2004) to 120*109 mol/a (Béthoux and Copin-Montegut, 1986), the latter estimate being ~⅔ of
the total nitrate exported through the Straits of Sicily.
A second source depleted in 15N is significant atmospheric NOx input to the eastern
Mediterranean Sea that is bordered by heavily industrialised regions to the North and is a busy
shipping route. This basin is distinct from other oligotrophic settings of the world ocean (Duce et
al., 2008) in that atmospheric deposition of NOx presently dominates the external nitrogen inputs
(Krom et al., 2004; Mara et al., 2009). Furthermore, regional atmospheric loads have increased
dramatically over the last decades (Fagerli et al., 2007; Kouvarakis et al., 2001; Preunkert S. et al.,
2003), and the input of nitrate from the atmosphere to the surface water mass of the eastern
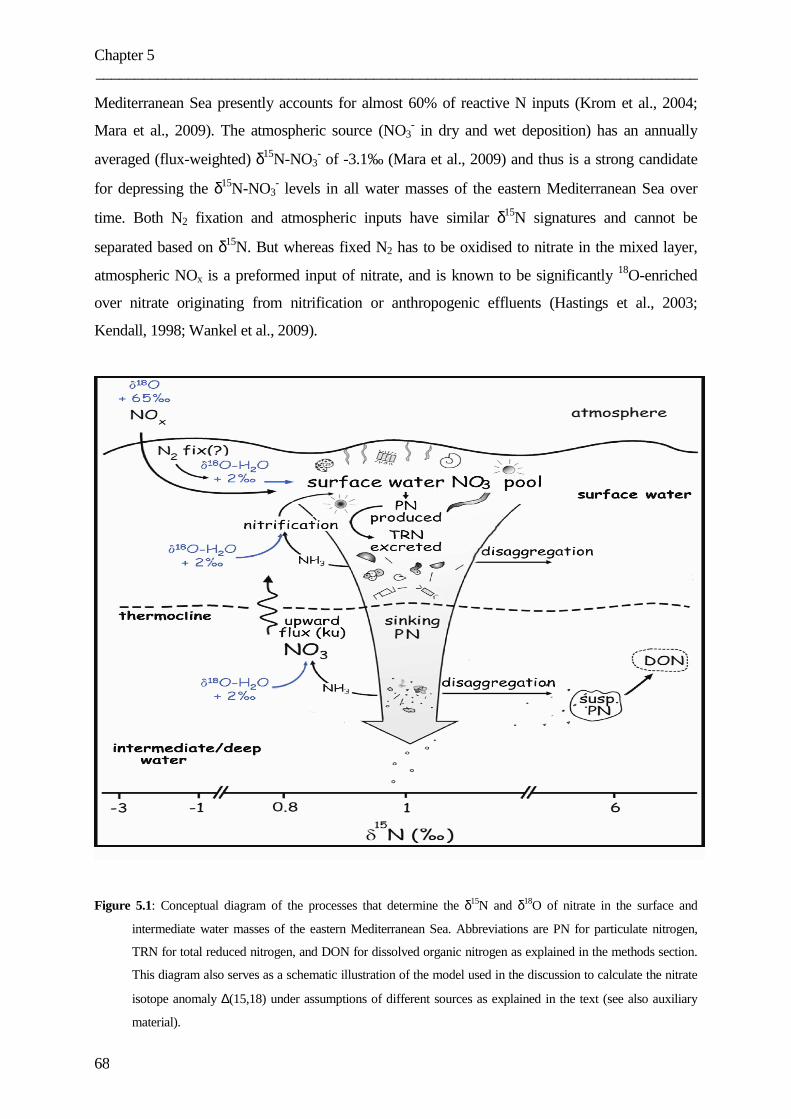
Chapter 5 ______________________________________________________________________________
68
Mediterranean Sea presently accounts for almost 60% of reactive N inputs (Krom et al., 2004;
Mara et al., 2009). The atmospheric source (NO3- in dry and wet deposition) has an annually
averaged (flux-weighted) δ15N-NO3- of -3.1‰ (Mara et al., 2009) and thus is a strong candidate
for depressing the δ15N-NO3- levels in all water masses of the eastern Mediterranean Sea over
time. Both N2 fixation and atmospheric inputs have similar δ15N signatures and cannot be
separated based on δ15N. But whereas fixed N2 has to be oxidised to nitrate in the mixed layer,
atmospheric NOx is a preformed input of nitrate, and is known to be significantly 18O-enriched
over nitrate originating from nitrification or anthropogenic effluents (Hastings et al., 2003;
Kendall, 1998; Wankel et al., 2009).
Figure 5.1: Conceptual diagram of the processes that determine the δ15N and δ18O of nitrate in the surface and
intermediate water masses of the eastern Mediterranean Sea. Abbreviations are PN for particulate nitrogen,
TRN for total reduced nitrogen, and DON for dissolved organic nitrogen as explained in the methods section.
This diagram also serves as a schematic illustration of the model used in the discussion to calculate the nitrate
isotope anomaly ∆(15,18) under assumptions of different sources as explained in the text (see also auxiliary
material).
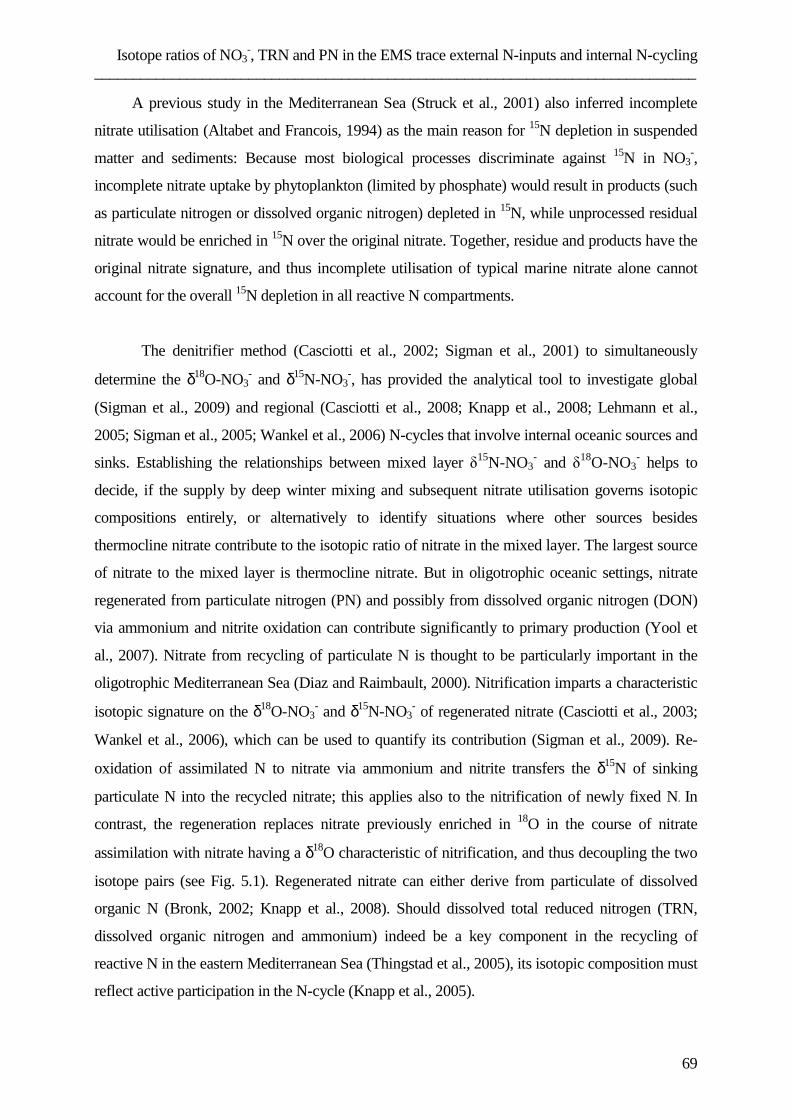
Isotope ratios of NO3-, TRN and PN in the EMS trace external N-inputs and internal N-cycling
______________________________________________________________________________
69
A previous study in the Mediterranean Sea (Struck et al., 2001) also inferred incomplete
nitrate utilisation (Altabet and Francois, 1994) as the main reason for 15N depletion in suspended
matter and sediments: Because most biological processes discriminate against 15N in NO3-,
incomplete nitrate uptake by phytoplankton (limited by phosphate) would result in products (such
as particulate nitrogen or dissolved organic nitrogen) depleted in 15N, while unprocessed residual
nitrate would be enriched in 15N over the original nitrate. Together, residue and products have the
original nitrate signature, and thus incomplete utilisation of typical marine nitrate alone cannot
account for the overall 15N depletion in all reactive N compartments.
The denitrifier method (Casciotti et al., 2002; Sigman et al., 2001) to simultaneously
determine the δ18O-NO3- and δ15N-NO3
-, has provided the analytical tool to investigate global
(Sigman et al., 2009) and regional (Casciotti et al., 2008; Knapp et al., 2008; Lehmann et al.,
2005; Sigman et al., 2005; Wankel et al., 2006) N-cycles that involve internal oceanic sources and
sinks. Establishing the relationships between mixed layer δ15N-NO3- and δ18O-NO3
- helps to
decide, if the supply by deep winter mixing and subsequent nitrate utilisation governs isotopic
compositions entirely, or alternatively to identify situations where other sources besides
thermocline nitrate contribute to the isotopic ratio of nitrate in the mixed layer. The largest source
of nitrate to the mixed layer is thermocline nitrate. But in oligotrophic oceanic settings, nitrate
regenerated from particulate nitrogen (PN) and possibly from dissolved organic nitrogen (DON)
via ammonium and nitrite oxidation can contribute significantly to primary production (Yool et
al., 2007). Nitrate from recycling of particulate N is thought to be particularly important in the
oligotrophic Mediterranean Sea (Diaz and Raimbault, 2000). Nitrification imparts a characteristic
isotopic signature on the δ18O-NO3- and δ15N-NO3
- of regenerated nitrate (Casciotti et al., 2003;
Wankel et al., 2006), which can be used to quantify its contribution (Sigman et al., 2009). Re-
oxidation of assimilated N to nitrate via ammonium and nitrite transfers the δ15N of sinking
particulate N into the recycled nitrate; this applies also to the nitrification of newly fixed N. In
contrast, the regeneration replaces nitrate previously enriched in 18O in the course of nitrate
assimilation with nitrate having a δ18O characteristic of nitrification, and thus decoupling the two
isotope pairs (see Fig. 5.1). Regenerated nitrate can either derive from particulate of dissolved
organic N (Bronk, 2002; Knapp et al., 2008). Should dissolved total reduced nitrogen (TRN,
dissolved organic nitrogen and ammonium) indeed be a key component in the recycling of
reactive N in the eastern Mediterranean Sea (Thingstad et al., 2005), its isotopic composition must
reflect active participation in the N-cycle (Knapp et al., 2005).
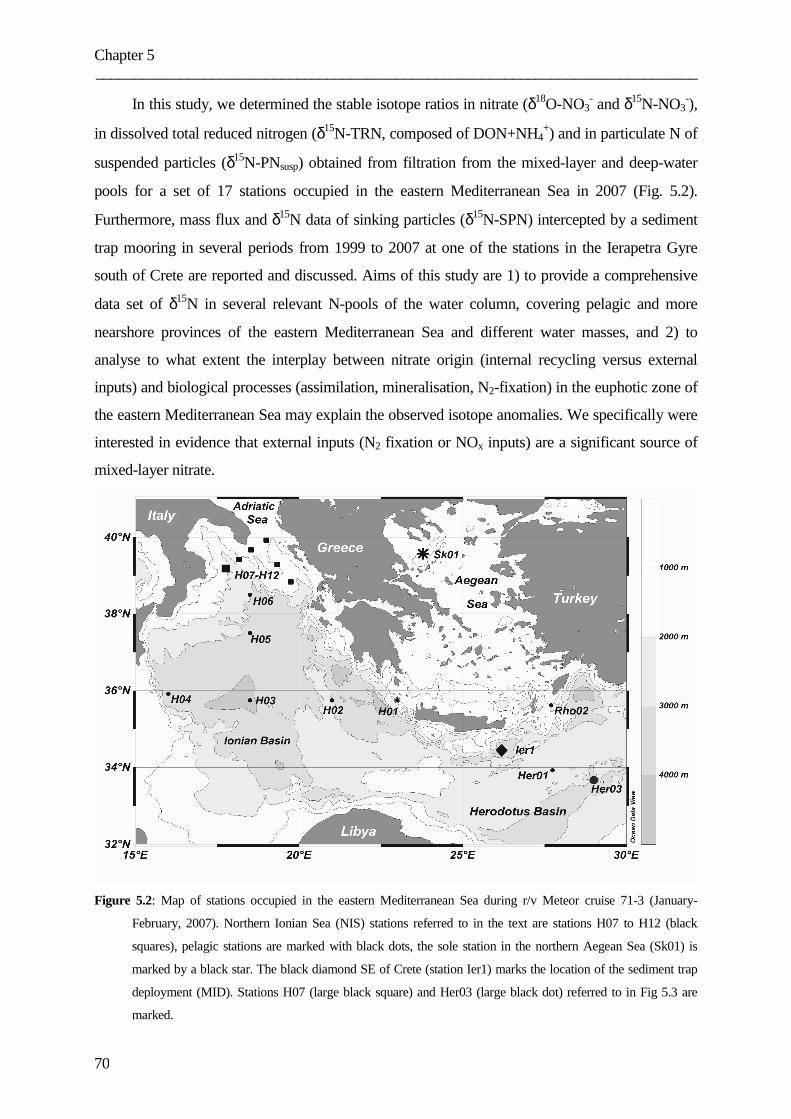
Chapter 5 ______________________________________________________________________________
70
In this study, we determined the stable isotope ratios in nitrate (δ18O-NO3- and δ15N-NO3
-),
in dissolved total reduced nitrogen (δ15N-TRN, composed of DON+NH4+) and in particulate N of
suspended particles (δ15N-PNsusp) obtained from filtration from the mixed-layer and deep-water
pools for a set of 17 stations occupied in the eastern Mediterranean Sea in 2007 (Fig. 5.2).
Furthermore, mass flux and δ15N data of sinking particles (δ15N-SPN) intercepted by a sediment
trap mooring in several periods from 1999 to 2007 at one of the stations in the Ierapetra Gyre
south of Crete are reported and discussed. Aims of this study are 1) to provide a comprehensive
data set of δ15N in several relevant N-pools of the water column, covering pelagic and more
nearshore provinces of the eastern Mediterranean Sea and different water masses, and 2) to
analyse to what extent the interplay between nitrate origin (internal recycling versus external
inputs) and biological processes (assimilation, mineralisation, N2-fixation) in the euphotic zone of
the eastern Mediterranean Sea may explain the observed isotope anomalies. We specifically were
interested in evidence that external inputs (N2 fixation or NOx inputs) are a significant source of
mixed-layer nitrate.
Figure 5.2: Map of stations occupied in the eastern Mediterranean Sea during r/v Meteor cruise 71-3 (January-
February, 2007). Northern Ionian Sea (NIS) stations referred to in the text are stations H07 to H12 (black
squares), pelagic stations are marked with black dots, the sole station in the northern Aegean Sea (Sk01) is
marked by a black star. The black diamond SE of Crete (station Ier1) marks the location of the sediment trap
deployment (MID). Stations H07 (large black square) and Her03 (large black dot) referred to in Fig 5.3 are
marked.
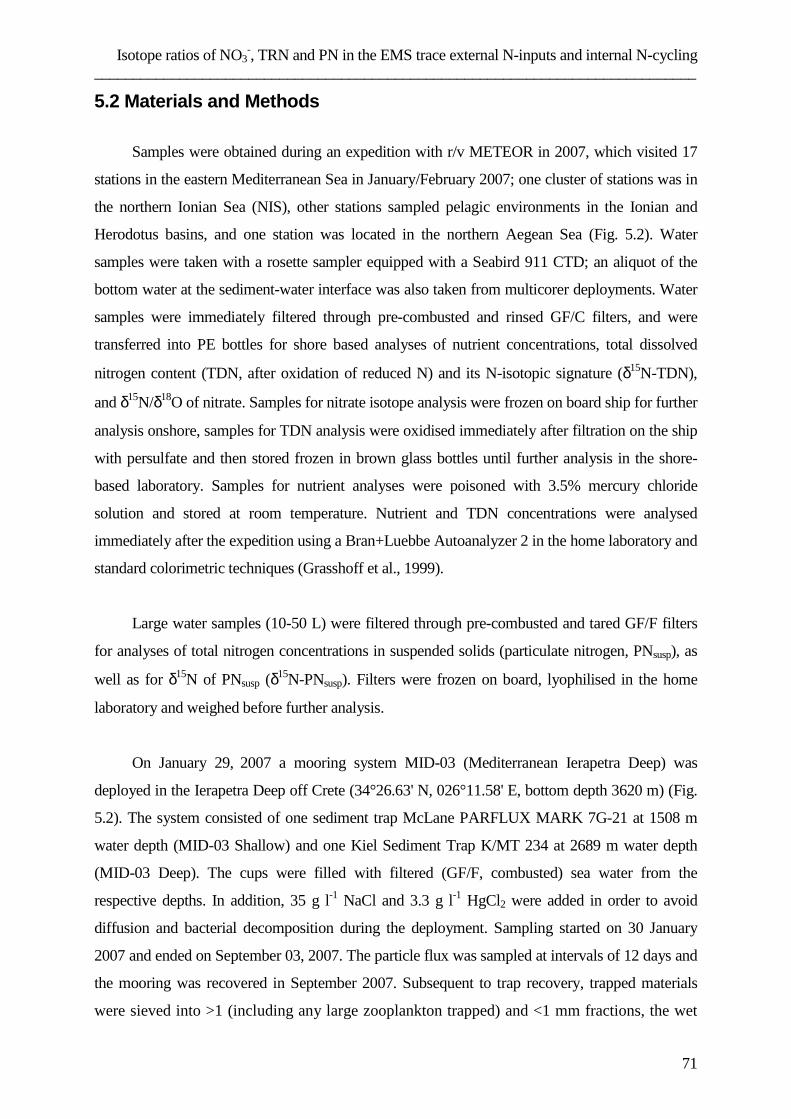
Isotope ratios of NO3-, TRN and PN in the EMS trace external N-inputs and internal N-cycling
______________________________________________________________________________
71
5.2 Materials and Methods
Samples were obtained during an expedition with r/v METEOR in 2007, which visited 17
stations in the eastern Mediterranean Sea in January/February 2007; one cluster of stations was in
the northern Ionian Sea (NIS), other stations sampled pelagic environments in the Ionian and
Herodotus basins, and one station was located in the northern Aegean Sea (Fig. 5.2). Water
samples were taken with a rosette sampler equipped with a Seabird 911 CTD; an aliquot of the
bottom water at the sediment-water interface was also taken from multicorer deployments. Water
samples were immediately filtered through pre-combusted and rinsed GF/C filters, and were
transferred into PE bottles for shore based analyses of nutrient concentrations, total dissolved
nitrogen content (TDN, after oxidation of reduced N) and its N-isotopic signature (δ15N-TDN),
and δ15N/δ18O of nitrate. Samples for nitrate isotope analysis were frozen on board ship for further
analysis onshore, samples for TDN analysis were oxidised immediately after filtration on the ship
with persulfate and then stored frozen in brown glass bottles until further analysis in the shore-
based laboratory. Samples for nutrient analyses were poisoned with 3.5% mercury chloride
solution and stored at room temperature. Nutrient and TDN concentrations were analysed
immediately after the expedition using a Bran+Luebbe Autoanalyzer 2 in the home laboratory and
standard colorimetric techniques (Grasshoff et al., 1999).
Large water samples (10-50 L) were filtered through pre-combusted and tared GF/F filters
for analyses of total nitrogen concentrations in suspended solids (particulate nitrogen, PNsusp), as
well as for δ15N of PNsusp (δ15N-PNsusp). Filters were frozen on board, lyophilised in the home
laboratory and weighed before further analysis.
On January 29, 2007 a mooring system MID-03 (Mediterranean Ierapetra Deep) was
deployed in the Ierapetra Deep off Crete (34°26.63' N, 026°11.58' E, bottom depth 3620 m) (Fig.
5.2). The system consisted of one sediment trap McLane PARFLUX MARK 7G-21 at 1508 m
water depth (MID-03 Shallow) and one Kiel Sediment Trap K/MT 234 at 2689 m water depth
(MID-03 Deep). The cups were filled with filtered (GF/F, combusted) sea water from the
respective depths. In addition, 35 g l-1 NaCl and 3.3 g l-1 HgCl2 were added in order to avoid
diffusion and bacterial decomposition during the deployment. Sampling started on 30 January
2007 and ended on September 03, 2007. The particle flux was sampled at intervals of 12 days and
the mooring was recovered in September 2007. Subsequent to trap recovery, trapped materials
were sieved into >1 (including any large zooplankton trapped) and <1 mm fractions, the wet
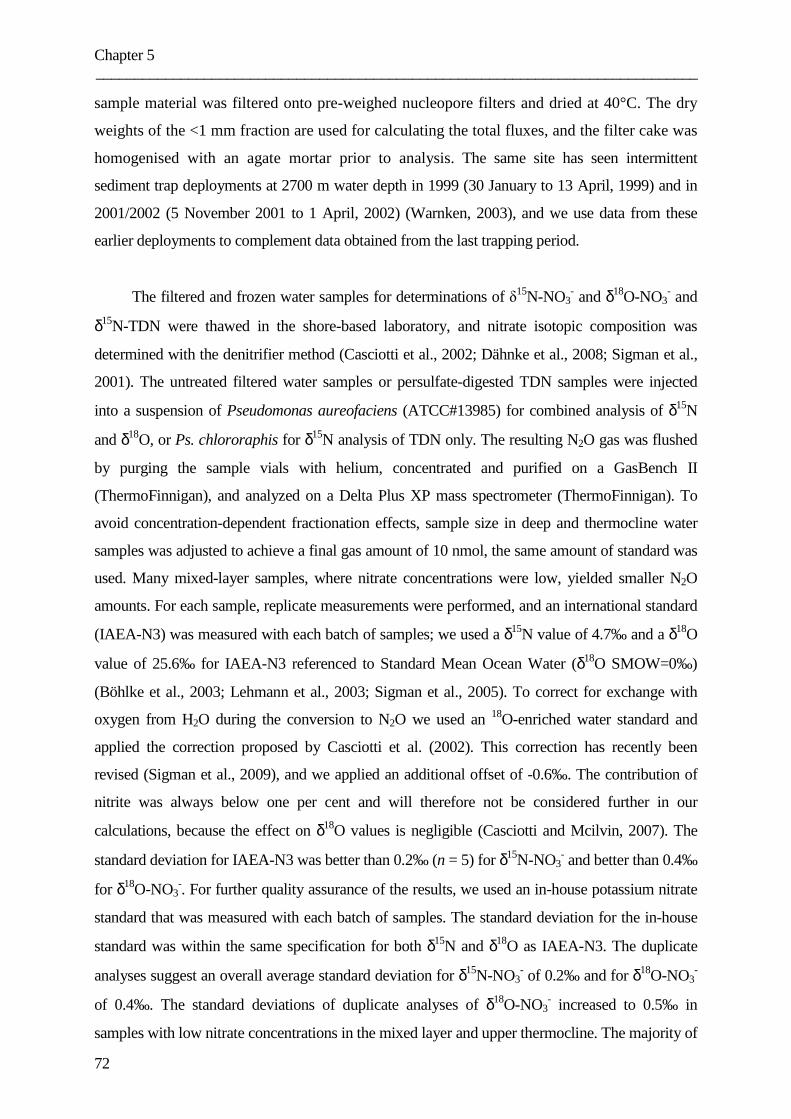
Chapter 5 ______________________________________________________________________________
72
sample material was filtered onto pre-weighed nucleopore filters and dried at 40°C. The dry
weights of the <1 mm fraction are used for calculating the total fluxes, and the filter cake was
homogenised with an agate mortar prior to analysis. The same site has seen intermittent
sediment trap deployments at 2700 m water depth in 1999 (30 January to 13 April, 1999) and in
2001/2002 (5 November 2001 to 1 April, 2002) (Warnken, 2003), and we use data from these
earlier deployments to complement data obtained from the last trapping period.
The filtered and frozen water samples for determinations of δ15N-NO3- and δ18O-NO3
- and
δ15N-TDN were thawed in the shore-based laboratory, and nitrate isotopic composition was
determined with the denitrifier method (Casciotti et al., 2002; Dähnke et al., 2008; Sigman et al.,
2001). The untreated filtered water samples or persulfate-digested TDN samples were injected
into a suspension of Pseudomonas aureofaciens (ATCC#13985) for combined analysis of δ15N
and δ18O, or Ps. chlororaphis for δ15N analysis of TDN only. The resulting N2O gas was flushed
by purging the sample vials with helium, concentrated and purified on a GasBench II
(ThermoFinnigan), and analyzed on a Delta Plus XP mass spectrometer (ThermoFinnigan). To
avoid concentration-dependent fractionation effects, sample size in deep and thermocline water
samples was adjusted to achieve a final gas amount of 10 nmol, the same amount of standard was
used. Many mixed-layer samples, where nitrate concentrations were low, yielded smaller N2O
amounts. For each sample, replicate measurements were performed, and an international standard
(IAEA-N3) was measured with each batch of samples; we used a δ15N value of 4.7‰ and a δ18O
value of 25.6‰ for IAEA-N3 referenced to Standard Mean Ocean Water (δ18O SMOW=0‰)
(Böhlke et al., 2003; Lehmann et al., 2003; Sigman et al., 2005). To correct for exchange with
oxygen from H2O during the conversion to N2O we used an 18O-enriched water standard and
applied the correction proposed by Casciotti et al. (2002). This correction has recently been
revised (Sigman et al., 2009), and we applied an additional offset of -0.6‰. The contribution of
nitrite was always below one per cent and will therefore not be considered further in our
calculations, because the effect on δ18O values is negligible (Casciotti and Mcilvin, 2007). The
standard deviation for IAEA-N3 was better than 0.2‰ (n = 5) for δ15N-NO3- and better than 0.4‰
for δ18O-NO3-. For further quality assurance of the results, we used an in-house potassium nitrate
standard that was measured with each batch of samples. The standard deviation for the in-house
standard was within the same specification for both δ15N and δ18O as IAEA-N3. The duplicate
analyses suggest an overall average standard deviation for δ15N-NO3- of 0.2‰ and for δ18O-NO3
-
of 0.4‰. The standard deviations of duplicate analyses of δ18O-NO3- increased to 0.5‰ in
samples with low nitrate concentrations in the mixed layer and upper thermocline. The majority of
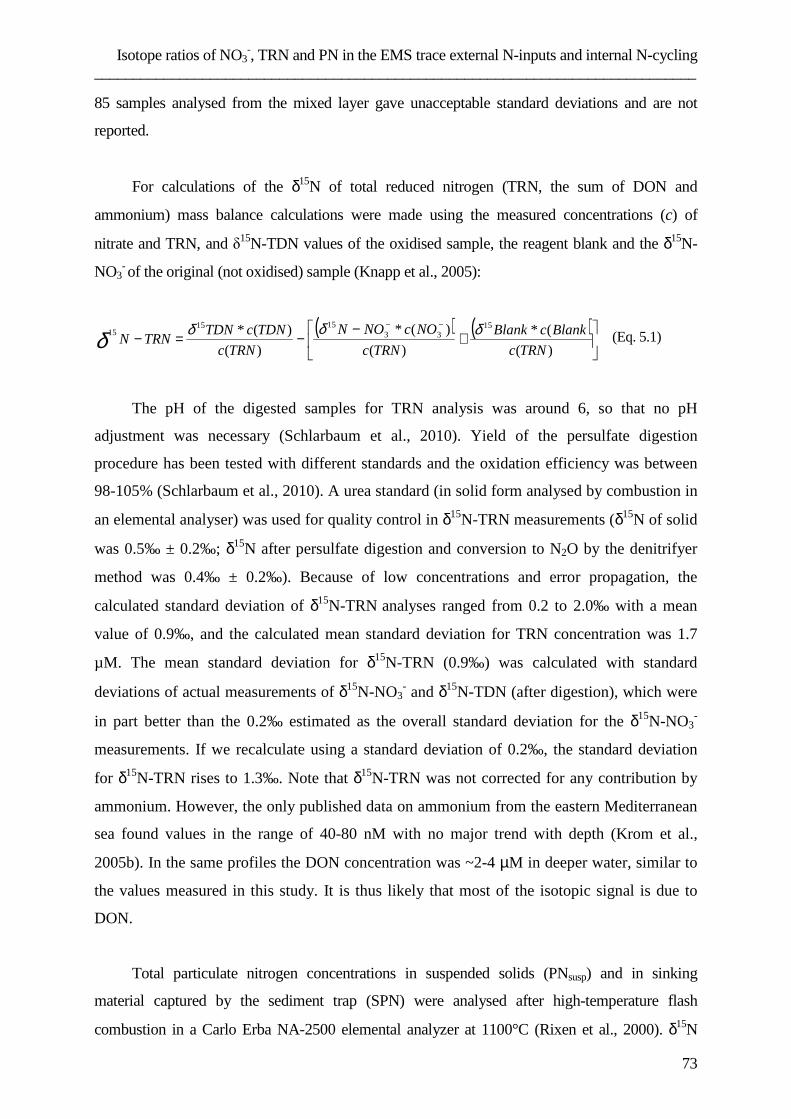
Isotope ratios of NO3-, TRN and PN in the EMS trace external N-inputs and internal N-cycling
______________________________________________________________________________
73
85 samples analysed from the mixed layer gave unacceptable standard deviations and are not
reported.
For calculations of the δ15N of total reduced nitrogen (TRN, the sum of DON and
ammonium) mass balance calculations were made using the measured concentrations (c) of
nitrate and TRN, and δ15N-TDN values of the oxidised sample, the reagent blank and the δ15N-
NO3- of the original (not oxidised) sample (Knapp et al., 2005):
( ) ( )
+
−−=−
−−
)(
(*
)(
)(*
)(
)(* 1533
151515
TRNc
BlankcBlank
TRNc
NOcNON
TRNc
TDNcTDNTRNN
δδδδ (Eq. 5.1)
The pH of the digested samples for TRN analysis was around 6, so that no pH
adjustment was necessary (Schlarbaum et al., 2010). Yield of the persulfate digestion
procedure has been tested with different standards and the oxidation efficiency was between
98-105% (Schlarbaum et al., 2010). A urea standard (in solid form analysed by combustion in
an elemental analyser) was used for quality control in δ15N-TRN measurements (δ15N of solid
was 0.5‰ ± 0.2‰; δ15N after persulfate digestion and conversion to N2O by the denitrifyer
method was 0.4‰ ± 0.2‰). Because of low concentrations and error propagation, the
calculated standard deviation of δ15N-TRN analyses ranged from 0.2 to 2.0‰ with a mean
value of 0.9‰, and the calculated mean standard deviation for TRN concentration was 1.7
µM. The mean standard deviation for δ15N-TRN (0.9‰) was calculated with standard
deviations of actual measurements of δ15N-NO3- and δ15N-TDN (after digestion), which were
in part better than the 0.2‰ estimated as the overall standard deviation for the δ15N-NO3-
measurements. If we recalculate using a standard deviation of 0.2‰, the standard deviation
for δ15N-TRN rises to 1.3‰. Note that δ15N-TRN was not corrected for any contribution by
ammonium. However, the only published data on ammonium from the eastern Mediterranean
sea found values in the range of 40-80 nM with no major trend with depth (Krom et al.,
2005b). In the same profiles the DON concentration was ~2-4 µM in deeper water, similar to
the values measured in this study. It is thus likely that most of the isotopic signal is due to
DON.
Total particulate nitrogen concentrations in suspended solids (PNsusp) and in sinking
material captured by the sediment trap (SPN) were analysed after high-temperature flash
combustion in a Carlo Erba NA-2500 elemental analyzer at 1100°C (Rixen et al., 2000). δ15N
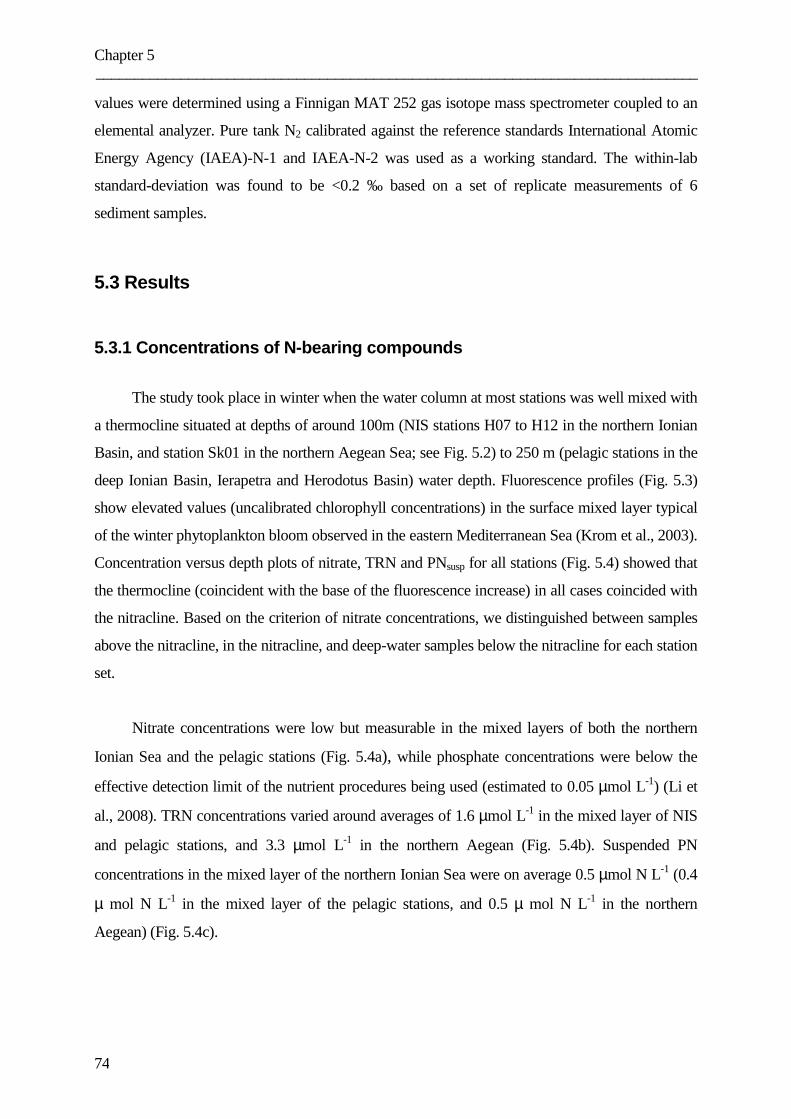
Chapter 5 ______________________________________________________________________________
74
values were determined using a Finnigan MAT 252 gas isotope mass spectrometer coupled to an
elemental analyzer. Pure tank N2 calibrated against the reference standards International Atomic
Energy Agency (IAEA)-N-1 and IAEA-N-2 was used as a working standard. The within-lab
standard-deviation was found to be <0.2 ‰ based on a set of replicate measurements of 6
sediment samples.
5.3 Results
5.3.1 Concentrations of N-bearing compounds
The study took place in winter when the water column at most stations was well mixed with
a thermocline situated at depths of around 100m (NIS stations H07 to H12 in the northern Ionian
Basin, and station Sk01 in the northern Aegean Sea; see Fig. 5.2) to 250 m (pelagic stations in the
deep Ionian Basin, Ierapetra and Herodotus Basin) water depth. Fluorescence profiles (Fig. 5.3)
show elevated values (uncalibrated chlorophyll concentrations) in the surface mixed layer typical
of the winter phytoplankton bloom observed in the eastern Mediterranean Sea (Krom et al., 2003).
Concentration versus depth plots of nitrate, TRN and PNsusp for all stations (Fig. 5.4) showed that
the thermocline (coincident with the base of the fluorescence increase) in all cases coincided with
the nitracline. Based on the criterion of nitrate concentrations, we distinguished between samples
above the nitracline, in the nitracline, and deep-water samples below the nitracline for each station
set.
Nitrate concentrations were low but measurable in the mixed layers of both the northern
Ionian Sea and the pelagic stations (Fig. 5.4a), while phosphate concentrations were below the
effective detection limit of the nutrient procedures being used (estimated to 0.05 µmol L-1) (Li et
al., 2008). TRN concentrations varied around averages of 1.6 µmol L-1 in the mixed layer of NIS
and pelagic stations, and 3.3 µmol L-1 in the northern Aegean (Fig. 5.4b). Suspended PN
concentrations in the mixed layer of the northern Ionian Sea were on average 0.5 µmol N L-1 (0.4
µ mol N L-1 in the mixed layer of the pelagic stations, and 0.5 µ mol N L-1 in the northern
Aegean) (Fig. 5.4c).
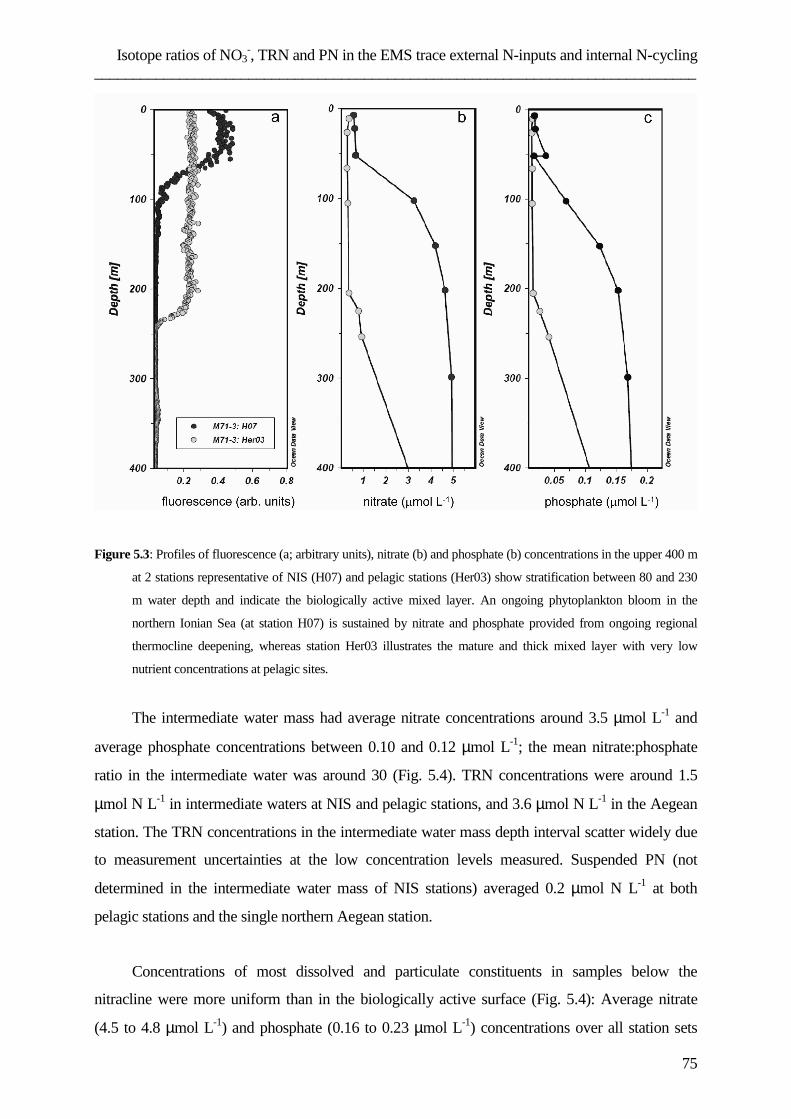
Isotope ratios of NO3-, TRN and PN in the EMS trace external N-inputs and internal N-cycling
______________________________________________________________________________
75
Figure 5.3: Profiles of fluorescence (a; arbitrary units), nitrate (b) and phosphate (b) concentrations in the upper 400 m
at 2 stations representative of NIS (H07) and pelagic stations (Her03) show stratification between 80 and 230
m water depth and indicate the biologically active mixed layer. An ongoing phytoplankton bloom in the
northern Ionian Sea (at station H07) is sustained by nitrate and phosphate provided from ongoing regional
thermocline deepening, whereas station Her03 illustrates the mature and thick mixed layer with very low
nutrient concentrations at pelagic sites.
The intermediate water mass had average nitrate concentrations around 3.5 µmol L-1 and
average phosphate concentrations between 0.10 and 0.12 µmol L-1; the mean nitrate:phosphate
ratio in the intermediate water was around 30 (Fig. 5.4). TRN concentrations were around 1.5
µmol N L-1 in intermediate waters at NIS and pelagic stations, and 3.6 µmol N L-1 in the Aegean
station. The TRN concentrations in the intermediate water mass depth interval scatter widely due
to measurement uncertainties at the low concentration levels measured. Suspended PN (not
determined in the intermediate water mass of NIS stations) averaged 0.2 µmol N L-1 at both
pelagic stations and the single northern Aegean station.
Concentrations of most dissolved and particulate constituents in samples below the
nitracline were more uniform than in the biologically active surface (Fig. 5.4): Average nitrate
(4.5 to 4.8 µmol L-1) and phosphate (0.16 to 0.23 µmol L-1) concentrations over all station sets
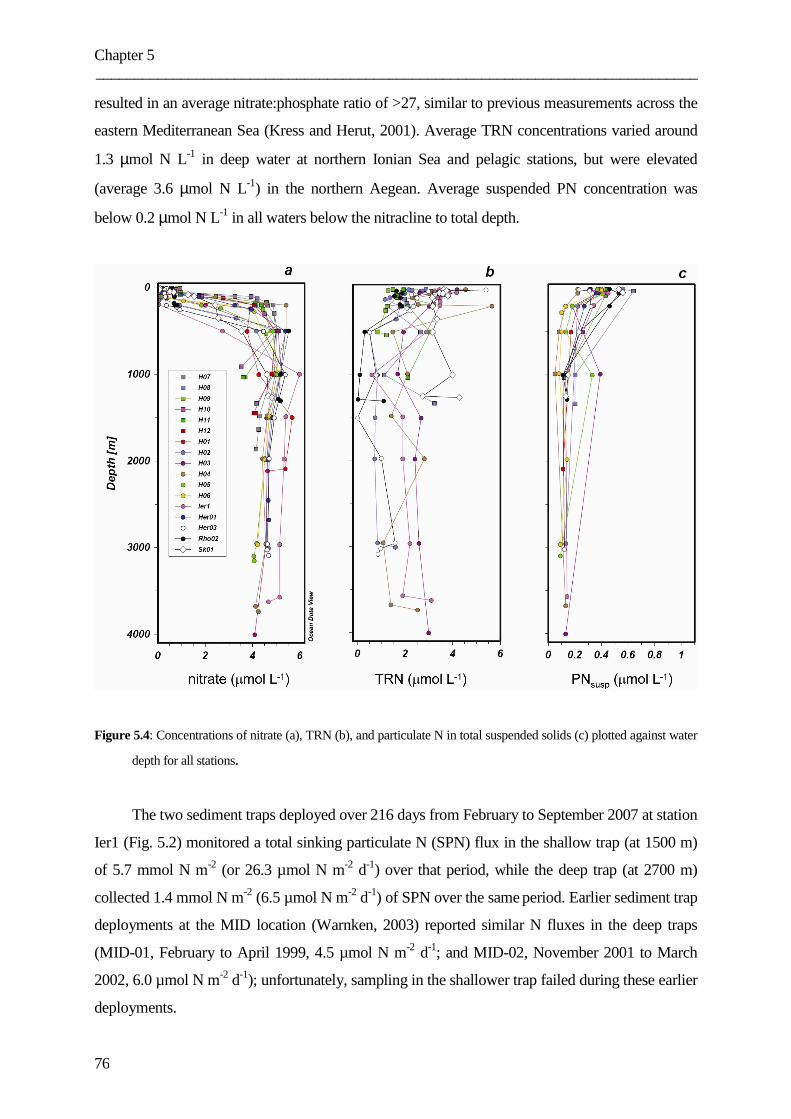
Chapter 5 ______________________________________________________________________________
76
resulted in an average nitrate:phosphate ratio of >27, similar to previous measurements across the
eastern Mediterranean Sea (Kress and Herut, 2001). Average TRN concentrations varied around
1.3 µmol N L-1 in deep water at northern Ionian Sea and pelagic stations, but were elevated
(average 3.6 µmol N L-1) in the northern Aegean. Average suspended PN concentration was
below 0.2 µmol N L-1 in all waters below the nitracline to total depth.
Figure 5.4: Concentrations of nitrate (a), TRN (b), and particulate N in total suspended solids (c) plotted against water
depth for all stations.
The two sediment traps deployed over 216 days from February to September 2007 at station
Ier1 (Fig. 5.2) monitored a total sinking particulate N (SPN) flux in the shallow trap (at 1500 m)
of 5.7 mmol N m-2 (or 26.3 µmol N m-2 d-1) over that period, while the deep trap (at 2700 m)
collected 1.4 mmol N m-2 (6.5 µmol N m-2 d-1) of SPN over the same period. Earlier sediment trap
deployments at the MID location (Warnken, 2003) reported similar N fluxes in the deep traps
(MID-01, February to April 1999, 4.5 µmol N m-2 d-1; and MID-02, November 2001 to March
2002, 6.0 µmol N m-2 d-1); unfortunately, sampling in the shallower trap failed during these earlier
deployments.
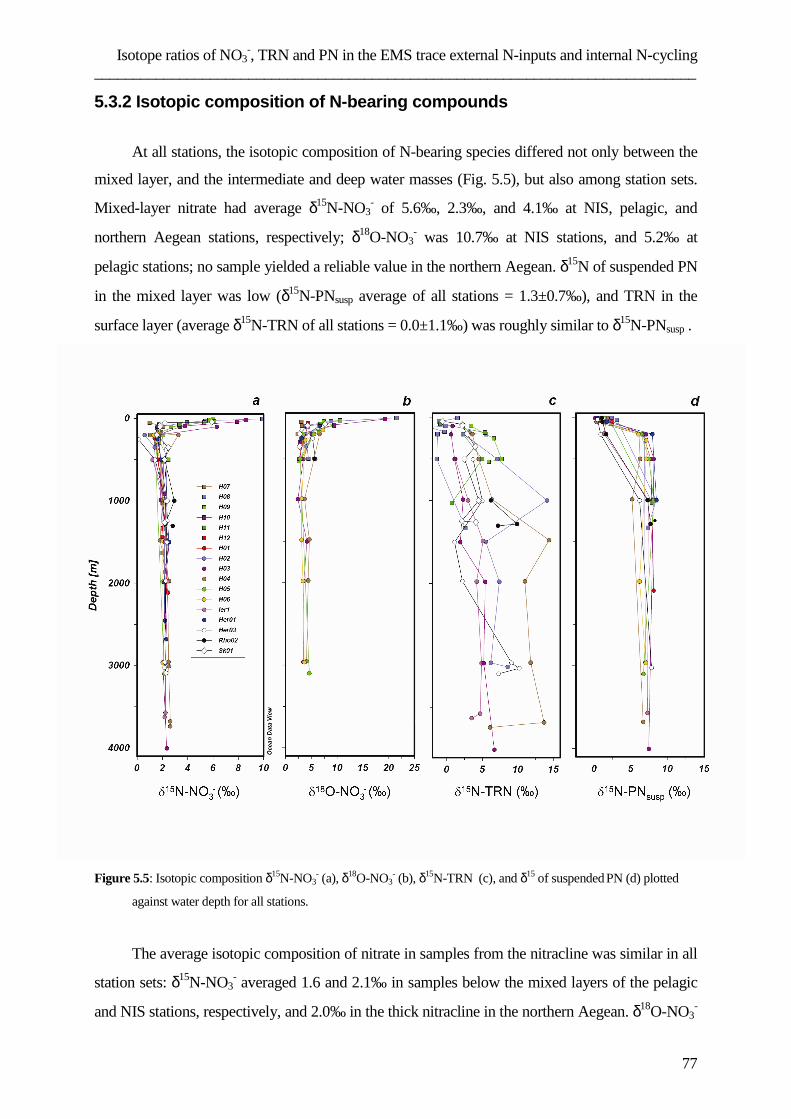
Isotope ratios of NO3-, TRN and PN in the EMS trace external N-inputs and internal N-cycling
______________________________________________________________________________
77
5.3.2 Isotopic composition of N-bearing compounds
At all stations, the isotopic composition of N-bearing species differed not only between the
mixed layer, and the intermediate and deep water masses (Fig. 5.5), but also among station sets.
Mixed-layer nitrate had average δ15N-NO3- of 5.6‰, 2.3‰, and 4.1‰ at NIS, pelagic, and
northern Aegean stations, respectively; δ18O-NO3- was 10.7‰ at NIS stations, and 5.2‰ at
pelagic stations; no sample yielded a reliable value in the northern Aegean. δ15N of suspended PN
in the mixed layer was low (δ15N-PNsusp average of all stations = 1.3±0.7‰), and TRN in the
surface layer (average δ15N-TRN of all stations = 0.0±1.1‰) was roughly similar to δ15N-PNsusp .
Figure 5.5: Isotopic composition δ15N-NO3- (a), δ18O-NO3
- (b), δ15N-TRN (c), and δ15 of suspended PN (d) plotted
against water depth for all stations.
The average isotopic composition of nitrate in samples from the nitracline was similar in all
station sets: δ15N-NO3- averaged 1.6 and 2.1‰ in samples below the mixed layers of the pelagic
and NIS stations, respectively, and 2.0‰ in the thick nitracline in the northern Aegean. δ18O-NO3-
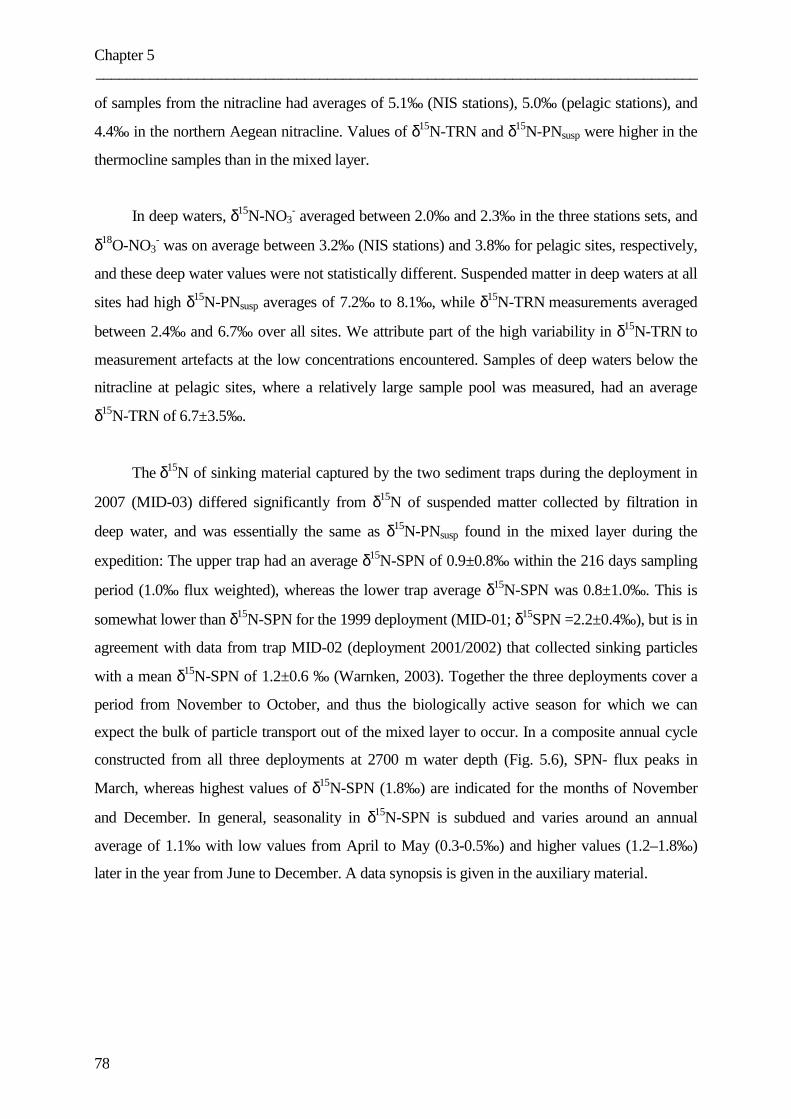
Chapter 5 ______________________________________________________________________________
78
of samples from the nitracline had averages of 5.1‰ (NIS stations), 5.0‰ (pelagic stations), and
4.4‰ in the northern Aegean nitracline. Values of δ15N-TRN and δ15N-PNsusp were higher in the
thermocline samples than in the mixed layer.
In deep waters, δ15N-NO3- averaged between 2.0‰ and 2.3‰ in the three stations sets, and
δ18O-NO3- was on average between 3.2‰ (NIS stations) and 3.8‰ for pelagic sites, respectively,
and these deep water values were not statistically different. Suspended matter in deep waters at all
sites had high δ15N-PNsusp averages of 7.2‰ to 8.1‰, while δ15N-TRN measurements averaged
between 2.4‰ and 6.7‰ over all sites. We attribute part of the high variability in δ15N-TRN to
measurement artefacts at the low concentrations encountered. Samples of deep waters below the
nitracline at pelagic sites, where a relatively large sample pool was measured, had an average
δ15N-TRN of 6.7±3.5‰.
The δ15N of sinking material captured by the two sediment traps during the deployment in
2007 (MID-03) differed significantly from δ15N of suspended matter collected by filtration in
deep water, and was essentially the same as δ15N-PNsusp found in the mixed layer during the
expedition: The upper trap had an average δ15N-SPN of 0.9±0.8‰ within the 216 days sampling
period (1.0‰ flux weighted), whereas the lower trap average δ15N-SPN was 0.8±1.0‰. This is
somewhat lower than δ15N-SPN for the 1999 deployment (MID-01; δ15SPN =2.2±0.4‰), but is in
agreement with data from trap MID-02 (deployment 2001/2002) that collected sinking particles
with a mean δ15N-SPN of 1.2±0.6 ‰ (Warnken, 2003). Together the three deployments cover a
period from November to October, and thus the biologically active season for which we can
expect the bulk of particle transport out of the mixed layer to occur. In a composite annual cycle
constructed from all three deployments at 2700 m water depth (Fig. 5.6), SPN- flux peaks in
March, whereas highest values of δ15N-SPN (1.8‰) are indicated for the months of November
and December. In general, seasonality in δ15N-SPN is subdued and varies around an annual
average of 1.1‰ with low values from April to May (0.3-0.5‰) and higher values (1.2–1.8‰)
later in the year from June to December. A data synopsis is given in the auxiliary material.
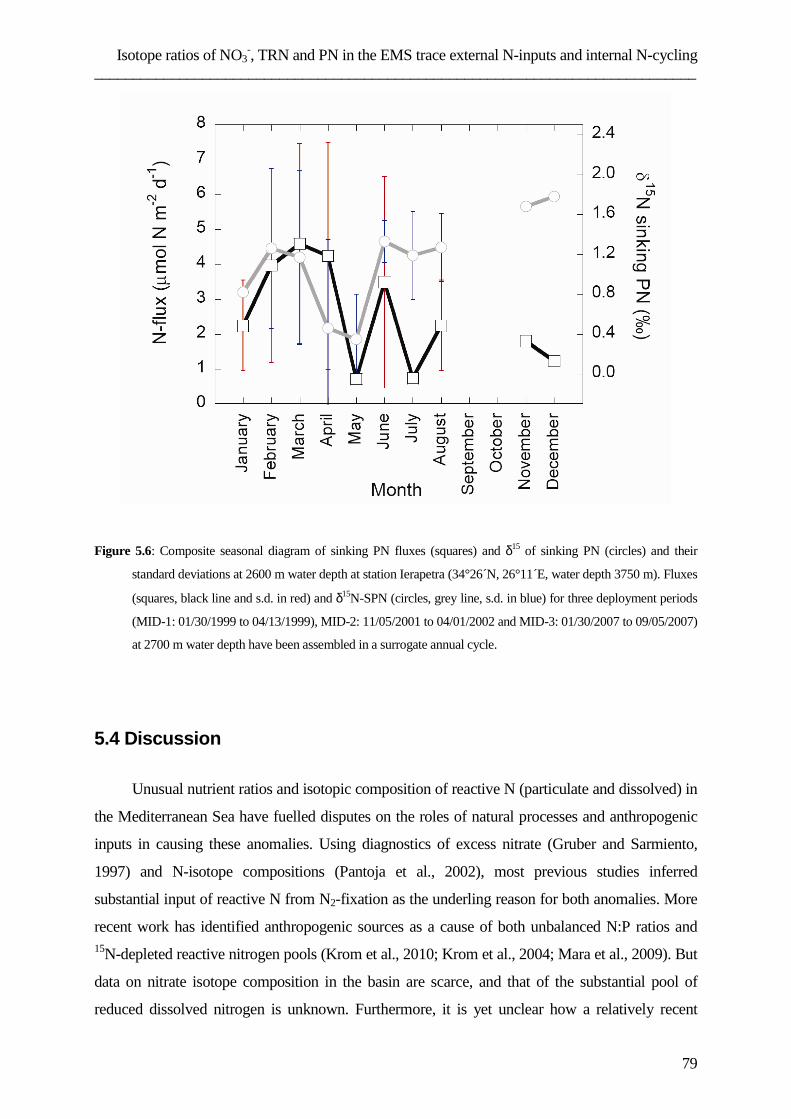
Isotope ratios of NO3-, TRN and PN in the EMS trace external N-inputs and internal N-cycling
______________________________________________________________________________
79
Figure 5.6: Composite seasonal diagram of sinking PN fluxes (squares) and δ15 of sinking PN (circles) and their
standard deviations at 2600 m water depth at station Ierapetra (34°26´N, 26°11´E, water depth 3750 m). Fluxes
(squares, black line and s.d. in red) and δ15N-SPN (circles, grey line, s.d. in blue) for three deployment periods
(MID-1: 01/30/1999 to 04/13/1999), MID-2: 11/05/2001 to 04/01/2002 and MID-3: 01/30/2007 to 09/05/2007)
at 2700 m water depth have been assembled in a surrogate annual cycle.
5.4 Discussion
Unusual nutrient ratios and isotopic composition of reactive N (particulate and dissolved) in
the Mediterranean Sea have fuelled disputes on the roles of natural processes and anthropogenic
inputs in causing these anomalies. Using diagnostics of excess nitrate (Gruber and Sarmiento,
1997) and N-isotope compositions (Pantoja et al., 2002), most previous studies inferred
substantial input of reactive N from N2-fixation as the underling reason for both anomalies. More
recent work has identified anthropogenic sources as a cause of both unbalanced N:P ratios and 15N-depleted reactive nitrogen pools (Krom et al., 2010; Krom et al., 2004; Mara et al., 2009). But
data on nitrate isotope composition in the basin are scarce, and that of the substantial pool of
reduced dissolved nitrogen is unknown. Furthermore, it is yet unclear how a relatively recent
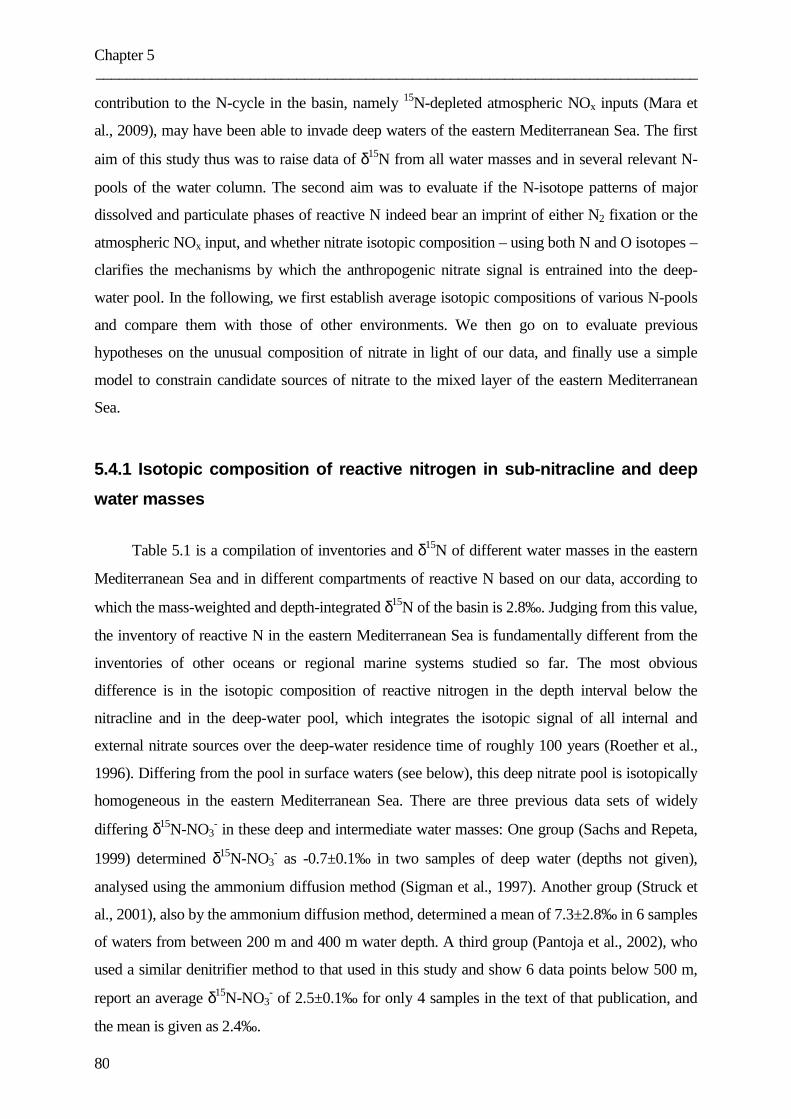
Chapter 5 ______________________________________________________________________________
80
contribution to the N-cycle in the basin, namely 15N-depleted atmospheric NOx inputs (Mara et
al., 2009), may have been able to invade deep waters of the eastern Mediterranean Sea. The first
aim of this study thus was to raise data of δ15N from all water masses and in several relevant N-
pools of the water column. The second aim was to evaluate if the N-isotope patterns of major
dissolved and particulate phases of reactive N indeed bear an imprint of either N2 fixation or the
atmospheric NOx input, and whether nitrate isotopic composition – using both N and O isotopes –
clarifies the mechanisms by which the anthropogenic nitrate signal is entrained into the deep-
water pool. In the following, we first establish average isotopic compositions of various N-pools
and compare them with those of other environments. We then go on to evaluate previous
hypotheses on the unusual composition of nitrate in light of our data, and finally use a simple
model to constrain candidate sources of nitrate to the mixed layer of the eastern Mediterranean
Sea.
5.4.1 Isotopic composition of reactive nitrogen in sub-nitracline and deep
water masses
Table 5.1 is a compilation of inventories and δ15N of different water masses in the eastern
Mediterranean Sea and in different compartments of reactive N based on our data, according to
which the mass-weighted and depth-integrated δ15N of the basin is 2.8‰. Judging from this value,
the inventory of reactive N in the eastern Mediterranean Sea is fundamentally different from the
inventories of other oceans or regional marine systems studied so far. The most obvious
difference is in the isotopic composition of reactive nitrogen in the depth interval below the
nitracline and in the deep-water pool, which integrates the isotopic signal of all internal and
external nitrate sources over the deep-water residence time of roughly 100 years (Roether et al.,
1996). Differing from the pool in surface waters (see below), this deep nitrate pool is isotopically
homogeneous in the eastern Mediterranean Sea. There are three previous data sets of widely
differing δ15N-NO3- in these deep and intermediate water masses: One group (Sachs and Repeta,
1999) determined δ15N-NO3- as -0.7±0.1‰ in two samples of deep water (depths not given),
analysed using the ammonium diffusion method (Sigman et al., 1997). Another group (Struck et
al., 2001), also by the ammonium diffusion method, determined a mean of 7.3±2.8‰ in 6 samples
of waters from between 200 m and 400 m water depth. A third group (Pantoja et al., 2002), who
used a similar denitrifier method to that used in this study and show 6 data points below 500 m,
report an average δ15N-NO3- of 2.5±0.1‰ for only 4 samples in the text of that publication, and
the mean is given as 2.4‰.
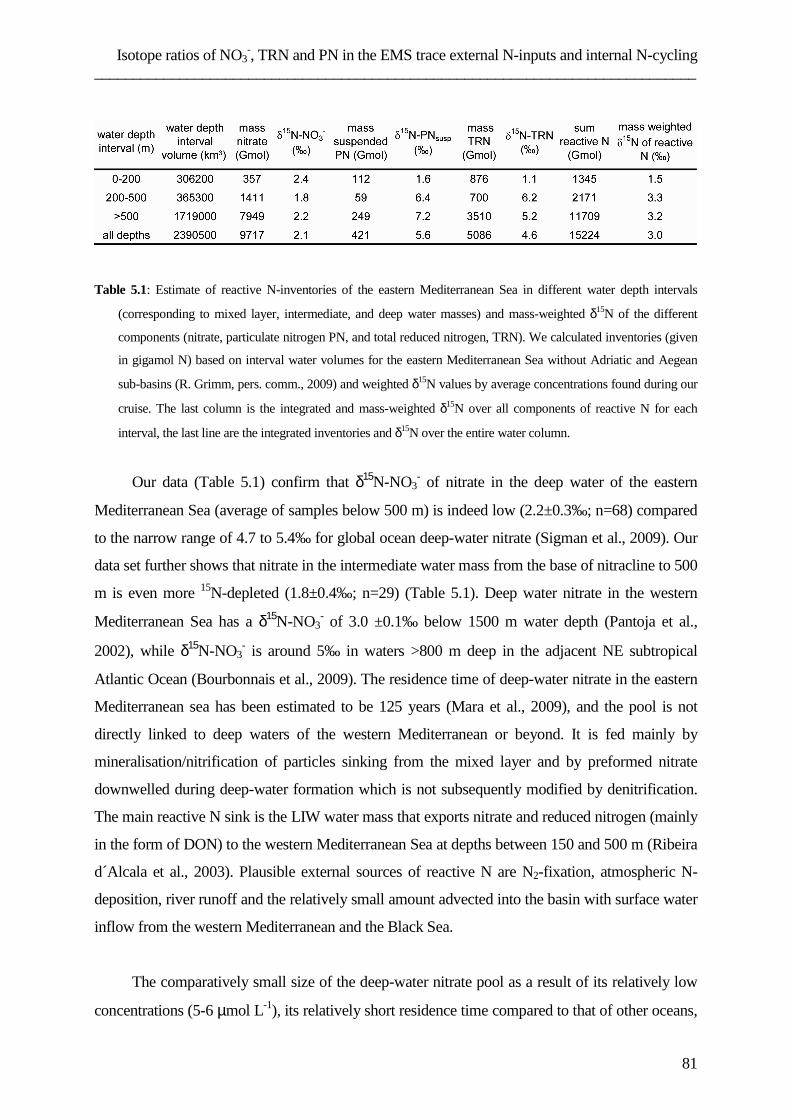
Isotope ratios of NO3-, TRN and PN in the EMS trace external N-inputs and internal N-cycling
______________________________________________________________________________
81
Table 5.1: Estimate of reactive N-inventories of the eastern Mediterranean Sea in different water depth intervals
(corresponding to mixed layer, intermediate, and deep water masses) and mass-weighted δ15N of the different
components (nitrate, particulate nitrogen PN, and total reduced nitrogen, TRN). We calculated inventories (given
in gigamol N) based on interval water volumes for the eastern Mediterranean Sea without Adriatic and Aegean
sub-basins (R. Grimm, pers. comm., 2009) and weighted δ15N values by average concentrations found during our
cruise. The last column is the integrated and mass-weighted δ15N over all components of reactive N for each
interval, the last line are the integrated inventories and δ15N over the entire water column.
Our data (Table 5.1) confirm that δ15N-NO3- of nitrate in the deep water of the eastern
Mediterranean Sea (average of samples below 500 m) is indeed low (2.2±0.3‰; n=68) compared
to the narrow range of 4.7 to 5.4‰ for global ocean deep-water nitrate (Sigman et al., 2009). Our
data set further shows that nitrate in the intermediate water mass from the base of nitracline to 500
m is even more 15N-depleted (1.8±0.4‰; n=29) (Table 5.1). Deep water nitrate in the western
Mediterranean Sea has a δ15N-NO3- of 3.0 ±0.1‰ below 1500 m water depth (Pantoja et al.,
2002), while δ15N-NO3- is around 5‰ in waters >800 m deep in the adjacent NE subtropical
Atlantic Ocean (Bourbonnais et al., 2009). The residence time of deep-water nitrate in the eastern
Mediterranean sea has been estimated to be 125 years (Mara et al., 2009), and the pool is not
directly linked to deep waters of the western Mediterranean or beyond. It is fed mainly by
mineralisation/nitrification of particles sinking from the mixed layer and by preformed nitrate
downwelled during deep-water formation which is not subsequently modified by denitrification.
The main reactive N sink is the LIW water mass that exports nitrate and reduced nitrogen (mainly
in the form of DON) to the western Mediterranean Sea at depths between 150 and 500 m (Ribeira
d´Alcala et al., 2003). Plausible external sources of reactive N are N2-fixation, atmospheric N-
deposition, river runoff and the relatively small amount advected into the basin with surface water
inflow from the western Mediterranean and the Black Sea.
The comparatively small size of the deep-water nitrate pool as a result of its relatively low
concentrations (5-6 µmol L-1), its relatively short residence time compared to that of other oceans,
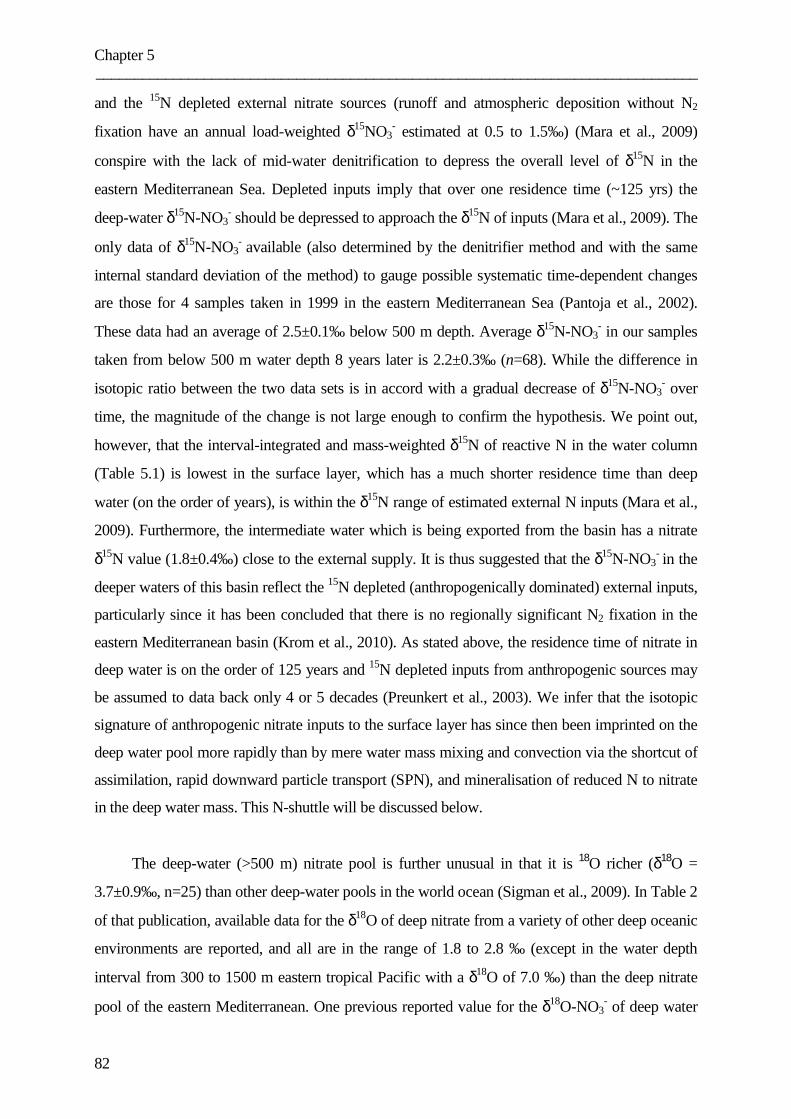
Chapter 5 ______________________________________________________________________________
82
and the 15N depleted external nitrate sources (runoff and atmospheric deposition without N2
fixation have an annual load-weighted δ15NO3- estimated at 0.5 to 1.5‰) (Mara et al., 2009)
conspire with the lack of mid-water denitrification to depress the overall level of δ15N in the
eastern Mediterranean Sea. Depleted inputs imply that over one residence time (~125 yrs) the
deep-water δ15N-NO3- should be depressed to approach the δ15N of inputs (Mara et al., 2009). The
only data of δ15N-NO3- available (also determined by the denitrifier method and with the same
internal standard deviation of the method) to gauge possible systematic time-dependent changes
are those for 4 samples taken in 1999 in the eastern Mediterranean Sea (Pantoja et al., 2002).
These data had an average of 2.5±0.1‰ below 500 m depth. Average δ15N-NO3- in our samples
taken from below 500 m water depth 8 years later is 2.2±0.3‰ (n=68). While the difference in
isotopic ratio between the two data sets is in accord with a gradual decrease of δ15N-NO3- over
time, the magnitude of the change is not large enough to confirm the hypothesis. We point out,
however, that the interval-integrated and mass-weighted δ15N of reactive N in the water column
(Table 5.1) is lowest in the surface layer, which has a much shorter residence time than deep
water (on the order of years), is within the δ15N range of estimated external N inputs (Mara et al.,
2009). Furthermore, the intermediate water which is being exported from the basin has a nitrate
δ15N value (1.8±0.4‰) close to the external supply. It is thus suggested that the δ15N-NO3- in the
deeper waters of this basin reflect the 15N depleted (anthropogenically dominated) external inputs,
particularly since it has been concluded that there is no regionally significant N2 fixation in the
eastern Mediterranean basin (Krom et al., 2010). As stated above, the residence time of nitrate in
deep water is on the order of 125 years and 15N depleted inputs from anthropogenic sources may
be assumed to data back only 4 or 5 decades (Preunkert et al., 2003). We infer that the isotopic
signature of anthropogenic nitrate inputs to the surface layer has since then been imprinted on the
deep water pool more rapidly than by mere water mass mixing and convection via the shortcut of
assimilation, rapid downward particle transport (SPN), and mineralisation of reduced N to nitrate
in the deep water mass. This N-shuttle will be discussed below.
The deep-water (>500 m) nitrate pool is further unusual in that it is 18O richer (δ18O =
3.7±0.9‰, n=25) than other deep-water pools in the world ocean (Sigman et al., 2009). In Table 2
of that publication, available data for the δ18O of deep nitrate from a variety of other deep oceanic
environments are reported, and all are in the range of 1.8 to 2.8 ‰ (except in the water depth
interval from 300 to 1500 m eastern tropical Pacific with a δ18O of 7.0 ‰) than the deep nitrate
pool of the eastern Mediterranean. One previous reported value for the δ18O-NO3- of deep water
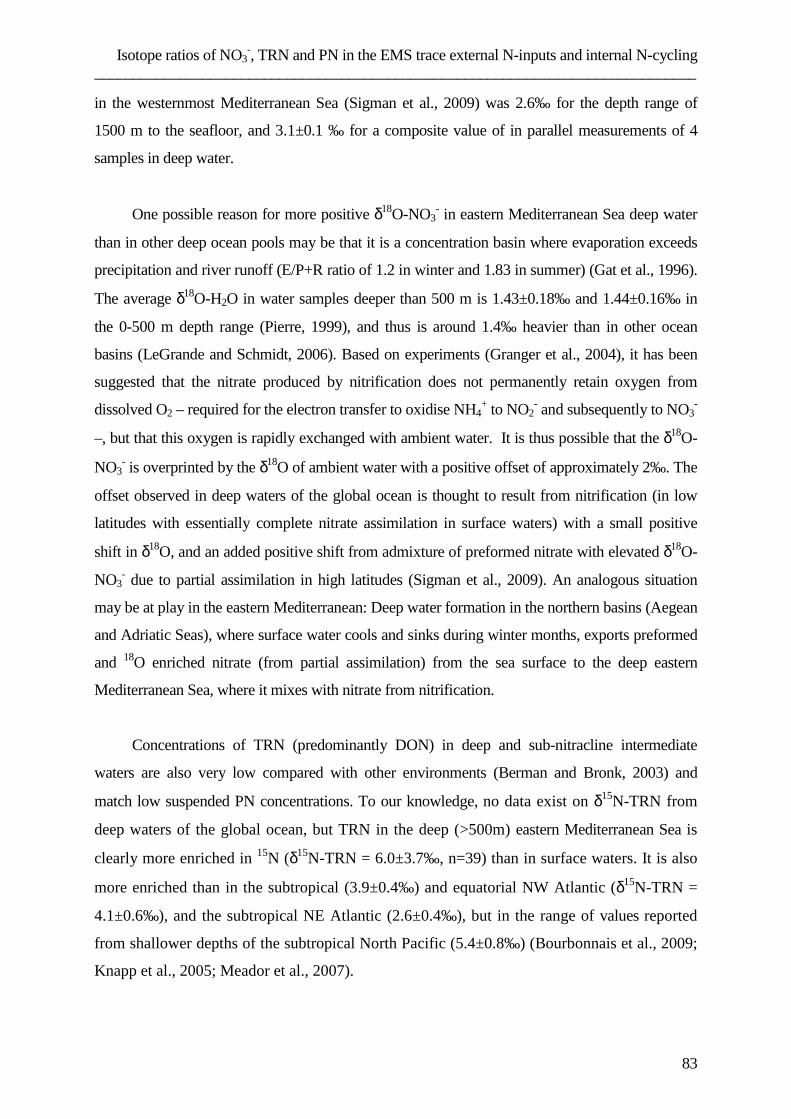
Isotope ratios of NO3-, TRN and PN in the EMS trace external N-inputs and internal N-cycling
______________________________________________________________________________
83
in the westernmost Mediterranean Sea (Sigman et al., 2009) was 2.6‰ for the depth range of
1500 m to the seafloor, and 3.1±0.1 ‰ for a composite value of in parallel measurements of 4
samples in deep water.
One possible reason for more positive δ18O-NO3- in eastern Mediterranean Sea deep water
than in other deep ocean pools may be that it is a concentration basin where evaporation exceeds
precipitation and river runoff (E/P+R ratio of 1.2 in winter and 1.83 in summer) (Gat et al., 1996).
The average δ18O-H2O in water samples deeper than 500 m is 1.43±0.18‰ and 1.44±0.16‰ in
the 0-500 m depth range (Pierre, 1999), and thus is around 1.4‰ heavier than in other ocean
basins (LeGrande and Schmidt, 2006). Based on experiments (Granger et al., 2004), it has been
suggested that the nitrate produced by nitrification does not permanently retain oxygen from
dissolved O2 – required for the electron transfer to oxidise NH4+ to NO2
- and subsequently to NO3-
–, but that this oxygen is rapidly exchanged with ambient water. It is thus possible that the δ18O-
NO3- is overprinted by the δ18O of ambient water with a positive offset of approximately 2‰. The
offset observed in deep waters of the global ocean is thought to result from nitrification (in low
latitudes with essentially complete nitrate assimilation in surface waters) with a small positive
shift in δ18O, and an added positive shift from admixture of preformed nitrate with elevated δ18O-
NO3- due to partial assimilation in high latitudes (Sigman et al., 2009). An analogous situation
may be at play in the eastern Mediterranean: Deep water formation in the northern basins (Aegean
and Adriatic Seas), where surface water cools and sinks during winter months, exports preformed
and 18O enriched nitrate (from partial assimilation) from the sea surface to the deep eastern
Mediterranean Sea, where it mixes with nitrate from nitrification.
Concentrations of TRN (predominantly DON) in deep and sub-nitracline intermediate
waters are also very low compared with other environments (Berman and Bronk, 2003) and
match low suspended PN concentrations. To our knowledge, no data exist on δ15N-TRN from
deep waters of the global ocean, but TRN in the deep (>500m) eastern Mediterranean Sea is
clearly more enriched in 15N (δ15N-TRN = 6.0±3.7‰, n=39) than in surface waters. It is also
more enriched than in the subtropical (3.9±0.4‰) and equatorial NW Atlantic (δ15N-TRN =
4.1±0.6‰), and the subtropical NE Atlantic (2.6±0.4‰), but in the range of values reported
from shallower depths of the subtropical North Pacific (5.4±0.8‰) (Bourbonnais et al., 2009;
Knapp et al., 2005; Meador et al., 2007).
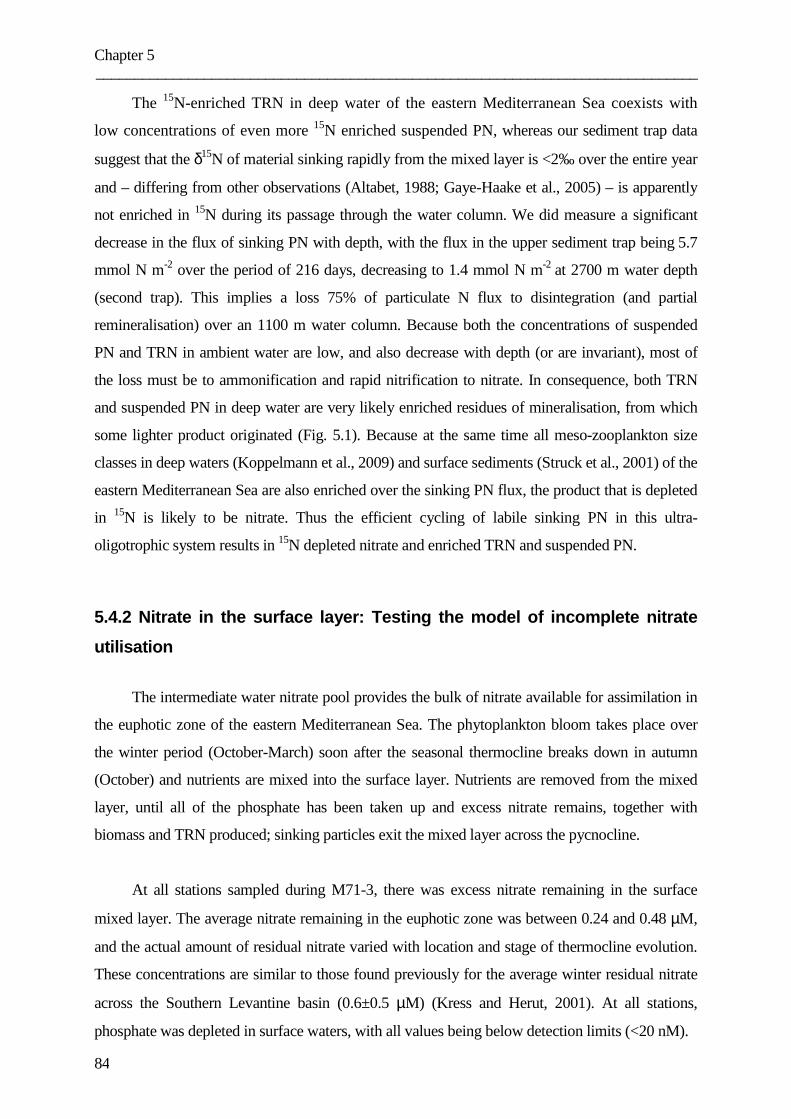
Chapter 5 ______________________________________________________________________________
84
The 15N-enriched TRN in deep water of the eastern Mediterranean Sea coexists with
low concentrations of even more 15N enriched suspended PN, whereas our sediment trap data
suggest that the δ15N of material sinking rapidly from the mixed layer is <2‰ over the entire year
and – differing from other observations (Altabet, 1988; Gaye-Haake et al., 2005) – is apparently
not enriched in 15N during its passage through the water column. We did measure a significant
decrease in the flux of sinking PN with depth, with the flux in the upper sediment trap being 5.7
mmol N m-2 over the period of 216 days, decreasing to 1.4 mmol N m-2 at 2700 m water depth
(second trap). This implies a loss 75% of particulate N flux to disintegration (and partial
remineralisation) over an 1100 m water column. Because both the concentrations of suspended
PN and TRN in ambient water are low, and also decrease with depth (or are invariant), most of
the loss must be to ammonification and rapid nitrification to nitrate. In consequence, both TRN
and suspended PN in deep water are very likely enriched residues of mineralisation, from which
some lighter product originated (Fig. 5.1). Because at the same time all meso-zooplankton size
classes in deep waters (Koppelmann et al., 2009) and surface sediments (Struck et al., 2001) of the
eastern Mediterranean Sea are also enriched over the sinking PN flux, the product that is depleted
in 15N is likely to be nitrate. Thus the efficient cycling of labile sinking PN in this ultra-
oligotrophic system results in 15N depleted nitrate and enriched TRN and suspended PN.
5.4.2 Nitrate in the surface layer: Testing the model of incomplete nitrate
utilisation
The intermediate water nitrate pool provides the bulk of nitrate available for assimilation in
the euphotic zone of the eastern Mediterranean Sea. The phytoplankton bloom takes place over
the winter period (October-March) soon after the seasonal thermocline breaks down in autumn
(October) and nutrients are mixed into the surface layer. Nutrients are removed from the mixed
layer, until all of the phosphate has been taken up and excess nitrate remains, together with
biomass and TRN produced; sinking particles exit the mixed layer across the pycnocline.
At all stations sampled during M71-3, there was excess nitrate remaining in the surface
mixed layer. The average nitrate remaining in the euphotic zone was between 0.24 and 0.48 µM,
and the actual amount of residual nitrate varied with location and stage of thermocline evolution.
These concentrations are similar to those found previously for the average winter residual nitrate
across the Southern Levantine basin (0.6±0.5 µM) (Kress and Herut, 2001). At all stations,
phosphate was depleted in surface waters, with all values being below detection limits (<20 nM).
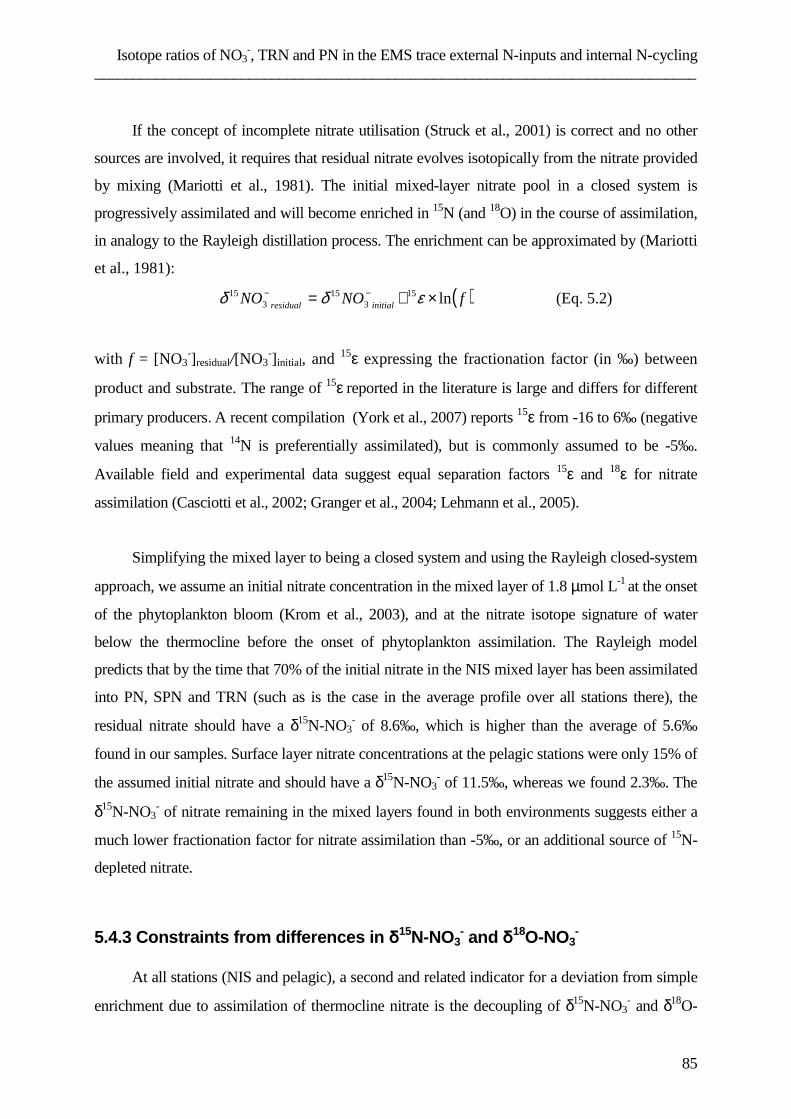
Isotope ratios of NO3-, TRN and PN in the EMS trace external N-inputs and internal N-cycling
______________________________________________________________________________
85
If the concept of incomplete nitrate utilisation (Struck et al., 2001) is correct and no other
sources are involved, it requires that residual nitrate evolves isotopically from the nitrate provided
by mixing (Mariotti et al., 1981). The initial mixed-layer nitrate pool in a closed system is
progressively assimilated and will become enriched in 15N (and 18O) in the course of assimilation,
in analogy to the Rayleigh distillation process. The enrichment can be approximated by (Mariotti
et al., 1981):
( )fNONO initialresidual ln153
153
15 ×+= −− εδδ (Eq. 5.2)
with f = [NO3-]residual/[NO3
-] initial, and 15ε expressing the fractionation factor (in ‰) between
product and substrate. The range of 15ε reported in the literature is large and differs for different
primary producers. A recent compilation (York et al., 2007) reports 15ε from -16 to 6‰ (negative
values meaning that 14N is preferentially assimilated), but is commonly assumed to be -5‰.
Available field and experimental data suggest equal separation factors 15ε and 18ε for nitrate
assimilation (Casciotti et al., 2002; Granger et al., 2004; Lehmann et al., 2005).
Simplifying the mixed layer to being a closed system and using the Rayleigh closed-system
approach, we assume an initial nitrate concentration in the mixed layer of 1.8 µmol L-1 at the onset
of the phytoplankton bloom (Krom et al., 2003), and at the nitrate isotope signature of water
below the thermocline before the onset of phytoplankton assimilation. The Rayleigh model
predicts that by the time that 70% of the initial nitrate in the NIS mixed layer has been assimilated
into PN, SPN and TRN (such as is the case in the average profile over all stations there), the
residual nitrate should have a δ15N-NO3- of 8.6‰, which is higher than the average of 5.6‰
found in our samples. Surface layer nitrate concentrations at the pelagic stations were only 15% of
the assumed initial nitrate and should have a δ15N-NO3- of 11.5‰, whereas we found 2.3‰. The
δ15N-NO3- of nitrate remaining in the mixed layers found in both environments suggests either a
much lower fractionation factor for nitrate assimilation than -5‰, or an additional source of 15N-
depleted nitrate.
5.4.3 Constraints from differences in δ15N-NO3- and δ18O-NO3
-
At all stations (NIS and pelagic), a second and related indicator for a deviation from simple
enrichment due to assimilation of thermocline nitrate is the decoupling of δ15N-NO3- and δ18O-
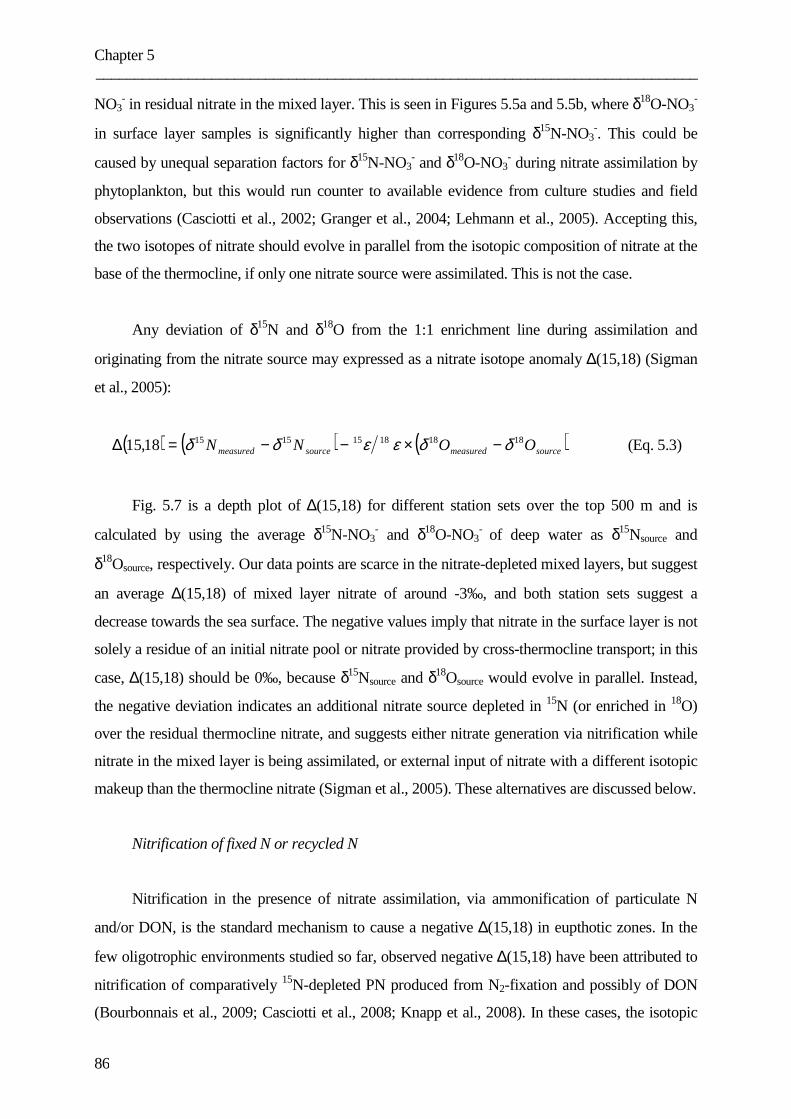
Chapter 5 ______________________________________________________________________________
86
NO3- in residual nitrate in the mixed layer. This is seen in Figures 5.5a and 5.5b, where δ18O-NO3
-
in surface layer samples is significantly higher than corresponding δ15N-NO3-. This could be
caused by unequal separation factors for δ15N-NO3- and δ18O-NO3
- during nitrate assimilation by
phytoplankton, but this would run counter to available evidence from culture studies and field
observations (Casciotti et al., 2002; Granger et al., 2004; Lehmann et al., 2005). Accepting this,
the two isotopes of nitrate should evolve in parallel from the isotopic composition of nitrate at the
base of the thermocline, if only one nitrate source were assimilated. This is not the case.
Any deviation of δ15N and δ18O from the 1:1 enrichment line during assimilation and
originating from the nitrate source may expressed as a nitrate isotope anomaly ∆(15,18) (Sigman
et al., 2005):
( ) ( ) ( )sourcemeasuredsourcemeasured OONN 18181815151518,15 δδεεδδ −×−−=∆ (Eq. 5.3)
Fig. 5.7 is a depth plot of ∆(15,18) for different station sets over the top 500 m and is
calculated by using the average δ15N-NO3- and δ18O-NO3
- of deep water as δ15Nsource and
δ18Osource, respectively. Our data points are scarce in the nitrate-depleted mixed layers, but suggest
an average ∆(15,18) of mixed layer nitrate of around -3‰, and both station sets suggest a
decrease towards the sea surface. The negative values imply that nitrate in the surface layer is not
solely a residue of an initial nitrate pool or nitrate provided by cross-thermocline transport; in this
case, ∆(15,18) should be 0‰, because δ15Nsource and δ18Osource would evolve in parallel. Instead,
the negative deviation indicates an additional nitrate source depleted in 15N (or enriched in 18O)
over the residual thermocline nitrate, and suggests either nitrate generation via nitrification while
nitrate in the mixed layer is being assimilated, or external input of nitrate with a different isotopic
makeup than the thermocline nitrate (Sigman et al., 2005). These alternatives are discussed below.
Nitrification of fixed N or recycled N
Nitrification in the presence of nitrate assimilation, via ammonification of particulate N
and/or DON, is the standard mechanism to cause a negative ∆(15,18) in eupthotic zones. In the
few oligotrophic environments studied so far, observed negative ∆(15,18) have been attributed to
nitrification of comparatively 15N-depleted PN produced from N2-fixation and possibly of DON
(Bourbonnais et al., 2009; Casciotti et al., 2008; Knapp et al., 2008). In these cases, the isotopic
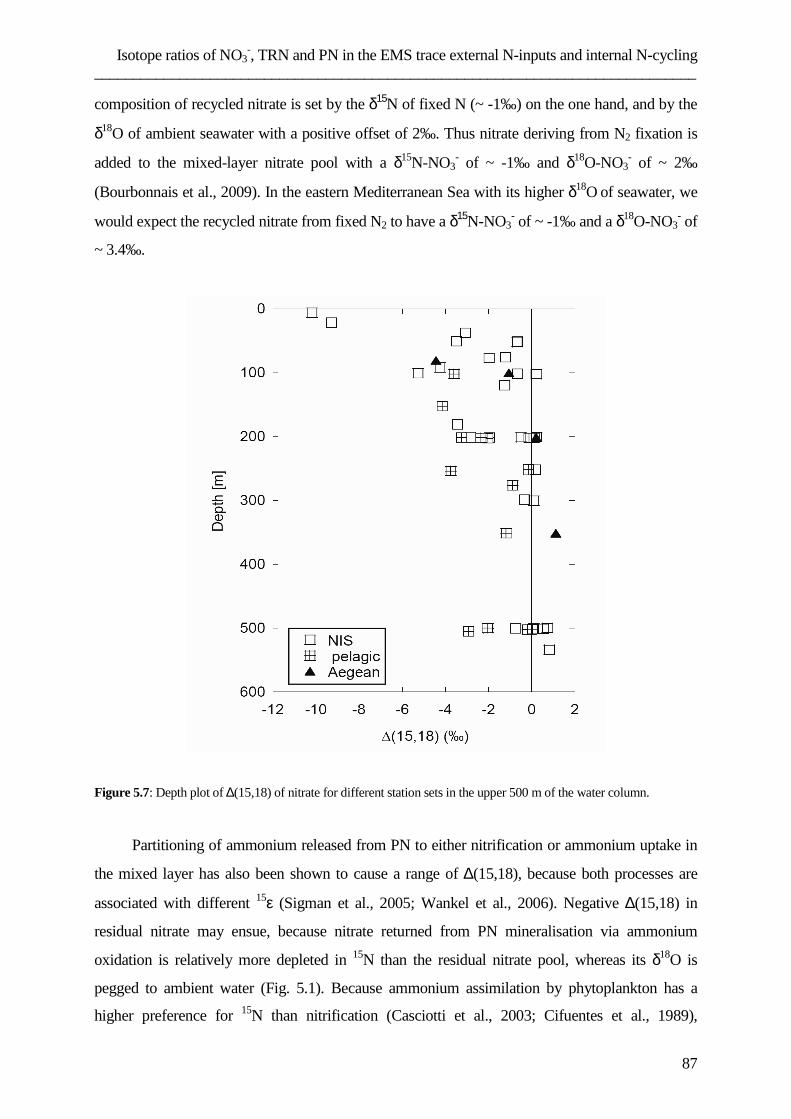
Isotope ratios of NO3-, TRN and PN in the EMS trace external N-inputs and internal N-cycling
______________________________________________________________________________
87
composition of recycled nitrate is set by the δ15N of fixed N (~ -1‰) on the one hand, and by the
δ18O of ambient seawater with a positive offset of 2‰. Thus nitrate deriving from N2 fixation is
added to the mixed-layer nitrate pool with a δ15N-NO3- of ~ -1‰ and δ18O-NO3
- of ~ 2‰
(Bourbonnais et al., 2009). In the eastern Mediterranean Sea with its higher δ18O of seawater, we
would expect the recycled nitrate from fixed N2 to have a δ15N-NO3- of ~ -1‰ and a δ18O-NO3
- of
~ 3.4‰.
Figure 5.7: Depth plot of ∆(15,18) of nitrate for different station sets in the upper 500 m of the water column.
Partitioning of ammonium released from PN to either nitrification or ammonium uptake in
the mixed layer has also been shown to cause a range of ∆(15,18), because both processes are
associated with different 15ε (Sigman et al., 2005; Wankel et al., 2006). Negative ∆(15,18) in
residual nitrate may ensue, because nitrate returned from PN mineralisation via ammonium
oxidation is relatively more depleted in 15N than the residual nitrate pool, whereas its δ18O is
pegged to ambient water (Fig. 5.1). Because ammonium assimilation by phytoplankton has a
higher preference for 15N than nitrification (Casciotti et al., 2003; Cifuentes et al., 1989),
Chapter 5 ______________________________________________________________________________
88
significant ratios of ammonium assimilation versus nitrification will cause biomass and thus PN to
be relatively enriched in 15N compared with the recycled nitrate. Because we find no indication
for enriched SPN or PN in the mixed layers, and the sediment trap data suggest that SPN is on
annual average even more depleted in 15N than thermocline nitrate, we believe that assimilation of
mineralised ammonium is unlikely to play a major role as a substrate for phytoplankton growth in
the mixed layer, and as a cause for negative ∆(15,18). But the isotopic data cannot completely rule
out assimilation of remineralized ammonium: If relatively little nitrification takes place,
particulate N could be remineralized and ammonium completely re-assimilated without involving
isotope fractionation.
Input of NOx
Aside from an internal source of nitrate, there must be a second source that causes negative
∆(15,18) in the mixed layer of the eastern Mediterranean Sea. We have evidence to suggest that
NOx inputs play a relatively larger role in the eastern Mediterranean Sea than elsewhere. Two
previous studies (Bourbonnais et al., 2009; Knapp et al., 2008) acknowledge (but dismiss) the
possibility that the negative ∆(15,18) observed in mixed layer nitrate of the oligotrophic Sargasso
Sea and subtropical NE Atlantic Ocean indicate atmospheric NOx inputs, which differ strongly
from thermocline nitrate in δ18O-NO3- (>60‰) at δ15N-NO3
- ranging from -15 to 15‰ (Kendall et
al., 2007). By contrast, such an input to the eastern Mediterranean Sea surface layer would not be
immediately assimilated due to phosphate limitation, and thus would introduce nitrate with low
δ15N-NO3- and high δ18O-NO3
- into the surface mixed layer. Model estimates of annual total NOx
inputs in wet and dry deposition to the eastern Mediterranean Sea surface range between 200 and
400 mg N m-2 a-1; reduced N (mainly ammonium) deposition is lower (200 - 20 mg N m-2 a-1)
(http://www.emep.int). Both inputs have a pronounced N-S gradient, with reduced N having a
steeper land-sea gradient. An estimated 14-29 mmol NOx m-2 a-1 of industrial origin are thus
supplied annually to the eastern Mediterranean sea surface, plus a smaller contribution of reduced
N.
The atmospheric deposition on the island of Crete in winter months of 2006/2007 had a
mean δ15N-NO3- of -2.0‰ (Mara et al., 2009), and likely had a high δ18O-NO3
-: 13 samples of dry
atmospheric deposition (no rain events recorded) collected on the Island of Crete during June-
September 2007 had an average δ18O-NO3- of 67.5+4.2‰ (Mara, unpubl. data). Although this
data does not cover the time of predominantly wet deposition in winter, the values are within in
Isotope ratios of NO3-, TRN and PN in the EMS trace external N-inputs and internal N-cycling
______________________________________________________________________________
89
the range reported from other environments (Kendall et al., 2007) and from the nearby northern
Red Sea (Wankel et al., 2009). There, δ15N values of water-soluble nitrate in aerosol samples
ranged from −6.9‰ to +1.9‰ and δ18O was found to range from 65.1‰ to 84.9‰ with
highest δ18O values in the winter. That nitrate was deposited from air masses deriving from
the Mediterranean Sea and western Europe (Wankel et al., 2009). Thus, although only <10% of
nitrate remaining in the mixed layer of the eastern Mediterranean Sea may have originated from
the atmospheric source over 4 months, the effect on average δ18O-NO3- and ∆(15,18) is large due
to the small amount of nitrate in the mixed layer of the eastern Mediterranean Sea and the high
δ18O-NO3- of atmospheric inputs. Of all oligotrophic ocean regions, the eastern Mediterranean
surface mixed layer is arguably the most sensitive place in the world ocean to register that input.
The nitrate pool here is very small and the system is phosphate limited. Most other upper ocean
waters that receive a sizeable NOx input (Duce et al., 2008) are N-limited, so that any nitrate
entering the surface ocean there should be immediately assimilated. This assimilation (and
subsequent recycling to nitrate) would eradicate the δ18O signal diagnostic of atmospheric NOx
and would make it impossible to trace.
We can use the isotopic signatures of putative internal (recycling) and external (N2 fixation
and NOx) inputs together with an estimate of N export flux in a conceptual steady-state mass and
isotope balance model to explore the effects of externally and internally supplied N on ∆(15,18).
The model is the same as that used in the subtropical SE Atlantic (Bourbonnais et al., 2009), and
we refer to that publication for more details. Fig. 5.1 sketched possible sources, sinks and
transformations in the N-cycle of the eastern Mediterranean Sea that is suitable to illustrate our
reasoning and the modelling approach: The nitrate pool in surface water is fed by external (NOx,
N2 fixed, and nitrate from cross-thermocline mixing, ku) and internal (mineralisation and
nitrification of PN in the surface mixed layer) sources. The nitrate sink for the surface layer is
assimilation into particulate N (with TRN/DON as a by-product) and export of sinking particulate
nitrogen across the thermocline.
The nitrate below the thermocline is a mixture of a standing stock of nitrate in
deep/intermediate water and addition from mineralisation of sinking particulate nitrogen. In our
interpretation, the difference between deep-water suspended matter and TRN on the one hand and
sinking PN and nitrate on the other hand arise, when small particles shed from the sinking PN are
ammonified into 15N-depleted ammonium that is then completely oxidised to nitrate. The small
residual particles (suspended PN) are thus enriched in 15N. A by-product of feeding on this
Chapter 5 ______________________________________________________________________________
90
suspended particulate N is that TRN/DON is also enriched in 15N as compared to the sinking
material. Nitrification of ammonium liberated from sinking PN adds nitrate with a δ18O (marked
in blue in Fig. 5.1) approximately 2‰ higher than ambient seawater – in the case of the eastern
Mediterranean sea, this nitrate is expected to have a δ18O-NO3- of 3.4‰. As stated above, we
consider ammonium assimilation to be of minor importance.
We point out that nitrate added from the mineralisation of fixed N2 or from sinking PN
produced from assimilation of thermocline nitrate both acquire the same δ18O after nitrification
(through exchange with ambient water), but have slightly different δ15N. Both these additions
cause negative excursions in ∆(15,18), because this term expresses the deviation in the dual
isotopes of nitrate from the isotopic composition of nitrate provided by the thermocline flux ku
and enriched during assimilation with a 1:1 slope. If only the upward flux across the thermocline
were the source of nitrate in the surface, ∆(15,18) would remain 0‰, regardless of the extent of
nitrate assimilated,. The other possible source of nitrate (NOx from the atmosphere) has a δ18O of
65‰ at a δ15N of -2‰. If not assimilated immediately, this atmospheric input lowers the δ15N-
NO3- while raising the δ18O-NO3
- of the surface nitrate pool, and would also cause a negative
∆(15,18) for a different reason.
We adapted the model to calculate ∆(15,18) (Bourbonnais et al., 2009) to conditions in the
eastern Mediterranean Sea (see auxiliary material). We chose appropriate boundary conditions for
the thermocline nitrate isotopic composition, the δ18O of seawater, and the observed N-export
production of 56 mmol per year (see auxiliary material). That flux is fixed; added inputs from N2
fixation or NOx reduce ku by the equivalent amount. If nitrification of particulate N occurs in the
surface layer, this requires that the amount of nitrate assimilated in the surface layer is higher by
the amount nitrified to maintain the export flux, but it does not affect ku. All N sources have a
specific δ15N signature, and the nitrate mixture in the surface layer integrates these isotopic
contributions. That pool of nitrate is assimilated into biomass, and the residual nitrate pool in the
surface layer is isotopically enriched during phytoplankton assimilation with equal fractionation
factors 15ε = 18ε = -5‰: At any stage of assimilation, the δ15N of sinking PN is 5‰ more depleted
than the residual nitrate pool, while the δ18O signal of the assimilated nitrate is lost. In the model,
recycled nitrate (nitrification) inherits the δ15N of sinking PN (that has or not a contribution from
N2 fixation) and the δ18O of seawater (with an offset of +2‰).
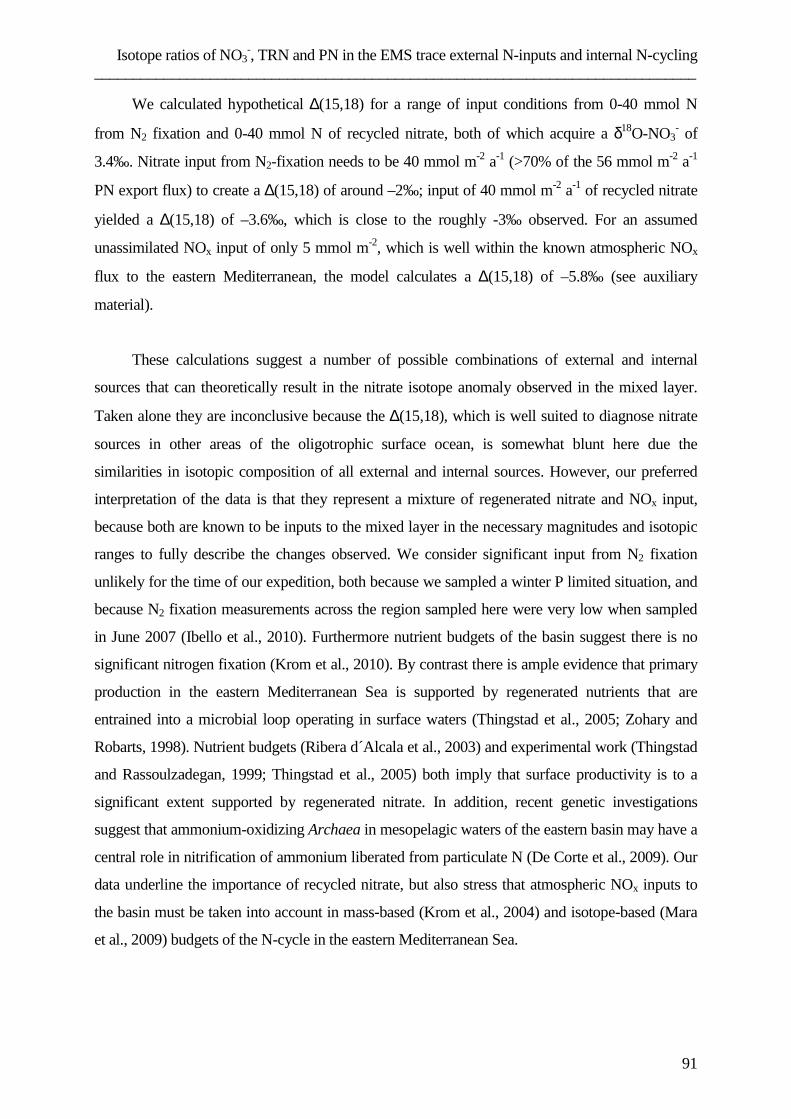
Isotope ratios of NO3-, TRN and PN in the EMS trace external N-inputs and internal N-cycling
______________________________________________________________________________
91
We calculated hypothetical ∆(15,18) for a range of input conditions from 0-40 mmol N
from N2 fixation and 0-40 mmol N of recycled nitrate, both of which acquire a δ18O-NO3- of
3.4‰. Nitrate input from N2-fixation needs to be 40 mmol m-2 a-1 (>70% of the 56 mmol m-2 a-1
PN export flux) to create a ∆(15,18) of around –2‰; input of 40 mmol m-2 a-1 of recycled nitrate
yielded a ∆(15,18) of –3.6‰, which is close to the roughly -3‰ observed. For an assumed
unassimilated NOx input of only 5 mmol m-2, which is well within the known atmospheric NOx
flux to the eastern Mediterranean, the model calculates a ∆(15,18) of –5.8‰ (see auxiliary
material).
These calculations suggest a number of possible combinations of external and internal
sources that can theoretically result in the nitrate isotope anomaly observed in the mixed layer.
Taken alone they are inconclusive because the ∆(15,18), which is well suited to diagnose nitrate
sources in other areas of the oligotrophic surface ocean, is somewhat blunt here due the
similarities in isotopic composition of all external and internal sources. However, our preferred
interpretation of the data is that they represent a mixture of regenerated nitrate and NOx input,
because both are known to be inputs to the mixed layer in the necessary magnitudes and isotopic
ranges to fully describe the changes observed. We consider significant input from N2 fixation
unlikely for the time of our expedition, both because we sampled a winter P limited situation, and
because N2 fixation measurements across the region sampled here were very low when sampled
in June 2007 (Ibello et al., 2010). Furthermore nutrient budgets of the basin suggest there is no
significant nitrogen fixation (Krom et al., 2010). By contrast there is ample evidence that primary
production in the eastern Mediterranean Sea is supported by regenerated nutrients that are
entrained into a microbial loop operating in surface waters (Thingstad et al., 2005; Zohary and
Robarts, 1998). Nutrient budgets (Ribera d´Alcala et al., 2003) and experimental work (Thingstad
and Rassoulzadegan, 1999; Thingstad et al., 2005) both imply that surface productivity is to a
significant extent supported by regenerated nitrate. In addition, recent genetic investigations
suggest that ammonium-oxidizing Archaea in mesopelagic waters of the eastern basin may have a
central role in nitrification of ammonium liberated from particulate N (De Corte et al., 2009). Our
data underline the importance of recycled nitrate, but also stress that atmospheric NOx inputs to
the basin must be taken into account in mass-based (Krom et al., 2004) and isotope-based (Mara
et al., 2009) budgets of the N-cycle in the eastern Mediterranean Sea.
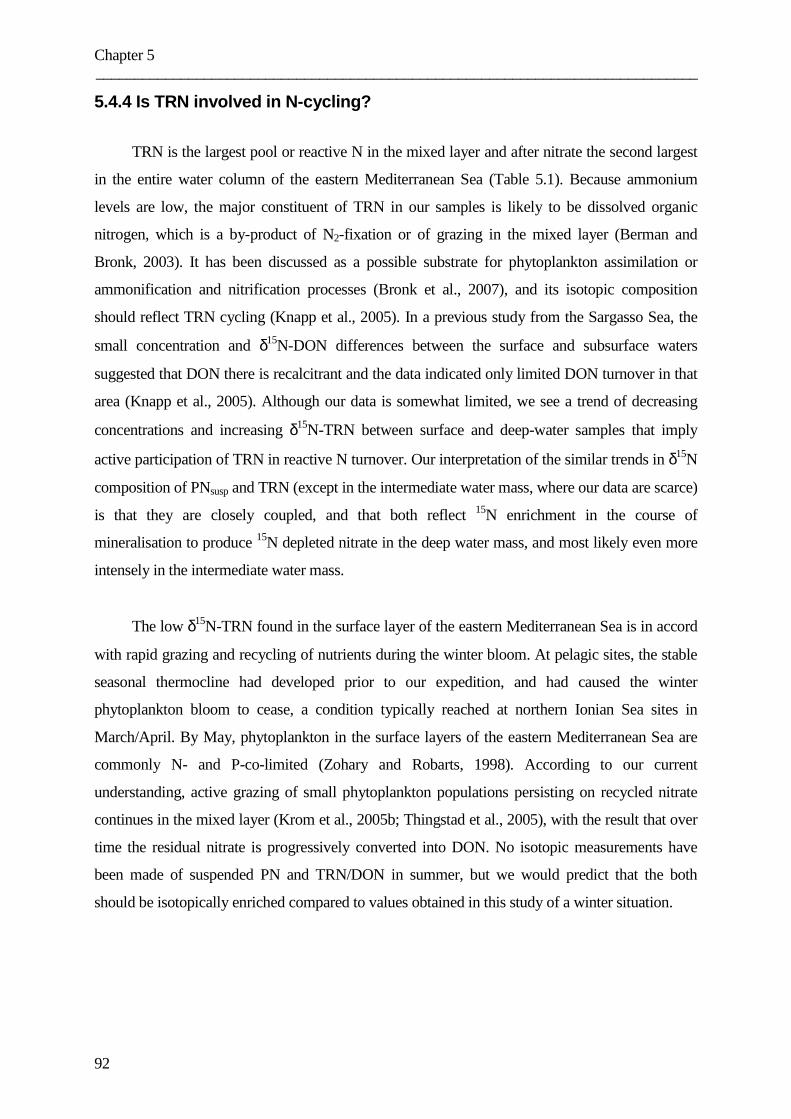
Chapter 5 ______________________________________________________________________________
92
5.4.4 Is TRN involved in N-cycling?
TRN is the largest pool or reactive N in the mixed layer and after nitrate the second largest
in the entire water column of the eastern Mediterranean Sea (Table 5.1). Because ammonium
levels are low, the major constituent of TRN in our samples is likely to be dissolved organic
nitrogen, which is a by-product of N2-fixation or of grazing in the mixed layer (Berman and
Bronk, 2003). It has been discussed as a possible substrate for phytoplankton assimilation or
ammonification and nitrification processes (Bronk et al., 2007), and its isotopic composition
should reflect TRN cycling (Knapp et al., 2005). In a previous study from the Sargasso Sea, the
small concentration and δ15N-DON differences between the surface and subsurface waters
suggested that DON there is recalcitrant and the data indicated only limited DON turnover in that
area (Knapp et al., 2005). Although our data is somewhat limited, we see a trend of decreasing
concentrations and increasing δ15N-TRN between surface and deep-water samples that imply
active participation of TRN in reactive N turnover. Our interpretation of the similar trends in δ15N
composition of PNsusp and TRN (except in the intermediate water mass, where our data are scarce)
is that they are closely coupled, and that both reflect 15N enrichment in the course of
mineralisation to produce 15N depleted nitrate in the deep water mass, and most likely even more
intensely in the intermediate water mass.
The low δ15N-TRN found in the surface layer of the eastern Mediterranean Sea is in accord
with rapid grazing and recycling of nutrients during the winter bloom. At pelagic sites, the stable
seasonal thermocline had developed prior to our expedition, and had caused the winter
phytoplankton bloom to cease, a condition typically reached at northern Ionian Sea sites in
March/April. By May, phytoplankton in the surface layers of the eastern Mediterranean Sea are
commonly N- and P-co-limited (Zohary and Robarts, 1998). According to our current
understanding, active grazing of small phytoplankton populations persisting on recycled nitrate
continues in the mixed layer (Krom et al., 2005b; Thingstad et al., 2005), with the result that over
time the residual nitrate is progressively converted into DON. No isotopic measurements have
been made of suspended PN and TRN/DON in summer, but we would predict that the both
should be isotopically enriched compared to values obtained in this study of a winter situation.
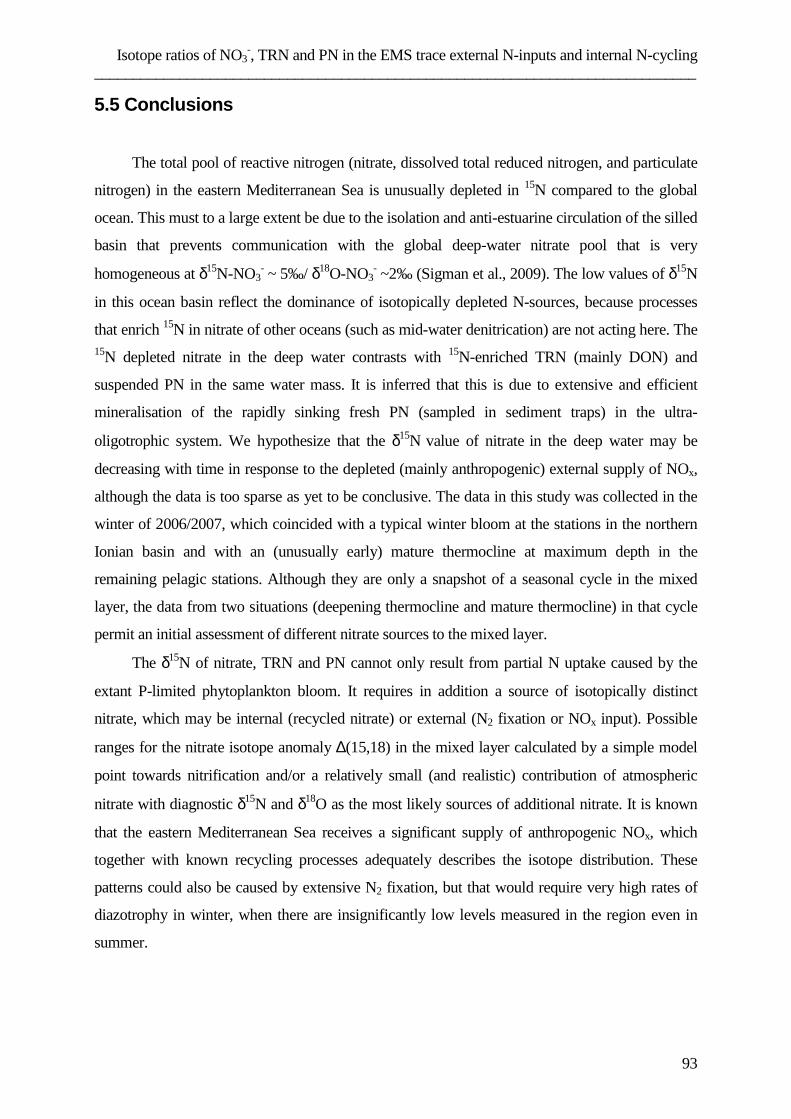
Isotope ratios of NO3-, TRN and PN in the EMS trace external N-inputs and internal N-cycling
______________________________________________________________________________
93
5.5 Conclusions
The total pool of reactive nitrogen (nitrate, dissolved total reduced nitrogen, and particulate
nitrogen) in the eastern Mediterranean Sea is unusually depleted in 15N compared to the global
ocean. This must to a large extent be due to the isolation and anti-estuarine circulation of the silled
basin that prevents communication with the global deep-water nitrate pool that is very
homogeneous at δ15N-NO3- ~ 5‰/ δ18O-NO3
- ~2‰ (Sigman et al., 2009). The low values of δ15N
in this ocean basin reflect the dominance of isotopically depleted N-sources, because processes
that enrich 15N in nitrate of other oceans (such as mid-water denitrication) are not acting here. The 15N depleted nitrate in the deep water contrasts with 15N-enriched TRN (mainly DON) and
suspended PN in the same water mass. It is inferred that this is due to extensive and efficient
mineralisation of the rapidly sinking fresh PN (sampled in sediment traps) in the ultra-
oligotrophic system. We hypothesize that the δ15N value of nitrate in the deep water may be
decreasing with time in response to the depleted (mainly anthropogenic) external supply of NOx,
although the data is too sparse as yet to be conclusive. The data in this study was collected in the
winter of 2006/2007, which coincided with a typical winter bloom at the stations in the northern
Ionian basin and with an (unusually early) mature thermocline at maximum depth in the
remaining pelagic stations. Although they are only a snapshot of a seasonal cycle in the mixed
layer, the data from two situations (deepening thermocline and mature thermocline) in that cycle
permit an initial assessment of different nitrate sources to the mixed layer.
The δ15N of nitrate, TRN and PN cannot only result from partial N uptake caused by the
extant P-limited phytoplankton bloom. It requires in addition a source of isotopically distinct
nitrate, which may be internal (recycled nitrate) or external (N2 fixation or NOx input). Possible
ranges for the nitrate isotope anomaly ∆(15,18) in the mixed layer calculated by a simple model
point towards nitrification and/or a relatively small (and realistic) contribution of atmospheric
nitrate with diagnostic δ15N and δ18O as the most likely sources of additional nitrate. It is known
that the eastern Mediterranean Sea receives a significant supply of anthropogenic NOx, which
together with known recycling processes adequately describes the isotope distribution. These
patterns could also be caused by extensive N2 fixation, but that would require very high rates of
diazotrophy in winter, when there are insignificantly low levels measured in the region even in
summer.

Chapter 5 ______________________________________________________________________________
94
Acknowledgements
We acknowledge discussions with J. Montoja and J. Paetsch, as well as sediment trap data
provided by B. Gaye and N. Lahajnar. I. Büns is thanked for nutrient analyses. Three anonymous
reviewers and the editors greatly helped to improve the manuscript. The work was funded by
grants to K.E. (DFG Em37/24, /25, /32) and to P. Mara (Euroceans PhD program). MDK made
much of his contribution while on sabbatical leave at Georgia Institute of Technology.
Auxiliary material
∆(15,18) model boundary conditions and simulation results
The model is analogous to a published model [Bourbonnais et al., 2009] with boundary
conditions adapted to the EMS; processes are schematically shown in Fig. 5.1.
At steady state (run 0) with no contribution of fixed N2, NOx or nitrification, the modelled
mixed layer nitrate pool in the eastern Mediterranean Sea is solely fed by sub-thermocline nitrate.
This new nitrate is again exported as SPN and the upward nitrate flux balances export flux. The
N-export monitored in our sediment traps is used to give an estimate of the SPN export and thus
the upward nitrate flux. SPN flux in the ocean is exponentially linked to water depth [Pace et al.,
1987], and from the fluxes at the two trap depths of the Ierapetra mooring, we estimate the PN
flux across base of the mixed layer (set at 200 m water depth) to 33 mmol N m-2 in the 216 days
of the MID-3 deployment, or 56 mmol N m-2 prorated for an entire year, which agrees well with
export fluxes reported from other sediment trap experiments in the area [Boldrin et al., 2002].
This SPN export flux should not increase from external N additions, because it is essentially
limited by phosphate. Any external addition of N (by fixation or NOx input) would decrease the
upward flux ku in steady state [Bourbonnais et al., 2009], while internal nitrate
generation/assimilation from nitrification of SPN in the surface layer does not affect the upward
flux or the export flux. The δ15N of SPN is determined by the δ15N-NO3- of the surface box and
the fractionation factor 15ε. We set 15e = 18e = -5‰ for the permil fractionation factor of mixed
layer nitrate assimilation. We then calculate the δ15N and δ18O of the isotopic mixture of nitrate
remaining in the mixed layer under steady-state conditions, and the ∆(15,18) of that nitrate
mixture under varying inputs. Assumed inputs to mixed layer nitrate are 1) only thermocline
nitrate (control run 0), 2) varying contributions of nitrate recycled from SPN assimilated from
deep-water nitrate and recycled nitrate with a δ18O-NO3- of 3.4‰ (runs 1-4), 3) varying
contributions of nitrate recycled from SPN deriving from deep-water nitrate and nitrification of
fixed N2 (runs 5-8), and 4) input of 5 mmol a-1 of NOx (run 9).
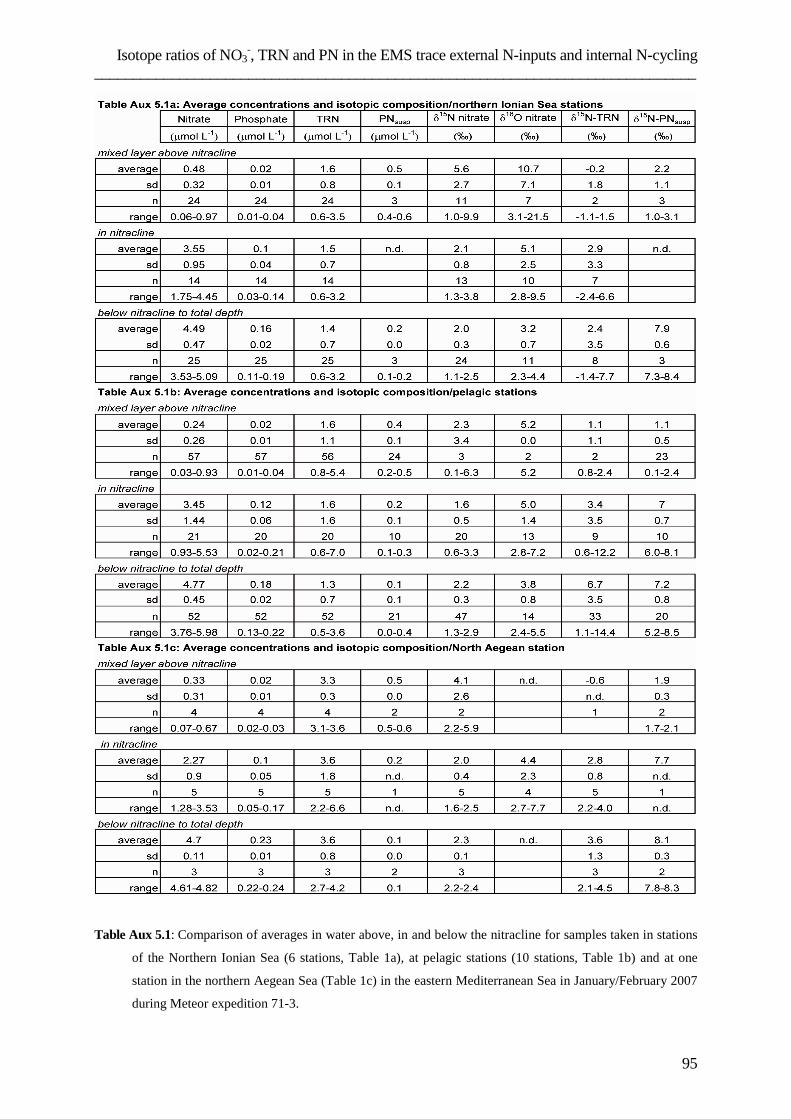
Isotope ratios of NO3-, TRN and PN in the EMS trace external N-inputs and internal N-cycling
______________________________________________________________________________
95
Table Aux 5.1: Comparison of averages in water above, in and below the nitracline for samples taken in stations
of the Northern Ionian Sea (6 stations, Table 1a), at pelagic stations (10 stations, Table 1b) and at one
station in the northern Aegean Sea (Table 1c) in the eastern Mediterranean Sea in January/February 2007
during Meteor expedition 71-3.
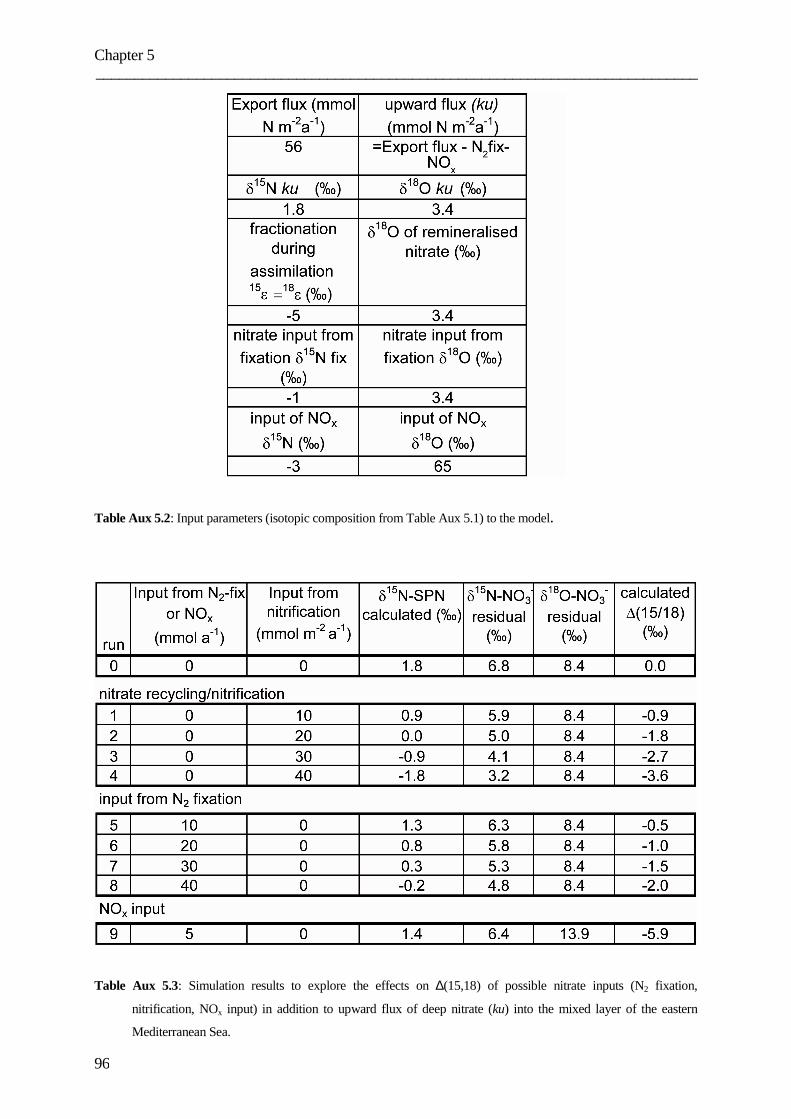
Chapter 5 ______________________________________________________________________________
96
Table Aux 5.2: Input parameters (isotopic composition from Table Aux 5.1) to the model.
Table Aux 5.3: Simulation results to explore the effects on ∆(15,18) of possible nitrate inputs (N2 fixation,
nitrification, NOx input) in addition to upward flux of deep nitrate (ku) into the mixed layer of the eastern
Mediterranean Sea.
Conclusions and outlook ___________________________________________________________________________
97
6 Conclusions and outlook
6.1 Conclusions
Until some years ago, DON was assumed to be a recalcitrant inert pool of nitrogen
without any relevant function as an alternative nitrogen source for microorganisms and
phytoplankton (William and Druffel, 1987). Many studies in recent years led to a
reassessment of the role of DON, both as an active compartment of reactive N, and as an
alternative source of N when inorganic supplies are exausted (Stepanauskas et al., 1999a, b;
Bronk, 2002; Bronk et al., 2007).
In this thesis I investigated dissolved organic nitrogen (DON) in two different aquatic
ecosystems: the Elbe River as an example for a eutrophic aquatic ecosystem, and the eastern
Mediterranean Sea as an example for an oligotrophic marine environment. By using stable
isotope analyses I assessed the role of DON in the aquatic nitrogen cycle and the relationships
between DON and other forms of reactive nitrogen, i.e. nitrate and particular nitrogen. To my
knowledge, I presented the first dataset on estuarine mixing patterns of δ15DON in seasonal
resolution. Combined with the two year study of the non-tidal part of the Elbe River, I
provided an excellent insight into the role of DON in this ecosystem. A weakness of my study
is that the data always are combined signals of DON and ammonium, due to analytical
difficulties. The day is saved by the fact that the data represent essentially DON, since the
ammonium contribution was less than 10%, and often ammonium could not be detected in
most of the samples.
The two studies in the Elbe River and the Elbe estuary show that DON is significantly
affected by abiotic processes. In the Elbe estuary I observed no seasonal trends in the nitrate,
DON and PN cycling, so turnovers due to biological processes can be excluded. However,
DON is not mixed conservatively in the salinity gradient and thus differs from nitrate
concentrations. Non-conservative behaviour of DON is in my interpretation caused only by
abiotic processes. The city of Hamburg and its port are distinct sources of DON, due to input
from direct discharge, local biogenic sources and/or sewage treatment plants. Adsorption and
desorption processes are likely the reason for a decrease in DON concentration at the
freshwater head of the estuarine turbidity maximum zone (TMZ), and an increase at the salty
Chapter 6 ___________________________________________________________________________
98
tail of the TMZ. Compared to older data the DON load in the estuary has not changed since
the 1980’s: Then and today DON concentrations range from 20 to 60 µM. This is a
remarkable fact, since the ammonium and phosphate concentrations decreased significantly in
the last 25 years, and also nitrate concentrations have a decreasing trend since the early
1990’s (FGG-Elbe, 2010). So, sinking nutrient concentrations do not cause automatically
decreasing DON concentrations.
In the non-tidal Elbe River, which I studied over a period of two years, the main abiotic
source of DON is the elution of 15N-enriched organic fertiliser after the main periods of
spreading manure, which are regulated by policy measures (DüV, 2009), in spring and after
the harvest in autumn. This δ15N enriched precursor material increases both the concentration
of DON and δ15DON in summer and winter river loads. In addition to this abiotic process,
biotic processes such as seasonally varying primary production, autotrophic and heterotrophic
uptake during springtime, and DON release due to nutrient limitation in summer create a
seasonal rhythm in both concentrations and isotopic composition of DON. Human impact
imposes an external abiotic rhythm on the annual cycle of DON in the Elbe River, making it
more complex than the cycling of nitrate: DON concentrations and isotopic composition have
four distinct annual phases, whereas nitrate concentrations and isotopic composition have
only two periods. Decreasing nitrate concentrations in spring and summer accompanied by an
increase in δ15N- and δ18O-NO3- were due to nitrate assimilation during primary production.
Changing biological activity in autumn and winter caused the opposite trends (Johannsen et
al., 2008; Kendall, 1998).
DON in the Elbe River represents 23% of TDN (in annual mean, summer contribution
is higher than in the other seasons); in the outer estuary this contribution increases to 50%. No
significant changes in the DON load in the last 25 years could be observed. DON is subject to
many processes, but most of these processes are abiotic, especially in the tidal estuary. Main
sources of DON are input from direct discharge, local biogenic sources and/or sewage
treatment plants and elution of organic fertilisers, but also release from PN. The similar trends
in the δ15N composition of DON and PN indicate a close coupling of these nitrogen species in
the water column.
In the study of reactive N in the eastern Mediterranean Sea, the ammonium
concentrations were so low that ammonium could be neglected, so measured TRN data can be
interpreted as DON.
Conclusions and outlook ___________________________________________________________________________
99
Next to nitrate, the DON fraction is the second largest fraction of total reactive nitrogen
in the eastern Mediterranean Sea. In the mixed layer, DON concentrations exceed even nitrate
concentrations. Thus, DON is an important factor that should not be neglected.
Lower DON concentrations accompanied by increasing δ15N values in deep sea samples
as compared to surface water samples of the eastern Mediterranean Sea are evidence for DON
taking part in nitrogen turnover in this environment. DON is strongly connected with PN,
since both show similar trends in δ15N. The low δ15N values in surface samples are caused by
rapid grazing and recycling of nutrients during winter bloom. The enrichment in 15N of both
DON and PN in deeper water masses is due to the production of 15N depleted nitrate. The
rapidly sinking fresh PN is subject to extensive and efficient mineralisation processes, and
DON is presumably a by-product of heterotrophic PN recycling.
The low δ15N of nitrate, TRN and PN result not only from partial nitrogen uptake
caused by the phytoplankton bloom. Nitrification and/or a relatively small input of
anthropogenic NOx are the most likely sources of additional isotopically distinct nitrate in the
eastern Mediterranean Sea.
So it is obvious that DON affected by different processes both in eutrophic and
oligotrophic aquatic ecosystems. While in eutrophic ecosystems abiotic processes play a
major role in DON cycling and main DON sources are human caused, DON is a relevant
nitrogen source for heterotrophs and has an active part in reactive nitrogen turnover in
oligotrophic ecosystems.
6.2 Outlook
This thesis shows that the study of DON is an interesting field of research with many
different aspects to investigate, and that the utilisation of stable isotope analyses is a suitable
tool to detect transformation processes.
However, the analysis of DON is still the main problem, since so far no adequate
method to measure DON concentration directly has been developed, and also the
measurement of δ15DON is possible only via measurement of δ15TDN and recalculation.
As often mentioned in this thesis, the method chosen here does not separate DON and
ammonium, so this is a part of the method that has to be improved. One possibility is to drive
off ammonium as ammonia by changing the pH-value, but here the risk of hydrolysis of
amino groups may be a problem. The measurement of δ15NH4
+ and inclusion of these data in
Chapter 6 ___________________________________________________________________________
100
the calculation of δ15DON is an opportunity, but will probably increase the calculated
standard deviation for δ15DON. So in environments with low DON content or small, but
significant changes analytical errors may exceed these values.
Besides these analytical challenges the diversity of the DON composition is a challenge
for itself. Different DON forms with different isotopic signatures interfere with each other,
resulting in a bulk δ15DON which is difficult to interpret. The amount of interesting labile
DON compounds with small turnover times is often low; the quantitative dominant DON pool
is often recalcitrant. The separation via ultracentrifugation in LMW and HMW DON with
subsequent stable isotope analysis may be a first step, but other more differentiated isolation
techniques are necessary and have to be developed.
To come back to the areas studied in this thesis, the TMZ in the Elbe estuary clearly is a
zone of high N turnover, with interesting and relevant processes to be studied. A more
detailed sampling campaign, with a combination of δ15DON, δ15NH4
+, and δ15PN analyses,
coupled with a separation in LMW and HMW DON may result in more precise data about the
mechanisms proceeding in the TMZ. Also the port of Hamburg is an interesting place for
further DON research studies to investigate the nature of the mainly anthropogenic source of
DON.
To my knowledge, the δ15N-TRN data presented in this thesis are the first isotopic
dataset of DON in the eastern Mediterranean Sea. Although the dataset is somewhat limited, it
supports the interpretation of nitrogen turnover processes. But for better comparison more
data are needed, especially from intermediate and deep water masses. Also other seasons may
be of interest. However, due to the low concentrations in this oligotrophic ecosystem the
current method for DON analyses is at its limit, so further DON research studies should be
made when the analytical difficulties mentioned above have been solved.
101
Acknowledgements
I would like to thank Prof. Dr. Kay-Christian Emeis for supervision of my thesis, for his
never-ending help in preparing publications, for the opportunity to join research cruises and
for giving me more than one chance to come to a successful end.
I would also like to thank Dr. Alejandro Spitzy for his support and for furnishing the
second opinion of this thesis.
Many thanks to my colleagues at GKSS (now HZG) and at the University of Hamburg
for the good working atmosphere and for mutual assistance: Kirstin, Astrid, Bibi, Jürgen,
Berit, Alexandra, Andreas, Anne, Carsten, Maik, Byanka, Ivonne, to name just a few.
Thanks to Maik Grunwald for proofreading parts of the script.
I like to thank everyone joining the lunch break, for all the interesting discussions,
which were not necessarily of scientific nature.
Many thanks also to Gerd Blöcker, Armando Caba and Hans Herbert Kock for their
advices, moral support and for providing their experience, and to Tanja Pieplow and Ilse Büns
for their help in nutrient analyses.
A special thank goes to Volker Dzaak for his support in all aspects of administration at
the GKSS.
Finally, I thank my family and my friends, my parents for supporting and encouraging
me all the time, and last but not least a special thank to Nicky for always believing in me.
Figure Captions ___________________________________________________________________________
102
Figure Captions Figure 1.1: The marine nitrogen cycle. X and Y represent intracellular intermediates that are
not accumulated in the water column (from Codispoti et al., 2001).
Figure 1.2: Conceptual diagram of biotic processes involved in DON release in aquatic
systems (from Bonk, 2001).
Figure 1.3: Conceptual diagram of processes involved in DON utilization in aquatic systems
(from Bronk, 2001)
Figure 1.4: Isotopic signatures of δ15N in different nitrogen sources (according to Kendall,
1998)
Figure 3.1: Sample stations in the Elbe estuary and location of places referred to in the text.
Figure 3.2: Mean ammonium concentration in June and November in the Elbe estuary from
1999 to 2006, measured by the ARGE Elbe (ARGE Elbe, 2001, 2002, 2003, 2004,
2005a, 2005b, 2007a, 2007b)
Figure 3.3: Salinity (a) and transmission (b) data in the Elbe estuary against stream kilometre.
Indicated are the Port of Hamburg (poH), and the location of the turbidity maximum
zone in October 2005 and December 2006 (TMZOD) and in June 2006 (TMZJ). Lines
in this and the following figures are best-fit curves using the locally weighted Least
Squared error method.
Figure 3.4: DON+NH4+ (black symbols) and ammonium (grey symbols) concentrations in the
Elbe estuary versus stream kilometre (a) and versus salinity (b).
Figure 3.5: Nitrate concentrations in the Elbe estuary versus stream kilometre (a) and versus
salinity (b).
Figure 3.6: δ15DON+NH4+ in the Elbe estuary versus stream kilometre (a) and versus salinity
(b).
Figure 3.7: δ15NO3- in the Elbe estuary versus stream kilometre (a) and versus salinity (b).
Figure 3.8: δ15PN in the Elbe estuary versus stream kilometre (a) and versus salinity (b).
Figure 3.9: Cross plots of δ15PN versus δ15DON+NH4+ (a) and δ15NO3
- versus δ15DON+NH4+
(b).
Figure 3.10: NO3-/DON+NH4
+ - ratios in the Elbe estuary. January 1986 to September 1987
(indexed a) data are from (Brockmann and Pfeiffer, 1990); April 1992 (indexed b) data
are from (Brockmann, 1994); August/September 1997 data (indexed c) are from
Figure Captions ___________________________________________________________________________
103
(Kerner and Spitzy, 2001); October 2005 to December 2006 data (indexed d) are from
this study.
Figure 3.11: Box-and-whisker plots of calculated δ15DON values in the Elbe estuary in
comparison with measured δ15DON+NH4+ values. For the calculation of mean NH4
+
concentrations and isotopic contribution, we used data from the ARGE Elbe (ARGE
Elbe, 2001, 2002, 2003, 2004, 2005a, 2005b, 2007a, 2007b) and δ15NH4+ values of the
Tyne estuary (1) and the Tweed estuary (2) (Ahad et al. 2006)
Figure 3.12: Box-and-whisker plots of data on combined DON+NH4+ concentrations (a) and
mean ammonium and DON concentration (b) in the Elbe estuary. Data sources as in
Figure 3.10.
Figure 3.13: Box-and-whisker plots of calculated DIN/DON ratios in the Elbe estuary over
the last two decades. Data sources as in Figure 3.10.
Figure 4.1: Sample station weir of Geesthacht, Northern Germany, NW Europe
Figure 4.2: concentration and isotopic values in the Elbe River at the weir of Geesthacht, June
2005 – December 2007, bars represent the river discharge. Note the different scales of
the y-axes. a) Nitrate concentration, δ15N-NO3
- and δ18O-NO3- in the Elbe River. Data
from 2006 have been published in Johannsen et al. (2008). b) combined DON+NH4+
concentration and δ15DON+NH4+. c) PN concentration and δ15PN
Figure 4.3: Relationship between δ15N-NO3- and δ18O-NO3
- to examine the fractionation
factor ratio ε15/ε18, dashed line represents a 1:1 ratio
Figure 4.4: δ15DON+NH4+and δ15PN in the Elbe River at the weir of Geesthacht, June 2006 -
December 2007
Figure 4.5: Relationship between δ15DON+NH4+ and δ15PN in the Elbe River at the weir of
Geesthacht, June 2006 – December 2007
Figure 5.1: Conceptual diagram of the processes that determine the δ15N and δ18O of nitrate in
the surface and intermediate water masses of the eastern Mediterranean Sea.
Abbreviations are PN for particulate nitrogen, TRN for total reduced nitrogen, and
DON for dissolved organic nitrogen as explained in the methods section. This diagram
also serves as a schematic illustration of the model used in the discussion to calculate
the nitrate isotope anomaly ∆(15,18) under assumptions of different sources as
explained in the text (see also auxiliary material).
Figure Captions ___________________________________________________________________________
104
Figure 5.2: Map of stations occupied in the Eastern Mediterranean Sea during r/v Meteor
cruise 71-3 (January-February, 2007). Northern Ionian Sea (NIS) stations referred to
in the text are stations H07 to H12 (black squares), pelagic stations are marked with
black dots, the sole station in the northern Aegean Sea (Sk01) is marked by a black
star. The black diamond SE of Crete (station Ier1) marks the location of the sediment
trap deployment (MID). Stations H07 (large black square) and Her03 (large black dot)
referred to in Fig. 5.3 are marked.
Figure 5.3: Profiles of fluorescence (a; arbitrary units), nitrate (b) and phosphate (b)
concentrations in the upper 400 m at 2 stations representative of NIS (H07) and
pelagic stations (Her03) show stratification between 80 and 230 m water depth and
indicate the biologically active mixed layer. An ongoing phytoplankton bloom in the
northern Ionian Sea (at station H07) is sustained by nitrate and phosphate provided
from ongoing regional thermocline deepening, whereas station Her03 illustrates the
mature and thick mixed layer with very low nutrient concentrations at pelagic sites.
Figure 5.4: Concentrations of nitrate (a), TRN (b), and particulate N in total suspended solids
(c) plotted against water depth for all stations.
Figure 5.5: Isotopic composition δ15N-NO3- (a), δ18O-NO3
- (b), δ15N-TRN (c), and δ15 of
suspended PN (d) plotted against water depth for all stations.
Figure 5.6: Composite seasonal diagram of sinking PN fluxes (squares) and δ15 of sinking PN
(circles) and their standard deviations at 2600 m water depth at station Ierapetra
(34°26´N, 26°11´E, water depth 3750 m). Fluxes (squares, black line and s.d. in red)
and δ15SPN (circles, grey line, s.d. in blue) for three deployment periods (MID-1:
01/30/1999 to 04/13/1999), MID-2: 11/05/2001 to 04/01/2002 and MID-3: 01/30/2007
to 09/05/2007) at 2700 m water depth have been assembled in a surrogate annual
cycle.
Figure 5.7: Depth plot of ∆(15,18) of nitrate for different station sets in the upper 500 m of the
water column.
Table Captions ___________________________________________________________________________
105
Table Captions
Table 1.1: In ecosystem studies commonly used elements and their stable isotopes. Listed are
the two most abundant stable isotopes of each element, the corresponding isotope ratio
and the international calibration standards. Today, primary standards are exhausted
and have been replaced by secondary standard materials (Hayes, 1983).
Table 1.2: Fractionation factors ε for major transformation processes in the marine nitrogen
cycle. ε of anammox has not been published yet.
Table 3.1: Synopsis of analytical results for sampling campaigns in the Elbe estuary from
October 2005 to December 2006.
Table 3.2: Results of tests on the oxidation efficiencies of persulfate digestion for different
standard materials. DIW: Deionized water, ACA: 6-amino caproic acid, EDTA:
ethylenediamine-tetraacetate, AAP: 4-aminoantipyrine. Notes: a) Standard in DIW is
as calculated from a 10, 20, 50, 100, 200, and 400 µM concentration series of each
standard (this study); b) Standard in DIW is as calculated from a 0.0, 2.5, 5.0, 7.5, and
10.0 µM concentration series of each standard (Knapp et al., 2005); c) same standard
series as under b) reported by Bronk et al. ((Bronk et al., 2000). d) N/R= not reported.
Table 3.3: Correlation coefficients (r) of variables in the salinity gradient >0.8 and for all
stations sampled. Significant values (α = 0.05) are printed in bold numbers.
Table 4.1: Correlation coefficients of all measured parameters in the Elbe River at the weir of
Geesthacht, June 2005 – December 2007. r² in bold, underlined coefficients present a
level of significance α ≤ 0.01
Table 4.2: Annual and seasonal mean concentrations and mean isotope values of nitrate,
TDN, DON+NH4+ and PN, and annual and seasonal mean DON+NH4
+ ratio in the
Elbe River at the weir of Geesthacht, June 2005 - December 2007
Table 4.3: Annual and seasonal loads (in kt) of nitrate, TDN, DON+NH4+ and PN in the Elbe
River at the weir of Geesthacht, June 2005 – December 2007 (n.d. = not determined)
Table 4.4: Load weighted annual and seasonal mean isotope values of nitrate, TDN,
DON+NH4+ and PN in the Elbe River at the weir of Geesthacht, June 2005 –
December 2007 (n.d. = not determined)
Table 4.5: Selected nutrient concentrations in the Elbe River at the weir of Geesthacht in the
years 2005 – 2007, measured by the ARGE-Elbe (ARGE 2005, 2007a, 2007b) (d.l. =
detection limit)
Table Captions ___________________________________________________________________________
106
Table 5.1: Estimate of reactive N-inventories of the EMS in different water depth intervals
(corresponding to mixed layer, intermediate, and deep water masses) and mass-
weighted δ15N of the different components (nitrate, particulate nitrogen PN, and total
reduced nitrogen, TRN). We calculated inventories (given in gigamol N) based on
interval water volumes for the EMS without Adriatic and Aegean sub-basins (R.
Grimm, pers. comm., 2009) and weighted δ15N values by average concentrations
found during our cruise. The last column is the integrated and mass-weighted δ15N
over all components of reactive N for each interval, the last line are the integrated
inventories and δ15N over the entire water column.
Table Aux 5.1: Comparison of averages in water above, in and below the nitracline for
samples taken in stations of the Northern Ionian Sea (6 stations, Table Aux 5.1a), at
pelagic stations (10 stations, Table Aux 5.1b) and at one station in the northern
Aegean Sea (Table Aux 5.1c) in the EMS in January/February 2007 during Meteor
expedition 71-3.
Table Aux 5.2: Input parameters (isotopic composition from Table Aux-1) to the model.
Table Aux 5.3: Simulation results to explore the effects on ∆(15,18) of possible nitrate inputs
(N2 fixation, nitrification, NOx input) in addition to upward flux of deep nitrate (ku)
into the mixed layer of the eastern Mediterranean Sea.
Table App 1: Salinity gradient in the Elbe estuary, October 2005 (cf. Chapter 3), sampled
with RV Ludwig Prandtl
Table App 2: Salinity gradient in the Elbe estuary, June 2006 (cf. Chapter 3), sampled with
RV Ludwig Prandtl
Table App 3: Salinity gradient in the Elbe estuary, December 2006 (cf. Chapter 3), sampled
with RV Ludwig Prandtl. Water samples taken from the surface (1 m depth) with the
ship’s membrane pump.
Table App 4: concentration data and c(DON) ratio at the Elbe weir at Geesthacht (June 2005
– December 2007, cf. Chapter 4)
Table App 5: isotope ratios and discharge data at the Elbe weir at Geesthacht (June 2005 –
December 2007, cf. Chapter 4)
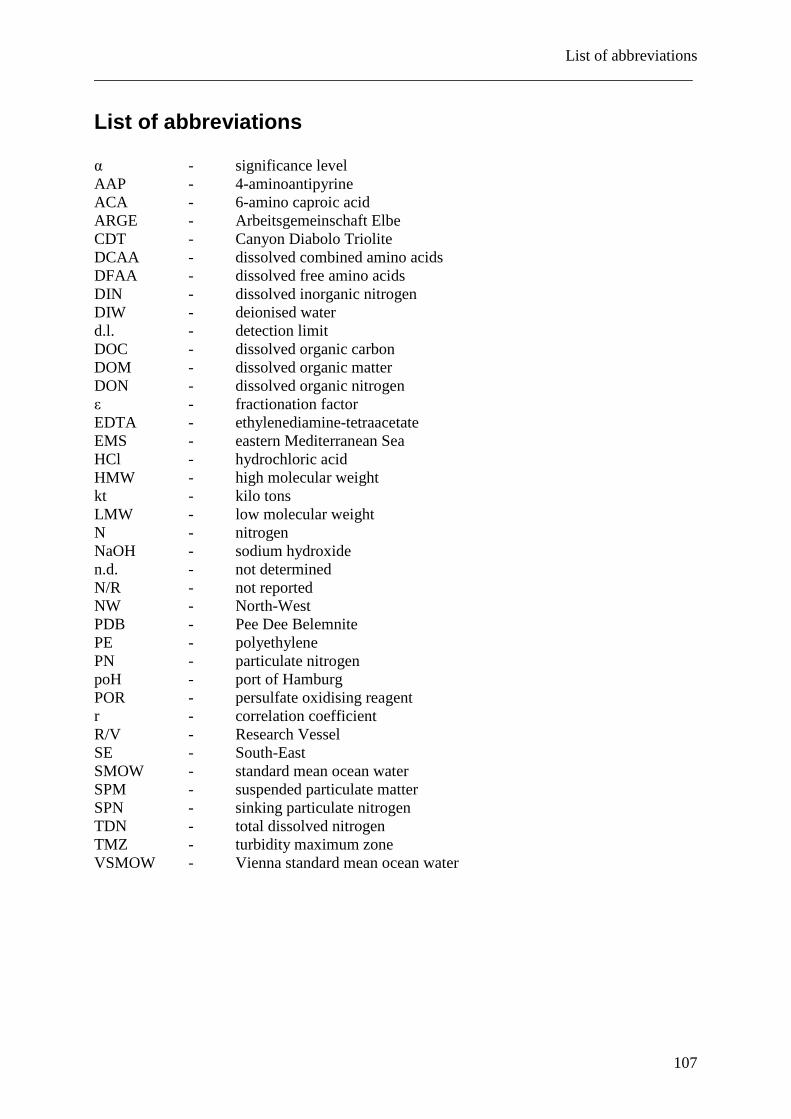
List of abbreviations ___________________________________________________________________________
107
List of abbreviations α - significance level AAP - 4-aminoantipyrine ACA - 6-amino caproic acid ARGE - Arbeitsgemeinschaft Elbe CDT - Canyon Diabolo Triolite DCAA - dissolved combined amino acids DFAA - dissolved free amino acids DIN - dissolved inorganic nitrogen DIW - deionised water d.l. - detection limit DOC - dissolved organic carbon DOM - dissolved organic matter DON - dissolved organic nitrogen ε - fractionation factor EDTA - ethylenediamine-tetraacetate EMS - eastern Mediterranean Sea HCl - hydrochloric acid HMW - high molecular weight kt - kilo tons LMW - low molecular weight N - nitrogen NaOH - sodium hydroxide n.d. - not determined N/R - not reported NW - North-West PDB - Pee Dee Belemnite PE - polyethylene PN - particulate nitrogen poH - port of Hamburg POR - persulfate oxidising reagent r - correlation coefficient R/V - Research Vessel SE - South-East SMOW - standard mean ocean water SPM - suspended particulate matter SPN - sinking particulate nitrogen TDN - total dissolved nitrogen TMZ - turbidity maximum zone VSMOW - Vienna standard mean ocean water
References ___________________________________________________________________________
108
References
Agedah, E.C., Binalaiyifa, H.E., Ball, A.S., and Nedwell, D.B., 2009. Sources, turnover and bioavailability of dissolved organic nitrogen (DON) in the Colne estuary, UK. Mar. Ecol. Prog. Ser. 382, 23-33
Ahad, J.M.E., Ganeshram, R.S., Spencer, R.G.M., Uher, G., Upstill-Goddard, R.C. and Cowie, G.L., 2006. Evaluating the sources and fate of anthropogenic dissolved inorganic nitrogen (DIN) in two contrasting North Sea estuaries. Science of the Total Environment 372, 317-333
Altabet, M.A., 1988. Variations in nitrogen isotopic composition between sinking and suspended particles: implications for nitrogen cycling and particle transformation in the open ocean. Deep-Sea Res. 35, 535-554
Altabet, M.A., and Francois, R., 1994. The use of nitrogen isotopic ratio for reconstruction of past changes in surface ocean nutrient utilization. In: R. Zahn et al. (Eds.) "Carbon Cycling in the Glacial Ocean: Constraints on the Ocean´s Role in Global Change", Springer-Verlag, Heidelberg
Antia, N.J., Harrison, P.J. and Oliveira, L., 1991. Phycological reviews: The role of dissolved organic nitrogen in phytoplankton nutrition, cell biology, and ecology. Phycologia 30, 1-89
Antoine, D., Morel, A., and André, J.-M., 1995. Algal pigment distribution and primary production in the eastern Mediterranean as derived from coastal zone colour scanner observations. Journal of Geophysical Research 100(C8), 16193-16209
ARGE, 2000. Stoffkonzentrationen in mittels Hubschrauber entnommenen Elbewasserproben (1979 bis 1998) Arbeitsgemeinschaft für die Reinhaltung der Elbe, Hamburg, http://www.arge-elbe.de/wge/Download/DBerichte.php
ARGE, 2001. Wassergütedaten der Elbe - Zahlentafel 1999, Arbeitsgemeinschaft für die Reinhaltung der Elbe, Hamburg, http://www.arge-elbe.de/wge/Download/DDaten.php
ARGE, 2002. Wassergütedaten der Elbe - Zahlentafel 2000, Arbeitsgemeinschaft für die Reinhaltung der Elbe, Hamburg, http://www.arge-elbe.de/wge/Download/DDaten.php
ARGE, 2003. Wassergütedaten der Elbe - Zahlentafel 2001, Arbeitsgemeinschaft für die Reinhaltung der Elbe, Hamburg, http://www.arge-elbe.de/wge/Download/DDaten.php
ARGE, 2004. Wassergütedaten der Elbe - Zahlentafel 2002, Arbeitsgemeinschaft für die Reinhaltung der Elbe, Hamburg, http://www.arge-elbe.de/wge/Download/DDaten.php
ARGE, 2005a. Wassergütedaten der Elbe - Zahlentafel 2003, Arbeitsgemeinschaft für die Reinhaltung der Elbe, Hamburg, http://www.arge-elbe.de/wge/Download/DDaten.php
ARGE, 2005b. Wassergütedaten der Elbe - Zahlentafel 2004, Arbeitsgemeinschaft für die Reinhaltung der Elbe, Hamburg, http://www.arge-elbe.de/wge/Download/DDaten.php
ARGE, 2007a. Wassergütedaten der Elbe - Zahlentafel 2005, Arbeitsgemeinschaft für die Reinhaltung der Elbe, Hamburg, http://www.arge-elbe.de/wge/Download/DDaten.php
ARGE, 2007b. Wassergütedaten der Elbe - Zahlentafel 2006, Arbeitsgemeinschaft für die Reinhaltung der Elbe, Hamburg, http://www.arge-elbe.de/wge/Download/DDaten.php
ARGE, 2008. Gewässergütebericht der Elbe 2006, Arbeitsgemeinschaft für die Reinhaltung der Elbe, Hamburg, http://www.arge-elbe.de/wge/Download/DBerichte.php
References ___________________________________________________________________________
109
Armstrong, F.A.J., Williams, P.M., and Strickland, J.D.H., 1966. Photo-oxidation of organic matter in sea water by ultra-violet radiadtion, analytical and other applications. Nature 211, 481-483
Badr, E.S.A., Tappin, A.D., and Achterberg, E.P., 2008. Distributions and seasonal variability of dissolved organic nitrogen in two estuaries in SW England. Mar. Chem. 110, 153-164
Behrendt, H., Bach, M., Opitz, D., and Pagenkopf, W.G., 2004. Maßgebliche anthropogene Einflüsse auf die Gewässerqualität. In: A. Becker and W. Lahmer (Eds.), "Wasser- und Nährstoffhaushalt im Elbegebiet und Möglichkeiten zur Stoffeintragsminderung", Weissensee Verlag, Berlin, 42-58
Benner, R., Biddanda, B., Black, B., and McCarthy, M., 1997. Abundance, size distributions, and stable carbon and nitrogen isotopic compositions of marine organic matter isolated by tangential-flow ultrafiltration. Mar. Chem. 57, 243-263
Benner, R., Pakulski, J.D., McCarthy, M., Hedges, J.I., and Hatcher, P.G., 1992. Bulk chemical characteristics of dissolved organic matter in the ocean. Science 255, 1561-1564
Berg, G.M., Glibert, P.M., Lomas, M.W., and Burford, M.A., 1997. Organic nitrogen uptake and growth by the chrysophyte Aureococcus anophagefferens during a brown tide event. Mar. Biol. 129, 377-387
Bergemann, M., 1995. Die Lage der oberen Brackwassergrenze im Elbeaestuar. Deutsche Gewaesserkundliche Mitteilungen 39(4/5), 134-137
Berman, T. and Bronk, D.A., 2003. Dissolved organic nitrogen: a dynamic participant in aquatic ecosystems. Aquat. Microb. Ecol. 31, 279-305
Berman, T., Béchemin, C. and Maestrini, S.Y., 1999. Release of ammonium and urea from dissolved organic nitrogen in aquatic ecosystems. Aquat. Microb. Ecol. 16, 295-302
Berman, T., Chava, S., Kaplan, B. and Wynne, D., 1991. Dissolved organic substrates as phosphorus and nitrogen sources for axenic batch cultures of freshwater green algae. Phycologia 30, 339-345
Berman-Frank, I., Yogev, T., Aharonovich, D., and Beja, O., 2007. Nitrogen fixation in the Eastern Mediterranean Sea, paper presented at IUGG XXIV General Assembly, Perugia, Italy.
Bertilsson, S., Stepanauskas, R., Cuadros-Hansson, R., Granéli, W., Wikner, J., and Tranvik, L., 1999. Photochemically induced changes in bioavailable carbon and nitrogen pools in a boreal watershed. Aquat. Microb. Ecol. 19, 47-56
Béthoux, J.P., 1989. Oxygen consumption, new production, vertical advection and environmental evolution of the Mediterranean Sea. Deep-Sea Research 36(5), 769-781
Béthoux, J.P., and Copin-Montegut, G., 1986. Biological fixation of atmospheric nitrogen in the Mediterranean Sea. Limnol. Oceangr. 31(6), 1353-1358
Billen, G., 1991. Protein degradation in aquatic environments. In: J.D. Chrost (Ed.), "Microbial Enzymes in Aquatic Environments", Springer-Verlag, New York, 123-143
Böhlke, J.K., Mroczkowski, S.J., and Coplen, T.B., 2003. Oxygen isotopes in nitrate: new reference materials for 18O:17O:16O measurements and observations on nitrate-water equilibration. Rapid Comm. in Mass Spectrometry 17(16), 1835-1846
References ___________________________________________________________________________
110
Bottcher, J., Strebel, O., Voerkerlius, S. and Schmidt, H.L.,1990. Using isotope fractionation of nitrate nitrogen and nitrate oxygen for evaluation of microbial denitrification in a sandy aquifer. J.Hydrol. 114, 413-424
Bourbonnais, A., Lehmann, M.F., Waniek, J.J., and Schulz-Bull, D.E., 2009. Nitrate isotope anomalies reflect N2 fixation in the Azores Front region (subtropical NE Atlantic), JGR 114(C03003), 1-16
Branch, G.M., and Griffiths, C.L., 1988. The Benguela ecosystem part V. The coastal zone. Oceanogr. Mar. Biol. Annu. Rev. 26, 395-486
Brandes, J.A., and Devol, A.H., 2002. A global marine-fixed nitrogen isotopic budget: Implications for Holocene nitrogen cycling. Global Biogeochemical Cycles 16(4), doi:10.1029/2001GB001856
Brandes, J.A., Devol, A.H., Yoshinari, T., Jayakumar, D.A., and Naqvi, S.W.A., 1998. Isotopic composition of nitrate in the central Arabian Sea and eastern tropical North Pacific: A tracer for mixing and nitrogen cycles. Limnol. Oceanogr. 43(7), 1680-1689
Brockmann, U.H., Raabe, T., Hesse, K., Viehweger, K., Rick, S., Starke, A., Fabiszisky, B., TopÇu, and Heller, R., 1999. Seasonal budgets of the nutrient elements N and P at the surface of the German Bight during winter 1996, spring 1995, and summer 1994. German Journal of Hydrography 51(2/3), 267-291
Brockmann, U.H., 1994. Organic Matter in the Elbe Estuary. Neth. Journal of Aquatic Ecology 28(3-4), 371-381
Brockmann, U.H., and Pfeiffer, A., 1990. Seasonal changes of dissolved and particulate material in the turbidity zone of the River Elbe. In: W. Michaelis (Editor), "Estuarine Water Quality Management". Springer, Heidelberg, 327-334
Bronk, D.A., 2002. Dynamics of DON. In: D.A. Hansell and C.A. Carlson (Eds.), "Biogeochemistry of Marine Dissolved Organic Matter". Academic Press, New York, 153-247.
Bronk, D.A., Lomas, M.W., Gilbert, P.M., Schukert, K.J., and Sanderson, M.P., 2000. Total dissolved nitrogen analysis: Comparisons between the persulfate, UV, and high temperature oxidation methods. Mar. Chem. 69, 163-178
Bronk, D.A., See, J.H., Bradley, P., and Killberg, L., 2007. DON as a source of bioavailable nitrogen for phytoplankton. Biogeosciences 4, 283-296
Burdige, D.J., 2002. Sediment pore waters. In: D.A. Hansell, C.A. Carlson (Eds.), "Biogeochemistry of Marine Dissolved Organic Matter", Academic press, San Diego, 611-663
Bushaw, K.L., Zepp, R.G., Tarr, M.A., Schulz-Jander, D., Bourbonniere, R.A., Hodson, R., Miller, W.L., Bronk, D.A., and Moran, M.A., 1996. Photochemical release of biologically labile nitrogen from dissolved organic matter. Nature 381, 404-407
Butler, E.I., Knox, S., and Liddicoat, M.I., 1979. The relationship between inorganic and organic nutrients in seawater. J. Mar. Biol. Assoc. UK 59, 239-250
Capone, D., Zehr, J., Pearl, H., Bergman, B., and Carpenter, E., 1994. Amino acid cycling in colonies of the planktonic marine cyanobacterium. Science 276, 1221-1229
Carlson, C.A., 2002. Production and removal processes. In: D.A. Hansell, C.A. Carlson (Eds.), "Biogeochemistry of Marine Dissolved Organic Matter", Academic press, San Diego, 91-151
References ___________________________________________________________________________
111
Carlson, C.A., Ducklow, H.W., and Michaels, A.F., 1994. Annual flux of dissolved organic carbon from the euphotic zone in the northwestern Sargasso Sea. Nature 371, 405-408
Carpenter, E.J., Harvey, H.R., Fry, B., and Capone, D.G., 1997. Biogeochemical tracers of the marine cyanobacterium Trichodesmium. Deep Sea Res. I 44, 27-38
Casciotti, K.L., 2009. Inverse kinetic isotope fractionation during bacterial nitrite oxidation. Geochim. Cosmochim. Acta 73(7), 2061-2076
Casciotti, K.L., and Mcilvin, M.R., 2007. Isotopic analyses of nitrate and nitrite from reference mixtures and application to Eastern Tropical North Pacific waters. Mar. Chem. 107, 184–201
Casciotti, K.L., Sigman, D.M., and Ward, B.B., 2003. Linking diversity and stable isotope fractionation in ammonia-oxidizing bacteria. Geomicrobiology Journal 20(4), 335-353
Casciotti, K.L., Sigman, D.M., Hastings, M.G., Bohlke, J.K., and Hilkert, A., 2002. Measurement of the oxygen isotopic composition of nitrate in seawater and freshwater using the denitrifier method. Analytical Chemistry 74(19), 4905-4912
Casciotti, K.L., Trull, T.W., Glover, D.M., and Davies, D., 2008. Constraints on nitrogen cycling at the subtropical North Pacific Station ALOHA from isotopic measurements of nitrate and particulate nitrogen. Deep-Sea Research II 55(14-15), 1661-1672
Cifuentes, L.A., Fogel, M.L., and Pennock, J.R., 1989. Biogeochemical factors that influence the stable nitrogen isotope ratio of dissolved ammonium in the Delaware Estuary. Geochim Cosmochim Acta 53, 2713–2721
Coban-Yildiz, Y., Altabet, M.A., Yilmaz, A. and Tugrul, S., 2006. Carbon and nitrogen isotopic ratios of suspended particulate organic matter (SPOM) in the Black Sea water column. Deep Sea Research II 53, 1875-1892
Codispoti, L.A., Brandes, J.A., Christensen, J.P., Devol, A.H., Naqvi, S.W.A., Paerl, H.W., and Yoshinari, T., 2001. The oceanic fixed nitrogen and nitrous oxide budgets: Moving targets as we enter anthropocene? Sci. Mar. 65, 85-105
Cornell, S., Rendell, A., and Jickells, T., 1995. Atmospheric inputs of dissolved organic nitrogen to the oceans. Nature 376, 243-246
Dagg, M.J., 1974. Loss of prey body contents during feeding by an aquatic predator. Ecology 55, 903-906
Dähnke, K., Bahlmann, E., and Emeis, K.-C., 2008. A nitrate sink in estuaries? An assessment by means of stable nitrate isotopes in the Elbe estuary. Limnol. Oceanogr. 53(4), 1504-1511
De Corte, D., Yokokawa, T., Varela, M,, Agogué, H., and Herndl, G.J., 2009. Spatial distribution of Bacteria and Archaea and amoA gene copy numbers throughout the water column of the Eastern Mediterranean Sea. The ISME Journal 3(2), 147-158
Deutsch, B., Voss, M. and Fischer, H., 2009. Nitrogen transformation processes in the Elbe River: Distinguishing between assimilation and denitrification by means of stable isotope ratios in nitrate. Aquat. Sci. 71, 228-237
Diaz, F., and Raimbault, P., 2000. Nitrogen regeneration and dissolved organic nitrogen release during spring in a NW Mediterranean coastal zone (Gulf of Lions): implications for the estimation of new production. MEPS 197, 51-65
Duce, R.A., LaRoche, J., Altieri, K., Arrigo, K.R., Baker, A.R., Capone, D.G., Cornell, S., Dentener, F., Galloway, J., Ganeshram, R.S., Geider, R.J., Jickells, T., Kuypers, M.M.,
References ___________________________________________________________________________
112
Langlois, R., Liss, P.S., Liu, S.M., Middelburg, J.J., Moore, C.M., Nickovic, S., Oschlies, A., Pedersen, T., Prospero, J., Schlitzer, R., Seitzinger, S., Sorensen, L.L., Uematsu, M., Ulloa, O., Voss, M., Ward, B., and Zamora, L., 2008. Impacts of atmospheric anthropogenic nitrogen on the open ocean. Science 320(893), 893-897
Düngeverordnung (DüV) in der Fassung der Bekanntmachung vom 27. Februar 2007 (BGBl. I S. 22), geändert durch Artikel 1 der Verordnung vom 6. Februar 2009 (BGBl. I S.153)"
Eisma, D., 1986. Flocculation and de-flocculation of suspended matter in estuaries. Netherlands Journal of Sea Research 20(2/3), 183-199
Fagerli, H., Legrand, M., Preunkert, S., Vestreng, V., Simpson, D., and Cerqueira M., 2007. Modeling historical long-term trends of sulfate, ammonium, and elemental carbon over Europe: A comparison with ice core records in the Alps, Journal of Geophysical Research-Atmospheres 112, doi:10.1029.2006JD008044
FGG-Elbe,FlussgemeinschaftElbe,2010. www.fgg-elbe.de/tl_fgg_neu/allgemein/statistik.html
Fogg, G.E., 1966. The extracellular products of algae. Oceanogr. Mar. Biol. Ann. Rev. 4, 195-212
Fogg, G.E., 1983. The ecological significance of algal extracellular products of phytoplankton photosyntesis. Bot. Mar. 26, 3-14
Fry, B., 2002. Conservative mixing of stable isotopes across estuarine salinity gradients: A conceptual framework for monitoring watershed influences on downstream fisheries production. Estuaries 25(2), 264-271
Fuhrman, J.A., 1999. Marine viruses and their biogeochemical and ecological effects. Nature 399, 541-548
Fuhrman, J.A., 2000. Impact of viruses on bacterial processes. In: D.L. Kirchman (Ed.), "Microbial Ecology of the Oceans", Wiley-Liss, New York, 327-350
Gat, J.R., Shemesh, A., Tziperman, E., Hecht, A., Georgopoulos, D., and Basturk, O., 1996. The stable isotope composition of waters of the eastern Mediterranean Sea. Journal of Geophysical Research 101(C3), 6441-6451
Gaye-Haake, B., Lahajnar, N., Emeis, K.C., Rixen, T., Unger, D., Schulz, H., Ramaswamy, V., Paropkari, A.L., Guptha, M.V.S., and Ittekkot, V., 2005. Stable nitrogen isotopic ratios of sinking particles and sediments from the northern Indian Ocean. Marine Chemistry 96, 243-255
Glibert, P.M., and Bronk, D.A., 1994. Release of dissolved organic nitrogen by marine diazotrophic cyanobacteria Trichodesmium spp. Appl. Environ. Microbiol. 36, 3996-4000
Gobler, C.J., Hutchins, D.A., Fisher, N.S., Cosper, E.M., and Sañudo-Wilhelmy, S.A., 1997. Release and bioavailability of C, N, P, Se, and Fe following viarl lysis of a marine chrrysophyte. Limnol. Oceanogr. 42, 1492-1504
Granger, J., Sigman, D.M., Needoba, J.A., and Harrison, P.J., 2004. Coupled nitrogen and oxygen isotope fractionation of nitrate during assimilation by cultures of marine phytoplankton. Limnol. Oceanogr. 49(5), 1763-1773
Grasshoff, K., Ehrhardt, M., Kremling, K., and Anderson, L.G. (Eds), 1999. Methods of Seawater Analysis. Verlag Chemie, Weinheim, 632 pp.
References ___________________________________________________________________________
113
Gruber, N., and Sarmiento, J., 1997. Global patterns of nitrogen fixation and denitrification. Global Biogeochemical Cycles 11, 235-266
Hadas, O., Altabet, M.A., and Agnihotri, R., 2009. Seasonally varying nitrogen isotope biogeochemistry of particulate organic matter in Lake Kinneret, Israel. Limnol. Oceanogr. 54(1), 75-85
Hastings, M.G., Sigman, D.M., and Lipschultz, F., 2003. Isotopic evidence for source changes of nitrate in rain at Bermuda. Journal of Geophysical Research-Atmospheres 108(D24), 4790, doi:10.1029/2003JD003789
Hayes, J.M., 1983. Practice and principles of isotopic measurements in organic geochemistry. In: W.G. Meinschein (Ed.), “Organic Geochemistry of Contemporaneous and Ancient Sediments”. Soc. Econ. Paleont. Minerol., 5-1 - 5-31
Heaton, T.H.E., 1986. Isotopic studies of nitrogen pollution in the hydrosphere and atmosphere: a review. Chemical Geology: Isotope Geoscience section 59, 87-102
Hebbel, H., and Steuer, D., 2006. Empirische Untersuchungen zur Berechnung von Frachten in Fließgewässern. In: Hauptmann, H. and Krumbholz, W. (Eds.), "Discussion Papers in Statistics and Quantitative Economics", Hamburg
Hedges, J.I., and Hare, P.E., 1987. Amino acid adsorption by clay minerals in distilled water. Geochim. Cosmochim. Acta 51, 255-259
Hoch, M.P., Fogel, M.L., and Kirchman, D.L., 1992. Isotope Fractionation Associated with Ammonium Uptake by a Marine Bacterium. Limnol. Oceanogr. 37(7), 1447-1459
Horrigan, L., Lawrence, R.S., and Walker, P., 2002. How sustainable agriculture can address the environmental and human health harms of industrial agriculture. Environmental health perspectives 110 (5), 445–456, doi:10.1289/ehp.02110445. PMID 12003747
Howarth, R.W., 2004. Human acceleration of the nitrogen cycle: drivers, consequences, and steps toward solutions. Water Sci Technol 49, 7-13
Ibello, V., Cantoni, C., Cozzi, S., and Civitarese, G., 2010. First basin-wide experimental results on N2 fixation in the open Mediterranean Sea. Geophys. Res. Lett. 37(3), 1-5
IKSE, 2005. Die Elbe und ihr Einzugsgebiet, ein geographisch-hydrologischer und wasserwirtschaftlicher Überblick, IKSE, Magdeburg.
Ishiwatari, R., 1992. Macromolecular material (humic substances) in the watercolumn and sediments. Mar. Chem. 39, 151-166
Johannsen, A., Dähnke, K. and Emeis, K., 2008. Isotopic composition of nitrate in five German rivers discharging into the North Sea. Org. Geochem. 39, 1678-1689
Jumars, P.A., Penry, D.L., Baross, J.A., Perry, M.J., Frost, B.W., 1989. Closing the microbial loop: Dissolved carbon pathway to heterotrophic bacteria from incomplete ingestion, digestion, and absorption in animals. Deep-Sea Res. 36, 483-495
Kaushal, S.S., and Lewis Jr., W.M., 2005. Fate and transport of organic nitrogen in minimally disturbed montane streams of Colorado, USA. Biogeochemistry 74, 303-321
Keil, R.G., and Kirchman, D.L., 1993. Dissolved combined amino acids: Chemical form and utilization by marine bacteria. Limnol. Oceanogr. 38, 1256-1270
Kendall, C., 1998. Tracing nitrogen sources and cycling in catchments. In: Kendall, C., and McDonnell, J.J. (Eds.), "Isotope Tracers in Catchment Hydrology", Elsevier, 521-576
References ___________________________________________________________________________
114
Kendall, C., Elliott, E.M., and Wankel, S.D., 2007. Tracing Anthropogenic Inputs of Nitrogen to Ecosystems. In: K. Lajtha and R. H. Michener (Eds.), "Stable Isotopes in Ecology and Environmental Science"9, Wiley, Hoboken, 375-449
Kerner, M., and Spitzy, A., 2001. Nitrate regeneration coupled to degradation of different size fractions of DON by the picoplankton in the Elbe estuary. Microb. Ecol. 41, 69-81
Knapp, A., DiFiore, P.J., Deutsch, C., Sigman, D.M., and Lipschultz, F., 2008. Nitrate isotopic composition between Bermuda and Puerto Rico: Implications for N2 fixation in the Atlantic Ocean. Global Biogeochem. Cycles 22(GB3014), 1-14
Knapp, A.N., Sigman, D.M., and Lipschultz, F., 2005. N-isotopic composition of dissolved organic nitrogen and nitrate at the Bermuda Atlantic Time-Series study site. Global Biogeochem. Cycles 19(GB1018), 1-15
Koppelmann, R., Böttger-Schnack, R., Möbius, J., and Weikert, H., 2009. Trophic relationships of zooplankton in the eastern Mediterranean Sea based on stable isotope measurements. Journ. of Plankton Res. 31(6), 669-686
Koroleff, F., 1976. Total and organic nitrogen. In: K. Grasshoff, M. Ehrhard and K. Kremling (Eds.), "Methods of Seawater Analysis". Verlag Chemie, Weinheim, pp. 125-139
Kouvarakis, G., Mihalopoulos, N., Tselepides, A., and Stavrakakis, S., 2001. On the importance of atmospheric inputs of inorganic nitrogen species on the propductivity of the eastern Mediterranean Sea. Global Biogeochemical Cycles 15(4), 805-817
Kranck, K., 1984. Role of flocculation in the filtering of particulate matter in estuaries. In: V.S. Kennedy (Ed.), "The Estuary as a Filter". Academic Press, Orlando FL., New York, pp. 159-175
Kress, N., and Herut, B., 2001. Spatial and seasonal evolution of dissolved oxygen and nutrients in the Southern Levantine Basin (Eastern Mediterranean Sea): Chemical characterisation of the water masses and inferences on the N: P ratios. Deep-Sea Res. Part I 48, 2347-2372
Krom, M., Emeis, K., and Van Cappellen, P., 2010. Why is the Eastern Mediterranean phosphorus limited? Progress in Oceanography 85, 236-244
Krom, M.D., Groom, S., and Zohary, T., 2003. The Eastern Mediterranean. In: K.D. Black and G.B. Shimmield (Eds.), "The Biogeochemistry of Marine Systems", Blackwell Publishing, Oxford, pp. 91-122
Krom, M.D., Herut, B., and Mantoura R.F.C., 2004. Nutrient budget for the Eastern Mediterranean: Implications for phosphorus limitation. Limnol. Oceanogr. 49(5), 1582-1592
Krom, M.D., Kress, N., Brenner, S., and Gordon, L.I., 1991. Phosphorus limitation of primary production in the eastern Mediterranean Sea. Limnol. Oceanogr. 36, 424-432
Krom, M.D., Thingstad, T.F., Brenner, S., Carbo, P., Drakopoulos, P., Fileman, T.W., Flaten, G.A.F., Groom, S., Herut, B., Kitidis, V., Kress, N., Law, C.S., Liddicoat, M.I., Mantoura, R.F.C., Pasternak, A., Pitta, P., Polychronaki, T., Psarra, S., Rassoulzadegan, F., Skjoldal, E.F., Spyres, G., Tanaka, T., Tselepides, A., Wassmann, P., Wexels Riser, C., Woodward, E.M.S., Zodiatis, G., and Zohary, T., 2005a. Summary and overview of the CYCLOPS P addition Lagrangian experiment in the Eastern Mediterranean Sea. Deep-Sea Research II 52, 3090-3108
Krom, M.D., Woodward, E.M.S., Herut, B., Kress, N., Carbo, P., Mantoura, R.F.C., Spyres, G., Thingstad, T.F., Wassmann, P., Wexels-Riser, C., Kitidis, V., Law, C.S., and
References ___________________________________________________________________________
115
Zodiatis, G., 2005b. Nutrient cycling in the south east Levantine basin of the eastern Mediterranean: Results from a phosphorus starved system. Deep-Sea Research 2, 52, 2879-2896
Lampert, W., 1978. Release of dissolved organic carbon by grazing zooplankton. Limnol. Oceanogr. 23, 831-834
Lara, R.J., Rachold, V., Kattner, G., Hubberten, H.W., Guggenberger, G., Skoog, A., and Thomas, D.N., 1998. Dissolved organic matter and nutrients in the Lena River, Siberia Arctic: Characteristics and distribution. Marine Chemistry 59, 301-309
Larsson, U., and Hagström, Å., 1979. Phytoplankton exudate release as an energy source for the growth of pelagic bacteria. Mar. Biol. 52, 199-206
Lascaratos, A., Roether, W., Nittis, K., and Klein, B., 1999. Recent changes in deep water formation and spreading in the eastern Mediterranean Sea: a review. Progress in Oceanography 44, 5–36
Lawton, L.A., Codd, G.A., 1991. Cyanobacterial (blue-green algae) toxins and their significance in UK and European waters. Journal of Soil and Water Conservation 40, 87–97
LeGrande, N.A., and Schmidt, G.A., 2006. Global gridded data set of the oxygen isotopic composition in seawater. Geophys. Res. Lett. 33(L12604), 1-5
Lehmann, M.F., Reichert, P., Bernasconi, S.M., Barbieri, A., and McKenzie, J.A. 2003. Modelling nitrogen and oxygen isotope fractionation during nitrate reduction in a hypolimnetic redox transition zone. Geochim. Cosmochim. Acta 67, 2529-2542
Lehmann, M.F., Sigman, D.M., McCorkle, D.C., Brunelle, B.G., Hoffmann, S., Kienast, M., Cane, G., and Clement, J., 2005. The origin of the deep Bering Sea nitrate deficit - Constraints from the nitrogen and oxygen isotopic composition of water-column nitrate and benthic nitrate fluxes. Global Biogeochemical Cycles 19(GB4005), 1-15
Li, Q. P., Hansell, D.A., and Zhang, J.Z., 2008. Underway monitoring of nanomolar nitrate plus nitrite and phosphate in oligotrophic seawater. Limnol. Ocean. Methods 6, 319-326
Liss, P.S., 1976. Conservative and non-conservative behaviour of dissolved constituents during estuarine mixing. In: J.D. Burton and P.S. Liss (Eds.), "Estuarine Chemistry". Academic Press, New York, 93-130
Lomas, M.W., and Glibert, P.M., 1999. Temperature regulation of nitrate uptake: A novel hypothesis about nitrate uptake and reduction in cool-water diatoms. Limnol. Oceanogr. 44, 556-572
Lytle, C.R., and Perdue, E.M., 1981. Free, proteinaceous, and humic bound amino acids in river water containing high concentrations of aquatic humics. Environ. Sci. Technol. 15, 224-228
Mahaffey, C., Michaels, A., and Capone D.G., 2005. The conundrum of marine nitrogen fixation. American Journal of Science 305, 546–595
Malanotte-Rizzolli, P., and Bergamasco, A., 1989. The circulation of the eastern Mediterrean, Part 1. Oceanol. Acta 12, 335-351
Mann, K.H., 1982. Ecology of Coastal Waters. A System Approach, Blackwell Scientific, Oxford, pp. 322
References ___________________________________________________________________________
116
Mannino, A., and Harvey, H.R., 1999. Lipid composition in particulate and dissolved organic matter in the Delaware Estuary: Sources and diagenetic patterns. Geochim Cosmochim Acta 63(15), 2219-2235
Mara, P., Mihalopoulos, N., Gogou, A., Dähnke, K., Schlarbaum, T., Emeis, K.-C., and Krom, M., 2009. Isotopic composition of nitrate in wet and dry atmospheric deposition on Crete in the eastern Mediterranean Sea. Global Biogeochem. Cycles 23(GB4002), 1-11
Mariotti, A., Germon, J.C., Hubert, P., Kaiser, P., Letolle, R., Tardieux, A., and Tardieux, P., 1981. Experimental determination of nitrogen kinetic isotope fractionation: some principles; illustration for the denitrification and nitrification processes. Plant Soil 62, 413-430
Mariotti, A., Lancelot, A., and Billen, G., 1984. Natural isotopic composition of nitrogen as a tracer of origin for suspended matter in the Scheldt Estuary. Geochimica and Cosmochimica Acta 48, 549-555
Martin, A., and Cooke, G.D., 1994. Health risks in eutrophic water supplies. Lake Line 14, 24–26
McClelland, J.W., and Valiela, I., 1998. Linking nitrogen in estuarine producers to land-derived sources. Limnol. Oceanogr. 43, 577-585
Meador, T.B., Aluwihare, L.I., and Mahaffey, C., 2007. Isotopic heterogeneity and cycling of organic nitrogen in the oligotrophic ocean. Limnol. Oceanogr. 52(3), 934-947
Mengis, M., Schiff, S.L., Harris, M., English, M.C., Aravena, R., Elgood, R.J., and MacLean, A., 1999. Multiple geochemical and isotopic approaches for assessing ground water NO3
- elimination in a riparian zone. Ground Water 37, 448-457
Menzel, D.W., and Vaccaro, R.F., 1964. The measurement of dissolved organic and particulate carbon in seawater. Limnol. Oceanogr. 9, 138-142
Meybeck, M., 1993. C, N, P and S in rivers: From sources to global inputs. In: Wollast, R., Mackenzie, F.T., and Chou, L. (Eds.), "Interactions of C, N, P, and S Biogeochemical Cycles and Global Change", Springer Verlag Berlin, 163-193
Middelburg, J.J., and Herman, P.M.J., 2007. Organic matter processing in tidal estuaries. Mar. Chem. 106(1-2), 127-147
Middelburg, J.J., and Nieuwenhuize, J., 2001. Nitrogen Isotope Tracing of Dissolved Inorganic Nitrogen Behaviour in Tidal Estuaries. Estuarine, Coastal and Shelf Science 53, 385-391
Miller, C.A., and Glibert, P.M., 1998. Nitrogen excretion by the calanoid copepod Acartia tonsa: Results from mesocosm experiments. J. Plankton Res. 20, 1767-1780
Minagawa, M., and Wada, E., 1986. Nitrogen isotope ratios of red tide organisms in the East China Sea: A characterization of biological nitrogen fixation. Mar. Chem. 19, 245-249
Montoya, J., Carpenter, E., and Capone, D., 2002. Nitrogen fixation and nitrogen isotope abundance in zooplankton of the oligotrophic North Atlantic. Limnol. Oceanogr. 47, 1617– 1628
Münster, U., and De Haan, H., 1998. The role of microbial extracellular enzymes in the transformation of dissolved organic matter in humic waters. In: D.O. Hessen, T.J. Tranvik (Eds.), "Aquatic Humic Substances", Springer-Verlag, Berlin, 199-257
References ___________________________________________________________________________
117
OSPAR, 2008. Second OSPAR Integrated Report on the Eutrophication Status of the OSPAR Maritime Area, OSPAR Commission.
Palenik, B., and Hensen, S.E., 1997. The use of amides and other organic nitrogen sources by the phytoplankton Emiliana huxlleyi. Limnol. Oceanogr. 42, 1544-1551
Palenik, B., and Morel, F.M.M., 1990a. Amino acid utilization by marine phytoplankton: A novel mechanism. Limnol. Oceanogr. 35, 260-269
Palenik, B., and Morel, F.M.M., 1990b. Comparison of cell-surface L-amino acid oxidases from several marine phytoplankton. Mar. Ecol. Prog. Ser. 59, 195-201
Palenik, B., and Morel, F.M.M., 1991. Amine oxidases of marine phytoplankton. App. Environ. Microbiol. 57, 2440-2443
Pantoja, S., Repeta, D.J., Sachs, J.P., and Sigman, D.M., 2002. Stable isotope constraints on the nitrogen cycle of the Mediterranean Sea water column. Deep-Sea Res. Part I-Oceanogr. Res. Pap. 49(9), 1609-1621
Pierre, C., 1999. The oxygen and carbon isotope distribution in the Mediterranean water masses. Mar. Geology 153, 41-55
Preunkert, S., Wagenbach, D., and Legrand, M., 2003. A seasonally resolved alpine ice core record of nitrate:Comparison with anthropogenic inventories and estimation of preindustrial emissions of NO in Europe. Journal Geophysical Research 108(D21, 4681), 1-10
Raabe, T., Yu, Z., Zhang, J., Sun, J., Starke, A., Brockmann, U., and Hainbucher, D., 2004. Phase-transfer of nitrogen species in the water column of the Bohai Sea. Journal of Marine Systems 44, 213-232
Radach, G., and Paetsch, J., 2007. Variability of continental riverine freshwater and nutrient inputs into the North Sea for the years 1977-2000 and its consequences for the assessment of eutrophication. Estuaries and Coasts 30(1), 66-81
Rees, A.P., Law, C.S., and Woodward, E.M.S., 2006. High rates of nitrogen fixation during an in-situ phosphate release experiment in the Eastern Mediterranean Sea. Geophysical Res. Lett. 33(L10607), 1-4
Ribera d´Alcala, M., Civitarese, G., Conversano, F., and Lavezza, R., 2003. Nutrient ratios and fluxes hint at overlooked processes in the Mediterranean Sea. Journal of Geophysical Research 108(C9), 1-16
Rixen, T., Ittekkot, V., Haake-Gaye, B., and Schäfer, P., 2000. The influence of the SW monsoon on the deep-sea organic carbon cycle in the Holocene. Deep Sea Research Part II 47(14), 2629-2651
Roether, W., Manca, B.B., Klein, B., Bregant, D., Georgopoulos, D., Beitzel, V., Kovacevic, V., and Luchetta, A., 1996. Recent changes in Eastern Mediterranean deep waters. Science 271, 333-335
Sachs, J.P., and Repeta, D.J., 1999. Oligotrophy and nitrogen fixation during Eastern Mediterranean sapropel events. Science 286, 2485-2488
Schlarbaum, T., Dähnke, K., and Emeis, K., 2010. Dissolved organic nitrogen turnover in the Elbe estuary/NW Europe: results of nitrogen isotope investigations. Mar. Chem. 119, 91-107
References ___________________________________________________________________________
118
Seitzinger, S., Gardner, W.S., and Spratt, A.K., 1991. The effect of salinity on ammonia sorption in aquatic sediments: Implications for benthic nutrient recycling. Estuaries 2, 167-174
Seitzinger, S.P., and Sanders, R.W., 1997. Contributions of dissolved organic nitrogen from rivers to estuarine eutrophication. Mar. Ecol. Prog. Ser. 159, 1-12
Seitzinger, S.P., Sanders, R.W., and Styles, R., 2002. Bioavailability of DON from natural and anthropogenic sources to estuarine plankton. Limnol. Oceanogr. 47(2), 353-366
Sharp, J.H., 1973. Total organic carbon in seawater - comparison of measurements using persulfate oxidation and high temperature combustion. Mar. Chem. 1, 211-229
Sharp, J.H., Rinker, K.R., Savidge, K.B., Abell, J., Benaim, J.Y., Bronk, D.A., Burdige, D.J., Cauwet, G., Chen, W., Doval, M.D., Hansell, D., Hopkinson, C., Kattner, G., Kaumeyer, N., McGlathery, K.J., Merriam, J., Morley, N., Nagel, K., Ogawa, H., Pollard, C., Pujo-Pay, M., Raimbault, P., Sambrotto, R., Seitzinger, S., Spyres, G., Tirendi, F., Walsh, T.W., and Wong, C.S., 2002. A preliminary methods comparison for measurement of dissolved organic nitrogen in seawater. Mar. Chem. 78, 171-184
Sigman, D.M., Altabet, M.A., Michener, R., McCorkle, D.C., Fry, B., and Holmes, R.M., 1997. Natural abundance-level measurement of the nitrogen isotopic composition of oceanic nitrate: an adaptation of the ammonia diffusion method. Mar. Chem. 57(3-4), 227-242
Sigman, D.M., Casciotti, K.L., Andreani, M., Barford, C., Galanter, M., and Böhlke, J.K., 2001. A bacterial method for the nitrogen isotopic analysis of nitrate in seawater and freshwater. Anal. Chem. 73(17), 4145-4153
Sigman, D.M., DiFiore, P.J., Hain, M.P., Deutsch, C., Wang, Y., Karl, D.M., Knapp, A.N., Lehmann, M.F., and Pantoja, S., 2009. The dual isotopes of deep nitrate as a constraint on the cycle and budget of oceanic fixed nitrogen. Deep-Sea Res. Part I 56(9), 1419-1439
Sigman, D.M., Granger, J., DiFiore, P.J., Lehmann, M.F., Ho, R., Cane, G., and van Geen, A., 2005. Coupled nitrogen and oxygen isotope measurements of nitrate along the eastern North Pacific margin. Global Biogeochemical Cycles 19(4 (GB4022)), 1-14
Sigman, D.M., Robinson, R., Knapp, A.N., van Geen, A., McCorkle, D.C., Brandes, J.A., and Thunell, R.C., 2003. Distinguishing between water column and sedimentary denitrification in the Santa Barbara Basin using stable isotopes of nitrate. Geochem. Geophys. Geosyst. 4, 1040-1059
Smith, D.C., Simon, M., Alldredge, A.L., Azam, F., 1992. Intense hydrolytic enzyme activity on marine aggregates and implications for rapid particle dissolution. Nature 359, 139-141
Solórzano, L., and Sharp, J.H., 1980. Determination of total dissolved nitrogen in natural waters. Limnol. Oceanogr. 25(4), 751-754
Stanley, E.H., and Maxted, J.T., 2008. Changes in the dissolved nitrogen pool across land cover gradients in Wisconsin streams. Ecological Applications 18(7), 1579-1590
Stepanauskas, R., Edling, H., and Tranvik, L.J., 1999a. Differential dissolved organic nitrogen availability and bacterial aminopeptidase activity in limnic and marine waters. Microbiol. Ecology 38, 264-272
References ___________________________________________________________________________
119
Stepanauskas, R., Jørgensen, N.O.G., Eigaard, O.R., Žvikas, A., Tranvik, L.J., and Leonardsen, L., 2002. Summer inputs of riverine nutrients to the Baltic Sea: bioavailability & eutrophication relevance. Ecol. Monogr. 72(4), 579-597
Stepanauskas, R., Leonardson, L., and Tranvik, T.J., 1999b. Bioavailabilty of wetland-derived DON to freshwater and marine bacterioplankton. Limnol. Oceanogr. 44(6), 1477-1485
Stevenson, F.J., 1994. "Humus Chemistry", Wiley, New York
Struck, U., Emeis, K.-C., Rau, G.H., Voss, M., and Krom, M., 2001. Biological productivity during sapropel S5 formation in the eastern Mediterranean Sea - Evidence from stable isotopes of nitrogen and carbon. Geochimica et Cosmochimica Acta 65(19), 3241-3258
Thingstad, T.F., and Rassoulzadegan, F., 1999. Conceptual models for the biogeochemical role of the photic zone microbial food web, with particular reference to the Mediterranean Sea. Progress in Oceanography 44, 271–286
Thingstad, T.F., Krom, M.D., Mantoura, R.F.C., Flaten, G.A.F., Groom, S., Herut, B., Kress, N., Law, C.S., Pasternak, A., Pitta, P., Psarra, S., Rassoulzadegan, F., Tanaka, T., Tselepides, A., Wassmann, P., Woodward, E.M.S., Wexels Riser, C., Zodiatis, G., and Zohary, T., 2005. Nature of Phosphorus limitation in the ultraoligotrophic Eastern Mediterranean. Science 309, 1068-1071
Thurman, E.M., 1985. Organic Geochemistry of Natural Waters. Niyoff/Junk, Boston
Tobias, C.R., Harvey, J.W., and Anderson, I.C., 2001. Quantifying groundwater discharge through fringing wetlands to estuaries: Seasonal variability, methods comparison, and implications for wetland-estuary exchange. Limnol. Oceanogr. 46, 604-615
Tupas, L., and Koike, I., 1990. Amino acid and ammonium utilization by heterotrophic marine bacteria grown in enriched seawater. Limnol. Oceanogr. 35, 1145-1155
Valiela, I., and Teal, J.M., 1979. The nitrogen budget of a salt marsh ecosystem. Nature 280, 652-656
Valiela, I., Costa, J. Foreman, K., Teal, J.M., Howes, B., and Aubrey, D., 1990. Transport of groundwater-borne nutrients from watersheds and their effects on coastal waters. Biogeochemistry 10, 177-197
Veuger, B., Middelburg, J.J., Boschker, H.T.S., Nieuwenhuize, J., van Rijswijk, P., Rochelle-Newall, E.J., and Navarro, N., 2004. Microbial uptake of dissolved organic and inorganic nitrogen in Randers Fjord. Estuarine Coastal and Shelf Science 61(3), 507-515
Voss, M., Nausch, G., and Montoya, J.P., 1997. Nitrogen stable isotope dynamics in the central Baltic Sea: influence of deep-water renewal on the N-cycle changes. Mar. Ecol. Prog. Ser. 158, 11-21
Wankel, S.D., Chen, Y., Kendall, C., Post, A.F., and Paytan, A., 2009. Sources of aerosol nitrate to the Gulf of Aqaba: Evidence from δ15N and δ18O of nitrate and trace metal chemistry. Mar. Chem. 120, 90-99
Wankel, S.D., Kendall, C., Francis, C.A., and Paytan, A., 2006. Nitrogen sources and cycling in the San Francisco Bay Estuary: A nitrate dual isotopic composition approach. Limnol. Oceanogr. 51(4), 1654-1664
Warnken, C., 2003. Biogeochemie von Schwebstoffen, Sinkstoffen und Sedimenten im Ierapetra-Tief ( östliches Mittelmeer ). M.Sc. Thesis, 80 pp, University of Hamburg, Hamburg.
References ___________________________________________________________________________
120
Wiegner, T.N., Seitzinger, S.P., Glibert, P.M., and Bronk, D.A., 2006. Bioavailability of dissolved organic nitrogen and carbon from nine rivers in the eastern United States. Aquatic Microbial Ecology 53, 277-287
Williams, P.M., and Druffel, E.R.M., 1987. Radiocarbon in dissolved organic matter in the central North Pacific Ocean. Nature 330, 246-248
Wüst, G., 1961. On the vertical circulation of the Mediterranean Sea. Journal of Geophysical Research 66, 3261-3271
Yool, A., Martin, A.P., Fernández, C., and Clark, D.R., 2007. The significance of nitrification for oceanic new production. Nature 447, 999-1002
York, J.K., Tomasky, G., Valiela, I., and Repeta, D.J., 2007. Stable isotopic detection of ammonium and nitrate assimilation by phytoplankton in the Waquoit Bay estuarine system. Limnol. Oceanogr. 52, 144–155
Zohary, T., and Robarts, R.D., 1998. Experimental study of microbial P limitation in the eastern Mediterranean. Limnol. Oceanogr. 43(3), 387-395
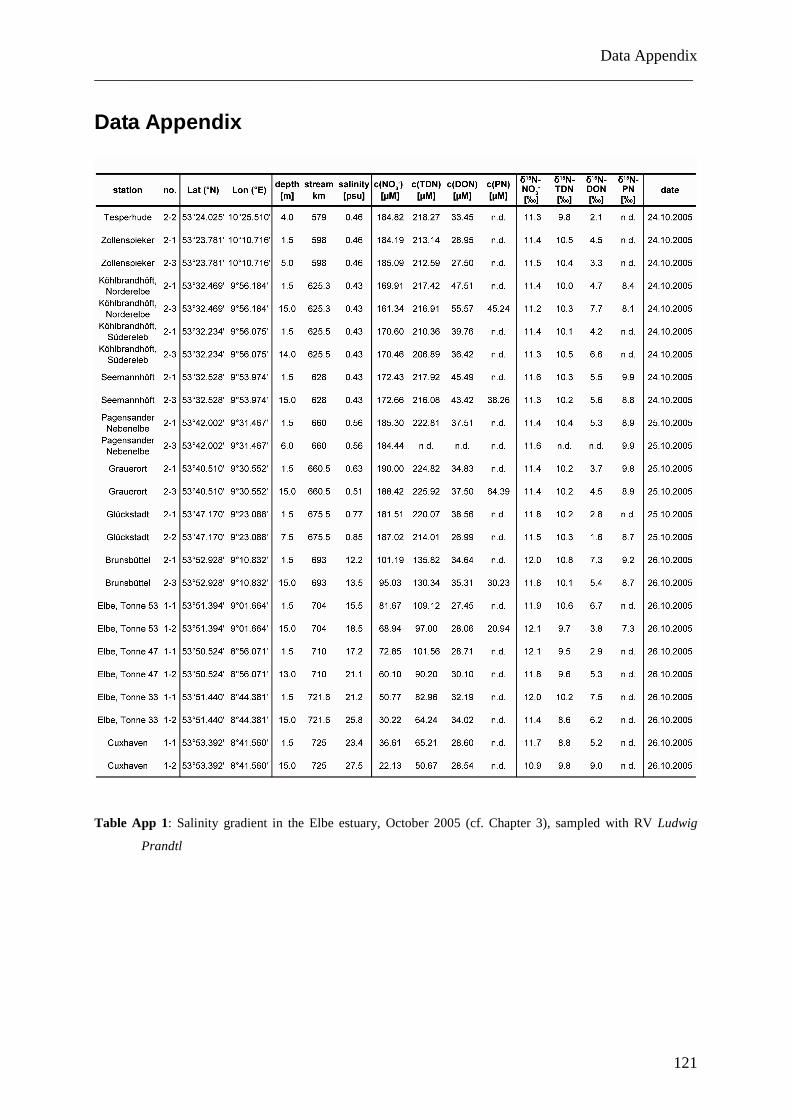
Data Appendix ___________________________________________________________________________
121
Data Appendix
Table App 1: Salinity gradient in the Elbe estuary, October 2005 (cf. Chapter 3), sampled with RV Ludwig
Prandtl
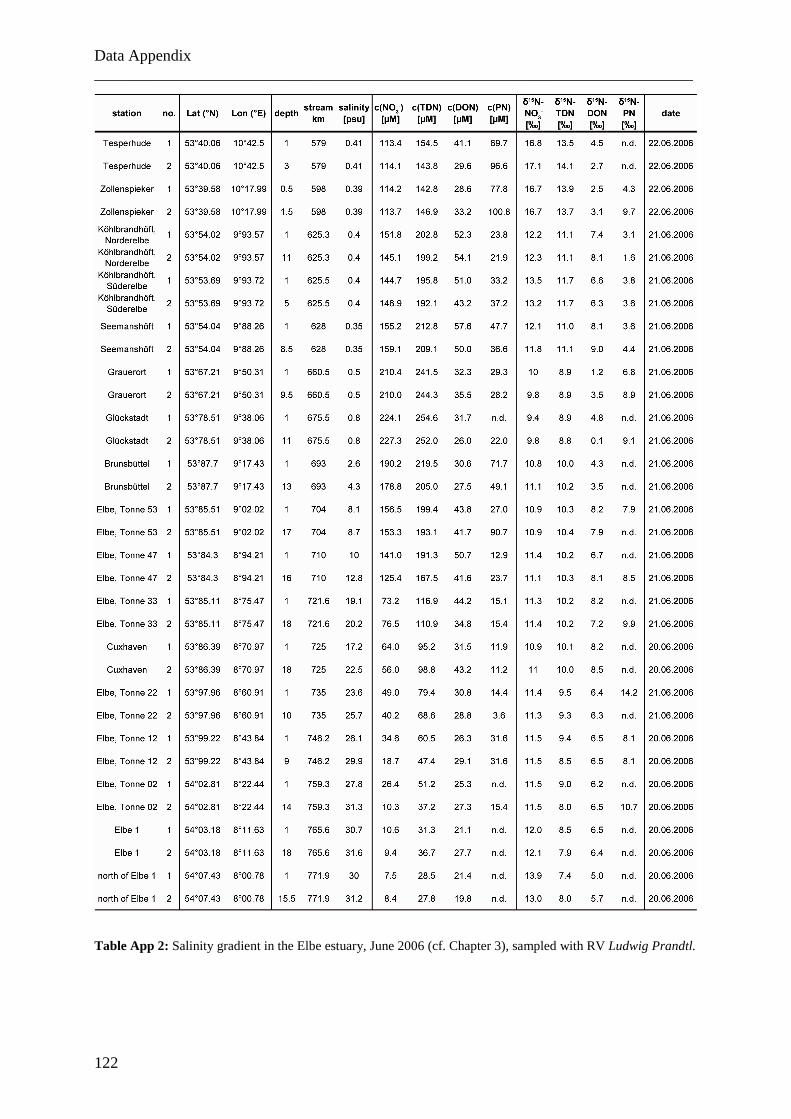
Data Appendix ___________________________________________________________________________
122
Table App 2: Salinity gradient in the Elbe estuary, June 2006 (cf. Chapter 3), sampled with RV Ludwig Prandtl.
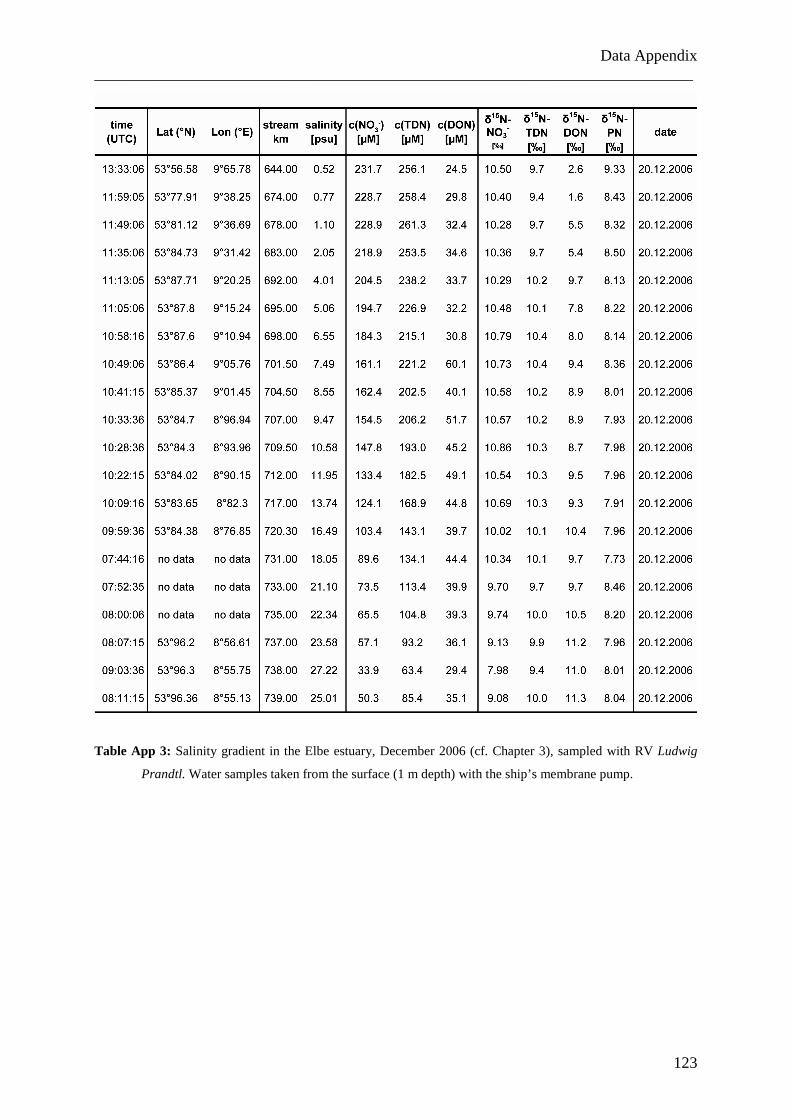
Data Appendix ___________________________________________________________________________
123
Table App 3: Salinity gradient in the Elbe estuary, December 2006 (cf. Chapter 3), sampled with RV Ludwig
Prandtl. Water samples taken from the surface (1 m depth) with the ship’s membrane pump.
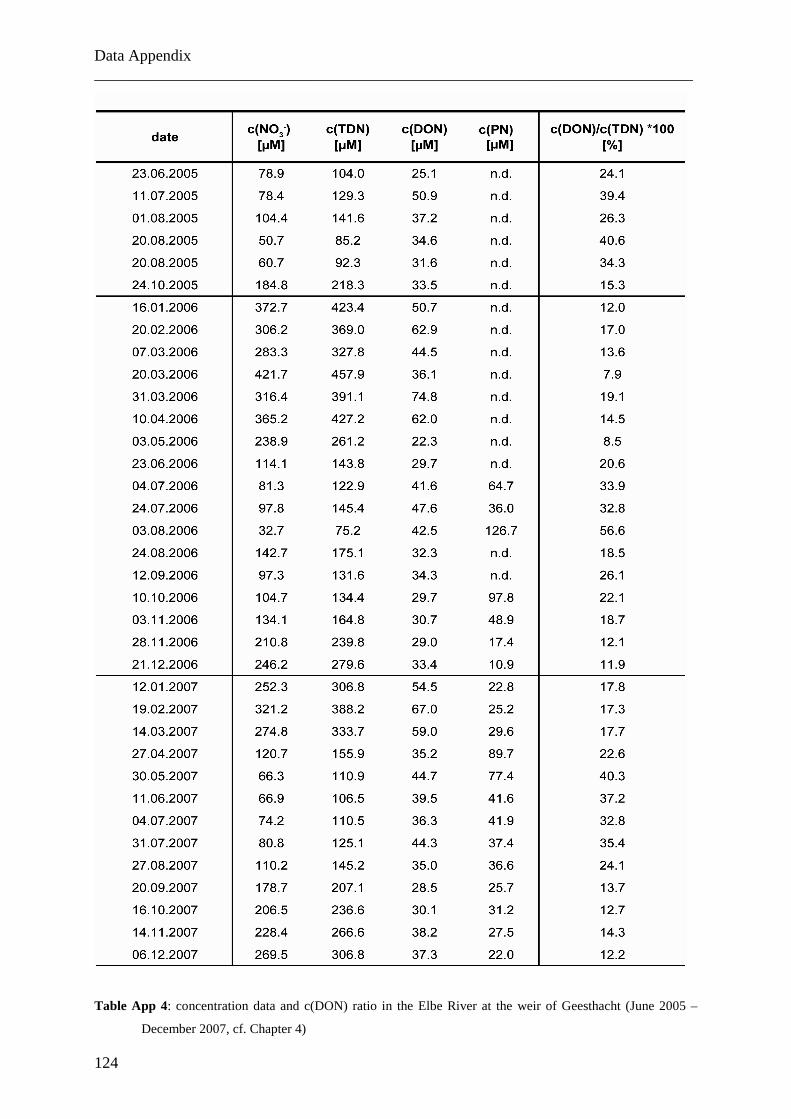
Data Appendix ___________________________________________________________________________
124
Table App 4: concentration data and c(DON) ratio in the Elbe River at the weir of Geesthacht (June 2005 –
December 2007, cf. Chapter 4)
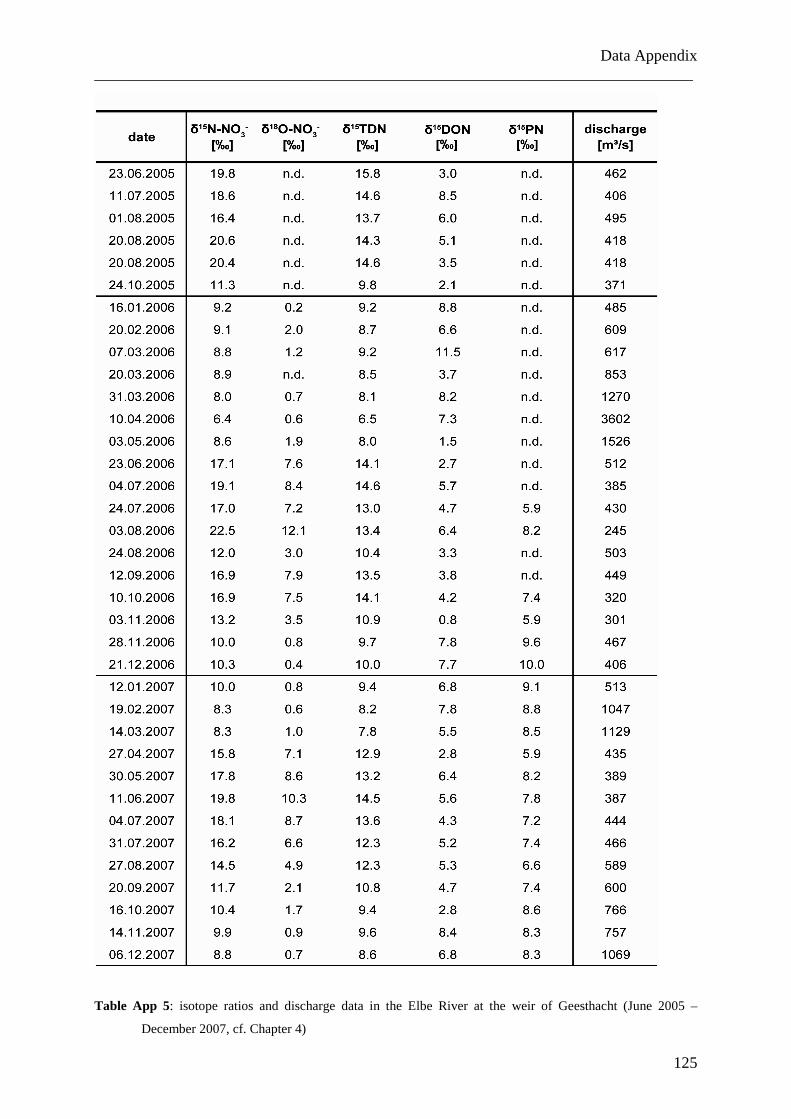
Data Appendix ___________________________________________________________________________
125
Table App 5: isotope ratios and discharge data in the Elbe River at the weir of Geesthacht (June 2005 –
December 2007, cf. Chapter 4)
Curriculum Vitae ___________________________________________________________________________
126
Curriculum Vitae
Tim Knut Schlarbaum
Born: 18.06.1974
In: Hamburg
Nationality: German
Home address: Holtenklinker Straße 49, 21029 Hamburg
Study:
Since February 2005: Ph.D. student, University of Hamburg, in cooperation
with Helmholtz Zentrum Geesthacht (formerly GKSS),
Institute for Coastal Research
Ph.D. thesis: “Assessing the role of dissolved organic
nitrogen in different ecosystems”
October 1995 – October 2004: Study of Chemistry (Diploma), University of Hamburg
January – October 2004: Diploma thesis at the Institute for Organic Chemistry:
„Identification and synthesis of hydrocarbon patterns of
insects“
February – June 2000: Sokrates student at the Institute for Inorganic Chemistry,
University of Southampton, England
September 1997: Pre-degree
Apprenticeship:
August 1990 – January 1994: Education as chemical technical assistant at the
Gymnasium Altona, Hamburg
School education:
August 1984 – June 1993: Abitur at Bismarck Gymnasium, Eimsbütteler Modell,
Hamburg
List of papers ___________________________________________________________________________
127
List of papers
Schlarbaum, T., Dähnke, K., and Emeis, K., 2010: Turnover of combined dissolved organic
nitrogen and ammonium in the Elbe estuary / NW Europe: Results of nitrogen isotopes
investigations. Mar. Chem. 119, 91-107
Schlarbaum, T., Dähnke, K., and Emeis, K., 2010: Dissolved and particulate reactive nitrogen
in the Elbe River / NW Europe: a 2-year N-isotope study. Biogeoscience Discuss. 7,
7543-7574, doi:10.5194/bgd-7-7543-2010
Emeis, K.-C., Mara, P., Schlarbaum, T., Möbius, J., Dähnke, K., Struck, U., Mihalopoulos,
N., and Krom, M., 2010: N-isotope ratios of nitrate, dissolved organic nitrogen and
particulate nitrogen in the Eastern Mediterranean Sea. In press in Journal of
Geophysical Research – Biogeochemistry
Mara, P., Mihalopoulos, N., Gogou, A., Dähnke, K., Schlarbaum, T., Emeis, K.-C., and
Krom, M., 2009. Isotopic composition of nitrate in wet and dry atmospheric deposition
on Crete in the eastern Mediterranean Sea. Global Biogeochem. Cycles 23(GB4002), 1-
11
Paetsch, J., Serna, A., Dähnke, K., Schlarbaum, T., Johannsen, A., and Emeis, K.C., 2010.
Nitrogen cycling in the German Bight (SE North Sea) – Clues from modelling stable
nitrogen isotopes. Continental Shelf Research 30, 203-213