core.ac.uk · entrepreneur returns to education differential in favor of entrepreneurs. this leads...
TRANSCRIPT
econstor www.econstor.eu
Der Open-Access-Publikationsserver der ZBW – Leibniz-Informationszentrum WirtschaftThe Open Access Publication Server of the ZBW – Leibniz Information Centre for Economics
Standard-Nutzungsbedingungen:
Die Dokumente auf EconStor dürfen zu eigenen wissenschaftlichenZwecken und zum Privatgebrauch gespeichert und kopiert werden.
Sie dürfen die Dokumente nicht für öffentliche oder kommerzielleZwecke vervielfältigen, öffentlich ausstellen, öffentlich zugänglichmachen, vertreiben oder anderweitig nutzen.
Sofern die Verfasser die Dokumente unter Open-Content-Lizenzen(insbesondere CC-Lizenzen) zur Verfügung gestellt haben sollten,gelten abweichend von diesen Nutzungsbedingungen die in der dortgenannten Lizenz gewährten Nutzungsrechte.
Terms of use:
Documents in EconStor may be saved and copied for yourpersonal and scholarly purposes.
You are not to copy documents for public or commercialpurposes, to exhibit the documents publicly, to make thempublicly available on the internet, or to distribute or otherwiseuse the documents in public.
If the documents have been made available under an OpenContent Licence (especially Creative Commons Licences), youmay exercise further usage rights as specified in the indicatedlicence.
zbw Leibniz-Informationszentrum WirtschaftLeibniz Information Centre for Economics
van Praag, Mirjam; van Witteloostuijn, Arjen; van der Sluis, Justin
Working PaperReturns for Entrepreneurs versus Employees: The Effect ofEducation and Personal Control on the Relative Performance ofEntrepreneurs vis-a-vis Wage Employees
Tinbergen Institute Discussion Paper, No. 09-111/3
Provided in Cooperation with:Tinbergen Institute, Amsterdam and Rotterdam
Suggested Citation: van Praag, Mirjam; van Witteloostuijn, Arjen; van der Sluis, Justin (2009) :Returns for Entrepreneurs versus Employees: The Effect of Education and Personal Controlon the Relative Performance of Entrepreneurs vis-a-vis Wage Employees, Tinbergen InstituteDiscussion Paper, No. 09-111/3
This Version is available at:http://hdl.handle.net/10419/87009
TI 2009-111/3 Tinbergen Institute Discussion Paper
Returns for Entrepreneurs versus Employees: The Effect of Education and Personal Control on the Relative Performance of Entrepreneurs vis-a-vis Wage Employees
Mirjam van Praag1,3
Arjen van Witteloostuijn2
Justin van der Sluis1
1 University of Amsterdam; 2 University of Antwerp, and Utrecht University; 3 Tinbergen Institute.
Tinbergen Institute The Tinbergen Institute is the institute for economic research of the Erasmus Universiteit Rotterdam, Universiteit van Amsterdam, and Vrije Universiteit Amsterdam. Tinbergen Institute Amsterdam Roetersstraat 31 1018 WB Amsterdam The Netherlands Tel.: +31(0)20 551 3500 Fax: +31(0)20 551 3555 Tinbergen Institute Rotterdam Burg. Oudlaan 50 3062 PA Rotterdam The Netherlands Tel.: +31(0)10 408 8900 Fax: +31(0)10 408 9031 Most TI discussion papers can be downloaded at http://www.tinbergen.nl.
Returns for Entrepreneurs versus Employees
The effect of education and personal control on the relative performance of entrepreneurs vis-
à-vis wage employees
MIRJAM VAN PRAAG ARJEN VAN WITTELOOSTUIJN JUSTIN VAN DER SLUIS
ABSTRACT
How valuable is education for entrepreneurs’ performance relative to employees’? What might explain
any differences? And does education affect peoples’ occupational choices accordingly? We formulate
hypotheses and test these based on a large representative US panel. We show that entrepreneurs have
higher returns to education than employees. Nevertheless, higher education affects peoples’ decisions
to become an entrepreneur negatively. Indirectly, our analysis supports the argument that the higher
return to education for entrepreneurs is due to fewer organizational constraints they face leading to
more personal control over how to use their human capital than wage employees.
JEL-codes: J23, J24, J31, J44, M13
Keywords: entrepreneurship, self-employment, returns to education, performance, personal control,
locus of control, human capital, wages, incomes
2
2
INTRODUCTION
We study the effect of a key source of human capital – i.e., education – on the relative
performance of entrepreneurs vis-à-vis employees. How is formal education related to entrepreneurial
performance? Indeed, many developed countries and regions, including the US and the EU, have
installed policies fostering successful entrepreneurship. One of these is providing people opportunities
to develop their human capital by means of education. This assumes that entrepreneurship
competencies can be developed through education. But how valid is this assumption? Can
entrepreneurship be learned in school? Perhaps surprisingly, we find that a substantial employee-
entrepreneur returns to education differential in favor of entrepreneurs. This leads to our main
contribution and conclusion that entrepreneurship can indeed be learned in school. We suggest a novel
answer to the question as to why the returns to education are higher for entrepreneurs than for wage
employees. To do so, we turn to organization theory.
Using insights from personal control theory (Benz & Frey, 2008; Douhan & Van Praag, 2009;
Hyytinen et al., 2008), we argue that the higher returns to education for entrepreneurs are due to fewer
(organizational) constraints faced by entrepreneurs when optimizing the profitable employment of
their education. As an entrepreneur, an individual can operate as a residual claimant. S/he can freely
decide to engage in those activities where s/he believes that her / his talents are most likely to generate
high returns. In contrast, as an employee, an individual is bounded by organizational processes and
structures, with the higher ranked making the key decisions. So, there are limits to what an individual
can decide to do inside the “iron cage” of an organization owned by others. We will test the validity of
this personal control hypothesis, as well as a number of alternative explanations of the higher
entrepreneurial returns to education. The data turn out to reject the alternative explanations, but not
the personal control explanation.
Our second contribution involves the follow-up question, given the higher entrepreneurial
returns finding: Are higher educated people more or less likely to enter into entrepreneurship? It is
often claimed that education is a waste of time in case you want to become an entrepreneur. These
3
3
claims imply that entrepreneurship competencies cannot be (effectively) developed through formal
education. This popular narrative can be contrasted with the standard argument that formal education
is associated with a higher likelihood of opting for entrepreneurship, the reason being that higher
educated people are more likely to observe entrepreneurial opportunities. Our analyses reveal that the
choice for entrepreneurship versus wage employment is negatively related to education. So, the choice
behavior is inconsistent with (information about) higher returns to education in entrepreneurship than
in wage employment. We put these seemingly contradictory findings in the perspective of the literature
that has shown wide support for the fact that the choice for entrepreneurship is not primarily driven by
income maximization, which is referred to as the ‘returns to entrepreneurship puzzle’ (Benz & Frey,
2008; Blanchflower & Oswald, 2008; Hamilton, 2000; Hyytinen, Ilmakunnas & Toivanen, 2008; Parker,
2009). Since we study the effect of education on the proceeds from and choice for entrepreneurship,
we can suggest a solution for this particular demonstration of the puzzle.
THE RETURNS TO EDUCATION LITERATURE
The study of returns to education has a long tradition in labor economics. By and large, this
tradition is based on standard human capital theory. Human capital refers to the stock of skills and
knowledge relevant to performing labor to produce economic value. It is the skills and knowledge
gained through education and experience that was first defined as such by Adam Smith (1776). Thus,
schooling is viewed as an investment in human capital (Mincer, 1958; Becker, 1964), implying that the
returns to schooling may be measured in terms of the extra income due to additional schooling. More
precisely, the internal rate of return is the discount rate that equates the present values of the lifetime
earnings flows in the case of x years of education versus the case of x-1 years of education (Hartog &
Oosterbeek, 2007). Mincer (1974) has introduced a simplified estimation strategy of rates of return to
schooling, which boils down to estimating the rate of return as the coefficient of schooling years in a
cross-section regression for individual earnings (Hartog & Oosterbeek, 2007). The rate of return thus
measures how much extra units of income are generated, ceteris paribus, by an extra unit of education.
The more recent labor economics literature has produced estimates of the rate of return to education
4
4
that, apart from controlling for a variety of alternative explanations, address the three critical
econometric pitfalls identified by Shane (2006): unobserved heterogeneity, sample selection and
endogeneity (e.g., Card, 1999; Oreopoulos, 2006). However, these estimates pertain almost exclusively
to the returns to education in wage employment. There is a separate but less developed educational
returns literature for entrepreneurs. Bringing them together is interesting since a combined analysis of
entrepreneurs and employees enables a comparison of the relative value of education for the
performance of entrepreneurs versus employees, so indirectly capturing the critical notion in the
entrepreneurship literature of opportunity cost.
In the entrepreneurship literature, a stream of studies has focused on determinants of
performance of entrepreneurs. In many of these studies, education has been included as a determinant.
Van der Sluis, Van Praag and Vijverberg (2008) draw four conclusions relevant in our context, based
on a meta-analysis of more than hundred studies of the relationship between education and
entrepreneurship (entry and performance). First, the relationship between education and selection into
entrepreneurship is mostly insignificant – i.e., in 75 per cent of the cases. Second, the relationship
between schooling and entrepreneurship performance is unambiguously positive, and significant in 67
per cent of the studies, irrespective of the performance measure used (such as survival, profit, income
or firm growth).1 Third, the meta-analysis identifies approximately twenty studies that have actually
measured the relationship between education and earnings for both entrepreneurs and employees in a
comparable fashion. The conditional correlations between education and income turn out to be similar
for entrepreneurs and employees, though somewhat higher for entrepreneurs in the US.
The fourth conclusion from the meta-analysis is that only few studies try to cope (in credible
manners) with endogenous selection of individuals into entrepreneurship vis-à-vis wage employment.
Moreover, earlier studies did not yet employ estimation strategies that account for the endogeneity of
schooling in performance equations, nor did they deal with unobserved individual characteristics that
may drive the result, possibly leading to inconsistent estimates. This may perhaps be explained by the 1 The meta-analysis further reveals that the most widely used performance measure for entrepreneurs is their income, in line with the measure used in this study.
5
5
fact that many of the earlier studies measure the relationship between education and entrepreneurship
outcomes as a by-product, while focusing on different issues. This is in sharp contrast with the
common practices developed in labor economics, when studying the returns to education for
employees (Ashenfelter, Harmon & Oosterbeek, 1999). The first strategy used to cope with
unobserved ability is trying to make the unobservable observable. Various proxies of intelligence and
other test scores have been included in income equations. The effects of adding such controls on the
estimated returns to education have been ambiguous (see Table 3 in Ashenfelter et al., 1999, for an
overview).2 Inclusion of ability proxies in the income function does not completely shield the estimated
returns against ability bias due to an imperfect correlation between such proxies and ability. Similarly,
the endogeneity issue is not solved since ability is not necessarily perfectly correlated with the
optimization behavior of individuals. Additional approaches are thus used to estimate the returns to
education for employees, such as the employment of samples of monozygotic twins (e.g., Ashenfelter
& Krueger, 1994; Bonjour et al., 2003), where identification comes from those twins who differ in their
schooling and income, assuming that all unobserved factors are approximately equal. The usual finding
is that treating education as an exogenous variable leads to downward biased estimates of the returns to
education (e.g., Ashenfelter et al., 1999).
The most widely used identification strategy is the instrumental variables (IV) approach.
Instruments are identified that explain a substantial proportion of the variance of the endogenous
variable, education in this case, but are unrelated to the dependent variable – i.e., income. Key is that
the instrumented endogenous variable is not related to the error term anymore. This method strongly
hinges on the quality and validity of the identifying instruments used. Like using twins, the IV-strategy
leads to higher estimates of the returns to education of employees than when treating education as an
exogenous variable. This is not only the case when parental background variables are used as
identifying instruments (Blackburn & Neumark, 1993), but also when changes in compulsory schooling
laws are introduced (e.g., Angrist & Krueger, 1991; Oreopoulos, 2006). Harmon, Oosterbeek and 2 Theory predicts that omitting ability in the wage equation causes OLS-estimates to be upward biased (Griliches, 1977; Harmon and Walker, 1995; Ashenfelter et al., 1999).
6
6
Walker (2003: Figure 6 on page 139) show that, based on a meta-analysis of models with endogenous
schooling, IV-estimates of returns to schooling are higher than OLS-estimates, and that IV-estimates
based on exogenous variation in schooling attainment are even higher than when instruments are based
on family background variables.
Since the meta-analysis by Van der Sluis et al. (2008), and prior to this study, three studies have
used IV-methodologies to measure the returns to education for entrepreneurs: Van der Sluis and Van
Praag (2004, 2007) and Parker and Van Praag (2006). In the current study, we re-evaluate the returns to
education for entrepreneurs (relative to employees), without some of the drawbacks that characterized
the earlier attempts. Like Van der Sluis and Van Praag (2004, 2007), and unlike Parker and Van Praag
(2006), we measure the returns to education for entrepreneurs as well as employees. Unlike Van der
Sluis and Van Praag (2004), we measure the returns to education for both groups within one
framework (income equation) such that the (significance of the) difference in the returns to education
across the two groups can be compared (by including interactions: see below). Moreover, using one
framework offers the opportunity to produce fixed effects estimates, which has not been attempted
previously.3
Like Van der Sluis and Van Praag (2004), but unlike Parker and Van Praag (2006) and Van der
Sluis and Van Praag (2007), the data enable estimating income equations with limited survival bias for
entrepreneurs thanks to the (bi)annual (panel) data collection of all labor market activities and sources
of income in the past period (see below). Furthermore, the identifying instruments used for estimating
education imply, albeit based on family background characteristics, an improvement over Van der Sluis
and Van Praag (2004) and Parker and Van Praag (2006). Nevertheless, relying on family background
variables as identifying instruments for education is a limitation in comparison to Van der Sluis and
Van Praag (2007), where identification is based on changes in compulsory schooling laws. Finally, in
the current study, we suggest and find an explanation for the robust finding of Van der Sluis and Van
3 The interacted regressor ‘Entrepreneur*Education’ in the income equation varies over time per individual due to variations over time per individual in occupational status. A substantial fraction of the individuals in the sample has been both an entrepreneur and an employee in the observed period, and can thus be used to identify the differential effect of education for spells in entrepreneurship vis-à-vis wage employment for specific individuals.
7
7
Praag (2004, 2007) and the current study that the returns to education are higher for entrepreneurs
than for wage employees. This is a novel result.
HYPOTHESES
We take an individualistic perspective on entrepreneurship as our starting point, in line with the
Austrian school in economics (Kirzner, 1973, 1997), and as recommended by Shane and Venkataraman
(2000). We assume that individuals maximize utility and that utility is determined mainly by financial
income. Thus, if a (potential) entrepreneur evaluates the income from wage employment to be higher
than from entrepreneurship, s/he will opt for the former, and vice versa.
By way of benchmark, we start from a basic proposition derived from standard human capital
theory: Education leads to higher productivity and thus to higher income (Mincer, 1958; Becker, 1964).
Human capital theory is not the only lens in support of this claim. As Harmon et al. (2003: 133–134)
argue, “[t]he literature has been dominated by human capital theory and the econometric analysis has
been interpreted in this framework. However, an important concern is that education may have a value
in the labor market not because of any effect on productivity but for ‘spurious’ reasons.” In particular,
education may act as a signal of ability or other characteristics that employers value because they
contribute to productivity, but which they cannot easily observe. Thus, schooling is not only
acknowledged for its productive effect, as assumed by Mincer, but also has value as a signal of
productive ability in labor markets without complete information (Spence, 1973; Riley, 2002), leading
to positive returns to education as well, even if education per se had no productive value.
The value of education for labor market outcomes has been measured by labor economists and
support has been found widely for positive returns (Ashenfelter et al., 1999). According to Hartog and
Oosterbeek (2007), these returns are typically estimated to be between 5 and 15 per cent. The far
majority of tests pertain to employees only (or an implicit combination of entrepreneurs and wage
employees). However, it has been contended that, in general, human capital theory indicates that the
previously acquired knowledge plays a critical role in intellectual performance, also assisting in the
integration and accumulation of new knowledge as well as the adaptation to new situations (Weick,
8
8
1996). This must then be the case for entrepreneurs as well. Indeed, there is broad and rather strong
empirical support for a positive relationship between the performance of entrepreneurs and education
(see the meta-analysis of Van der Sluis et al., 2008), although the evidence is not unambiguous (e.g.,
Davidsson & Honig, 2003). The positive relationship is not only due to the productive effect of
education for entrepreneurs. As recent studies indicate and support empirically, entrepreneurs may use
their education as a signal toward suppliers of capital (Parker & Van Praag, 2006) or (prospective)
customers and highly qualified employees (Backes-Gellner & Werner, 2007).
Hypothesis 1: The returns to education are positive for entrepreneurs.
As such, H1 is hardly surprising. It just offers a steppingstone for our next argument. For long,
economists believed that education is a valuable signal only for employees – i.e., in the selection and
hiring process by employers (Weiss, 1995). They treated entrepreneurs as a control group for which
education was assumed not to have signalling value (Van der Sluis et al., 2008). From this, there is no
reason to believe a priori that education has a greater value for employees than for entrepreneurs. So,
human capital and signalling theories are silent about the relative returns to education for entrepreneurs
in comparison to employees. However, combining empirical evidence with organization and economic
theory may provide further insight into this issue. The scarce evidence discussed above suggests that
the returns to education are higher for entrepreneurs than for employees (Van der Sluis & Van Praag,
2004, 2007). What could be the underlying mechanism?
Douhan and Van Praag (2009) build a theoretical model proposing that the underlying
mechanism is so-called personal control. The type of control they refer to is an individual’s control
over the employment of and accruals from human capital. Entrepreneurs can better form, manage and
control the environment in which they operate than wage employees. They can more easily adapt their
production processes such that they yield the highest returns to their assets. One of these assets is their
own human capital obtained through education. Entrepreneurs are not constrained by rules from
superiors or procedures within organizations, and can decide on how to employ their education in such
a way that its productive effect is the highest. In addition, the benefits of the profitable use of their
9
9
human capital accrue fully to the entrepreneur as (s)he is the residual claimant of the firm. In contrast
to the free agency of the entrepreneur, the organizational structure surrounding an employee makes it
more difficult, or perhaps even impossible, to maximize this individual’s returns to education.
Organizations cannot adapt their structure to every individual, due to organizational inertia and
individual incompatibilities. Furthermore, entrepreneurs can also better control the accruals from the
employment of their human capital: there is a one-to-one correspondence between profits and the
employment of assets, whereas wage employees are tied to wage brackets that are based on the average
productivity of their peers. As a consequence, entrepreneurs are in a position to better control the
profitable employment of their education.
Indeed, there is some direct and indirect evidence that entrepreneurs experience more personal
control and autonomy than employees. The indirect evidence is drawn from the observation that it
may be more satisfying to be an entrepreneur than an employee, despite longer working hours, more
risk, and more variable but often lower expected incomes, based on a number of cross-section studies
(Blanchflower & Oswald, 1998; Hundley, 2001) and panel studies (Benz & Frey, 2008, Kawagushi,
2006, Taylor, 1996,). The direct evidence relates to the explanation of this difference that can be
attributed to more autonomy and personal control over (the accruals from) one’s own work as an
entrepreneur compared to positions in wage employment (Benz & Frey, 2008; Hyytinen et al., 2008).
Interestingly, Hyytinen et al. (2008), studying the decision to become an entrepreneur in a large and rich
panel of Finnish monozygotic twins, find a significant difference between entrepreneurial versus wage
positions on exactly the dimension of the influence one has on how to conduct one’s task:
entrepreneurs have more influence, and thus more personal control, compared to employees. Control
over one’s work thus seems like an important distinguishing feature of entrepreneurship, leading to
higher returns to human capital, including education.
Studies from an organizational perspective addressing the effect of organizational context on
the entrepreneurship decision have also built theory and produced (indirect) evidence in line with the
argument of limited personal control for employees in larger and older organizations (Dobrev &
10
10
Barnett, 2005; Sørensen, 2007), more bureaucratic organizations (Sørensen, 2007, who argues that
organization size and age are indicators of bureaucracy) or public sector organizations (Özcan &
Reichstein, 2009). All these organizational contexts are argued to reflect non-entrepreneurial, i.e.,
constraining, environments. For example, Dobrev and Barnett (2005: 445) observe that “[m]embers of
organizations become unlikely to leave their organizations to build new ones as their organizations age
and grow—evidence that organizations are effective in shaping and constraining the innovative
behavior of their members.” Hvide (2009) shows that high-quality entrepreneurs come from larger
firms. He explains this result exactly in line with the personal control explanation , arguing that small
firms are more entrepreneurial than large firms: “Small firms can implement a wage policy that is fine-
tuned to workers’ outside option … On the other hand, large firms have a more rigid wage policy and
as a consequence lose the best workers and ideas” (Hvide, 2009: 1011).
Hypothesis 2: The returns to education are higher for entrepreneurs than for employees
Hypothesis 3: The higher returns to education for entrepreneurs vis-à-vis employees are due to higher levels of
personal control as how to employ one’s assets, including human capital obtained through education.
The above logic has implications for the question as to who decides to become an
entrepreneur. The assumption that individuals maximize utility and that utility is determined mainly by
financial income result in the proposition that the relatively high returns to education for entrepreneurs
would lead to a positive marginal effect of education on the probability of choosing for
entrepreneurship versus the alternative– i.e., wage employment. A recent example of a study
supporting this claim is Özcan and Reichstein (2009), who report a significantly positive effect of years
of education on the likelihood of a transition to entrepreneurship. Moreover, Dobrev and Barnett
(2005) show that employees with top jobs and larger spans of control are more likely to leave their
organization to establish an entrepreneurial venture than their counterparts with non-top jobs.
However, we must admit, although this argument is consistent with H2 and the assumption of rational
behavior of income-maximizing agents, the evidence about the relationship between education and
entrepreneurship status is rather mixed (Van der Sluis et al., 2008). The ambiguous evidence may well
11
11
be caused by the possibility that other non-pecuniary and cognitive factors than income maximization
may play a more prominent role in this decision: autonomy, as we indicated (Benz & Frey, 2008), a
tendency towards entrepreneurship caused by genetic factors (Nicolaou, Cherkas, Hunkin & Spector,
2008), cognitive biases arising from overoptimism (Lowe & Ziedonis, 2006; Dushnitsky, 2009) and /
or overconfidence (Hayward, Shepherd & Griffin., 2006) or a lack of information about the proceeds
from entrepreneurship relative to wage employment.
Hypothesis 4: Education is positively associated with entrepreneurship status.
Hypothesis 4alt: Education is negatively associated with entrepreneurship status.
DATA AND ESTIMATION
National Longitudinal Survey of Youth. We will estimate Mincerian income equations using
panel data from (the representative part of) the National Longitudinal Survey of Youth (NLSY) 1979-
2000. The nationally representative part of the NLSY consists of 6,111 individuals aged between 14
and 22 years in 1979.4 They have been interviewed annually up to 1994, and since then on a bi-annual
basis. Thus, the maximum number of observations per individual is 19. Within each observed year, our
sample selection includes all persons who are entrepreneurs or employees (defined below), while
excluding students and people who are unemployed or otherwise not working. Given this selection
criterion and omitting missing person-year observations, the resulting sample includes, on average and
per annum, 5,600 entrepreneurs/employees, leading to a total number of person-year observations of
66,000. Hence, the average number of year-observations per individual is 11. An important feature of
the panel is that it includes both entrepreneurial and employee spells for a subset of the individuals
who have changed occupational status during the observed period 1979-2000. This enables estimating
the differential returns to education in an entrepreneurial spell versus a spell in wage employment
controlling for fixed traits of individuals. Moreover, as occupational positions are administered at each
interview, also over the past period, all entrepreneurship spells of at least six months are recorded.
4 The original NLSY sample consists of 12,686 individuals. We exclude the supplementary military and minority samples.
12
12
Therefore, the survivorship bias is limited. That is, our estimates of the returns to education will not
pertain to surviving entrepreneurs only.
Dependent and independent variables. We define entrepreneurs conventionally as labor
market participants whose main occupation is in self-employment or who are owner-director of an
incorporated business.5 We acknowledge the limitations of this definition, also including, for instance,
independent bar and bookkeepers, in the set of entrepreneurs. Moreover, not all entrepreneurial
activities take place in (newly founded) firms, initiated by their founders. As usual, farmers are excluded
from the sample of entrepreneurs. Furthermore, in line with common practice (Fairlie, 2005b; Hartog
et al., 2010), we exclude ‘hobby’ entrepreneurs from the sample by using a lower boundary of 300 hours
per year worked as an entrepreneur.6 An employee is defined as a person whose main occupation is a
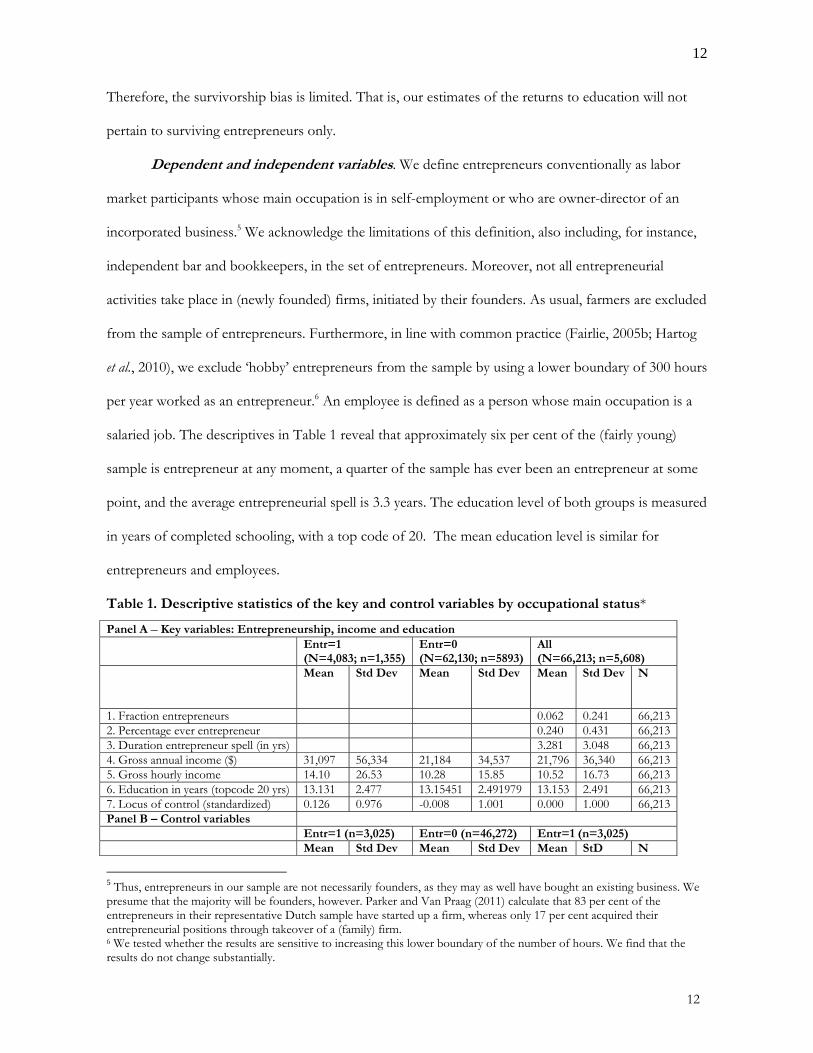
salaried job. The descriptives in Table 1 reveal that approximately six per cent of the (fairly young)
sample is entrepreneur at any moment, a quarter of the sample has ever been an entrepreneur at some
point, and the average entrepreneurial spell is 3.3 years. The education level of both groups is measured
in years of completed schooling, with a top code of 20. The mean education level is similar for
entrepreneurs and employees.
Table 1. Descriptive statistics of the key and control variables by occupational status*
Panel A – Key variables: Entrepreneurship, income and education Entr=1
(N=4,083; n=1,355)Entr=0 (N=62,130; n=5893)
All (N=66,213; n=5,608)
Mean Std Dev Mean Std Dev Mean Std Dev
N
1. Fraction entrepreneurs 0.062 0.241 66,2132. Percentage ever entrepreneur 0.240 0.431 66,2133. Duration entrepreneur spell (in yrs) 3.281 3.048 66,2134. Gross annual income ($) 31,097 56,334 21,184 34,537 21,796 36,340 66,2135. Gross hourly income 14.10 26.53 10.28 15.85 10.52 16.73 66,2136. Education in years (topcode 20 yrs) 13.131 2.477 13.15451 2.491979 13.153 2.491 66,2137. Locus of control (standardized) 0.126 0.976 -0.008 1.001 0.000 1.000 66,213Panel B – Control variables Entr=1 (n=3,025) Entr=0 (n=46,272) Entr=1 (n=3,025) Mean Std Dev Mean Std Dev Mean StD N
5 Thus, entrepreneurs in our sample are not necessarily founders, as they may as well have bought an existing business. We presume that the majority will be founders, however. Parker and Van Praag (2011) calculate that 83 per cent of the entrepreneurs in their representative Dutch sample have started up a firm, whereas only 17 per cent acquired their entrepreneurial positions through takeover of a (family) firm. 6 We tested whether the results are sensitive to increasing this lower boundary of the number of hours. We find that the results do not change substantially.
13
13
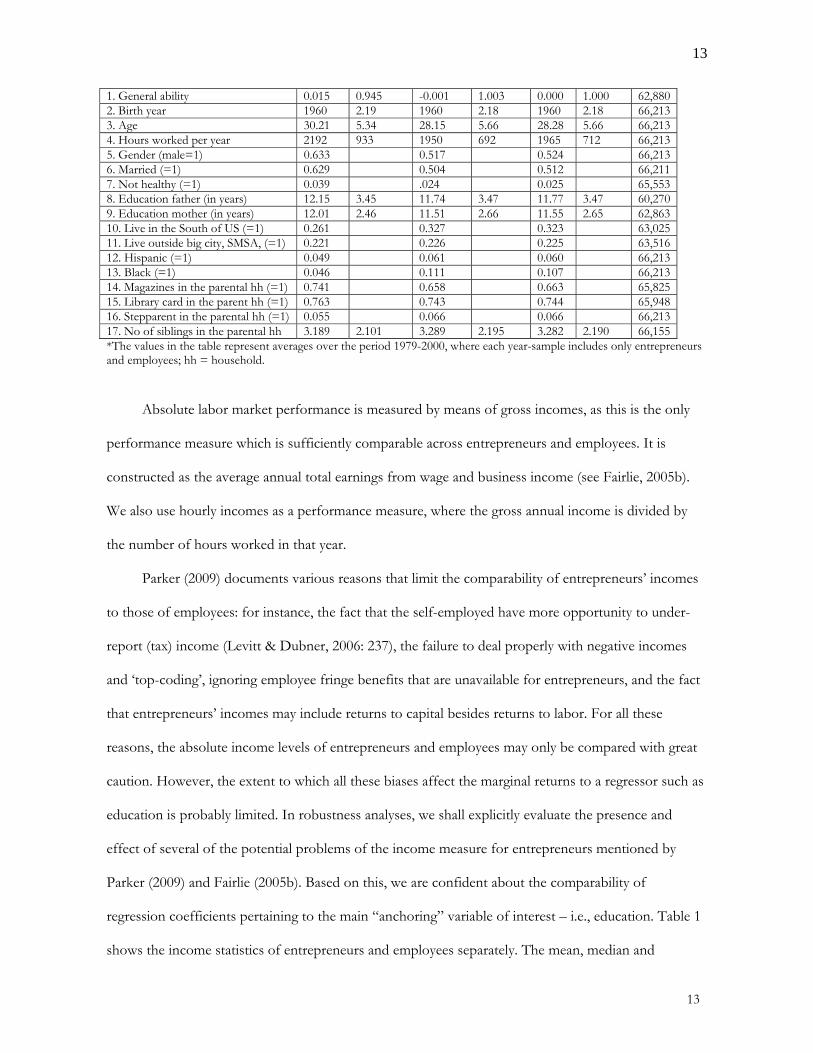
1. General ability 0.015 0.945 -0.001 1.003 0.000 1.000 62,8802. Birth year 1960 2.19 1960 2.18 1960 2.18 66,2133. Age 30.21 5.34 28.15 5.66 28.28 5.66 66,2134. Hours worked per year 2192 933 1950 692 1965 712 66,2135. Gender (male=1) 0.633 0.517 0.524 66,2136. Married (=1) 0.629 0.504 0.512 66,2117. Not healthy (=1) 0.039 .024 0.025 65,5538. Education father (in years) 12.15 3.45 11.74 3.47 11.77 3.47 60,2709. Education mother (in years) 12.01 2.46 11.51 2.66 11.55 2.65 62,86310. Live in the South of US (=1) 0.261 0.327 0.323 63,02511. Live outside big city, SMSA, (=1) 0.221 0.226 0.225 63,51612. Hispanic (=1) 0.049 0.061 0.060 66,21313. Black (=1) 0.046 0.111 0.107 66,21314. Magazines in the parental hh (=1) 0.741 0.658 0.663 65,82515. Library card in the parent hh (=1) 0.763 0.743 0.744 65,94816. Stepparent in the parental hh (=1) 0.055 0.066 0.066 66,21317. No of siblings in the parental hh 3.189 2.101 3.289 2.195 3.282 2.190 66,155*The values in the table represent averages over the period 1979-2000, where each year-sample includes only entrepreneurs and employees; hh = household.
Absolute labor market performance is measured by means of gross incomes, as this is the only
performance measure which is sufficiently comparable across entrepreneurs and employees. It is
constructed as the average annual total earnings from wage and business income (see Fairlie, 2005b).
We also use hourly incomes as a performance measure, where the gross annual income is divided by
the number of hours worked in that year.
Parker (2009) documents various reasons that limit the comparability of entrepreneurs’ incomes
to those of employees: for instance, the fact that the self-employed have more opportunity to under-
report (tax) income (Levitt & Dubner, 2006: 237), the failure to deal properly with negative incomes
and ‘top-coding’, ignoring employee fringe benefits that are unavailable for entrepreneurs, and the fact
that entrepreneurs’ incomes may include returns to capital besides returns to labor. For all these
reasons, the absolute income levels of entrepreneurs and employees may only be compared with great
caution. However, the extent to which all these biases affect the marginal returns to a regressor such as
education is probably limited. In robustness analyses, we shall explicitly evaluate the presence and
effect of several of the potential problems of the income measure for entrepreneurs mentioned by
Parker (2009) and Fairlie (2005b). Based on this, we are confident about the comparability of
regression coefficients pertaining to the main “anchoring” variable of interest – i.e., education. Table 1
shows the income statistics of entrepreneurs and employees separately. The mean, median and
14
14
standard deviation of the distribution of hourly and annual incomes are higher for entrepreneurs than
for employees, in line with Fairlie (2005a) and Parker (2009), among many.7
Finally, we need to construct a measure that reflects H3’s control argument. Ideally, we would like
to test this explanation directly by randomly allocating entrepreneurs and employees to environments
with more or less control, to subsequently observe the differences in returns to education between
people working in these two sorts of environments. Unfortunately, such an experiment is very difficult
to realize – if at all. However, if it is true that a better control of the environment influences the
possibility to optimize the returns to education, it might also be true that individuals’ perceived control
of the environment affects their returns to education. Those entrepreneurs and employees having the
perception that they are in control of their environment should then experience higher average returns
to education than others. This would support the control-related explanation indirectly. An individual’s
perceived control of the environment is measured by psychologists through the personality trait called
‘locus of control’. This measure, introduced by Rotter in 1966 in the context of his social learning
theory, is included in the NLSY.8 Locus of control is defined as an individual’s general expectancy of
the outcome of an event as being either within or beyond her or his personal control and
understanding (Rotter, 1966). Individuals with an external locus-of-control personality tend to perceive
an event as beyond their control, and attribute the outcomes of the event to chance, luck, as under
control of powerful others, or as unpredictable. Individuals with an internal locus of control tend to
believe that events are contingent upon their own behavior or relatively permanent characteristics. In
the psychological literature, there is ample evidence that locus of control is a fundamental and stable
personality trait, with clear behavioral consequences (Boone & De Brabander, 1993; Boone, van Olffen
& Van Witteloostuijn, 2005). The argument is that people with “more internal locus of control are
more likely to exploit opportunities” and will thus with a higher probability engage in entrepreneurial
7 As will become clear when discussing the regression results reported above, the income premium for entrepreneurs vanishes and turns negative when controlling for individual characteristics such as education, abilities, cohort effects, age effects, and macroeconomic circumstances. This is a common finding for the US (Parker, 2004). 8 The NLSY includes an abbreviated version of the original Rotter scale. The test was administrated in 1979, before the respondents had made any major decisions regarding their jobs or occupations. We use a normalized version of the Rotter score.
15
15
activities (Shane & Venkataraman, 2000: 223), perform better as entrepreneurs (Brockhaus, 1980) or be
more effective leaders (Boone, De Brabander & van Witteloostuijn, 1996).9 So, we decided to exploit
the NLSY data on this personal characteristic well known in the entrepreneurship literature: locus of
control. Table 1 includes the descriptive statistics of the standardized locus-of-control variable.
Control variables. We include a series of control variables known from the large labor
economics literature to affect returns to education. The bottom panel of Table 1 shows the descriptive
statistics of the control variables included in the analyses. Parental education levels are measured in the
same fashion as the respondents’ education levels: the number of completed years of education (with a
topcode of 20 years). Furthermore, dummy variables are included for gender, ethnicity, marital status,
geographic location in the US and health conditions, where the latter three variables vary over time. All
equations, even the ones where the dependent variable is hourly income, control for the number of
hours worked per year since this may affect both income measures strongly.10 As a measure of general
ability we use the Armed Forces Qualification Testscore (AFQT) included in the NLSY, as
administered in 1980. This is a general measure of trainability and a primary criterion of eligibility for
service in the armed forces. “It has been used extensively as a measure of cognitive skills in the
literature.” (Heckman, Stixrud & Urzua, 2006: 415). It comprises five areas of ability: word knowledge,
paragraph comprehension, arithmetic reasoning, coding speed and mathematics knowledge.
However, ability measures administered at different ages and different education levels within
this age range (in our case, between 15 and 23 years old) are incomparable (Heckman et al., 2006;
Hartog et al., 2010). Age affects measured ability, whereas the causality of the relationship between
education and measured ability goes both ways: “schooling causing test scores and test scores causing
schooling” (Hansen, Heckman & Muller, 2004: 40). Therefore, we remove the age and education
effects from the AFQT by regressing the test scores on a set of age and education dummies (see also
Blackburn & Neumark, 1993; Hartog et al., 2010). The individuals’ residuals are computed and
9 Locus of control plays a role in the literature on the “how” question as well. There, the argument is that entrepreneurs with specific traits have a preference for specific strategies (Wijbenga and van Witteloostuijn, 2007). We here ignore this issue. 10 We note that the number of hours worked may depend, in turn, on income. Thus the variable is not truly exogenous.
16
16
normalized. These corrected test scores are used as the measure of general ability. Since education and
general ability are so closely related, we shall estimate all equations while including and excluding the
corrected AFQT scores. Moreover, each income equation includes a set of transformed year, birth year
and age dummies according to the method proposed by Deaton (2000), such that the year effects add
to zero, and are orthogonal to a time trend (see Hartog et al., 2010). In this manner, the estimates are
obtained while controlling for cohort effects, age effects and macroeconomic circumstances.11 Finally,
we include four detailed family background variables in the income regression equations. As we shall
discuss in the empirical methodology subsection, they are not just used as regular controls, but as
instrumental variables for education.12 Although administered in 1979-1980, these variables are most of
the time recollections of household characteristics at the age of 14 (e.g., the presence of a library card
in the household). They will be discussed in detail in the next subsection.
Empirical methodology. To estimate the returns to education for entrepreneurs relative to
employees, we specify a series of income equations where the dependent variable is the log of income,
as defined above. Our main interest is in the difference between entrepreneurs and employees of the
estimated coefficients pertaining to the education variable. Therefore, we first estimate separate income
equations for entrepreneurs and employees such that we can compare the estimated levels of the
coefficients of the education variable. These are specifications (1) and (2) throughout. We then
combine the equations in the third specification, (3), and include interacted regressors of occupational
status (a dummy variable that is equal to one for spells in entrepreneurship and equal to zero for spells
in wage employment) with all other regressors. The coefficient of prime interest relates to the
interaction of education and occupational choice, as this indicates the differential returns to education
for entrepreneurs vis-à-vis employees. Note that year dummies are included in all specifications.
All three equations – i.e., the ones for entrepreneurs, employees and all labor force participants –
are estimated by means of a random effects (RE) model. A potential problem when estimating these
11 These transformed dummies are included in all regression models, but their coefficients will not be shown in the tables reporting the estimation results. 12 They may be valid as such as they are possibly good predictors of the educational level of the respondent while otherwise independent of their future earnings.
17
17
specifications is that the resulting estimates might be biased due to the fact that the choice between
entrepreneurship and salaried employment may well be endogenous. Individuals might decide to
become entrepreneurs because their education and some of their unobserved (fixed) characteristics
have higher value as an entrepreneur than as an employee.13 To address the issue of selectivity, the
third equation – i.e., the one combining entrepreneurs and employees – is also estimated by means of
an individual fixed effects (FE) model.14 This fourth specification, (4), controls for unobserved
individual characteristics that do not change over time, without imposing zero correlation between the
individual effect and the other explanatory variables. It eliminates the bias originating from permanent
disposition, inclination and aptness for entrepreneurial activity. It will not eliminate bias from favorable
unobservable circumstances that stimulate an individual to seize an opportunity at a particular point in
time. A fifth specification, (5), is added that uses clustered standard errors.15 The drawback of these FE
specifications is that we do not obtain estimates of the absolute levels of the returns to education for
entrepreneurs and employees, but only of the difference between the two. We are therefore also
interested in the results from the RE specifications, albeit they may be biased due to selection.
All five specifications are estimated (i) with a limited number of control variables so as to
obtain some sort of ‘descriptive statistics’, (ii) with all control variables except general ability, and (iii)
with all control variables including general ability. However, as was pointed out already, the education
variable is likely to be endogenous in the income equation. Therefore, we next instrument this variable
included in all five specifications. Whenever interacted terms with education are included in the
specification, i.e., “Education*Entrepreneur”, this interacted variable is instrumented in the same
fashion. We introduce four family background variables as identifying instruments: (1) Magazines present
13 As we shall show in the results section, selection into entrepreneurship is, indeed, co-determined by education. 14 Please note that the estimate of interest, the coefficient pertaining to the interacted variable ‘Education*Occupational status’, is identified based on the subset of individual observations (approximately 1,000 individuals) that switch occupational status in the observed time horizon. Obviously, education as a stand-alone variable and other time-invariant variables are omitted from this specification. The model is identified because we only estimate the difference in returns to education between entrepreneurial and employee status. 15 As long as there is no serial correlation in the error terms, the use of these clustered or heteroskedasticity and autocorrelation-consistent (HAC) standard errors will generate the same results as the fourth specification (see, for instance, Angrist and Pischke, 2008). However, it could be the case that there are some unobserved individual characteristics that vary over time whilst (a) affecting income levels and (b) being serially correlated. This will not affect the estimated coefficients, but only the standard errors and therefore the significance levels.
18
18
in the household at age 14; (2) Library card present in the household at age 14; (3) Presence of a stepparent in the
parental household; and (4) Number of siblings in the parental household. These instruments are expected to
have a significant relationship with the number of years of education attained, but not with income
directly (given that we control for parental education and general ability).16 Having magazines and/or a
library card in the household signifies access to reading/studying material, which might inspire the
child to learn more, thereby possibly affecting the number of years of education. In contrast, the
presence of a stepparent is expected to reduce the level of education by increasing the probability that
there has been turmoil (divorce or death of a parent) in the child’s learning environment. The number
of siblings is expected to have a negative relationship with education, as explained in, for instance,
Black, Devereux and Salvanes (2005), Parker and Van Praag (2006) and De Haan (2009).17
There are two sorts of critique on the aforementioned instruments (but we do not have better
ones). First, family background variables may, besides influencing education, have a direct impact on
the labor market performance of the respondent. In order to minimize this direct impact, which would
turn the instrument invalid, the education levels of the parents are used as control variables in all
equations – rather than as additional identifying instruments, as is common when using this type of
instruments. Moreover, controlling for indicators of ability decreases the likelihood that the identifying
instruments do, in fact, measure the unobserved (inherited) talents of the respondent. Using the
number of siblings as an instrument in an entrepreneurship context has an additional drawback: the
availability of (inherited) resources – per child – could also have a direct effect on the child’s ability to
invest in a new business, thereby diluting any capital constraints and thus increasing business earnings
16 Blackburn and Neumark (1993) use an IV-approach to estimate the returns to education (for employees) based on the NLSY data. They use a broad set of identifying instruments, including the set of instruments we use, as well as the education levels of the respondents’ parents. 17 As de Haan (2009: 2) discusses “a negative relationship between family size and educational achievements is not necessarily proof of a negative effect of the number of children. The number of children is a choice variable of the parents and it might be that certain characteristics of parents, such as their educational attainments, affect both the number of children as well as the educational attainments of those children.” Various authors, including De Haan, have analyzed whether this negative relationship is evidence of a causal effect. Most studies then find this not to be the case. Anyway, for our purposes, the negative relationship is what counts.
19
19
(Parker & Van Praag, 2006). We address this critique in our robustness analyses, where we find that the
estimation results are invariant to the inclusion of a direct measure of assets in the earnings equation.18
To assess the credibility of the results that will be obtained by using the selected identifying
instruments, we check whether the proposed set of identifying instruments is (i) of sufficient quality
and (ii) valid, and (iii) whether instrumentation is relevant at all. The results from the tests of validity
and relevance do critically depend on the choice of regressors to be used in the second-stage earnings
equation (see below). All outcomes support the use of this set of identifying instruments as being of
sufficiently high quality, validity and relevance.19 Besides, as we shall see in the next section, the basic
result pertaining to the difference in returns to education between entrepreneurs and employees
remains qualitatively the same, irrespective of whether or not education is instrumented.
To estimate the determinants of occupational choice – i.e., entrepreneurship versus
employment – from which we can assess whether or not education affects this choice, we estimate
probit equations where the dependent variable is occupational status, measured in three different ways.
We estimate this relationship with and without control variables in a RE framework. Also in this case,
education may be an endogenous variable (people who wish to become entrepreneurs would attain
higher or lower schooling levels than others).
EVIDENCE
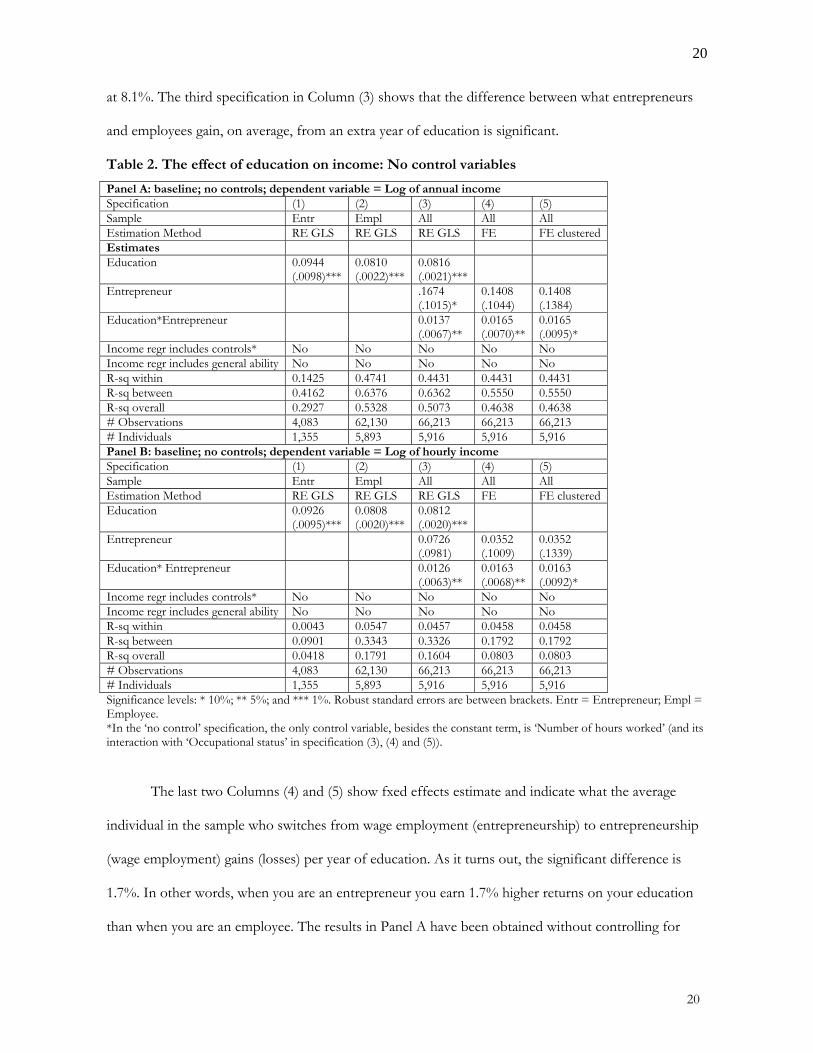
Table 2 reports the benchmark results from estimating our five specifications without control
variables. Column (1) shows that the conditional correlation between an entrepreneur’s income and her
education level is 0.094. In other words, on average, each additional year of education increases an
entrepreneur’s earnings by a significant 9.4%. This is in line with H1. The results from the second
specification in Column (2) reveal that the corresponding percentage for employees is somewhat lower
18 The measure of assets is excluded from the basic set of regressions since it is available for fewer years, and would therefore limit the sample size. 19 The set of identifying instruments is also tested to be valid when capital-constraint related variables, such as residence value, stock value, value of assets, value of inheritances and total savings, were included in the earnings equation. This renders additional support for the validity of the identifying instrument ‘number of siblings’ that could perhaps affect earnings through its effect on capital constraints.
20
20
at 8.1%. The third specification in Column (3) shows that the difference between what entrepreneurs
and employees gain, on average, from an extra year of education is significant.
Table 2. The effect of education on income: No control variables
Panel A: baseline; no controls; dependent variable = Log of annual income Specification (1) (2) (3) (4) (5) Sample Entr Empl All All All Estimation Method RE GLS RE GLS RE GLS FE FE clustered Estimates Education 0.0944
(.0098)***0.0810 (.0022)***
0.0816 (.0021)***
Entrepreneur .1674 (.1015)*
0.1408 (.1044)
0.1408 (.1384)
Education*Entrepreneur 0.0137 (.0067)**
0.0165 (.0070)**
0.0165 (.0095)*
Income regr includes controls* No No No No No Income regr includes general ability No No No No No R-sq within 0.1425 0.4741 0.4431 0.4431 0.4431 R-sq between 0.4162 0.6376 0.6362 0.5550 0.5550 R-sq overall 0.2927 0.5328 0.5073 0.4638 0.4638 # Observations 4,083 62,130 66,213 66,213 66,213 # Individuals 1,355 5,893 5,916 5,916 5,916 Panel B: baseline; no controls; dependent variable = Log of hourly income Specification (1) (2) (3) (4) (5) Sample Entr Empl All All All Estimation Method RE GLS RE GLS RE GLS FE FE clustered Education 0.0926
(.0095)***0.0808 (.0020)***
0.0812 (.0020)***
Entrepreneur 0.0726 (.0981)
0.0352 (.1009)
0.0352 (.1339)
Education* Entrepreneur 0.0126 (.0063)**
0.0163 (.0068)**
0.0163 (.0092)*
Income regr includes controls* No No No No No Income regr includes general ability No No No No No R-sq within 0.0043 0.0547 0.0457 0.0458 0.0458 R-sq between 0.0901 0.3343 0.3326 0.1792 0.1792 R-sq overall 0.0418 0.1791 0.1604 0.0803 0.0803 # Observations 4,083 62,130 66,213 66,213 66,213 # Individuals 1,355 5,893 5,916 5,916 5,916 Significance levels: * 10%; ** 5%; and *** 1%. Robust standard errors are between brackets. Entr = Entrepreneur; Empl = Employee. *In the ‘no control’ specification, the only control variable, besides the constant term, is ‘Number of hours worked’ (and its interaction with ‘Occupational status’ in specification (3), (4) and (5)).
The last two Columns (4) and (5) show fxed effects estimate and indicate what the average
individual in the sample who switches from wage employment (entrepreneurship) to entrepreneurship
(wage employment) gains (losses) per year of education. As it turns out, the significant difference is
1.7%. In other words, when you are an entrepreneur you earn 1.7% higher returns on your education
than when you are an employee. The results in Panel A have been obtained without controlling for
21
21
other individual covariates and with the log of annual income the as dependent variable. Panel B of
Table 2 indicates that the results are very similar when applying the same specifications while using
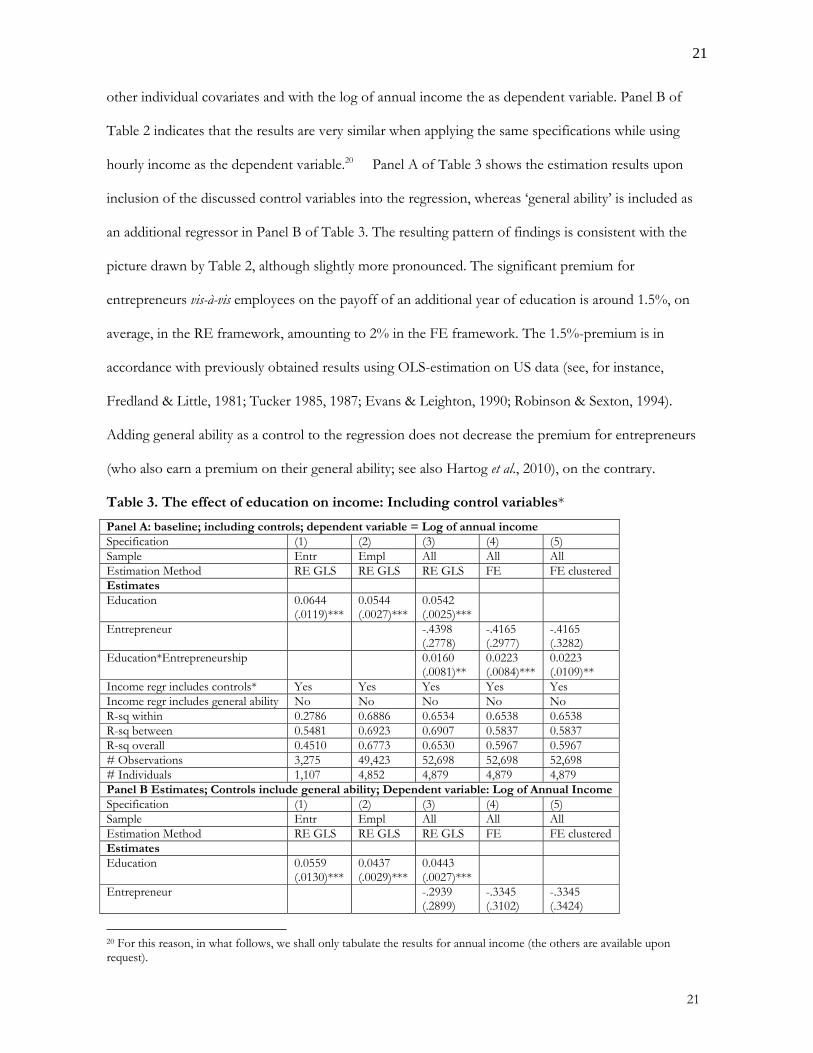
hourly income as the dependent variable.20 Panel A of Table 3 shows the estimation results upon
inclusion of the discussed control variables into the regression, whereas ‘general ability’ is included as
an additional regressor in Panel B of Table 3. The resulting pattern of findings is consistent with the
picture drawn by Table 2, although slightly more pronounced. The significant premium for
entrepreneurs vis-à-vis employees on the payoff of an additional year of education is around 1.5%, on
average, in the RE framework, amounting to 2% in the FE framework. The 1.5%-premium is in
accordance with previously obtained results using OLS-estimation on US data (see, for instance,
Fredland & Little, 1981; Tucker 1985, 1987; Evans & Leighton, 1990; Robinson & Sexton, 1994).
Adding general ability as a control to the regression does not decrease the premium for entrepreneurs
(who also earn a premium on their general ability; see also Hartog et al., 2010), on the contrary.
Table 3. The effect of education on income: Including control variables*
Panel A: baseline; including controls; dependent variable = Log of annual income Specification (1) (2) (3) (4) (5) Sample Entr Empl All All All Estimation Method RE GLS RE GLS RE GLS FE FE clustered Estimates Education 0.0644
(.0119)***0.0544 (.0027)***
0.0542 (.0025)***
Entrepreneur -.4398 (.2778)
-.4165 (.2977)
-.4165 (.3282)
Education*Entrepreneurship 0.0160 (.0081)**
0.0223 (.0084)***
0.0223 (.0109)**
Income regr includes controls* Yes Yes Yes Yes Yes Income regr includes general ability No No No No No R-sq within 0.2786 0.6886 0.6534 0.6538 0.6538 R-sq between 0.5481 0.6923 0.6907 0.5837 0.5837 R-sq overall 0.4510 0.6773 0.6530 0.5967 0.5967 # Observations 3,275 49,423 52,698 52,698 52,698 # Individuals 1,107 4,852 4,879 4,879 4,879 Panel B Estimates; Controls include general ability; Dependent variable: Log of Annual Income Specification (1) (2) (3) (4) (5) Sample Entr Empl All All All Estimation Method RE GLS RE GLS RE GLS FE FE clustered Estimates Education 0.0559
(.0130)***0.0437 (.0029)***
0.0443 (.0027)***
Entrepreneur -.2939 (.2899)
-.3345 (.3102)
-.3345 (.3424)
20 For this reason, in what follows, we shall only tabulate the results for annual income (the others are available upon request).

22
22
Education* Entr 0.0143 (.0087)*
0.0204 (.0090)**
0.0204 (.0116)*
General ability 0.1069 (.0351)***
0.0834 (.0074)***
0.0846 (.0071)***
General ability* Entr 0.0365 (.0220)*
0.0385 (.0224)*
0.0385 (.0303)
Income regr includes controls* Yes Yes Yes Yes Yes Income regr includes general ability Yes Yes Yes Yes Yes R-sq within 0.2798 0.6894 0.6545 0.6549 0.6549 R-sq between 0.5491 0.6985 0.6958 0.5763 0.5763 R-sq overall 0.4515 0.6820 0.6573 0.5959 0.5959 # Observations 3,109 47,336 50,445 50,445 50,445 # Individuals 1,052 4,583 4,607 4,607 4,607 Significance levels: * 10%; ** 5%; *** 1%. Robust standard errors are between brackets. *Controls include all the variables discussed in the previous section, including a set of transformed year, birth year and age dummies according to the method proposed by Deaton (2000). General ability is not included as a regressor in panel A. Specifications (3) to (5) include also interacted terms of all these regressors and the occupational choice dummy ‘entrepreneur’.
The next step is to estimate all these specifications by using instrumental variables to cope with
the possible endogeneity of education in these income equations, as discussed in Section 4. Table 4
shows the results of estimating the five specifications using IV.
Table 4. The effect of education on income: Including control variables and estimated by IV
Panel A Base line; Including controls; Dependent variable: Log of Annual Income Specification (1) (2) (3) (4) (5) Sample Entr Empl All All All Estimation Method RE GLS RE GLS RE GLS FE FE clustered Estimates Education 0.1764
(.0552)***0.1273 (.0118)***
0.1127 (.0107)***
Entrepreneur -1.009 (.4535)**
-1.284 (.4543)***
-1.284 (.3471)***
Education* Entr 0.0705 (.0202)***
0.0827 (.0217)***
0.0827 (.0460)*
Income regr includes controls* Yes Yes Yes Yes Yes Income regr includes general ability No No No No No R-sq within 0.2782 0.6886 0.6985 0.6981 0.6981 R-sq between 0.5080 0.6476 0.7002 0.6389 0.6389 R-sq overall 0.4119 0.6505 0.6801 0.6437 0.6437 # Observations 3,275 49,423 52,698 52,698 52,585 # Individuals 1,107 4,852 4,879 4,879 4,766 Panel B Estimates; Controls include general ability; Dependent variable: Log of Annual Income Specification (1) (2) (3) (4) (5) Sample Entr Empl All All All Estimates Education 0.2123
(.0552)***0.1181 (.0163)***
0.0999 (.0146)***
Entrepreneur -1.260 (.4764)***
-1.640 (.4826)***
-1.640 (.4919)***
Education* Entr 0.1157 (.0254)***
0.1301 (.0279)***
0.1301 (.0631)**
23
23
General ability 0.034 (.0788)
0.0101 (.0183)
0.0245 (.0164)
General ability* Entr -0.0547 (.0243)**
-0.0609 (.0263)**
-0.0609 (.0612)
Income regr includes controls* Yes Yes Yes Yes Yes Income regr includes general ability Yes Yes Yes Yes Yes Estimation Method RE GLS RE GLS RE GLS FE FE clustered R-sq within 0.2801 0.6894 0.6975 0.6966 0.6966 R-sq between 0.4851 0.6552 0.7050 0.6289 0.6289 R-sq overall 0.3919 0.6569 0.6842 0.6402 0.6402 # Observations 3,109 47,336 50,445 50,445 50,356 # Individuals 1,052 4,583 4,607 4,607 4,518 Significance levels: * 10%; ** 5%; *** 1%. Robust standard errors are between brackets. *Controls include all the variables discussed in the previous section, including a set of transformed year, birth year and age dummies according to the method proposed by Deaton (2000). General ability is not included as a regressor in panel A. Specifications (3) to (5) include also interacted terms of all these regressors and the occupational choice dummy ‘entrepreneur’. Instruments are described in the methodology subsection.
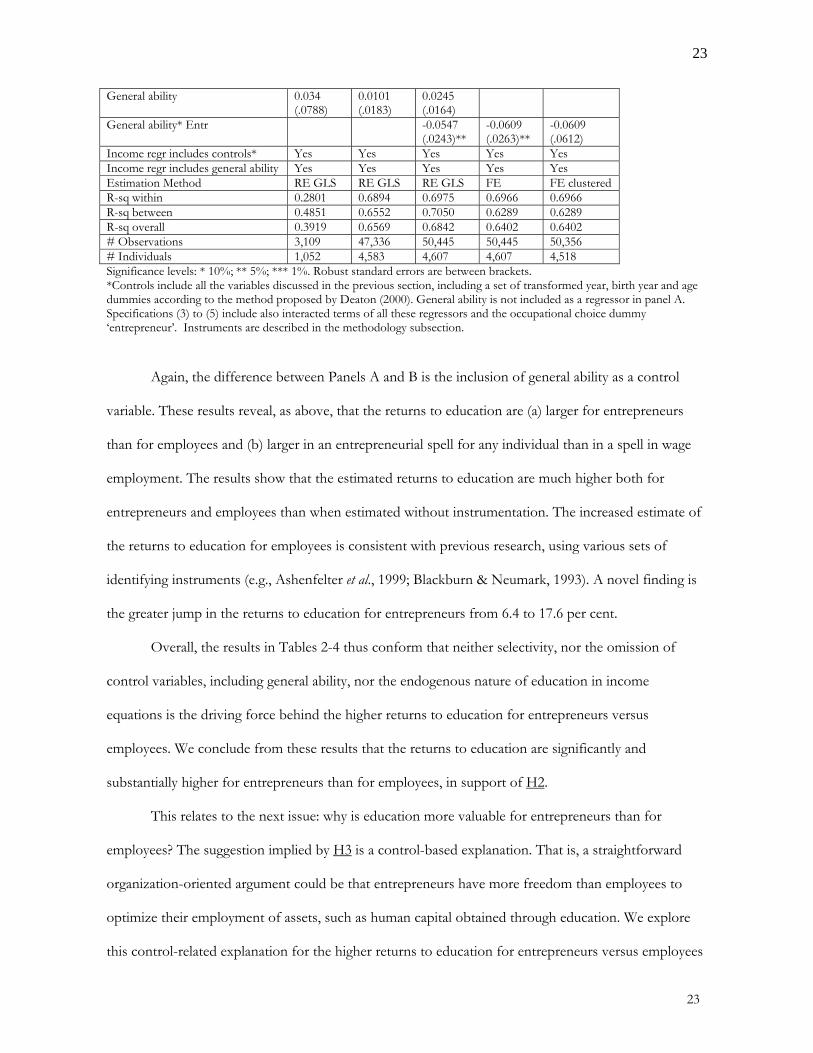
Again, the difference between Panels A and B is the inclusion of general ability as a control
variable. These results reveal, as above, that the returns to education are (a) larger for entrepreneurs
than for employees and (b) larger in an entrepreneurial spell for any individual than in a spell in wage
employment. The results show that the estimated returns to education are much higher both for
entrepreneurs and employees than when estimated without instrumentation. The increased estimate of
the returns to education for employees is consistent with previous research, using various sets of
identifying instruments (e.g., Ashenfelter et al., 1999; Blackburn & Neumark, 1993). A novel finding is
the greater jump in the returns to education for entrepreneurs from 6.4 to 17.6 per cent.
Overall, the results in Tables 2-4 thus conform that neither selectivity, nor the omission of
control variables, including general ability, nor the endogenous nature of education in income
equations is the driving force behind the higher returns to education for entrepreneurs versus
employees. We conclude from these results that the returns to education are significantly and
substantially higher for entrepreneurs than for employees, in support of H2.
This relates to the next issue: why is education more valuable for entrepreneurs than for
employees? The suggestion implied by H3 is a control-based explanation. That is, a straightforward
organization-oriented argument could be that entrepreneurs have more freedom than employees to
optimize their employment of assets, such as human capital obtained through education. We explore
this control-related explanation for the higher returns to education for entrepreneurs versus employees
24
24
indirectly by testing whether individuals with an internal locus of control generate higher returns from
their education than their external counterparts.
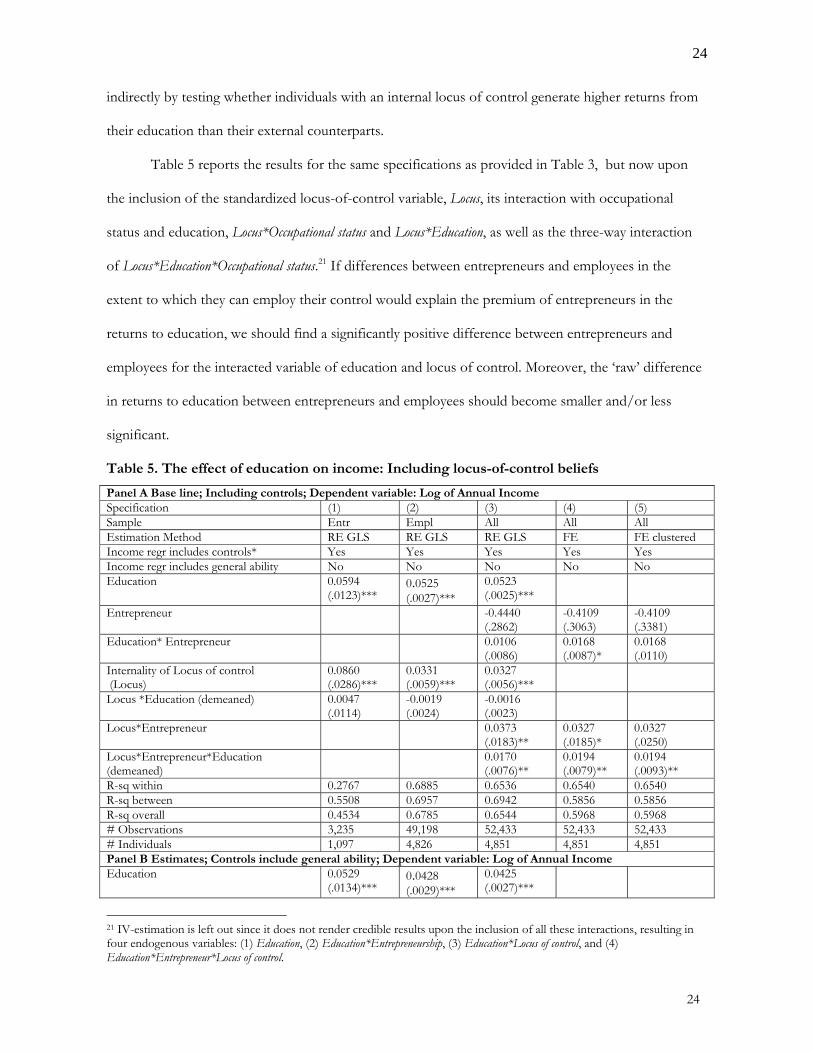
Table 5 reports the results for the same specifications as provided in Table 3, but now upon
the inclusion of the standardized locus-of-control variable, Locus, its interaction with occupational
status and education, Locus*Occupational status and Locus*Education, as well as the three-way interaction
of Locus*Education*Occupational status.21 If differences between entrepreneurs and employees in the
extent to which they can employ their control would explain the premium of entrepreneurs in the
returns to education, we should find a significantly positive difference between entrepreneurs and
employees for the interacted variable of education and locus of control. Moreover, the ‘raw’ difference
in returns to education between entrepreneurs and employees should become smaller and/or less
significant.
Table 5. The effect of education on income: Including locus-of-control beliefs
Panel A Base line; Including controls; Dependent variable: Log of Annual Income Specification (1) (2) (3) (4) (5) Sample Entr Empl All All All Estimation Method RE GLS RE GLS RE GLS FE FE clustered Income regr includes controls* Yes Yes Yes Yes Yes Income regr includes general ability No No No No No Education 0.0594
(.0123)*** 0.0525 (.0027)***
0.0523 (.0025)***
Entrepreneur -0.4440 (.2862)
-0.4109 (.3063)
-0.4109 (.3381)
Education* Entrepreneur 0.0106 (.0086)
0.0168 (.0087)*
0.0168 (.0110)
Internality of Locus of control (Locus)
0.0860 (.0286)***
0.0331 (.0059)***
0.0327 (.0056)***
Locus *Education (demeaned) 0.0047 (.0114)
-0.0019 (.0024)
-0.0016 (.0023)
Locus*Entrepreneur 0.0373 (.0183)**
0.0327 (.0185)*
0.0327 (.0250)
Locus*Entrepreneur*Education (demeaned)
0.0170 (.0076)**
0.0194 (.0079)**
0.0194 (.0093)**
R-sq within 0.2767 0.6885 0.6536 0.6540 0.6540 R-sq between 0.5508 0.6957 0.6942 0.5856 0.5856 R-sq overall 0.4534 0.6785 0.6544 0.5968 0.5968 # Observations 3,235 49,198 52,433 52,433 52,433 # Individuals 1,097 4,826 4,851 4,851 4,851 Panel B Estimates; Controls include general ability; Dependent variable: Log of Annual Income Education 0.0529
(.0134)*** 0.0428 (.0029)***
0.0425 (.0027)***
21 IV-estimation is left out since it does not render credible results upon the inclusion of all these interactions, resulting in four endogenous variables: (1) Education, (2) Education*Entrepreneurship, (3) Education*Locus of control, and (4) Education*Entrepreneur*Locus of control.
25
25
Entrepreneur -0.2972 (.3007)
-0.3219 (.3213)
-0.3219 (.3538)
Education*Entrepreneur 0.0090 (.0092)
0.0147 (.0093)
0.0147 (.0118)
Internality of Locus of control (Locus) 0.0720 (.0294)**
0.0230 (.0060)***
0.0227 (.0057)***
Locus *Education (demeaned) 0.0052 (.0117)
-0.0016 (.0024)
-0.0013 (.0023)
Locus*Entrepreneur 0.0330 (.0188)*
0.0279 (.0190)
0.0279 (.0256)
Locus*Entrepreneur*Education (demeaned)
0.0182 (.0078)**
0.0203 (.0080)**
0.0203 (.0095)**
General ability 0.0974 (.0355)***
0.0800 (.0074)***
0.0808 (.0071)***
General ability* Entrepreneur 0.0363 (.0228)
0.0414 (.0227)*
0.0414 (.0304)
R-sq within 0.2776 0.6893 0.6548 0.6551 0.6551 R-sq between 0.5507 0.6998 0.6972 0.5768 0.5768 R-sq overall 0.4530 0.6826 0.6581 0.5960 0.5960 # Observations 3,069 47,143 50,212 50,212 50,212 # Individuals 1,042 4,562 4,584 4,584 4,584 Significance levels: * 10%; ** 5%; *** 1%. Robust standard errors are between brackets. *Controls include all the variables discussed in the previous section. General ability is not included as a regressor in panel A. Specifications (3) to (5) include also interacted terms of all these regressors and the occupational choice dummy ‘entrepreneur’. Instruments are described in the methodology subsection.
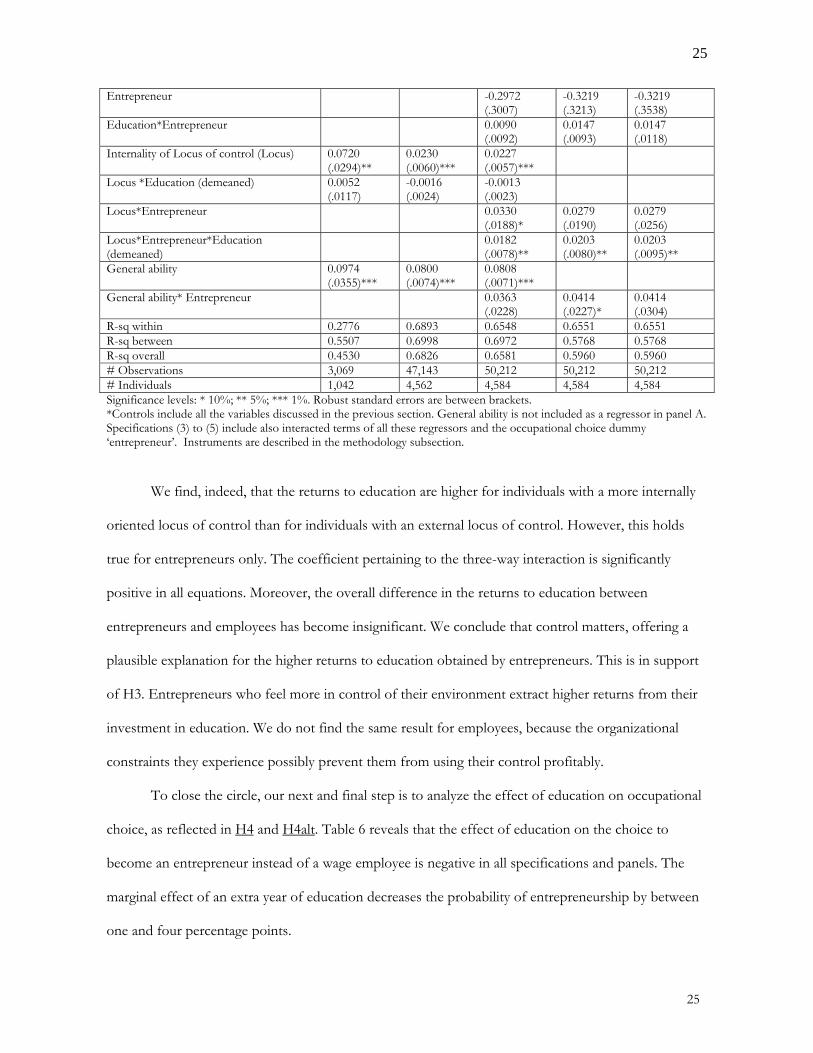
We find, indeed, that the returns to education are higher for individuals with a more internally
oriented locus of control than for individuals with an external locus of control. However, this holds
true for entrepreneurs only. The coefficient pertaining to the three-way interaction is significantly
positive in all equations. Moreover, the overall difference in the returns to education between
entrepreneurs and employees has become insignificant. We conclude that control matters, offering a
plausible explanation for the higher returns to education obtained by entrepreneurs. This is in support
of H3. Entrepreneurs who feel more in control of their environment extract higher returns from their
investment in education. We do not find the same result for employees, because the organizational
constraints they experience possibly prevent them from using their control profitably.
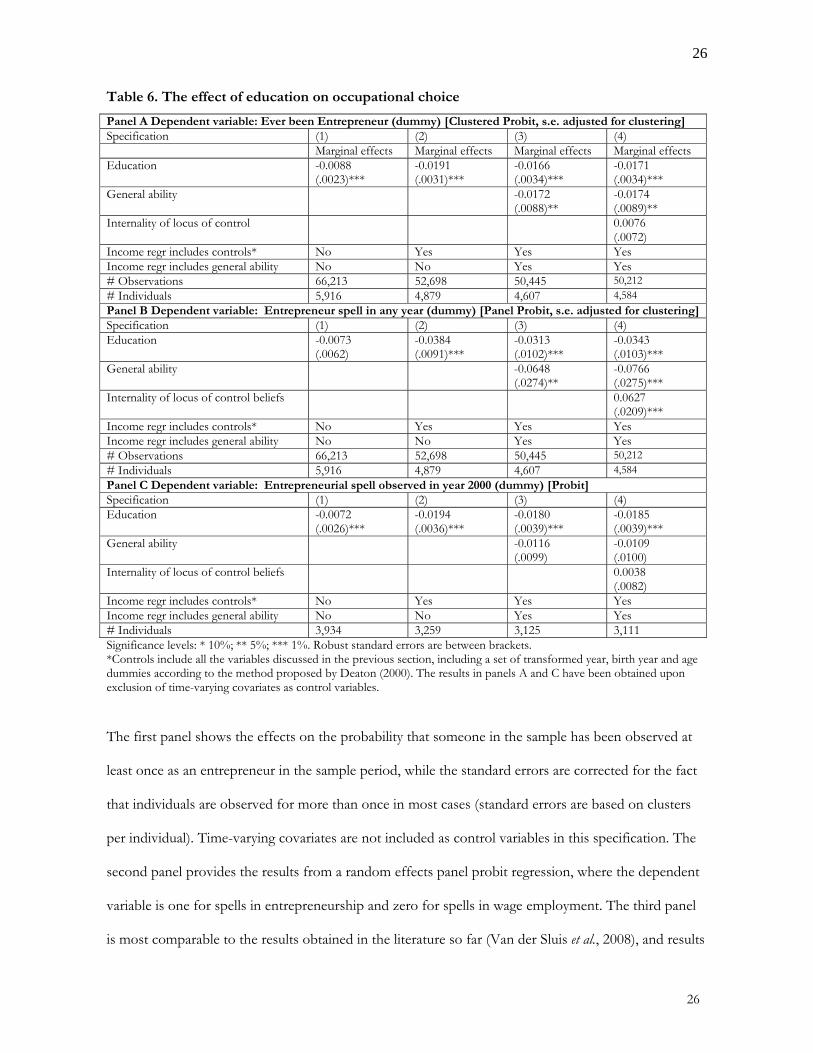
To close the circle, our next and final step is to analyze the effect of education on occupational
choice, as reflected in H4 and H4alt. Table 6 reveals that the effect of education on the choice to
become an entrepreneur instead of a wage employee is negative in all specifications and panels. The
marginal effect of an extra year of education decreases the probability of entrepreneurship by between
one and four percentage points.
26
26
Table 6. The effect of education on occupational choice
Panel A Dependent variable: Ever been Entrepreneur (dummy) [Clustered Probit, s.e. adjusted for clustering] Specification (1) (2) (3) (4) Marginal effects Marginal effects Marginal effects Marginal effects Education -0.0088
(.0023)*** -0.0191 (.0031)***
-0.0166 (.0034)***
-0.0171 (.0034)***
General ability -0.0172 (.0088)**
-0.0174 (.0089)**
Internality of locus of control 0.0076 (.0072)
Income regr includes controls* No Yes Yes Yes Income regr includes general ability No No Yes Yes # Observations 66,213 52,698 50,445 50,212 # Individuals 5,916 4,879 4,607 4,584 Panel B Dependent variable: Entrepreneur spell in any year (dummy) [Panel Probit, s.e. adjusted for clustering]Specification (1) (2) (3) (4) Education -0.0073
(.0062) -0.0384 (.0091)***
-0.0313 (.0102)***
-0.0343 (.0103)***
General ability -0.0648 (.0274)**
-0.0766 (.0275)***
Internality of locus of control beliefs 0.0627 (.0209)***
Income regr includes controls* No Yes Yes Yes Income regr includes general ability No No Yes Yes # Observations 66,213 52,698 50,445 50,212 # Individuals 5,916 4,879 4,607 4,584 Panel C Dependent variable: Entrepreneurial spell observed in year 2000 (dummy) [Probit] Specification (1) (2) (3) (4) Education -0.0072
(.0026)*** -0.0194 (.0036)***
-0.0180 (.0039)***
-0.0185 (.0039)***
General ability -0.0116 (.0099)
-0.0109 (.0100)
Internality of locus of control beliefs 0.0038 (.0082)
Income regr includes controls* No Yes Yes Yes Income regr includes general ability No No Yes Yes # Individuals 3,934 3,259 3,125 3,111 Significance levels: * 10%; ** 5%; *** 1%. Robust standard errors are between brackets. *Controls include all the variables discussed in the previous section, including a set of transformed year, birth year and age dummies according to the method proposed by Deaton (2000). The results in panels A and C have been obtained upon exclusion of time-varying covariates as control variables.
The first panel shows the effects on the probability that someone in the sample has been observed at
least once as an entrepreneur in the sample period, while the standard errors are corrected for the fact
that individuals are observed for more than once in most cases (standard errors are based on clusters
per individual). Time-varying covariates are not included as control variables in this specification. The
second panel provides the results from a random effects panel probit regression, where the dependent
variable is one for spells in entrepreneurship and zero for spells in wage employment. The third panel
is most comparable to the results obtained in the literature so far (Van der Sluis et al., 2008), and results
27
27
from estimating a probit regression where the occupational status in the year 2000 (a random choice,
the last observed year) is the dependent variable. Again, time-varying covariates are not included as
control variables in this specification.
The lowest estimates of even less than one percentage point are shown in Column (1), where
the regressions include no control variables. The results in Column (2), where control variables are
included, and Column (3), where general ability has also been added, do not differ much. All effects in
these two columns are between 2 and 4 per cent, being significantly negative. Apparently, higher levels
of education are, if anything, driving people out of entrepreneurship, although the returns to education
are higher in entrepreneurial spells than in spells of wage employment. So, people either perceive
education as less valuable for entrepreneurship or people with higher levels of education are less
motivated to become entrepreneurs, in line with H4alt. Perhaps, the educational system teaches them
to become employees or, perhaps, individuals are motivated by other factors than income. The choice
behavior is inconsistent with (information about) higher returns to education in entrepreneurship than
in wage employment in the context of assuming income-maximizing individuals. As was noted, indeed,
the literature has provided, so far, quite wide support for the fact that the choice for entrepreneurship
is not primarily driven by income maximization, which is referred to as the ‘returns to entrepreneurship
puzzle’ (Benz & Frey, 2008; Blanchflower & Oswald, 2008; Hamilton, 2000; Hyytinen et al., 2008;
Parker, 2009). Since we study the effect of education on the proceeds from and choice for
entrepreneurship, we can suggest a solution for this particular demonstration of the puzzle: people
simply lack information about the (financial) benefits of entrepreneurship and the value of their
investments in human capital in an entrepreneurial position. Bill Gates and other rich and famous
entrepreneurs, although they dropped out of their schools (and really are exceptions), amplify this lack
of information by emphasizing publicly that education is not required for entrepreneurship success.
Future research is needed to further explore this suggestion and other possible explanations.
Of course, we cannot exclude that the above findings are due to misspecification or alternative
explanations. Hence, we explore four plausible alternative explanations for the key result that the
28
28
estimated returns to education are significantly and substantially higher for entrepreneurs than for
employees. Where appropriate, we checked the validity of a possible alternative explanation by running
additional analyses based on the FE specifications – i.e., specifications (4) and (5) in Table 3 (results
available upon request).
The first possible explanation relates to the question as to whether the difference in returns to
education between entrepreneurs and employees can be attributed to a risk premium required by higher
educated entrepreneurs. More highly educated individuals would perhaps require a higher risk premium
for being an entrepreneur if higher educated individuals experience more additional income risk as an
entrepreneur compared to employees vis-à-vis lower educated individuals. This could perhaps be the
case if higher educated individuals have better outside opportunities, and are thus more likely to
venture into projects with a higher expected return. If such projects are at the same time more risky,
they may require an additional risk premium. The check proceeds in three steps. First, we regress the
individual (time) variances of the residuals of the income equations presented above on entrepreneurs’
education levels and control variables.22 We find no significant education effect. Hence, the variance
over time of an individual’s entrepreneurial income, our indicator of risk, is not higher for more highly
educated individuals, all else equal. Second, we estimate the same equation for employees, revealing a
significant positive coefficient for education. Third, the variance in earnings is lower for employees
than for entrepreneurs, at all possible education levels. These three observations together imply that
entrepreneurs are exposed to more income risk than employees, but that the difference is a decreasing
rather than an increasing function of education. Thus, we conclude that the higher returns to education
for entrepreneurs are not a kind of risk premium.
The second possible explanation pertains to recent evidence that entrepreneurs underreport
their incomes more than employees do (Levitt & Dubner, 2006; Feldman & Slemrod, 2007).
Underreporting is not a problem for the estimation of the returns to education, as long as
22 For this purpose, since the analysis requires time series of an individual’s income, we define an entrepreneur as someone who has ever been observed as an entrepreneur and an employee as someone who has ever been observed as an employee but never as an entrepreneur.
29
29
underreporting and education are unrelated. However, there is evidence by Lyssiotou, Pashardes and
Stengos (2004) showing that this might not be the case. Blue-collar entrepreneurs underreport their
incomes to a higher degree than white-collar entrepreneurs. Since blue-collar entrepreneurs have a
lower average level of education than white-collar entrepreneurs, the returns to education estimate for
the total population of entrepreneurs could be upward biased. This, in turn, might explain the
difference in returns to education between employees and entrepreneurs that we established. If
underreporting has an effect on our estimation results, we would expect that the difference in returns
to education between entrepreneurs and employees would be smaller for the group of white-collar
workers. However, this is not the case.23
As a third explanation, we address the issue raised by Fairlie (2005b) that some entrepreneurs in
the NLSY might have erroneously included the returns to (business) capital in their reported income.
This could explain the result if more highly educated entrepreneurs have higher returns to capital than
lower educated entrepreneurs. As proposed by Fairlie (2005b), income possibly needs to be adjusted
for entrepreneurs who receive a business income from unincorporated businesses (others receive a
'wage' from their incorporated business that excludes returns to capital). Following Fairlie (2005b), the
adjustment implies that five per cent of their total business value is subtracted from their business
incomes. As was indicated above, the variable 'total business value' has not been measured in every
year, resulting in a smaller sample size. Therefore, we compare the estimation results obtained while
adjusting entrepreneurial incomes with the results obtained for the same subsample without the
correction in the income measure. The difference in the returns to education between entrepreneurs
and employees becomes, if anything, larger instead of smaller upon adjustment for capital returns.
The fourth and final possible explanation we want to explore here is based on the idea that
professional workers such as lawyers and medical doctors have high earnings, are highly educated and
are often entrepreneurs. This might drive the result. However, excluding professional workers,
including accountants, actuaries, pharmacists, health-diagnosing occupations, therapists, lawyers, 23 Using only the subset of white collar workers does not render valid results for the instrumentation of the education variable. The conclusion is based on the results obtained without using instruments for education.
30
30
dieticians, and architects, from the sample does not decrease the estimated difference between
entrepreneurs and employees.
CONCLUSION
Contributions. All results point in the same direction: as an entrepreneur, the returns to
education are between 2 and 13 per cent higher than as an employee. The significant result turned out
not to vanish, on the contrary, upon estimating fixed effects, accounting for selectivity, upon including
general ability as a control, diminishing ability bias, or upon instrumenting education, accounting for
endogeneity. We compare our results pertaining to employees to previous studies and conclude that
our estimates are in line with the ones reported there. For entrepreneurs, there are few comparable
previous studies. The exceptions are Parker and Van Praag (2006) and Van der Sluis et al. (2004, 2007),
whose findings are consistent with the current results. The explanation for the significantly higher
returns to education for entrepreneurs relative to employees supported by the test outcomes that utilize
the locus-of-control concept is that entrepreneurship gives better opportunities to optimize the use of
and returns from one’s education, i.e., higher levels of personal control.
This result is consistent with recent insights and evidence in support of higher levels of
personal control and autonomy in entrepreneurship than in wage employment (e.g., Benz & Frey,
2008; Douhan & Van Praag, 2009; Hyytinen et al., 2008) and organization theory (e.g., Dobrev &
Barnett, 2005; Sørensen, 2007; Özcan & Reichstein, 2009). The higher returns to education for
entrepreneurs are due to fewer (organizational) constraints faced by entrepreneurs when optimizing the
profitable employment of their education. Entrepreneurs can freely decide to engage in those activities
where their human capital is likely to generate high returns. In contrast, as an employee, an individual is
bounded by organizational processes and structures. Wage employees are constrained inside the “iron
cages” of organizations owned by others. The choice for entrepreneurship is not positively, but even
negatively associated with education. The expectedly higher returns in entrepreneurship for the higher
educated are apparently not incorporated in their occupational decision. People either perceive
education as less valuable for entrepreneurship or people with higher levels of education are less
31
31
motivated to become entrepreneurs. The choice behavior is inconsistent with (information about)
higher returns to education for entrepreneurs if we assume that labor market decisions are based,
primarily, on income maximization. Previous studies have shown that this assumption is, at least,
questionable, which is referred to as the ‘returns to entrepreneurship puzzle’ (e.g., Benz & Frey, 2008).
Limitations. This is one of the first studies aiming at estimating the returns to education for
entrepreneurs relative to employees, while accounting for endogeneity of education and self-selection.
Our estimates only pertain to a specific US cohort. Although the significant results are very consistent,
they do vary widely (the point estimates of the premium on the returns to education in
entrepreneurship over wage employment varies between two and thirteen percentage points).
Moreover, the instruments that we have used are certainly not without critique, although all tests we
performed are passed. Moreover, we only account for self-selection insofar determined by fixed
individual unobserved characteristics, not for temporary unobserved circumstances that increase the
probability of entrepreneurship. As always, more research is required to study remaining questions:
Will other studies support the conclusion that the returns to education are larger for entrepreneurs
than for employees? Will this turn out to be a US phenomenon or will the same results be obtained for
other parts of the world, such as Europe? Would other studies using panel data also find that the effect
of education on the probability to be (ever) observed as an entrepreneur is negative (where the only
alternative is wage employment)? And, is the control explanation also valid when tested using a
different and more direct operationalization than ‘locus-of-control beliefs’? Can we find alternative
explanations, not addressed in this study, that are responsible for the higher returns to education for
entrepreneurs than for employees? Does the type of education matter besides the number of years of
formal education? These questions point to interesting avenues for future research, inspired by the
current study’s limitations.
Implications. The limitations pertaining to this study (and remaining questions), however, do
not prevent us from drawing conclusions and stressing implications based on our unambiguous
answers to the three questions posed. However, before doing so, we elaborate on the remaining
32
32
assumptions that are required to translate the estimation results into policy implications. First of all,
taking into account that entrepreneurship is economically valuable (Van Praag & Versloot, 2007), we
assume that the difference between the social and private returns to education of entrepreneurial
activity is at least as large as this difference is for employees. A successful entrepreneur is, for example,
more likely to influence competition in a market positively, create employment, innovation and growth
than an employee. Since all these performance measures, such as growth, employment creation and
innovation, are strongly correlated with incomes (Van Der Sluis et al., 2008), we can safely assume that
higher levels of education in entreprfeneurship do not only – more rapidly than for employees – lead to
higher incomes, but also to more economic value creation. Second, we assume that individuals invest in
formal schooling at a stage in their lives at which they do not know yet, in general, whether they will
become entrepreneurs or employees, or a (sequential) combination of both. As a consequence,
investment in schooling is not motivated by the specific expected returns when belonging to the group
of entrepreneurs, but by some (weighted) average expected returns of both employment modes. Our
third assumption, based on our own results, is that individuals, policymakers, bankers and other parties
involved do not have more insight in the returns to education than we as researchers have. This implies
that individuals and policymakers share the common opinion that the returns to education for
employees are at least as high as, or lower than, these of entrepreneurs.
The implications of this study are fourfold. First, as more highly educated entrepreneurs seem
to perform better on average and this is not incorporated in people’s occupational choices, it seems
value enhancing to stimulate people with higher levels of education to become entrepreneurs, since, in
particular, successful entrepreneurs (who often have higher levels of education) create economic value.
Second, and in the same vein, it seems value enhancing to stimulate people who wish to become
entrepreneurs to go to school first and not follow the ideas propagated by the relatively few billionaire
dropouts, such as Richard Branson and Bill Gates. Third, it would be interesting to further investigate
how firms can be organized such that human capital renders higher returns as is the case for
entrepreneurs. Apparently, an avenue of organizing towards more value creation seems the assignment
33
33
of more control to workers, a conclusion that aligns well with the literature on high-commitment HRM
practices (e.g., Huselid, 1995). Fourth, it seems valuable to further investigate how one can best
develop skills and knowledge within educational programs that enhance entrepreneurial performance.
Many programs are run and supported financially by governments to teach entrepreneurship in
schools. However, little is known about how to proceed. Now that we know that formal education
contributes to the development of entrepreneurial performance in general, the next question is: How
can one build entrepreneurial competencies and relevant knowledge efficiently in entrepreneurship
courses? A literature on the evaluation of entrepreneurship education has only recently emerged (see,
for instance, Oosterbeek, Van Praag & IJsselstein, 2010).
34
34
REFERENCES
Angrist, J. & A. Krueger (1991), Does compulsory school attendance affect schooling and earnings?,
Quarterly Journal of Economics 106(4), 979-1014.
Angrist, J. & J. Pischke, 2008, Mostly Harmless Econometrics, Princeton University Press, Princeton NJ.
Ashenfelter, O., C. Harmon & H. Oosterbeek (1999), A review of estimates of the schooling/earnings
relationship, with tests for publication bias, Labour Economics 6(4), 453-470.
Ashenfelter, O. & A. Krueger (1994), Estimates of the returns to schooling from a new sample of
twins, American Economic Review 84(5), 1157-1173.
Backes-Gellner, U., & A. Werner (2007), Entrepreneurial signalling via education: A success factor in
innovative start-ups, Small Business Economics 29, 173-190.
Becker, G. (1964) Human Capital: A theoretical and empirical analysis with special reference to
education, Chicago, University of Chicago Press (3rd edition, 1993).
Benz, M. & B. Frey (2008), Being independent is a great thing: Subjective evaluations of self-
employment and hierarchy, Economica 75(298), 362-383.
Black, S., P. Devereux & K. Salvanes (2005), The more the merrier? The effect of family composition
on children's education, Quarterly Journal of Economics 120(2), 669-700.
Blackburn, M. & D. Neumark (1993), Omitted-ability bias and the increase in the return to schooling,
Journal of Labor Economics 11(3), 521-544.
Blanchflower, D. & A. Oswald (1998), What makes an entrepreneur?, Journal of Labor Economics
16, 26-60.
Bonjour, D., L. Cherkas, J. Haskel, D. Hawkes & T. Spector (2003), Returns to education: Evidence
from U.K. twins, American Economic Review 93(5), 1799-1812.
Boone, C. & B. De Brabander (1993), Generalized versus specific locus of control expectancies of
chief executive officers, Strategic Manangement Journal 14, 619-626.
Boone, C., B. De Brabander & A. van Witteloostuijn (1996), CEO locus of control and small firm
performance: An integrative framework and empirical test, Journal of Management Studies
33(5), 667-699.
Boone, C., W. Van Olffen & A. Van Witteloostuijn (2005), Team locus-of-control composition,
leadership structure, information acquisition, and financial performance: A business simulation
study, Acadamy of Management Journal 48, 889-909.
Brockhaus, R (1980), The effect of job dissatisfaction on the decision to start a business, Journal of
Small Business Management 18(1), 37-43.
35
35
Card, D. (1999). The causal effect of education on earnings, In Handbook of Labor Economics,
Volume 3A, ed. O. Ashenfelter, 1801–63. Amsterdam, New York and Oxford: Elsevier Science,
North-Holland.
Davidsson, P. & B. Honig (2003), The role of social and human capital among nascent entrepreneurs,
Journal of Business Venturing 18(3), 301-331.
De Haan, M. (2009), Birth order family size and educational attainment, forthcoming in Economics of
Education Review.
Deaton, A. (2000), The Analysis of Houshold Surveys, Johns Hopkins University Press, Washington
D.C.
Dobrev, S.D. & W.P. Barnett (2005), Organizational roles and transition to entrepreneurship,
Academy of Management Journal 48: 433-449.
Douhan, R. & M. van Praag (2009), Entrepreneurship, wage employment and control in an
occupational choice framework, Tinbergen Institute Discussion Paper, Amsterdam.
Dushnitsky, G. (2009), A cross-country study of entrepreneurial optimism and valuations,
University of Pennsylvania Working Paper, Philadephia.
Evans, D. & L. Leighton (1990), Small business formation by unemployed an employed workers,
Small Business Economics 2(4), 319-330.
Fairlie, R. (2005a), Entrepreneurship and earnings among young adults from disadvantaged families,
Small Business Economics 25(3), 223-236.
Fairlie, R. (2005b), Self-employment, entrepreneurship, and the NLSY79, Monthly Labor Review
128(2), 40-47.
Feldman, N. & J. Slemrod (2007), Estimating tax non-compliance with evidence from unaudited tax
returns, Economic Journal 117(518), 327-352.
Fredland, J. & R. Little (1981), Self-employed workers: Returns to education and training, Economics
of Education Review 1(3), 315-337.
Griliches, Z. (1977), Estimating the returns to schooling: Some econometric problems, Econometrica
45(1), 1-22.
Hamilton, B. (2000), Does entrepreneurship pay? An empirical analysis of the returns to self-
employment, Journal of Political Economy 108(3), 604-631.
Hansen, K., J. Heckman & K. Muller (2004), The effect of schooling and ability on achievement test
scores, Journal of Econometrics 121, 39-98.
Harmon, C. & I. Walker (1995), Estimates of the economic returns to schooling for the United
Kingdom, American Economic Review 85(5), 1278-1286.
36
36
Harmon, C., H. Oosterbeek & I. Walker (2003), The returns to education: Microeconomics, Journal of
Economic Surveys 17, 115-156.
Hartog, J. & H. Oosterbeek (2007), What should you know about private returns to education? In
Hartog, J & Maassen van den Brink, H., eds, Human Capitial: Moving the Frontier. Cambridge
University Press, Cambridge.
Hartog, J., M. Van Praag & J. Van Der Sluis (2010), If you are so smart, why aren’t you an
entrepreneur? Returns to cognitive and social ability: Entrepreneurs versus employees, forthcoming
in the Journal of Economics and Management Strategy 19(4)
Hayward, M., D. Shepherd & D. Griffin (2006), A hubris theory of entrepreneurship, Management
Science 52(2), 160-172.
Heckman, J., Stixrud J. & Urzua S. (2006), The effects of cognitive and noncognitive abilities on labor
market outcomes and social behavior, Journal of Labor Economics, 24(3), 411-481.
Hundley, G. (2001), Why and when are the self-employed more satisfied with their work?, Industrial
Relations 40(2), 293-317.
Huselid, M.A. (1995), The impact of human resource management practices on turnover, productivity,
and corporate financial performance, Academy of Management Journal 38(3), 635-672.
Hvide, H. (2009), The quality of entrepreneurs, Economic Journal 119, 1010–1035.
Hyytinen, A., P. Ilmakunnas & O. Toivanen (2008), The return to entrepreneurship puzzle,
Working Paper, Helsinki School of Economics.
Kawagushi, D. (2006), Compensating wage differentials among self-employed workers:
Evidence from job satisfaction scores, Working Paper Hitotsubashi University, Tokyo.
Kirzner, I. (1973), Competition and Entrepreneurship, Chicago: University of Chicago Press.
Kirzner, I. (1997), Entrepreneurial discovery and the competitive market process: An Austrian
approach, Journal of Economic Literature 35(1), 60–85.
Levitt, S. & S. Dubner (2005), Freakonomics: The rogue economist explores the hidden side of
everything, HarperCollins Publishers, New York.
Lowe, R. & A. Ziedonis (2006), Overoptimism and the performance of entrepreneurial firms,
Management Science 52(2), 173-186.
Lyssiotou, P., P. Pashardes & T. Stengos (2004), Estimates of the black economy based on consumer
demand approaches, Economic Journal 114(497), 622-640.
Mincer, J. (1958), Investment in human capital and personal income distribution, Journal of Political
Economy 66(4), 281-302.
Mincer, J. 1974. Schooling, Experience, and Earnings, National Bureau for Economic Research,
Cambridge, Mass.
37
37
Nicolaou, N., S. Shane, L. Cherkas, J. Hunkin & T.D. Spector (2008), Is the tendency to engage in
entrepreneurship genetic?, Management Science 54, 167-179.
Oosterbeek, H., M. Van Praag & A. IJsselstein (2010), The impact of entrepreneurship education on
entrepreneurship skills and motivation, European Economic Review 54(3), 442-454.
Oreopoulos, P. (2006), Estimating average and local average treatment effects of education when
compulsory schooling laws really matter, American Economic Review, 96(1), 152-175.
Özcan, S. & T. Reichstein (2009), Transition to entrepreneurship from the public sector:
Predispositional and contextual effects, Management Science 55, 604-618.
Parker, S. (2009), The Economics of Entrepreneurship, Cambridge University Press, Cambridge,
UK.
Parker, S. & M. Van Praag (2006), Schooling, capital constraints and entrepreneurial performance: The
endogenous triangle, Journal of Business and Economic Statistics 24(4), 416-431.
Parker, S. & Van Praag, M. (2011) The entrepreneur’s mode of entry: Business takeover or new venture
start?, forthcoming in the Journal of Business Venturing.
Riley, J. (2002), Weak and strong signals, Scandinavian Journal of Economics 104 (2), 213-36.
Robinson, P. & E. Sexton (1994), The effect of education and experience on self-employment success,
Journal of Business Venturing 9(2), 141-156.
Rotter, J. (1966), Generalized expectancies for internal versus external control of reinforcement,
Psychological Monographs 80(1), 1-28.
Shane, S. (2006), Introduction to the focused issue on entrepreneurship, Management Science 52,
155-159.
Shane, S. & S. Venkataraman (2000), The promise of entrepreneurship as a field of rsearch, Academy
of Management Review 25: 217-226.
Smith, A. (1904:) An Inquiry into the Nature and Causes of the Wealth of Nations, Edwin
Cannan, ed., Methuen & Co, London (first published in 1776).
Sørensen, J. (2007), Bureaucracy and entrepreneurship: Workplace effects on entrepreneurial entry,
Administrative Science Quarterly, 52, 387-412.
Spence, A. (1973), Job market signaling, Quarterly Journal of Economics 87(3), 355-374.
Taylor, M, (1996), Earnings, independence or unemployment: Why become self-employed?, Oxford
Bulletin of Economics and Statistics 58, 253–266.
Tucker, I. (1985), Use of the decomposition technique to test the educational screening hypothesis,
Economics of Education Review 4(4), 321-326.
Tucker, I. (1987), The impact of consumer credentialism on employee and entrepreneur returns to
higher education, Economics of Education Review 6(1), 35-40.
38
38
Van Der Sluis, J. & M. Van Praag (2004), Economic returns to education for entrepreneurs: The
development of a neglected child in the economics of education, Swedish Economic Policy
Review 11(2), 183-225.
Van Der Sluis, J. & M. Van Praag (2007), Identifying the difference in returns to education for
entrepreneurs and employees: Identification by means of changes in compulsory schooling
laws, Working Paper University of Amsterdam, Amsterdam.
Van Der Sluis, J., M. Van Praag & W. Vijverberg (2008), Education and entrepreneurship selection and
performance: A review of the empirical literature, Journal of Economic Surveys, 22(5), 795-841.
Van Praag, M. & P. Versloot (2007), What is the value of entrepreneurship? A review of recent
research, Small Business Economics 29(4), 351-382.
Weick, K. (1996), Drop your tools: An allegory for organizational studies, Administrative Science
Quarterly 41(2), 301-313.
Wijbenga F. & A. van Witteloostuijn (2007), Entrepreneurial locus of control and competitive
strategies: The moderating effect of environmental dynamism, Journal of Economic Psychology
28(5), 566-589.