deutsches rechnungslegungs standards committee e.v ... · 1 1 executive abstract 1.1 motivation the...
TRANSCRIPT
Zimmerstr. 30 . 10969 Berlin . Telefon +49 (0)30 206412-0 . Telefax +49 (0)30 206412-15 . E-Mail: [email protected]: Deutsche Bank Berlin, Konto-Nr. 0 700 781 00, BLZ 100 700 00
IBAN-Nr. DE26 1007 0000 0070 0781 00, BIC (Swift-Code) DEUTDEBBVereinsregister: Amtsgericht Berlin-Charlottenburg, VR 18526 Nz
Vorstandsausschuss: Heinz-Joachim Neubürger (Vorsitzender), Prof. Dr. Helmut Perlet (Stellvertreter),Prof. Dr. Rolf Nonnenmacher (Schatzmeister), Dr. Kurt Bock, Dr. Werner Brandt
Generalsekretär: Prof. Dr. Manfred Bolin
Die Präsidentin
Deutsches Rechnungslegungs StandardsAccounting Standards
Committee e.V.Committee of Germany
®Deutsches Rechnungslegungs StandardsAccounting Standards
Committee e.V.Committee of Germany
®
DRSC e. V. Zimmerstr. 30 10969 Berlin
Ms. Florence E. HarmonActing SecretaryU.S. Securities and Exchange Commission100 F StreetN.E. Washington, DC 20549-1090, USA
Dear Ms. Harmon,
File Number 4-560SEC Roundtable on Fair Value Accounting Standards, July 9th, 2008
We appreciate the opportunity to provide the U.S. Securities and Exchange Commission (“SEC”)and other observers of the Roundtable on Fair Value Accounting Standards with input regardingthe usefulness of fair value accounting.
We would like to submit the results of a joint research project of the Accounting Standards Com-mittee of Germany (ASCG), the Humboldt-University at Berlin and the European Federation ofFinancial Analysts Societies (EFFAS) which addresses the question which financial accountingmeasurement concept provides the most decision-useful information to professional investorsand their advisors as one of the most important user groups. The detailed findings of the onlinesurvey can be found in the attached document.
One of the main findings is that, when asked to give a general opinion on financial accountingmeasurement concepts, the respondents, regardless of their background, favour the consistentapplication of fair value accounting for all assets and liabilities. But this general opinion, however,does not hold for more specific questions. When asked to rank explicitly measurement conceptsfor different asset and liability groups, the responses are much more diverse:
For liquid and non-operating assets, mark-to-market fair value is considered to be themost decision-useful measurement concept.
For non-liquid and operating assets, historical cost and market-based fair value are notregarded as being significantly different in respect to decision-usefulness.
Mark-to-model fair values are regarded as significantly less decision-useful than bothmarket-based fair values and historical cost measures for practically all asset and liabilityclasses except for financial assets; for these respondents view mark-to-model measuresas more decision-useful than historical cost values.
We hope that the results of this survey will be useful for the discussion at the SEC Roundtable. Ifyou would like to further discuss the results of the survey, please do not hesitate to contact me.
Yours sincerely,
Liesel KnorrPresident of the German Accounting Standards Board (GASB)
Telefon +49 (0)30 206412-11
Telefax +49 (0)30 206412-15
E-Mail [email protected]
Berlin, 2. Juli 2008

FAIR VALUE MARK-TO-MARKET
LOWER OF COST OR MARKET
HISTORICAL COST
VALUE IN USE
FACE VALUE
FAIR VALUE MARK-TO-MODEL
Attitudes towards Fair Value and Other MeasurementConcepts: An Evaluation of their Decision-usefulness
SURVEY: The View of European Professional Investors and their Advisors
Joachim Gassen Kristina Schwedler

Authors: Professor Dr. Joachim Gassen, Humboldt-Universität zu Berlin
Kristina Schwedler, Accounting Standards Committee of Germany
Editors: Accounting Standards Committee of Germany (ASCG)
Humboldt-Universität zu Berlin
The European Federation of Financial Analysts Societies (EFFAS)
Berlin, April 2008
All rights reserved.
Contents
Contents....................................................................................................................................... I
Figures ........................................................................................................................................II
1 Executive abstract ............................................................................................................. 1
1.1 Motivation ................................................................................................................... 1
1.2 Study design and main findings .................................................................................. 1
1.3 Implications for standard setting ................................................................................. 2
2 Study design and response ................................................................................................ 3
2.1 Research method choice.............................................................................................. 3
2.2 Study design ................................................................................................................ 5
2.3 Response rate and representativeness ......................................................................... 6
3 Findings............................................................................................................................. 8
3.1 Professional investors’ characteristics ........................................................................ 8
3.2 Professional investors’ information usage ................................................................ 11
3.3 Professional investors’ attitudes towards different measurement concepts .............. 14
3.4 Robustness of results ................................................................................................. 19
4 Conclusions ..................................................................................................................... 20
References ................................................................................................................................ 22
Appendix A: Detailed response data........................................................................................ 23
Appendix B: Screenshots of the online survey ........................................................................ 65
I
Figures
Figure 1: Investors’ main field of work ................................................................................... 9
Figure 2: Investors’ work focus ............................................................................................. 10
Figure 3: Investors’ work experience in years....................................................................... 11
Figure 4: Statements characterizing investors’ applied method of analysis .......................... 12
Figure 5: Relevance and reliability of different information sources .................................... 13
Figure 6: Investors’ familiarity with prominent measurement concepts ............................... 15
Figure 7: General attitude towards different measurement concepts .................................... 16
Figure 8: Decision-usefulness of measurement concepts for different asset groups............. 17
Figure 9: Decision-usefulness of measurement concepts for different liability groups ........ 18
II
1
1 Executive abstract
1.1 Motivation
The increasing demand for world-wide harmonized principle-based financial accounting
standards is driving the current development of a remodeled conceptual framework by the
International Accounting Standards Board (IASB) and the Financial Accounting Standards
Board (FASB). One central objective in the development process of this modified conceptual
framework is to identify the measurement concepts which provide the most decision-useful
information to the recipients of financial accounting information. Thus, identifying the
measurement concept or concepts suitable for financial accounting is of general interest to
practitioners, standard setters and academics alike. While it is important to explore the
different economic attributes of the competing measurement concepts, the question as to
which measurement concept provides the most decision-useful information is predominantly
an empirical question: Different users have different information needs and thus, favor and
require different measurement concepts. Balancing the potentially conflicting user needs
requires judgment. In order to provide this judgment, the standard setters need information
about the information needs and opinions of different user groups. One of the central and
most influential user groups is the group of professional investors and their advisors.
1.2 Study design and main findings
This joint research project of the Accounting Standards Committee of Germany (ASCG), the
Humboldt-Universität zu Berlin and the European Federation of Financial Analysts Societies
(EFFAS) addresses this research question. Using an online survey, professional investors and
their advisors were questioned about their opinions in respect to competing financial
accounting measurement concepts. Based on a sample of 242 valid observations from
financial analysts, fund managers, institutional investors and rating experts this study finds
that
Respondents rank financial accounting information as the most important data source
when providing investment advice or making investment decisions. Direct contact to
management is of equal relevance but is consistently viewed as less reliable. Debt
investors seem to use more detailed data from the notes of the annual statements while
financial analysts tend to focus on quantitative financial statement data and apply a
“one-size-fits-all approach” when analyzing companies.
Investors are familiar with historical cost accounting and mark-to-market fair value
accounting. Other measurement concepts, such as lower of cost or market, value in use,
or mark-to-model accounting are significantly less well known.
2
If asked to give a general opinion on financial accounting measurement concepts, the
respondents, regardless of their background, favor the consistent application of fair
value accounting for all assets and liabilities.
This general opinion, however, does not hold for more specific questions. When asked
to rank explicit measurement concepts for different asset and liability groups, the
responses are much more diverse.
o For liquid and non-operating assets, mark-to-market fair value is considered to be
the most decision-useful measurement concept.
o For non-liquid and operating assets, historical cost and market-based fair value
are not regarded as being significantly different in respect to decision-usefulness.
o Mark-to-model fair values are regarded as significantly less decision-useful than
both market-based fair values and historical cost measures for practically all asset
and liability classes. Only for financial assets do respondents view mark-to-model
measures as more decision-useful than historical cost values.
These findings are tested for robustness by a set of extensive tests and should be
representative for European professional investors and their advisors who have an interest in
financial accounting matters. They clearly suggest that professional investors do not view
fair value measurement as a measurement concept with a homogenous impact on decision
usefulness. While they generally see market-based fair values as being (very) decision-useful,
they rank mark-to-model based fair values as the least decision-useful measurement concept.
Also, respondents differentiate between different groups of assets and liabilities when
assessing the decision-usefulness of measurement concepts. Only for liquid and non-
operating assets and liabilities do they clearly see market-based fair values as the most
decision-useful measurement concept. These findings put earlier results about the
preferences of professional investors towards different measurement concepts into
perspective: While the general opinions given in this survey confirm the results from earlier
studies, the detailed opinions for explicit measurement concepts and separate classes of assets
and liabilities show a more diverse picture.
1.3 Implications for standard setting
Based on these findings, this study cautiously suggests that the Boards should consider
differentiating between mark-to-model and mark-to-market approaches in fair value
accounting when assessing the decision-usefulness of competing measurement concepts.
Although this distinction is not easy to draw, especially with respect to financial assets, for
most non-financial assets it is obvious whether a fair value was determined on a sufficiently
liquid market or whether it is based on assumptions which are at least in part subject to
management’s expectations. Also, the decision-usefulness of different measurement concepts
should be evaluated separately for different asset and liability groups.
2 Study design and response
2.1 Research method choice
Identifying suitable measurement concepts for financial accounting is one of the central tasks
of standard setting. The attributes of prominent measurement concepts such as historical cost
and fair value have been indentified and categorized in the academic and practitioner
literature for decades. Without reciting all this extensive earlier work,1 two prominent
attributes and their ranking of historical cost and fair value seem to be fairly persistent
throughout the literature: Relevance, where fair value ranks first and historical cost metrics
rank second, and reliability where the ranking is the opposite. As the two prototypic
measurement concepts do not rank consistently across the two prototype decision-usefulness
attributes, choosing the most decision-useful measurement is non-trivial. This task is also
made more complex as users of financial accounting cannot be assumed to be sufficiently
homogeneous. For example, some users might invest in companies or markets where
corporate governance issues are substantial and thus, incentives between reporting
management and stakeholders are misaligned. This might fuel demand for more reliable
reporting measures by these investors, while other investors, who invest in well governed
companies only, do not have these additional concerns about the reliability of financial
accounting information as they do not expect systematic misreporting by management.
Summing up, in a world with heterogeneous users and governance infrastructures
there is no undogmatic normative solution to the financial accounting measurement problem.
Thus, setting rules requires balancing the different interests and needs of all subjects in the
accounting arena: preparers, auditors, and users (at least). Setting financial accounting
standards is ultimately a political process. Positive accounting research is aimed at
understanding and predicting the accounting-related preferences and behavior of market
participants. Thus, positive accounting research can help standard setters to understand and
anticipate the interests of accounting users and, finally, to develop standards which help to
arrive at a political consensus and achieve the desired goal of financial accounting. This
research project addresses a descriptive positive research question: What are the preferences
of professional investors and their advisors in respect to different financial accounting
measurement concepts?
Investigating the preferences of professional investors and their advisors (referred to
as professional investors or just investors from now on) towards different financial accounting
measurement concepts could be accomplished in several ways. First, researchers could study
the way investors use and evaluate financial accounting data in their decision process and
whether they make better-informed and less costly decisions using data resulting from one
measurement concept rather than from another. This behavioral approach would require
observing the real-life decision-making processes of investors, which is rarely possible.
1 As an entry point into this literature, refer to Choy (2006) or Hitz (2007).
3
Another behavioral research design would be to set up laboratory experiments, where
investors are asked to make decisions based on artificial financial accounting data stemming
from different measurement concepts in a controlled environment. While this research design
has its advantages and has been applied to similar research questions, researchers conducting
such experiments regularly face problems motivating subjects with adequate backgrounds as
professional investors to participate in such experiments. Also, as a controlled experiment is
fairly different from real life, external validity concerns threaten the generalizability of results
from such studies.
Turning to empirical archival research methodology, it is possible to infer the actual
use and the effectiveness of different measurement concepts by investors by observing the
outcome of investors’ decisions. These outcomes could, for example, be analyst recommen
dations or reports, rating or capital market investment decisions. While observing these
outcomes is possible, linking them to competing measurement concepts is very complex: If
the recommendations of a financial analyst yield higher abnormal returns for financial
institutions applying IAS 39 compared to recommendations for financial institutions which
apply a more historical cost-oriented accounting model, it appears problematic to link this
result to the usage of fair value measurement. Thus, empirical archival research designs face
internal validity concerns.
This is why this study uses survey methodology to address its research question.2
Balancing the strength and weaknesses of the research designs outlined above, survey studies
allow direct investigation of subjects’ attitudes, thus avoiding the internal validity concerns of
empirical archival studies. In addition, it is not necessary to directly observe the action of
subjects, which increases the feasibility of the research design. Also, subjects are questioned
about real life behavior, which removes some of the external validity concerns which threaten
laboratory experiments. Nevertheless, survey studies have some severe drawbacks, which
have to be taken into account when evaluating the results of this study. First of all, survey
studies only observe the self-assessment of subjects, which is different from the assessment of
an independent observer. Second, respondents tend to systematically bias their response
behavior, both knowingly and unknowingly, towards what they feel is the response behavior
preferred both by public in general and the interviewer in particular. This behavior has been
characterized as “interviewer bias”. Third, the survey instrument can be misunderstood by
the subjects, inducing noise or, if the misconception is not happening randomly across
subjects, bias in the response data. All these points threaten the internal validity of survey
research designs. The external validity crucially depends on the representativeness of the
response data for the population under study. If the number of respondents is large enough
and the respondents are sufficiently randomly drawn from the population, external validity is
For an influential study which also relies on survey methodology, refer to Graham et al. (2005). General discussions of the usefulness of survey designs in the area of finance can be found in Neuhauser (2007) and Baker/Mukherjee (2007).
4
2
not too much of a concern. Unfortunately, in most survey studies the response samples are, at
least compared to the complete population, relatively small. Also, as subjects have the option
of not participating in the survey and can be assumed not to make this decision at random, the
resulting response bias makes the response sample a non-random sub-sample of the
underlying population.
2.2 Study design
The valid population of this study comprises all professional investors and their advisors who
use financial accounting information for their decision-making. This population is unknown
and even its size is hard to predict. Also, defining the group of professional investors and
their advisors is not straightforward. This study takes a pragmatic approach in identifying its
research sample. As some earlier work on the view of professional investors from the U.S.
already exists and as existing literature highlights the problem of motivating professional
investors to participate in survey studies,3 we focus on European investors and rely on the
network of the European Federation of Financial Analysts Societies (EFFAS) for providing
the contact opportunities to a sample of professional investors. In addition, other investor
organizations (German CFA Society, GCFAS; Bundesverband Investment und Asset
Management e.V.; BVI; Corporate Reporting User Forum, CRUF) were also addressed in
order to produce a sufficiently large response sample. This yields a research sample of about
20,000 investors.
As the existing literature documents a very limited motivation of professional
investors to participate in survey studies,4 it was decided to survey the complete sample. For
an European survey study of this magnitude, a structured online instrument seemed to be the
only feasible choice. In order to increase response, the survey was limited in length so that
the total time needed to complete the survey should not exceed 20 minutes.
Before developing the actual instrument, structured interviews with financial analysts
and fund investors were conducted in order to better understand the way these investors
process financial accounting data and how they approach different measurement concepts.
One major result of these interviews was the focus on the inherent heterogeneity of the term
“fair value” and the focus on different classes of assets and liabilities. More general
“attitude” questions were also included to enhance comparability with earlier studies. One
other result of the interviews was that most participants stated that most of their colleagues
were neither very interested nor very experienced in different accounting measurement
concepts. This caused two concerns. First, whenever a survey study is conducted in a
“special interest” area, subjects who have this “special interest” tend to respond more
3 For prior studies investigating the attitudes of professional investors towards financial accounting measurement concepts refer to e.g. PwC (2005); CFO (2007). For the problems of motivating investors to participate in behavioral studies see Elliot et al. (2007).
4 See, for example the comparably low response rates of Barker (1999); Hodge (2003); Ernst et al. (2005); and Gohlke et al. (2007).
5
frequently than subjects who do not share this “special interest”, giving rise to substantial
response bias. Second, subjects who are unfamiliar with the topics addressed in the survey
instrument could induce noise into the response data. To address the second concern, control
questions were included surveying the method of analysis, the information usage and the
familiarity with different accounting measurement concepts. The first concern is hard to
address, as there is no way to control for response bias without instrumental data describing
the underlying population. Thus, this study cannot be expected to be representative of the
complete population of professional investors and their advisors. It can only be expected to
be representative of professional investors and their advisors who regularly use financial
accounting information within their decision-making process.
The online survey instrument resulting from these considerations included 12
questions, most of which had multiple answer options. In most questions, subjects were
asked to give an opinion based on a five point Likert scale. In addition, all questions could be
answered as “impossible to say” and subjects had the option of leaving questions unanswered.
A free-form feedback field was placed under each of the 12 questions. Each question was
displayed on a different screen, a progress bar was visible on each screen and the subjects had
the opportunity to navigate back to previously answered questions and to interrupt their
answer process and to come back at a later time. Screenshots of the online survey instrument
are presented in Appendix B.
The survey instrument was pre-tested on about twenty subjects. These subjects all had
a background in investing and accounting. Some of them were themselves professional
investors or advisors. After the feedback of the pre-testing group the online survey was
slightly modified to address the concerns of the pre-testers. Also, the response time of the
pre-testers was used to set the expected response time for the surveyed investors (20 minutes).
The links to the online instruments were distributed to the surveyed investors by email,
accompanied by a note from the relevant participating organizations explaining the purpose
and the importance of the study. The response deadline was extended twice and two
reminders were distributed over the participating organizations’ networks in order to improve
the response rate. All responses were directly recorded in a database. The IP-number of
respondents was tracked (one-way encrypted) along with a cookie code in order to ensure
proper assignment of responses and to avoid double participating subjects.
2.3 Response rate and representativeness
The survey period started on 15 May 2007. Most organizations sent out their invitation email
to their members at a later date of their own discretion. By the final response deadline (30
Oct 2007) 383 responses had been received. This indicates an estimated response rate of
roughly 1.9 %. This is a very low response rate, but seems to be comparable to similar
6
surveys and can be explained by the surveying procedure (anonymous email, no
incentivization) and the surveyed population (high opportunity costs).5
The low response rate poses a threat to internal and external validity. First, if the
absolute number of responses is low, this reduces the power of statistical tests, increasing the
possibility of falsely non-rejecting the null hypothesis of no difference between responses.
Thus, small response samples bias against finding a result. If the results show significant
differences between measurement concepts, this is not because of but despite the low absolute
number of responses. Second, a low response rate threatens the external validity of the
results. It appears questionable whether they can be regarded as being representative of the
underlying population. This point is crucial for the research project at hand because the
underlying population is unknown. In order to assess the level of representativeness, it seems
important to investigate the reasons for the low response rate. Therefore, some non
participating subjects were questioned for their reasons of non-responding. The indicated
reasons are primarily in line with the existing literature (time constraints, too many surveys
sent to them, lack of interest).6 The last point seems of particular importance, as the interest
in accounting matters can be expected to be systematically related to the survey responses.
Building on these arguments, it can be expected that the low response rate induced a response
bias, as subjects with a high level of interest in financial accounting matters can be expected
to be over-represented in the sample.
Another problem of the sampling procedure lies in the low quality of the surveyed
sample. As the member organizations of EFFAS have differing regulations for determining
whom they accept as a member of their organization, it appears unclear whether all
respondents actually belong to the population of professional investors and their advisors. As
the overall number of responses is comparatively low, even a small number of out-of
population responses can threaten the external validity of the results. Also, as professional
investors are generally assumed to face higher opportunity costs than average market
participants, it seems probable that out-of-population responses are over-represented in the
response sample. To avoid out-of-population responses polluting the sample, only
respondents who can be assigned to one of the following groups are treated as valid
respondents: financial analysts, fund managers, institutional investors, credit or corporate
rating experts. These are the work categories mentioned in question 1 of the online survey.
186 respondents selected themselves into one of these categories. All respondents who failed
to assign themselves to one of these work areas were asked to give some information about
their area of work. Based on these statements, 64 respondents were assigned to one of the
four work areas. Of these 250 respondents 8 observations were discarded because the
respondents did not answer the questions about their cultural background (questions nos. 5
and 6). The remaining 133 observations were discarded.
5 For an overview of response rates in online surveys refer to Sills/Song (2002). 6 Refer to Sills/Song (2002); for a more general overview refer to Groves et al. (2004), pp. 169 ff.
7
The “full sample”, which is to be evaluated in the next section, consists of 242
observations.7 Although, technically, the underlying population is unknown and because of
that, statistically valid statements about representativeness are not possible, based on the
reasoning presented in this section, the full sample should be fairly representative of European
professional investors and their advisors who take an interest in financial accounting issues.
3 Findings
3.1 Professional investors’ characteristics
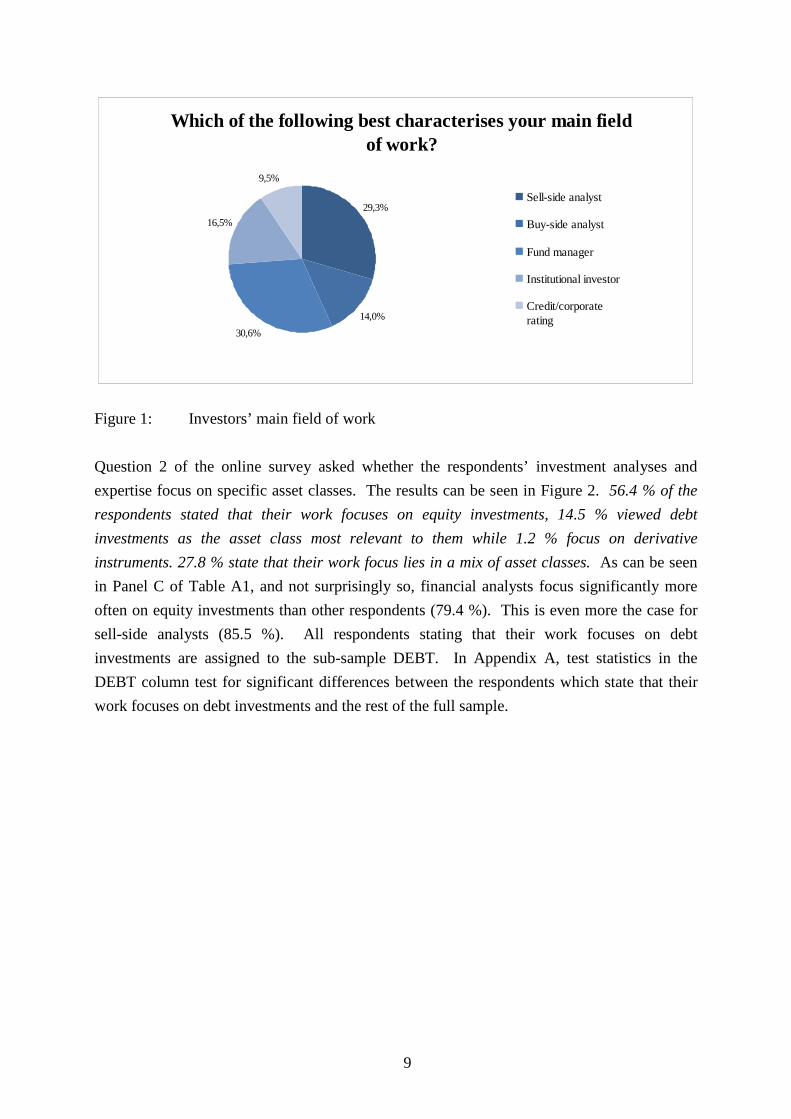
Based on the full sample of 242 valid responses, Figure 1 shows the main field of work of the
responding professional investors. These results are based on the response to question 1 of
the online survey. The majority of 43.3 % work as financial analysts, 30.6 % work as a fund
managers, 16.5 % label themselves as institutional investors, and 9.5 % work in credit or
corporate rating. As explained in the previous section, respondents who did not fall into one
of these occupational groups were excluded from the full sample. Of the financial analysts,
about two-third (29.3 % of the full sample) are working as sell-side analysts, whereas one-
third (14.0 % of the full sample) are working as buy-side analysts. Sell-side analysts
generally work for brokerage firms and provide investment advice to the clients of their
employer, whereas buy-side analysts normally work for investing firms, such as investment,
mutual, or pension funds. The tables in Appendix A report sub-sample results for the full
sample (denoted FULL), for the sub-sample of financial analysts (FINAN), and for the sub-
sample of sell-side financial analysts (SELLSIDE). The test statistics in the FINAN column
test for significant response differences between financial analysts and the full sample, while
the test statistics in the SELLSIDE column test for significant differences between sell-side
and buy-side financial analysts.
7 This response sample is, compared to similar surveys, relatively large. See e.g. Barker (1999) (survey and interviews of 70 professional investors); Schulz (1999) (survey of 70 professional investors); AIMR (2000) (survey of 343 general investors); Marten et al. (2002) (survey of 153 DVFA members); Hodge (2003) (414 nonprofessional investors); PwC (2005) (interviews with 50+ financial analysts); Ernst et al. (2005) (survey of 140 institutional investors); Gohlke et al. (2006) (survey of 124 professional investors); CFO (2007) (no formal survey).
8
Which of the following best characterises your main field of work?
29,3%
14,0%
30,6%
16,5%
9,5%
Sell-side analyst
Buy-side analyst
Fund manager
Institutional investor
Credit/corporate rating
Figure 1: Investors’ main field of work
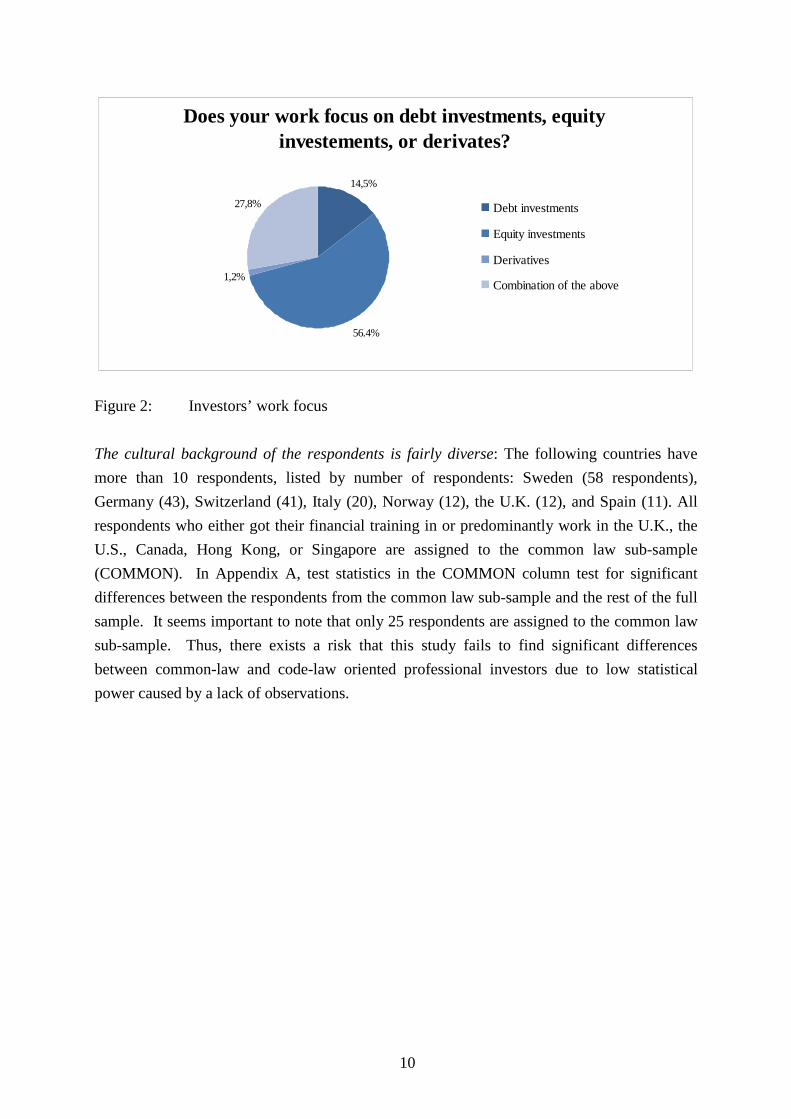
Question 2 of the online survey asked whether the respondents’ investment analyses and
expertise focus on specific asset classes. The results can be seen in Figure 2. 56.4 % of the
respondents stated that their work focuses on equity investments, 14.5 % viewed debt
investments as the asset class most relevant to them while 1.2 % focus on derivative
instruments. 27.8 % state that their work focus lies in a mix of asset classes. As can be seen
in Panel C of Table A1, and not surprisingly so, financial analysts focus significantly more
often on equity investments than other respondents (79.4 %). This is even more the case for
sell-side analysts (85.5 %). All respondents stating that their work focuses on debt
investments are assigned to the sub-sample DEBT. In Appendix A, test statistics in the
DEBT column test for significant differences between the respondents which state that their
work focuses on debt investments and the rest of the full sample.
9
Does your work focus on debt investments, equity
investements, or derivates?
14,5%
1,2%
27,8%
56.4%
Debt investments
Equity investments
Derivatives
Combination of the above
Figure 2: Investors’ work focus
The cultural background of the respondents is fairly diverse: The following countries have
more than 10 respondents, listed by number of respondents: Sweden (58 respondents),
Germany (43), Switzerland (41), Italy (20), Norway (12), the U.K. (12), and Spain (11). All
respondents who either got their financial training in or predominantly work in the U.K., the
U.S., Canada, Hong Kong, or Singapore are assigned to the common law sub-sample
(COMMON). In Appendix A, test statistics in the COMMON column test for significant
differences between the respondents from the common law sub-sample and the rest of the full
sample. It seems important to note that only 25 respondents are assigned to the common law
sub-sample. Thus, there exists a risk that this study fails to find significant differences
between common-law and code-law oriented professional investors due to low statistical
power caused by a lack of observations.
10
11
How many years of experience do you have in yourmain field of work?
15,1%
30,5%
22,2%
15,5%16,7%
0,0%
5,0%
10,0%
15,0%
20,0%
25,0%
30,0%
35,0%
0 ≤ response < 5 5 ≤ response < 10 10 <= response < 15 15 <= response < 20 20 <= response
Figure 3: Investors’ work experience in years
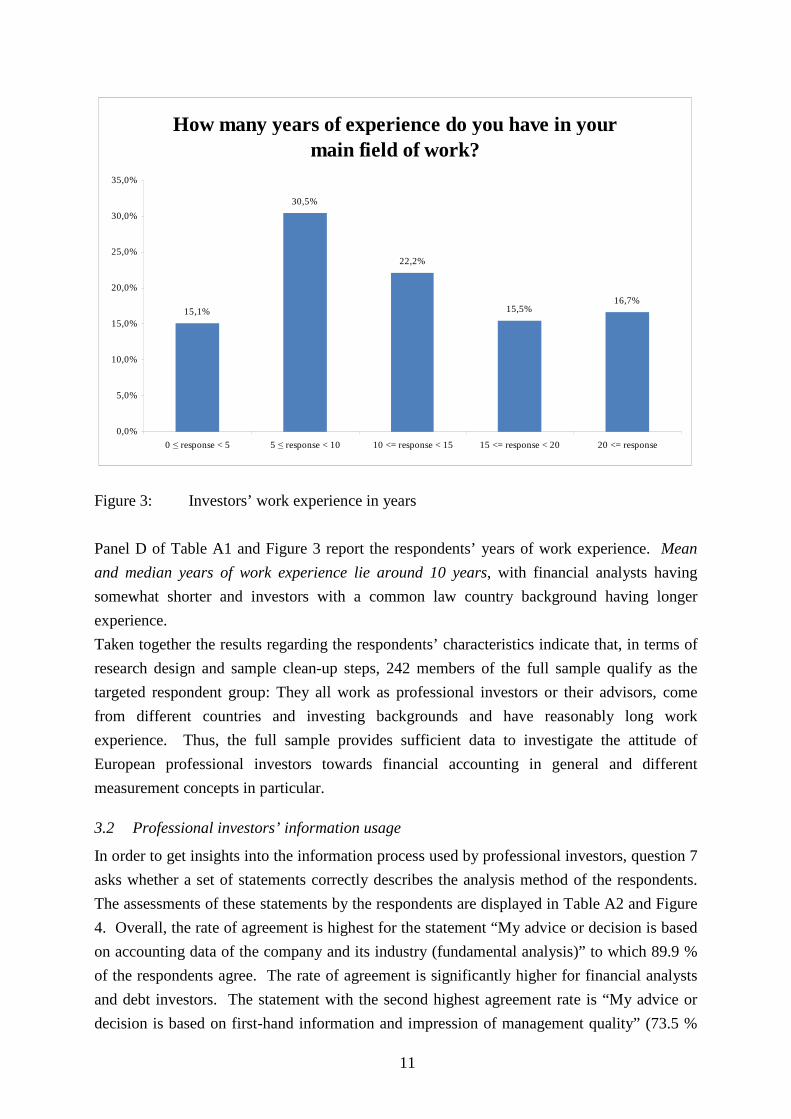
Panel D of Table A1 and Figure 3 report the respondents’ years of work experience. Mean
and median years of work experience lie around 10 years, with financial analysts having
somewhat shorter and investors with a common law country background having longer
experience.
Taken together the results regarding the respondents’ characteristics indicate that, in terms of
research design and sample clean-up steps, 242 members of the full sample qualify as the
targeted respondent group: They all work as professional investors or their advisors, come
from different countries and investing backgrounds and have reasonably long work
experience. Thus, the full sample provides sufficient data to investigate the attitude of
European professional investors towards financial accounting in general and different
measurement concepts in particular.
3.2 Professional investors’ information usage
In order to get insights into the information process used by professional investors, question 7
asks whether a set of statements correctly describes the analysis method of the respondents.
The assessments of these statements by the respondents are displayed in Table A2 and Figure
4. Overall, the rate of agreement is highest for the statement “My advice or decision is based
on accounting data of the company and its industry (fundamental analysis)” to which 89.9 %
of the respondents agree. The rate of agreement is significantly higher for financial analysts
and debt investors. The statement with the second highest agreement rate is “My advice or
decision is based on first-hand information and impression of management quality” (73.5 %
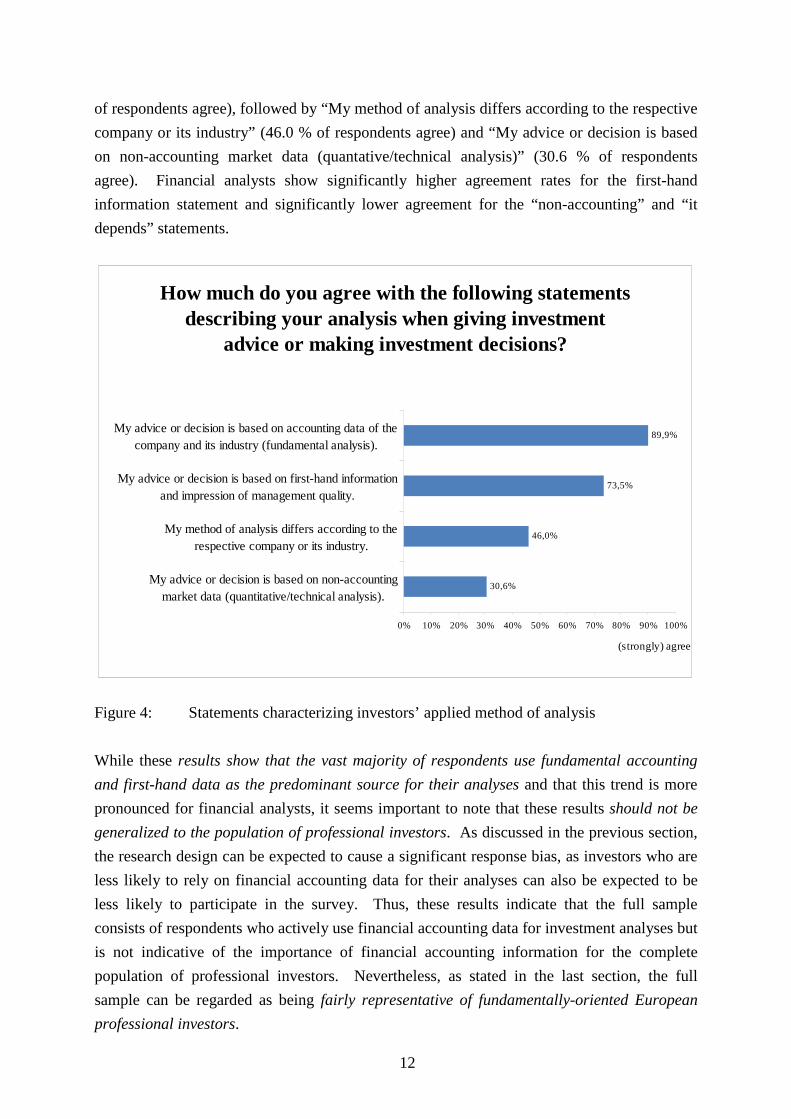
of respondents agree), followed by “My method of analysis differs according to the respective
company or its industry” (46.0 % of respondents agree) and “My advice or decision is based
on non-accounting market data (quantative/technical analysis)” (30.6 % of respondents
agree). Financial analysts show significantly higher agreement rates for the first-hand
information statement and significantly lower agreement for the “non-accounting” and “it
depends” statements.
How much do you agree with the following statements
describing your analysis when giving investment advice or making investment decisions?
89,9%
73,5%
46,0%
30,6%
0% 10% 20% 30% 40% 50% 60% 70% 80% 90% 100%
My advice or decision is based on accounting data of the
company and its industry (fundamental analysis).
My advice or decision is based on first-hand information
and impression of management quality.
My method of analysis differs according to the
respective company or its industry.
My advice or decision is based on non-accounting
market data (quantitative/technical analysis).
(strongly) agree
Figure 4: Statements characterizing investors’ applied method of analysis
While these results show that the vast majority of respondents use fundamental accounting
and first-hand data as the predominant source for their analyses and that this trend is more
pronounced for financial analysts, it seems important to note that these results should not be
generalized to the population of professional investors. As discussed in the previous section,
the research design can be expected to cause a significant response bias, as investors who are
less likely to rely on financial accounting data for their analyses can also be expected to be
less likely to participate in the survey. Thus, these results indicate that the full sample
consists of respondents who actively use financial accounting data for investment analyses but
is not indicative of the importance of financial accounting information for the complete
population of professional investors. Nevertheless, as stated in the last section, the full
sample can be regarded as being fairly representative of fundamentally-oriented European
professional investors.
12
Which sources of information do you use when providing investment advice or making investment
decisions, and how do you assess them?
0% 10% 20% 30% 40% 50% 60% 70% 80% 90%
78,5% Annual financial statements 83,2%
71,8% Notes to annual financial statements
74,8%
71,2% Direct personal contact with management 55,4%
67,6% Quarterly financial statements relevance 69,2%
61,2%
45,1%
Management commentary (e.g. management’s
discussion & analyses)Interaction in analysts’ meetings, conference calls, reliability
48,6%
56,0%
etc.
39,0% Voluntary public disclosure by the company 34,6%
28,7%
21,9%
Third-party coverage (through media, other analysts,
etc.)
(very) high
Figure 5: Relevance and reliability of different information sources
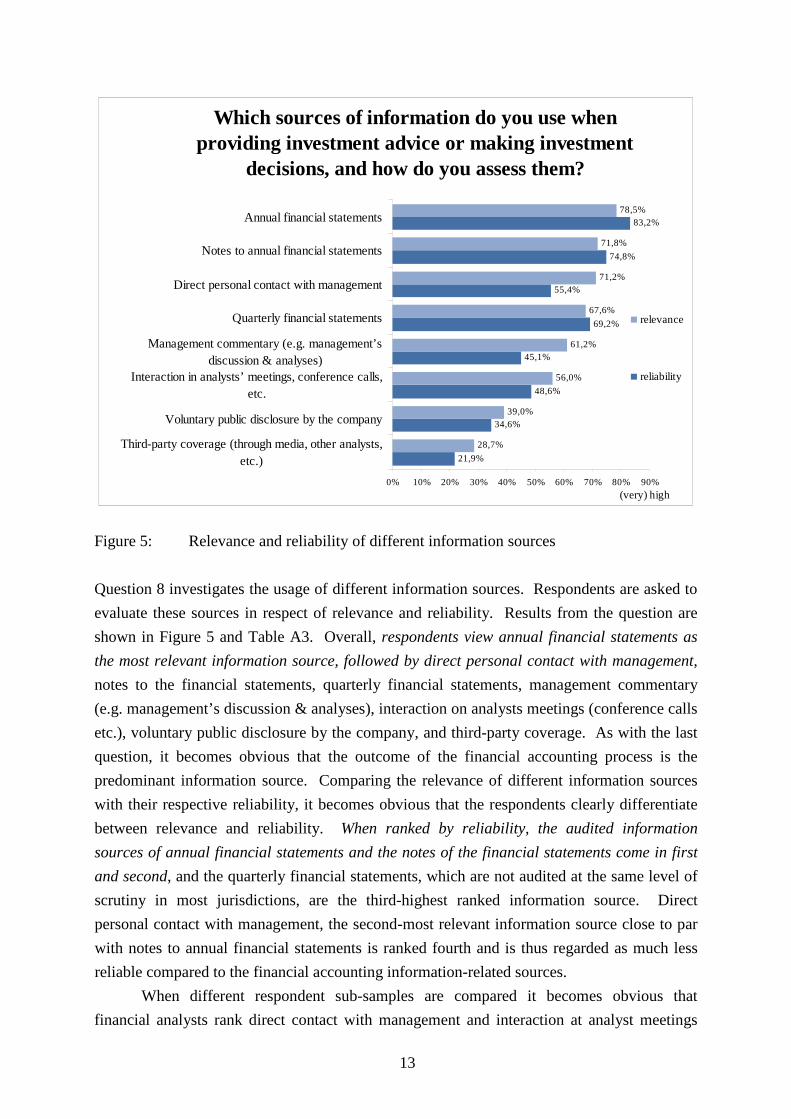
Question 8 investigates the usage of different information sources. Respondents are asked to
evaluate these sources in respect of relevance and reliability. Results from the question are
shown in Figure 5 and Table A3. Overall, respondents view annual financial statements as
the most relevant information source, followed by direct personal contact with management,
notes to the financial statements, quarterly financial statements, management commentary
(e.g. management’s discussion & analyses), interaction on analysts meetings (conference calls
etc.), voluntary public disclosure by the company, and third-party coverage. As with the last
question, it becomes obvious that the outcome of the financial accounting process is the
predominant information source. Comparing the relevance of different information sources
with their respective reliability, it becomes obvious that the respondents clearly differentiate
between relevance and reliability. When ranked by reliability, the audited information
sources of annual financial statements and the notes of the financial statements come in first
and second, and the quarterly financial statements, which are not audited at the same level of
scrutiny in most jurisdictions, are the third-highest ranked information source. Direct
personal contact with management, the second-most relevant information source close to par
with notes to annual financial statements is ranked fourth and is thus regarded as much less
reliable compared to the financial accounting information-related sources.
When different respondent sub-samples are compared it becomes obvious that
financial analysts rank direct contact with management and interaction at analyst meetings
13
and conference calls as significantly more relevant. They also see annual quarterly financial
statement information as more relevant, while they do not assess the notes to the annual
financial statements as being more relevant. Not surprisingly, financial analysts in general
and sell-side analysts in particular view third-party information as less relevant. Another
interesting result emerges when debt investors are compared to the full sample: They view
notes disclosures as more relevant and reliable. They also assess voluntary information by the
management as being more relevant.
When comparing these results, it appears that while generally consistently ranking
financial accounting and direct contact information as most important, there are substantial
differences in the information usage across different investor groups: While financial analysts
tend to rely on direct contact and easily accessible accounting information, debt investors, on
average, seem to be digging deeper into the data: They view the notes to the financial
statements as significantly more important than the other investor groups. In addition, there is
weak evidence that they tend to apply more firm-specific methods of analysis than do
financial analysts, who tend to follow a “one-size-fits-all” approach. Debt investors also
seem to view voluntary disclosures as more important, maybe because management can be
expected to be more forthcoming with additional information in order to receive a better
rating.
3.3 Professional investors’ attitudes towards different measurement concepts
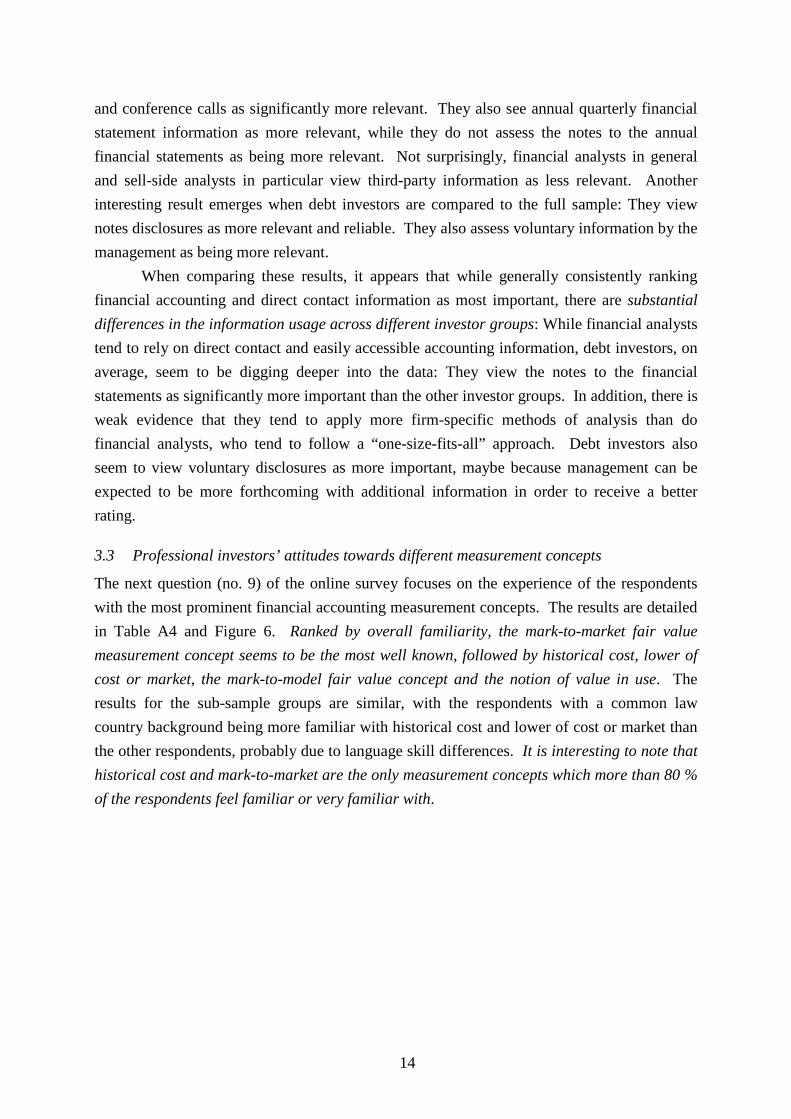
The next question (no. 9) of the online survey focuses on the experience of the respondents
with the most prominent financial accounting measurement concepts. The results are detailed
in Table A4 and Figure 6. Ranked by overall familiarity, the mark-to-market fair value
measurement concept seems to be the most well known, followed by historical cost, lower of
cost or market, the mark-to-model fair value concept and the notion of value in use. The
results for the sub-sample groups are similar, with the respondents with a common law
country background being more familiar with historical cost and lower of cost or market than
the other respondents, probably due to language skill differences. It is interesting to note that
historical cost and mark-to-market are the only measurement concepts which more than 80 %
of the respondents feel familiar or very familiar with.
14
Financial accounting uses different valuation concepts for measuring assets and liabilities. How
familiar are you with the following measurement concepts?
44,7%
52,6%
70,4%
85,5%
92,4%
0% 20% 40% 60% 80% 100%
Value in use
Fair value (mark-to-model)
Lower of cost or market
Historical cost
Fair value (mark-to-market)
(very) familiar
Figure 6: Investors’ familiarity with prominent measurement concepts
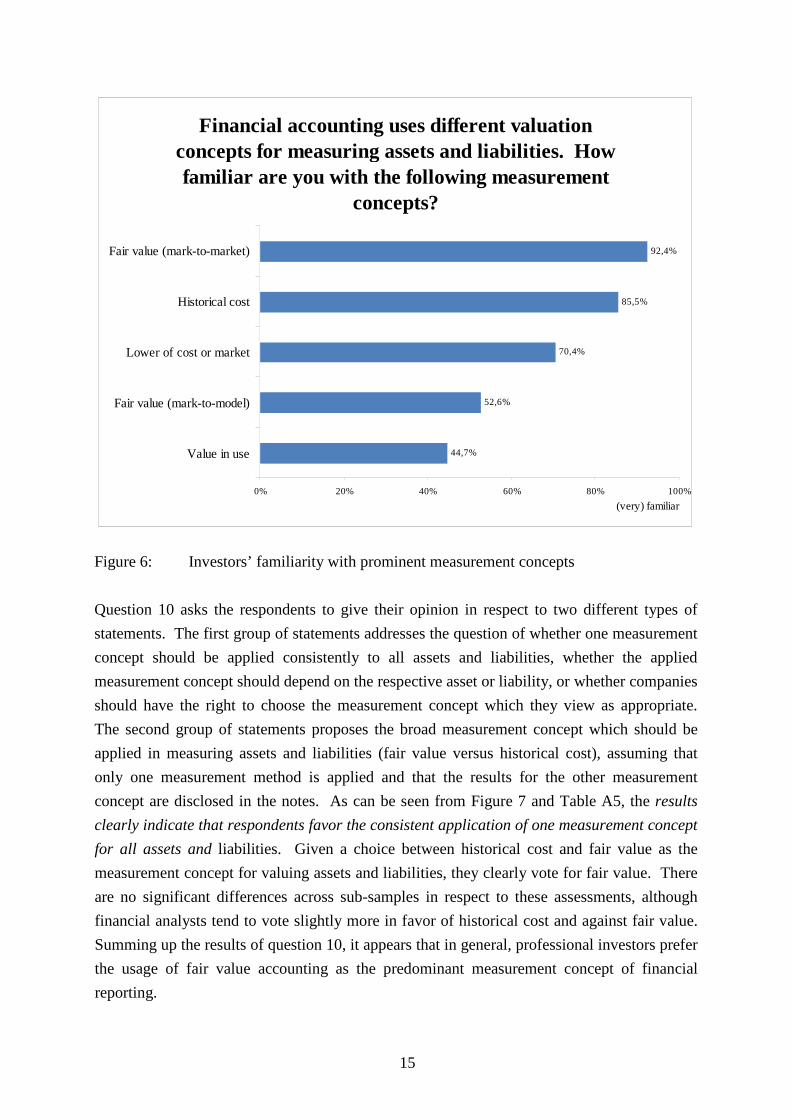
Question 10 asks the respondents to give their opinion in respect to two different types of
statements. The first group of statements addresses the question of whether one measurement
concept should be applied consistently to all assets and liabilities, whether the applied
measurement concept should depend on the respective asset or liability, or whether companies
should have the right to choose the measurement concept which they view as appropriate.
The second group of statements proposes the broad measurement concept which should be
applied in measuring assets and liabilities (fair value versus historical cost), assuming that
only one measurement method is applied and that the results for the other measurement
concept are disclosed in the notes. As can be seen from Figure 7 and Table A5, the results
clearly indicate that respondents favor the consistent application of one measurement concept
for all assets and liabilities. Given a choice between historical cost and fair value as the
measurement concept for valuing assets and liabilities, they clearly vote for fair value. There
are no significant differences across sub-samples in respect to these assessments, although
financial analysts tend to vote slightly more in favor of historical cost and against fair value.
Summing up the results of question 10, it appears that in general, professional investors prefer
the usage of fair value accounting as the predominant measurement concept of financial
reporting.
15
General attitude towards measurement concepts
All assets and liabilities should be reported following the 62,9%
same measurement concept.
All assets and liabilities should be reported at fair value, 60,5%
with historical cost information presented in the notes.
All assets and liabilities should be reported at historical cost, 29,0%
with fair value information presented in the notes.
Assets and liabilities should be reported following differentmeasurement concepts, with the relevant measurement
39,9% concept depending on the nature of the according asset or
liability.
Companies should be permitted to choose amongalternative measurement concepts for different classes of 12,9%
assets and/or liabilities.
0% 20% 40% 60% 80% (strongly) agree
Figure 7: General attitude towards different measurement concepts
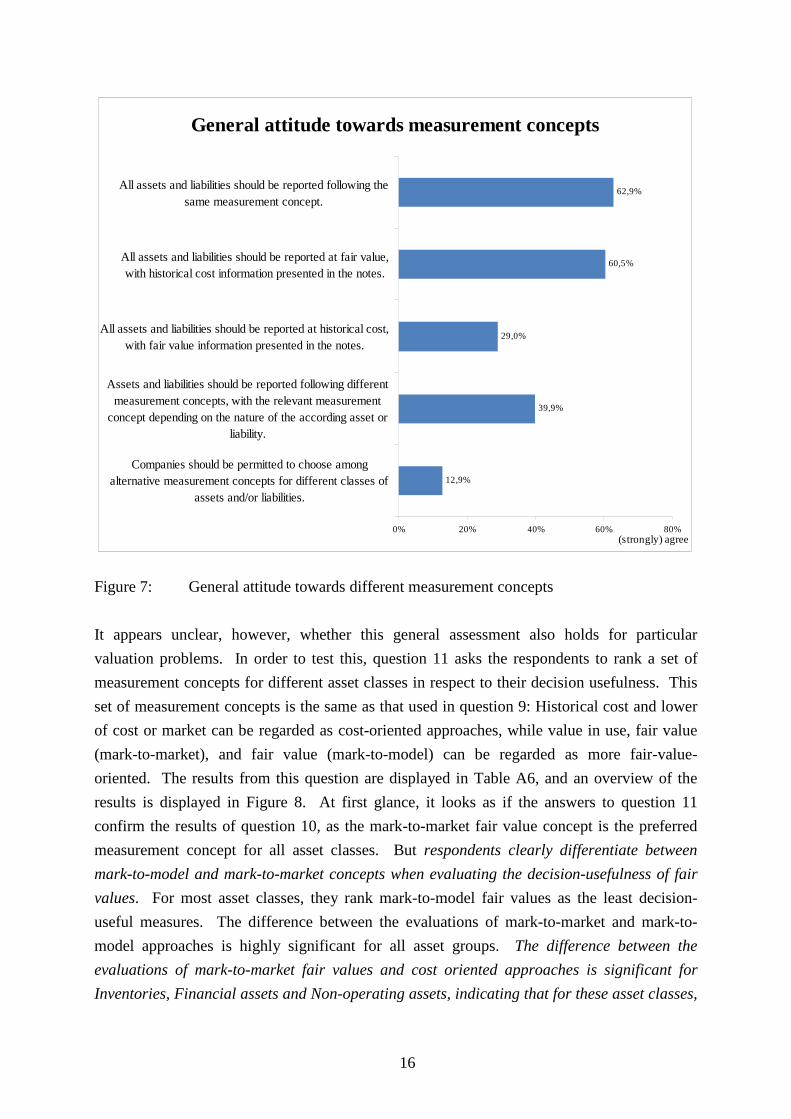
It appears unclear, however, whether this general assessment also holds for particular
valuation problems. In order to test this, question 11 asks the respondents to rank a set of
measurement concepts for different asset classes in respect to their decision usefulness. This
set of measurement concepts is the same as that used in question 9: Historical cost and lower
of cost or market can be regarded as cost-oriented approaches, while value in use, fair value
(mark-to-market), and fair value (mark-to-model) can be regarded as more fair-value
oriented. The results from this question are displayed in Table A6, and an overview of the
results is displayed in Figure 8. At first glance, it looks as if the answers to question 11
confirm the results of question 10, as the mark-to-market fair value concept is the preferred
measurement concept for all asset classes. But respondents clearly differentiate between
mark-to-model and mark-to-market concepts when evaluating the decision-usefulness of fair
values. For most asset classes, they rank mark-to-model fair values as the least decision-
useful measures. The difference between the evaluations of mark-to-market and mark-to
model approaches is highly significant for all asset groups. The difference between the
evaluations of mark-to-market fair values and cost oriented approaches is significant for
Inventories, Financial assets and Non-operating assets, indicating that for these asset classes,
16
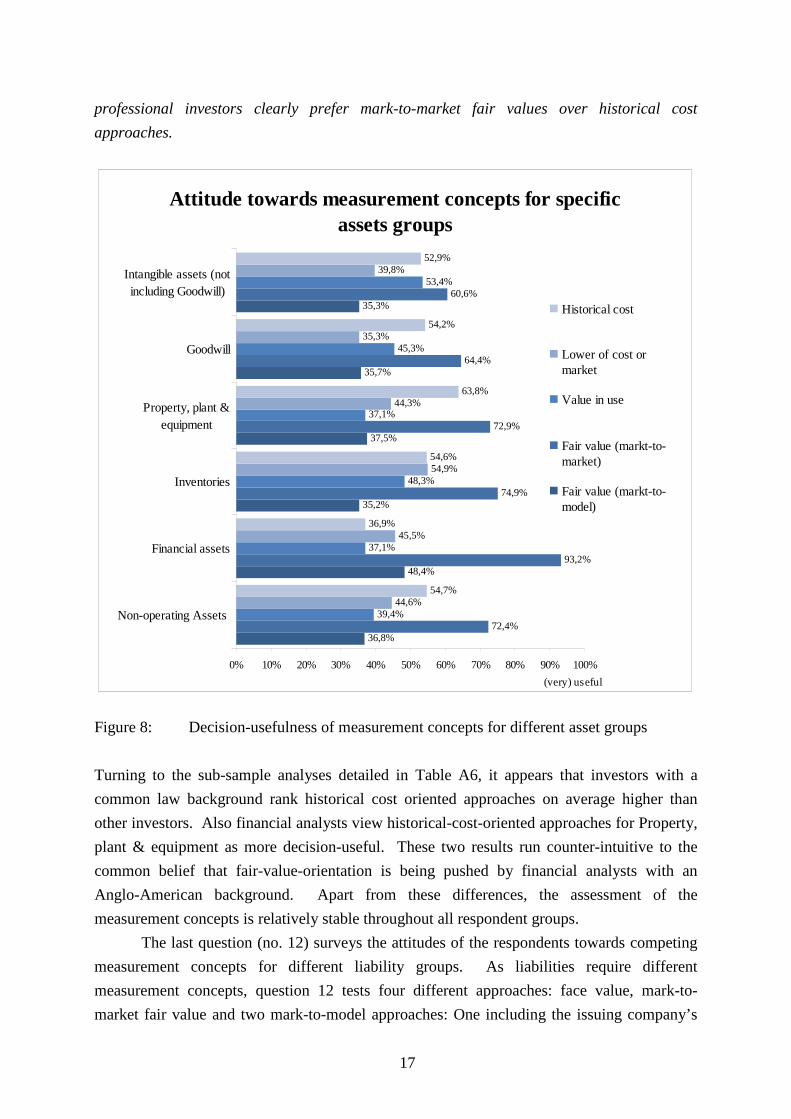
professional investors clearly prefer mark-to-market fair values over historical cost
approaches.
Attitude towards measurement concepts for specific
assets groups
36,8%
48,4%
35,2%
37,5%
35,7%
35,3%
72,4%
93,2%
74,9%
72,9%
64,4%
60,6%
39,4%
37,1%
48,3%
37,1%
45,3%
53,4%
44,6%
45,5%
54,9%
44,3%
35,3%
39,8%
54,7%
36,9%
54,6%
63,8%
54,2%
52,9%
0% 10% 20% 30% 40% 50% 60% 70% 80% 90% 100%
Non-operating Assets
Financial assets
Inventories
Property, plant &
equipment
Goodwill
Intangible assets (not
including Goodwill)
(very) useful
Historical cost
Lower of cost or market
Value in use
Fair value (markt-tomarket)
Fair value (markt-tomodel)
Figure 8: Decision-usefulness of measurement concepts for different asset groups
Turning to the sub-sample analyses detailed in Table A6, it appears that investors with a
common law background rank historical cost oriented approaches on average higher than
other investors. Also financial analysts view historical-cost-oriented approaches for Property,
plant & equipment as more decision-useful. These two results run counter-intuitive to the
common belief that fair-value-orientation is being pushed by financial analysts with an
Anglo-American background. Apart from these differences, the assessment of the
measurement concepts is relatively stable throughout all respondent groups.
The last question (no. 12) surveys the attitudes of the respondents towards competing
measurement concepts for different liability groups. As liabilities require different
measurement concepts, question 12 tests four different approaches: face value, mark-to
market fair value and two mark-to-model approaches: One including the issuing company’s
17
78,7%
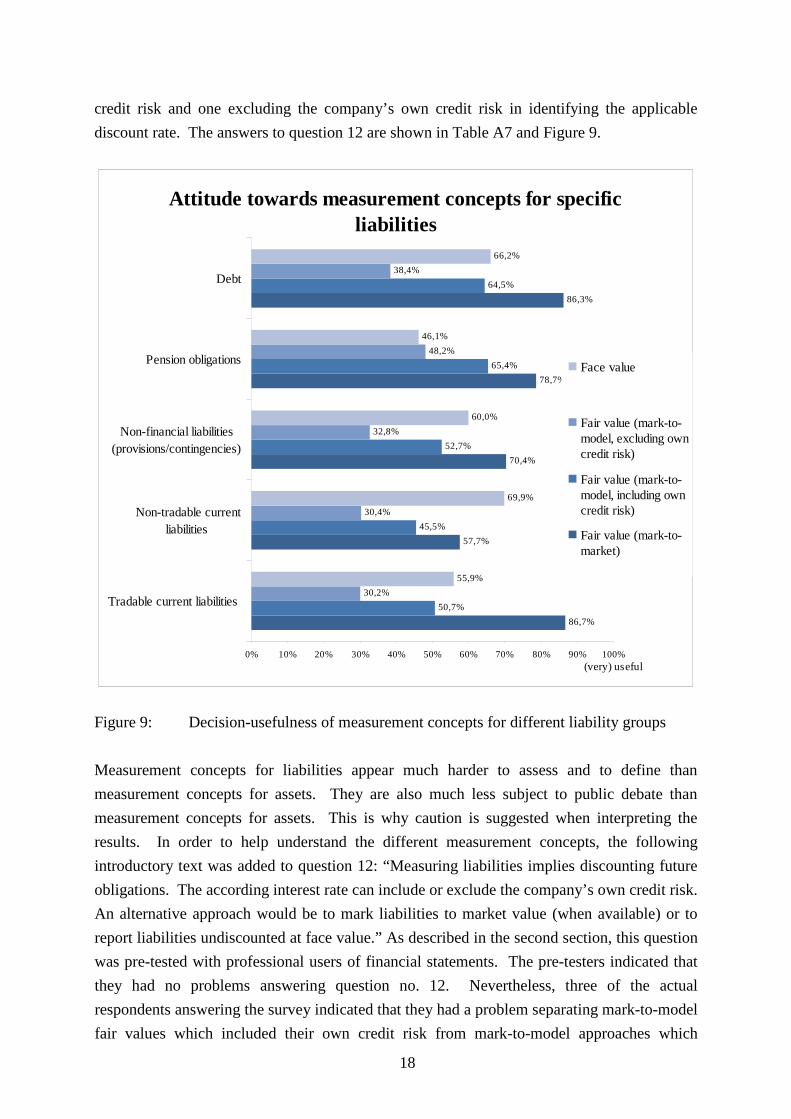
credit risk and one excluding the company’s own credit risk in identifying the applicable
discount rate. The answers to question 12 are shown in Table A7 and Figure 9.
Attitude towards measurement concepts for specific
liabilities
86,7%
57,7%
70,4%
86,3%
50,7%
45,5%
52,7%
65,4%
64,5%
30,2%
30,4%
32,8%
48,2%
38,4%
55,9%
69,9%
60,0%
46,1%
66,2%
0% 10% 20% 30% 40% 50% 60% 70% 80% 90% 100%
Tradable current liabilities
Non-tradable current
liabilities
Non-financial liabilities
(provisions/contingencies)
Pension obligations
Debt
Face value
Fair value (mark-tomodel, excluding own credit risk)
Fair value (mark-tomodel, including own credit risk)
Fair value (mark-tomarket)
(very) useful
Figure 9: Decision-usefulness of measurement concepts for different liability groups
Measurement concepts for liabilities appear much harder to assess and to define than
measurement concepts for assets. They are also much less subject to public debate than
measurement concepts for assets. This is why caution is suggested when interpreting the
results. In order to help understand the different measurement concepts, the following
introductory text was added to question 12: “Measuring liabilities implies discounting future
obligations. The according interest rate can include or exclude the company’s own credit risk.
An alternative approach would be to mark liabilities to market value (when available) or to
report liabilities undiscounted at face value.” As described in the second section, this question
was pre-tested with professional users of financial statements. The pre-testers indicated that
they had no problems answering question no. 12. Nevertheless, three of the actual
respondents answering the survey indicated that they had a problem separating mark-to-model
fair values which included their own credit risk from mark-to-model approaches which
18
excluded their own credit risk. Therefore, although respondents generally indicate that they
prefer fair values based on discount rates which include their own credit risk component, no
conclusions are drawn from these responses because it seems impossible to rule out
misunderstanding of the two measurement concepts as an alternative explanation.
Building on that, the results of question 12 are very similar to the responses to
question 11: In general, professional investors feel that market-based fair values are the most
decision-useful measurement concept for measuring liabilities, followed by face value. Again
mark-to-model approaches are viewed as being the least decision-useful measurement
concept. This ranking does not hold for non-tradable liabilities, where respondents favor the
use of face values over the application of mark-to-model fair value concepts. The differences
between group assessments are generally significant at conventional levels. Response
behavior is generally similar across different sub-samples. Investors with a common law
background tend to see face value as more decision-useful whereas debt-focused investors
tend to view mark-to-market fair values as less decision-useful for non-tradable financial
liabilities.
3.4 Robustness of results
The previous sections present three major results: (a) For liquid and non-operating assets, fair
value (mark-to-market) is considered to be the most decision-useful measurement concept; (b)
for non-liquid and operating assets, historical cost and market-based fair value are not
regarded as being significantly different in respect to decision usefulness; and (c) mark-to
model based fair values are regarded as significantly less decision-useful than both market-
based fair values and historical cost measures for practically all asset and liability classes. In
order to assess the validity of these main results, a set of robustness tests is performed. These
tests fall into two categories: First, it is investigated whether the design of the online survey is
influencing the major results. Second, the results are examined as to whether they are driven
by specific sub-samples of respondents.
Using online surveys as research instruments can induce noise and bias in the response
data. For example, respondents choose to drop out or just “click through” an online survey
without giving appropriate consideration to the questions. Respondents also have different
fixations (everything is good versus everything is bad) and exhibit different response variance
(“looks all the same to me” versus “black and white mentality”). These differences can
influence the findings. To test whether they do, a set of analyses is conducted. First, the
responses are screened for atypical response patterns, such as the same response value for all
questions, or only extreme responses. No extreme patterns could be identified. Second,
observations with low response variations are deleted from the analyses. Third, each
response is normalized by the mean and the variance of all responses given by the respective
respondent. Fourth, the sample is limited to contain only fully completed surveys. Fifth, the
sample is limited to participants who spent between 15 minutes and 45 minutes to complete
19
the online survey. All these additional analyses lead to the same major results. Thus, it can
be concluded that the major results are not driven by the research instrument.
The results were obtained from the evaluated full sample of 242 observations. To the
extent that the specific composition of this sample is driving the findings, the external validity
of the results would be validated. The sub-sample results of the previous section already
speak to this problem, as they indicate that the major findings are not driven by the work area,
the debt orientation or the cultural background of the respondents. Nevertheless there are
other sample attributes which might be driving the results. First, it might be the case that the
major results are driven by the sample cleanup procedures. In order to test for that, the
analyses are repeated for the complete response sample of 383 observations. Second, the
results could be driven by participants who are unfamiliar with financial accounting
measurement concepts. To test for this alternative explanation, the sample is limited to
contain only these observations where respondents state that they are at least somewhat
familiar with all the measurement concepts mentioned (question no. 9). Third, the sample is
limited to respondents who agree to the statement: “My advice or decision is based on
accounting data of the company and its industry (fundamental analysis)”. This ensures that
only respondents who actually use financial accounting information are included in the
analyses. Fourth, the sample is limited to respondents who claim that they have at least five
years of work experience to exclude inexperienced investors. Again, all these additional
analyses lead to the same major results, indicating that the major results are not driven by
untypical or specific investor groups. Taken together, this indicates that the major results of
this study are fairly robust.
4 Conclusions
Identifying the most decision-useful measurement concept of financial accounting is a
burdensome endeavor: There is no undogmatic conclusive normative theory identifying the
appropriate concepts, differing address groups have different priors and different demands,
and the differing reporting infrastructure of firms influences the attributes and, ultimately, the
decision-usefulness of the measurement outcome. Nevertheless, the task of financial
accounting standard setters is to identify the most appropriate measurement concept(s) for
assets and liabilities.
The aim of this study is to provide descriptive input to this task. By surveying
professional investors and their advisors, it shows that investors hold differentiated beliefs
about the decision-usefulness of competing measurement attributes. While earlier research
claimed that professional investors in general and financial analysts in particular view fair
value accounting as the measurement concept of choice, this study first replicates that finding
but then goes on to show that reality is most likely much more complicated than that. Based
on a sample of professional investors with an interest in financial accounting matters, it shows
that:
20
21
Investors are reasonably familiar only with historical cost accounting and mark-to-
market fair value accounting. Other measurement concepts, such as lower of cost or
market, value in use, or mark-to-model accounting are significantly less well known.
For liquid and non-operating assets, mark-to-market fair value is considered to be the
most decision-useful measurement concept.
For non-liquid and operating assets, historical cost and market-based fair values are
not regarded as being significantly different in respect to decision-usefulness. Other
measurement concepts (mark-to-model fair value and value in use) are regarded as
significantly less decision-useful.
Mark-to-model based fair values are regarded as significantly less decision-useful than
market-based fair values and historical cost measures for practically all asset and
liability classes. Only for financial assets do respondents view mark-to-model measures
as more decision-useful than historical cost values.
These findings clearly suggest that professional investors neither view fair value
measurement as the overall leading measurement concept nor, which seems even more
important, do they see fair value as a homogenous measurement concept. While they
generally see market-based fair value as being (very) decision-useful, they rank mark-to-
model based fair values as the least decision-useful measurement concept. Respondents also
differentiate between different groups of assets and liabilities when assessing the decision-
usefulness of measurement concepts. These results should be helpful for standard setters
when rethinking the hierarchy of appropriate measurement concepts in phase C of the joint
framework project.
Like every research project these results come with some caveats attached to them.
Even though the selected research design constitutes an appropriate design choice for the
research question at hand, all survey studies suffer from both internal and external validity
concerns. For this study, internal validity might be questionable when the respondents failed
to understand the questions correctly or knowingly or unknowingly biased their answers
towards what they believed being the expected answer. Given that the results are based on a
survey sample drawn not-randomly from an unknown population, and that the response
sample suffers from a low response rate, the external validity of the results is also
questionable. Great care was taken to address these concerns in the best possible ways: The
population was limited to investors with sufficient interest in financial accounting, and
extensive sub-sample analyses as well as other robustness tests were performed to make sure
that the major results of this study are not driven by the specific sample under study. Thus,
the major results of this study seem fairly robust and representative for European
professional investors and their advisors with an interest in financial accounting matters.
22
References
AIMR (2000): AIMR Corporate Disclosure Survey.
Baker, H. Kent/Mukherjee, Tarun K. (2007): Survey research in finance: views from journal
editors, in: International Journal of Managerial Finance 3: 11-25.
Barker, Richard G. (1999): The role of dividends in valuation models used by analysts and
fund managers, in: European Accounting Review 8: 195-218.
CFO Institute (2007): A Comprehensive Business Reporting Model: Financial Reporting for
Investors.
Choy, Amy (2006): Fair Value as a Relevant Metric: A Theoretical Investigation, Working
Paper available on http://www.ssrn.com.
Ernst, Edgar/Gassen, Joachim/Pellens, Bernhard (2005): Verhalten und Präferenzen
deutscher Aktionäre, Studien des Deutschen Aktieninstituts Heft 29.
Elliot, W. Brooke /Hodge, Frank D./Kennedy, Jane/Pronk, Maarten (2007): Are MBA
students a Good Proxy for Nonprofessional Investors? The Accounting Review 82:
139-168.
Gohlke, Felicia/Schierek, Dirk,/Tunder, Ralph (2006): Durch Finanzanalysten wahrge-
nommene Qualität der Investor Relations deutscher Unternehmen, Working Paper No.
4/2006, EBS Östrich-Winkel.
Graham, John R./Harvey, Campbell R./Rajgopal, Shiva (2005): The economic implications
of corporate financial reporting, in: Journal of Accounting and Economics 40: 3-73.
Groves, Robert M./Fowler Jr., Floyd J./Couper, Mick P./Lepkowski, James M./Singer,
Eleanor/Tourangeau, Roger (2004): Survey Methodology, Hoboken, NJ.
Hodge, Frank D. (2003): Investors’ perceptions of earnings quality, auditor independence,
and the usefulness of audited financial information, in: Accounting Horizons 17
(Supplement): 37-48.
Hitz, Jörg-Markus (2007): The Decision Usefulness of Fair Value Accounting: A Theoretical
Perspective, in: European Accounting Review 16: 323-362.
Marten, Kai-Uwe/Schlereth, Dieter/Crampton, Adrian/Köhler, Annette G. (2002):
Rechnungslegung nach IAS Nutzeneffekte aus Sicht von Eigenkapitalgebern, in:
Betriebs-Berater 57: 2007-2012.
Neuhauser, Karyn L. (2007): Survey research in finance, in: International Journal of
Managerial Finance 3: 5-10.
Schulz, Michael (1999): Aktienmarketing: Eine empirische Untersuchung zu den
Informationsbedürfnissen deutscher Institutionellen Investoren und Analysten,
Sternfels.
Sills, Stephen J./Song, Chunyan (2002): Innovations in Survey Research: An Application of
Web-Based Surveys, in: Social Science Computer Review 20: 22-30.
PwC (2007): Measuring Assets and Liabilities: Investment Professionals’ Views.
Appendix A: Detailed response data
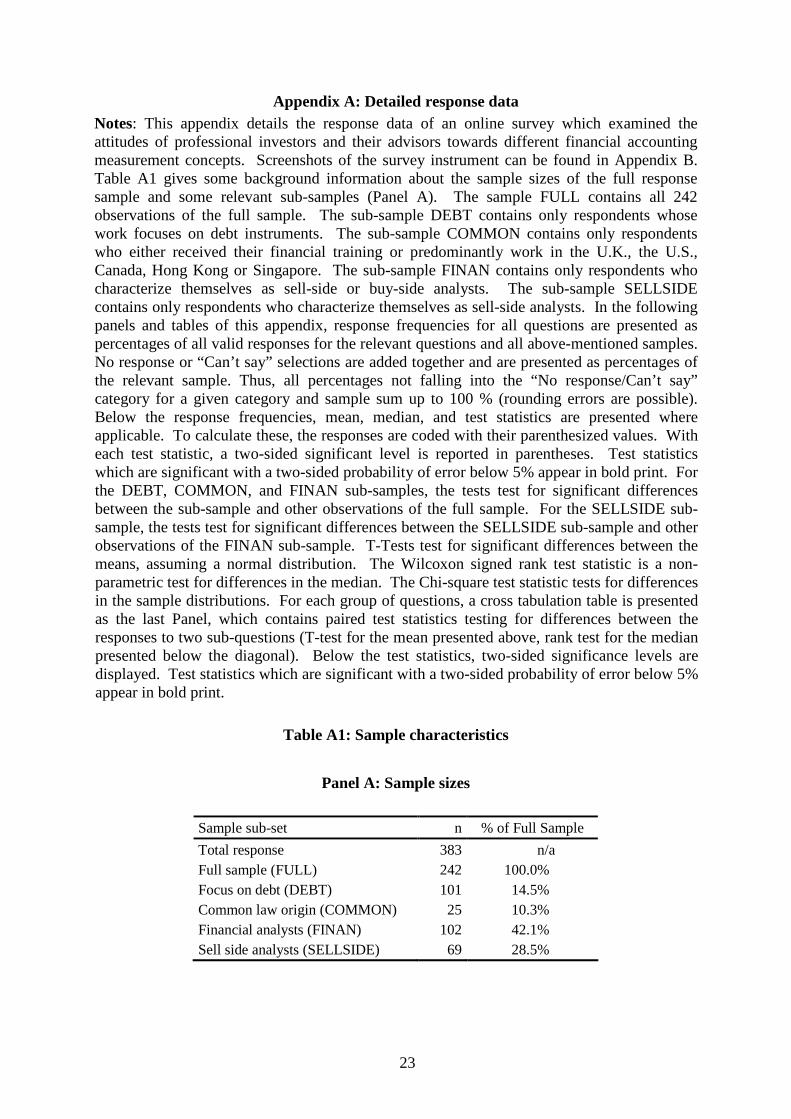
Notes: This appendix details the response data of an online survey which examined the attitudes of professional investors and their advisors towards different financial accounting measurement concepts. Screenshots of the survey instrument can be found in Appendix B. Table A1 gives some background information about the sample sizes of the full response sample and some relevant sub-samples (Panel A). The sample FULL contains all 242 observations of the full sample. The sub-sample DEBT contains only respondents whose work focuses on debt instruments. The sub-sample COMMON contains only respondents who either received their financial training or predominantly work in the U.K., the U.S., Canada, Hong Kong or Singapore. The sub-sample FINAN contains only respondents who characterize themselves as sell-side or buy-side analysts. The sub-sample SELLSIDE contains only respondents who characterize themselves as sell-side analysts. In the following panels and tables of this appendix, response frequencies for all questions are presented as percentages of all valid responses for the relevant questions and all above-mentioned samples. No response or “Can’t say” selections are added together and are presented as percentages of the relevant sample. Thus, all percentages not falling into the “No response/Can’t say” category for a given category and sample sum up to 100 % (rounding errors are possible). Below the response frequencies, mean, median, and test statistics are presented where applicable. To calculate these, the responses are coded with their parenthesized values. With each test statistic, a two-sided significant level is reported in parentheses. Test statistics which are significant with a two-sided probability of error below 5% appear in bold print. For the DEBT, COMMON, and FINAN sub-samples, the tests test for significant differences between the sub-sample and other observations of the full sample. For the SELLSIDE sub-sample, the tests test for significant differences between the SELLSIDE sub-sample and other observations of the FINAN sub-sample. T-Tests test for significant differences between the means, assuming a normal distribution. The Wilcoxon signed rank test statistic is a nonparametric test for differences in the median. The Chi-square test statistic tests for differences in the sample distributions. For each group of questions, a cross tabulation table is presented as the last Panel, which contains paired test statistics testing for differences between the responses to two sub-questions (T-test for the mean presented above, rank test for the median presented below the diagonal). Below the test statistics, two-sided significance levels are displayed. Test statistics which are significant with a two-sided probability of error below 5% appear in bold print.
Table A1: Sample characteristics
Panel A: Sample sizes
Sample sub-set n % of Full Sample
Total response 383 n/aFull sample (FULL) 242 100.0%Focus on debt (DEBT) 101 14.5%Common law origin (COMMON) 25 10.3%Financial analysts (FINAN) 102 42.1%Sell side analysts (SELLSIDE) 69 28.5%
23
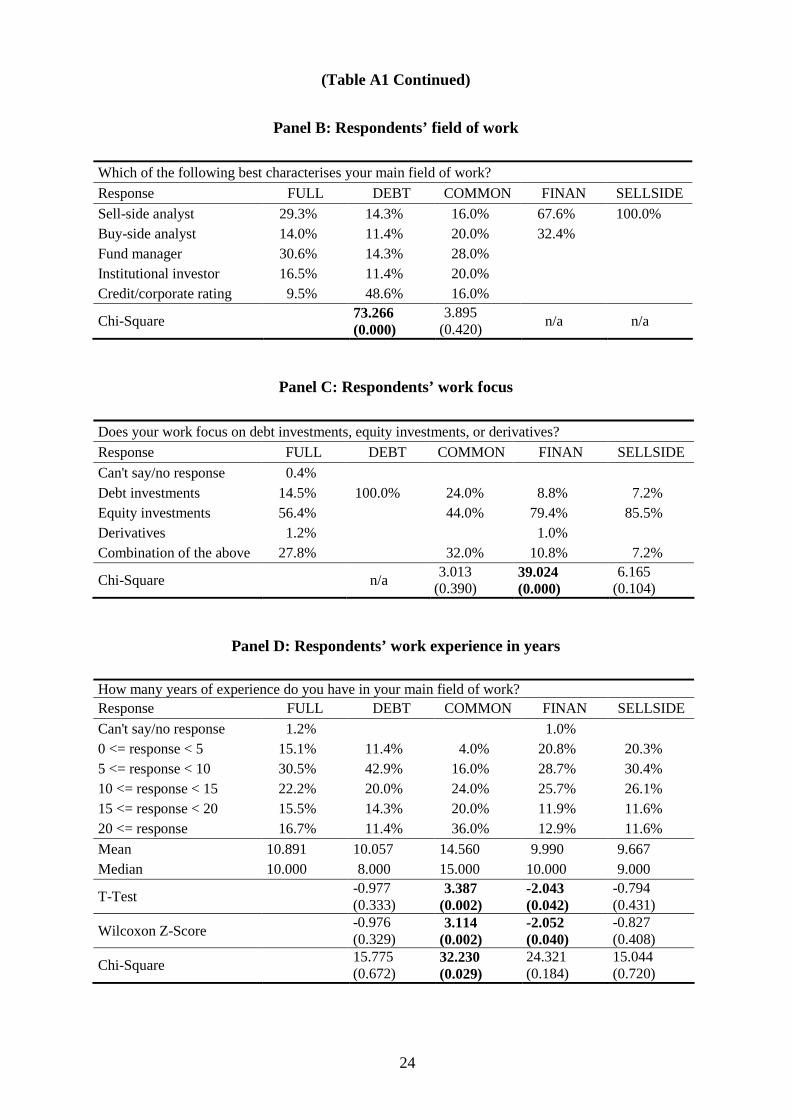
(Table A1 Continued)
Panel B: Respondents’ field of work
Which of the following best characterises your main field of work?
Response FULL DEBT COMMON FINAN SELLSIDE
Sell-side analyst 29.3% 14.3% 16.0% 67.6% 100.0%
Buy-side analyst 14.0% 11.4% 20.0% 32.4%
Fund manager 30.6% 14.3% 28.0%
Institutional investor 16.5% 11.4% 20.0%
Credit/corporate rating 9.5% 48.6% 16.0%
Chi-Square 73.266 (0.000)
3.895 (0.420)
n/a n/a
Panel C: Respondents’ work focus
Does your work focus on debt investments, equity investments, or derivatives?
Response FULL DEBT COMMON FINAN SELLSIDE
Can't say/no response 0.4%
Debt investments 14.5% 100.0% 24.0% 8.8% 7.2%
Equity investments 56.4% 44.0% 79.4% 85.5%
Derivatives 1.2% 1.0%
Combination of the above 27.8% 32.0% 10.8% 7.2%
Chi-Square n/a 3.013
(0.390) 39.024 (0.000)
6.165 (0.104)
Panel D: Respondents’ work experience in years
How many years of experience do you have in your main field of work?
Response FULL DEBT COMMON FINAN SELLSIDE
Can't say/no response 1.2% 1.0%
0 <= response < 5 15.1% 11.4% 4.0% 20.8% 20.3%
5 <= response < 10 30.5% 42.9% 16.0% 28.7% 30.4%
10 <= response < 15 22.2% 20.0% 24.0% 25.7% 26.1%
15 <= response < 20 15.5% 14.3% 20.0% 11.9% 11.6%
20 <= response 16.7% 11.4% 36.0% 12.9% 11.6%
Mean 10.891 10.057 14.560 9.990 9.667
Median 10.000 8.000 15.000 10.000 9.000
T-Test -0.977 (0.333)
3.387 (0.002)
-2.043 (0.042)
-0.794 (0.431)
-0.976 3.114 -2.052 -0.827 Wilcoxon Z-Score
(0.329) (0.408) (0.002) (0.040) 15.775 32.230 24.321 15.044
Chi-Square (0.672) (0.184) (0.720) (0.029)
24
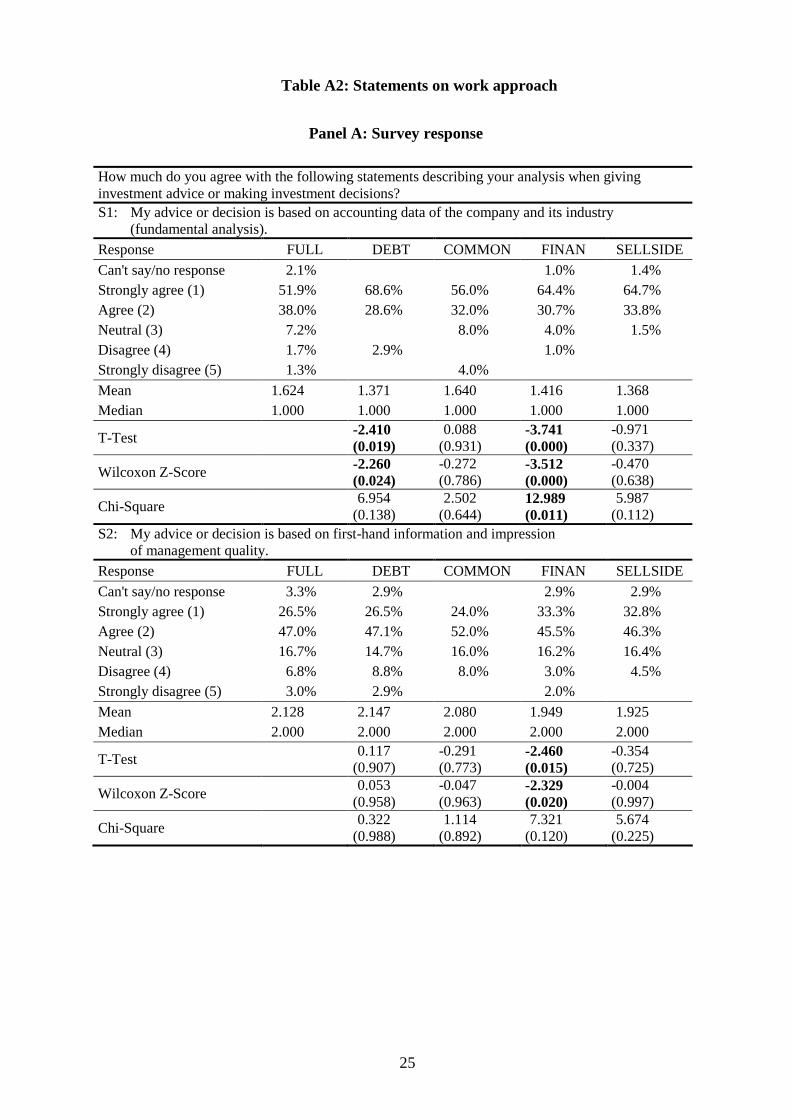
Table A2: Statements on work approach
Panel A: Survey response
How much do you agree with the following statements describing your analysis when giving investment advice or making investment decisions?
S1: My advice or decision is based on accounting data of the company and its industry (fundamental analysis).
Response FULL DEBT COMMON FINAN SELLSIDE
Can't say/no response 2.1% 1.0% 1.4%
Strongly agree (1) 51.9% 68.6% 56.0% 64.4% 64.7%
Agree (2) 38.0% 28.6% 32.0% 30.7% 33.8%
Neutral (3) 7.2% 8.0% 4.0% 1.5%
Disagree (4) 1.7% 2.9% 1.0%
Strongly disagree (5) 1.3% 4.0%
Mean 1.624 1.371 1.640 1.416 1.368
Median 1.000 1.000 1.000 1.000 1.000
T-Test -2.410 (0.019)
0.088 (0.931)
-3.741 (0.000)
-0.971 (0.337)
Wilcoxon Z-Score -2.260 (0.024)
-0.272 (0.786)
-3.512 (0.000)
-0.470 (0.638)
Chi-Square 6.954
(0.138) 2.502
(0.644) 12.989 (0.011)
5.987 (0.112)
S2: My advice or decision is based on first-hand information and impression of management quality.
Response FULL DEBT COMMON FINAN SELLSIDE
Can't say/no response 3.3% 2.9% 2.9% 2.9%
Strongly agree (1) 26.5% 26.5% 24.0% 33.3% 32.8%
Agree (2) 47.0% 47.1% 52.0% 45.5% 46.3%
Neutral (3) 16.7% 14.7% 16.0% 16.2% 16.4%
Disagree (4) 6.8% 8.8% 8.0% 3.0% 4.5%
Strongly disagree (5) 3.0% 2.9% 2.0%
Mean 2.128 2.147 2.080 1.949 1.925
Median 2.000 2.000 2.000 2.000 2.000
T-Test 0.117
(0.907) -0.291 (0.773)
-2.460 (0.015)
-0.354 (0.725)
Wilcoxon Z-Score 0.053
(0.958) -0.047 (0.963)
-2.329 (0.020)
-0.004 (0.997)
Chi-Square 0.322
(0.988) 1.114
(0.892) 7.321
(0.120) 5.674
(0.225)
25
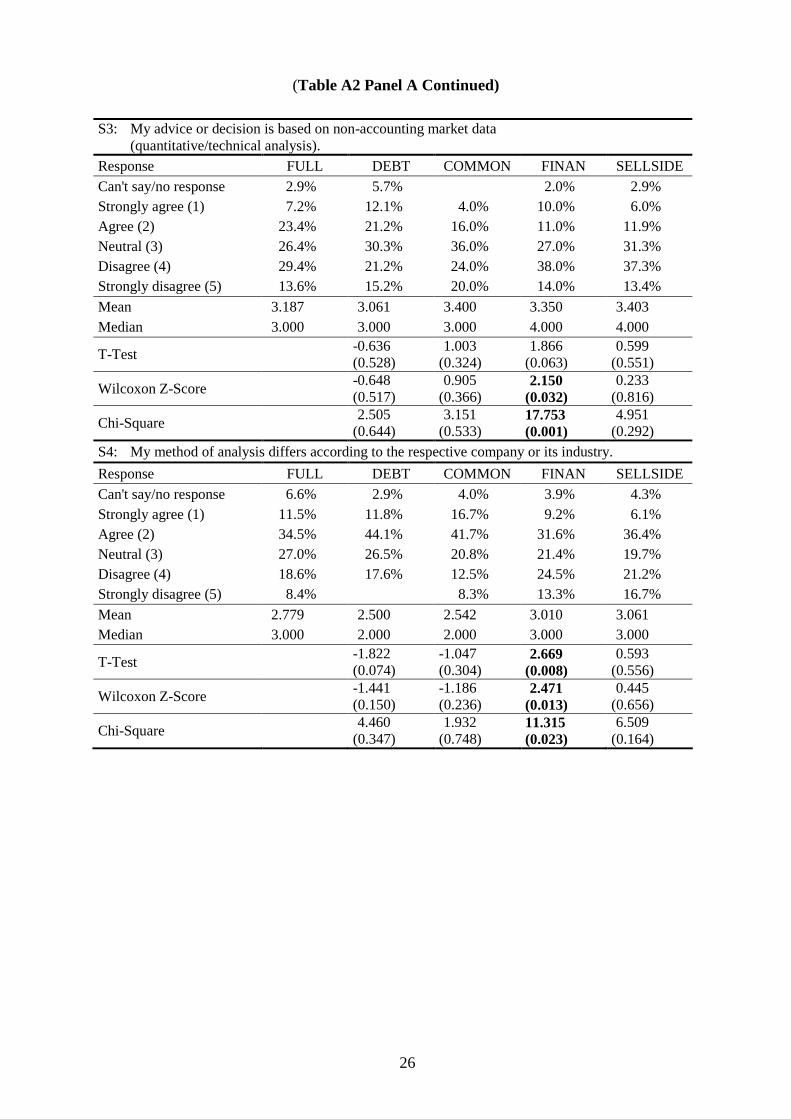
(Table A2 Panel A Continued)
S3: My advice or decision is based on non-accounting market data (quantitative/technical analysis).
Response FULL DEBT COMMON FINAN SELLSIDE
Can't say/no response 2.9% 5.7% 2.0% 2.9%
Strongly agree (1) 7.2% 12.1% 4.0% 10.0% 6.0%
Agree (2) 23.4% 21.2% 16.0% 11.0% 11.9%
Neutral (3) 26.4% 30.3% 36.0% 27.0% 31.3%
Disagree (4) 29.4% 21.2% 24.0% 38.0% 37.3%
Strongly disagree (5) 13.6% 15.2% 20.0% 14.0% 13.4%
Mean 3.187 3.061 3.400 3.350 3.403
Median 3.000 3.000 3.000 4.000 4.000
T-Test -0.636 (0.528)
1.003 (0.324)
1.866 (0.063)
0.599 (0.551)
Wilcoxon Z-Score -0.648 (0.517)
0.905 (0.366)
2.150 (0.032)
0.233 (0.816)
Chi-Square 2.505
(0.644) 3.151
(0.533) 17.753 (0.001)
4.951 (0.292)
S4: My method of analysis differs according to the respective company or its industry.
Response FULL DEBT COMMON FINAN SELLSIDE
Can't say/no response 6.6% 2.9% 4.0% 3.9% 4.3%
Strongly agree (1) 11.5% 11.8% 16.7% 9.2% 6.1%
Agree (2) 34.5% 44.1% 41.7% 31.6% 36.4%
Neutral (3) 27.0% 26.5% 20.8% 21.4% 19.7%
Disagree (4) 18.6% 17.6% 12.5% 24.5% 21.2%
Strongly disagree (5) 8.4% 8.3% 13.3% 16.7%
Mean 2.779 2.500 2.542 3.010 3.061
Median 3.000 2.000 2.000 3.000 3.000
T-Test -1.822 (0.074)
-1.047 (0.304)
2.669 (0.008)
0.593 (0.556)
Wilcoxon Z-Score -1.441 (0.150)
-1.186 (0.236)
2.471 (0.013)
0.445 (0.656)
Chi-Square 4.460
(0.347) 1.932
(0.748) 11.315 (0.023)
6.509 (0.164)
26
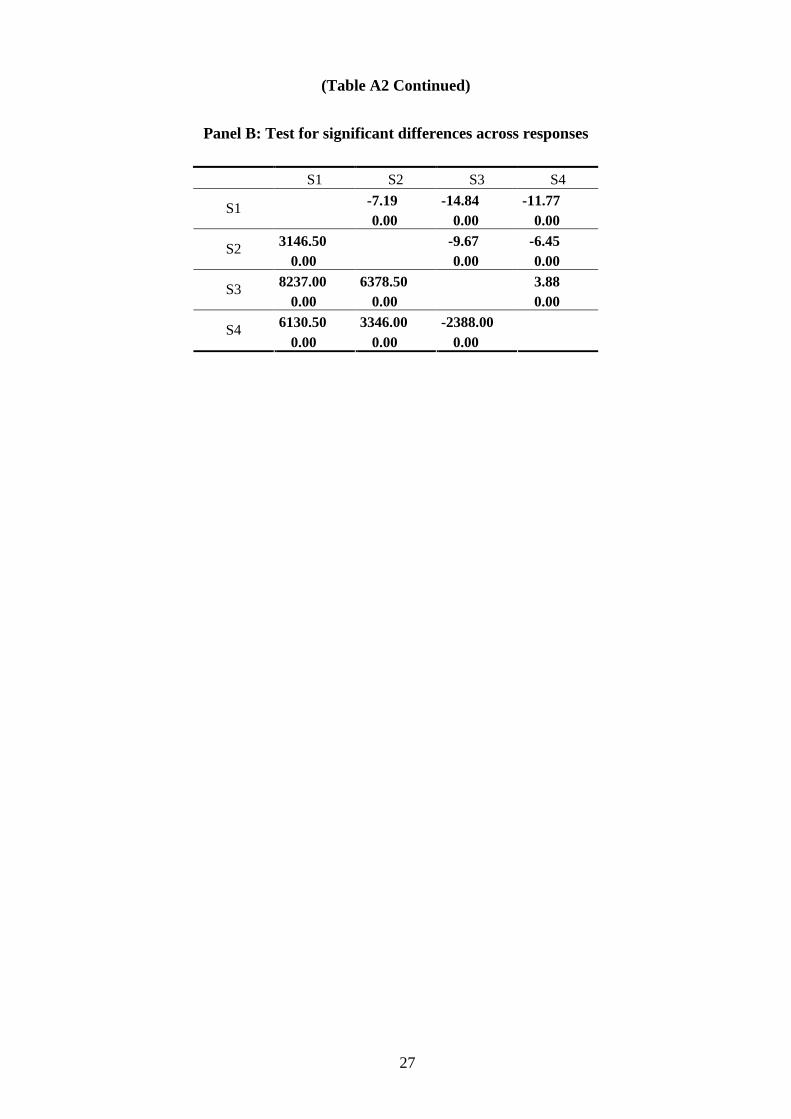
(Table A2 Continued)
Panel B: Test for significant differences across responses
S1 S2 S3 S4
S1 -7.19
0.00
-14.84
0.00
-11.77
0.00
S2 3146.50
0.00
-9.67
0.00
-6.45
0.00
S3 8237.00
0.00
6378.50
0.00
3.88
0.00
S4 6130.50
0.00
3346.00
0.00
-2388.00
0.00
27
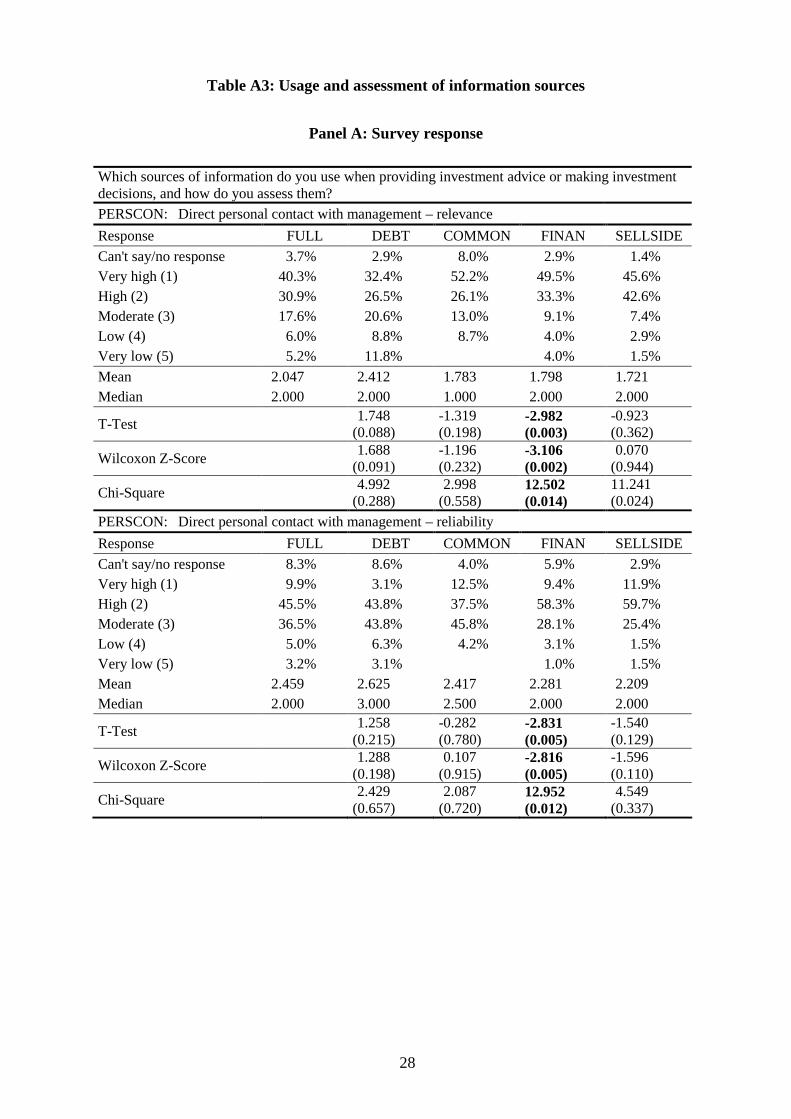
Table A3: Usage and assessment of information sources
Panel A: Survey response
Which sources of information do you use when providing investment advice or making investment decisions, and how do you assess them?
PERSCON: Direct personal contact with management – relevance
Response FULL DEBT COMMON FINAN SELLSIDE
Can't say/no response 3.7% 2.9% 8.0% 2.9% 1.4%
Very high (1) 40.3% 32.4% 52.2% 49.5% 45.6%
High (2) 30.9% 26.5% 26.1% 33.3% 42.6%
Moderate (3) 17.6% 20.6% 13.0% 9.1% 7.4%
Low (4) 6.0% 8.8% 8.7% 4.0% 2.9%
Very low (5) 5.2% 11.8% 4.0% 1.5%
Mean 2.047 2.412 1.783 1.798 1.721Median 2.000 2.000 1.000 2.000 2.000
1.748 -1.319 -2.982 -0.923 T-Test
(0.088) (0.198) (0.362) (0.003) 1.688 -1.196 -3.106 0.070
Wilcoxon Z-Score (0.091) (0.232) (0.944)
Chi-Square 4.992 2.998 12.502 11.241
(0.002)
(0.288) (0.558) (0.024)
PERSCON: Direct personal contact with management – reliability
(0.014)
Response FULL DEBT COMMON FINAN SELLSIDE
Can't say/no response 8.3% 8.6% 4.0% 5.9% 2.9%
Very high (1) 9.9% 3.1% 12.5% 9.4% 11.9%
High (2) 45.5% 43.8% 37.5% 58.3% 59.7%
Moderate (3) 36.5% 43.8% 45.8% 28.1% 25.4%
Low (4) 5.0% 6.3% 4.2% 3.1% 1.5%
Very low (5) 3.2% 3.1% 1.0% 1.5%
Mean 2.459 2.625 2.417 2.281 2.209
Median 2.000 3.000 2.500 2.000 2.000
1.258 -0.282 -2.831 -1.540 T-Test
(0.215) (0.780) (0.129) (0.005) 1.288 0.107 -2.816 -1.596
Wilcoxon Z-Score (0.198) (0.915) (0.110)
Chi-Square 2.429 2.087 12.952 4.549
(0.005)
(0.657) (0.720) (0.337) (0.012)
28
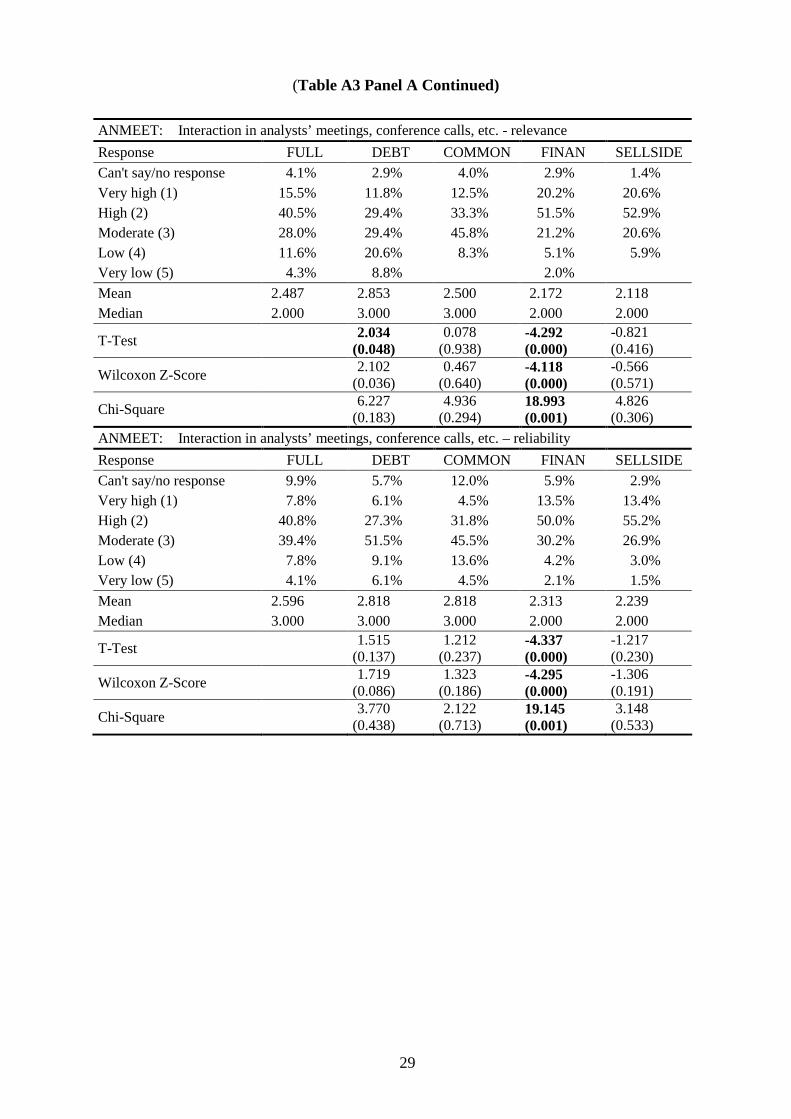
(Table A3 Panel A Continued)
ANMEET: Interaction in analysts’ meetings, conference calls, etc. - relevance
Response FULL DEBT COMMON FINAN SELLSIDE
Can't say/no response 4.1% 2.9% 4.0% 2.9% 1.4%
Very high (1) 15.5% 11.8% 12.5% 20.2% 20.6%
High (2) 40.5% 29.4% 33.3% 51.5% 52.9%
Moderate (3) 28.0% 29.4% 45.8% 21.2% 20.6%
Low (4) 11.6% 20.6% 8.3% 5.1% 5.9%
Very low (5) 4.3% 8.8% 2.0%
Mean 2.487 2.853 2.500 2.172 2.118
Median 2.000 3.000 3.000 2.000 2.000
T-Test 2.034
(0.048) 0.078
(0.938) -4.292 (0.000)
-0.821 (0.416)
Wilcoxon Z-Score 2.102
(0.036) 0.467
(0.640) -4.118 (0.000)
-0.566 (0.571)
Chi-Square 6.227
(0.183) 4.936
(0.294) 18.993 (0.001)
4.826 (0.306)
ANMEET: Interaction in analysts’ meetings, conference calls, etc. – reliability
Response FULL DEBT COMMON FINAN SELLSIDE
Can't say/no response 9.9% 5.7% 12.0% 5.9% 2.9%
Very high (1) 7.8% 6.1% 4.5% 13.5% 13.4%
High (2) 40.8% 27.3% 31.8% 50.0% 55.2%
Moderate (3) 39.4% 51.5% 45.5% 30.2% 26.9%
Low (4) 7.8% 9.1% 13.6% 4.2% 3.0%
Very low (5) 4.1% 6.1% 4.5% 2.1% 1.5%
Mean 2.596 2.818 2.818 2.313 2.239
Median 3.000 3.000 3.000 2.000 2.000
T-Test 1.515
(0.137) 1.212
(0.237) -4.337 (0.000)
-1.217 (0.230)
Wilcoxon Z-Score 1.719
(0.086) 1.323
(0.186) -4.295 (0.000)
-1.306 (0.191)
Chi-Square 3.770
(0.438) 2.122
(0.713) 19.145 (0.001)
3.148 (0.533)
29
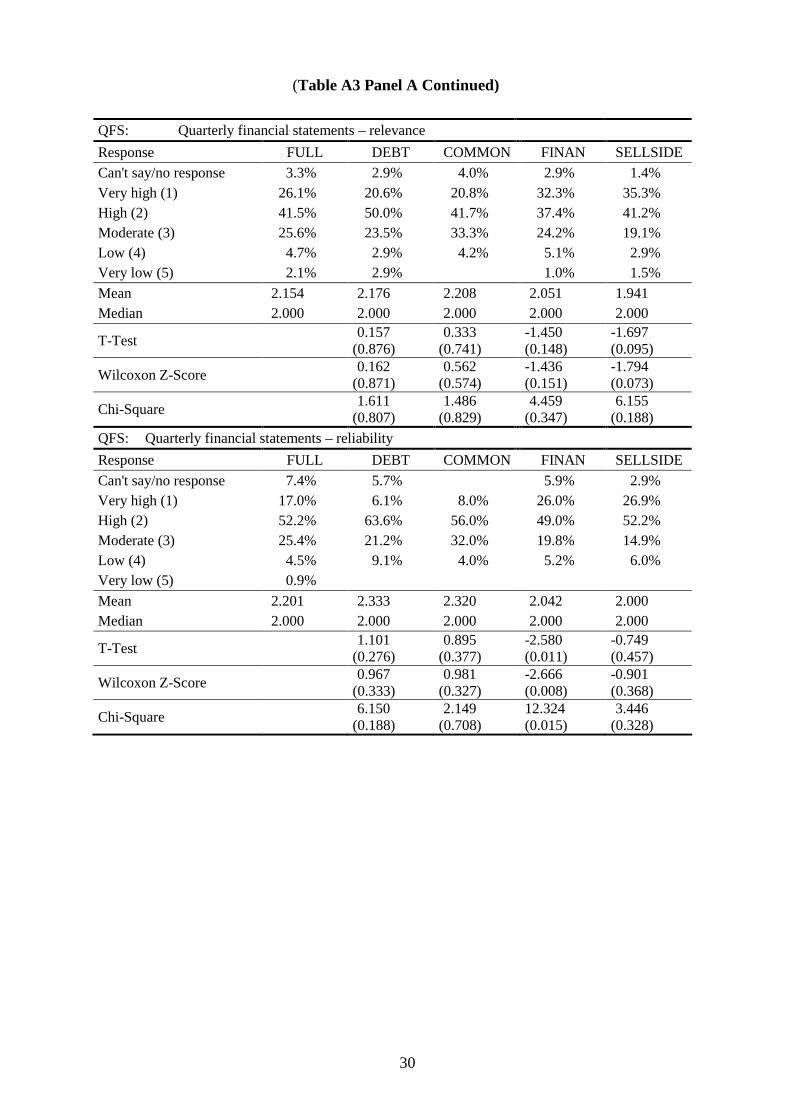
(Table A3 Panel A Continued)
QFS: Quarterly financial statements – relevance
Response FULL DEBT COMMON FINAN SELLSIDE
Can't say/no response 3.3% 2.9% 4.0% 2.9% 1.4%
Very high (1) 26.1% 20.6% 20.8% 32.3% 35.3%
High (2) 41.5% 50.0% 41.7% 37.4% 41.2%
Moderate (3) 25.6% 23.5% 33.3% 24.2% 19.1%
Low (4) 4.7% 2.9% 4.2% 5.1% 2.9%
Very low (5) 2.1% 2.9% 1.0% 1.5%
Mean 2.154 2.176 2.208 2.051 1.941
Median 2.000 2.000 2.000 2.000 2.000
T-Test 0.157
(0.876) 0.333
(0.741) -1.450 (0.148)
-1.697 (0.095)
Wilcoxon Z-Score 0.162
(0.871) 0.562
(0.574) -1.436 (0.151)
-1.794 (0.073)
Chi-Square 1.611
(0.807) 1.486
(0.829) 4.459
(0.347) 6.155
(0.188)
QFS: Quarterly financial statements – reliability
Response FULL DEBT COMMON FINAN SELLSIDE
Can't say/no response 7.4% 5.7% 5.9% 2.9%
Very high (1) 17.0% 6.1% 8.0% 26.0% 26.9%
High (2) 52.2% 63.6% 56.0% 49.0% 52.2%
Moderate (3) 25.4% 21.2% 32.0% 19.8% 14.9%
Low (4) 4.5% 9.1% 4.0% 5.2% 6.0%
Very low (5) 0.9%
Mean 2.201 2.333 2.320 2.042 2.000
Median 2.000 2.000 2.000 2.000 2.000
T-Test 1.101
(0.276) 0.895
(0.377) -2.580 (0.011)
-0.749 (0.457)
Wilcoxon Z-Score 0.967
(0.333) 0.981
(0.327) -2.666 (0.008)
-0.901 (0.368)
Chi-Square 6.150
(0.188) 2.149
(0.708) 12.324 (0.015)
3.446 (0.328)
30
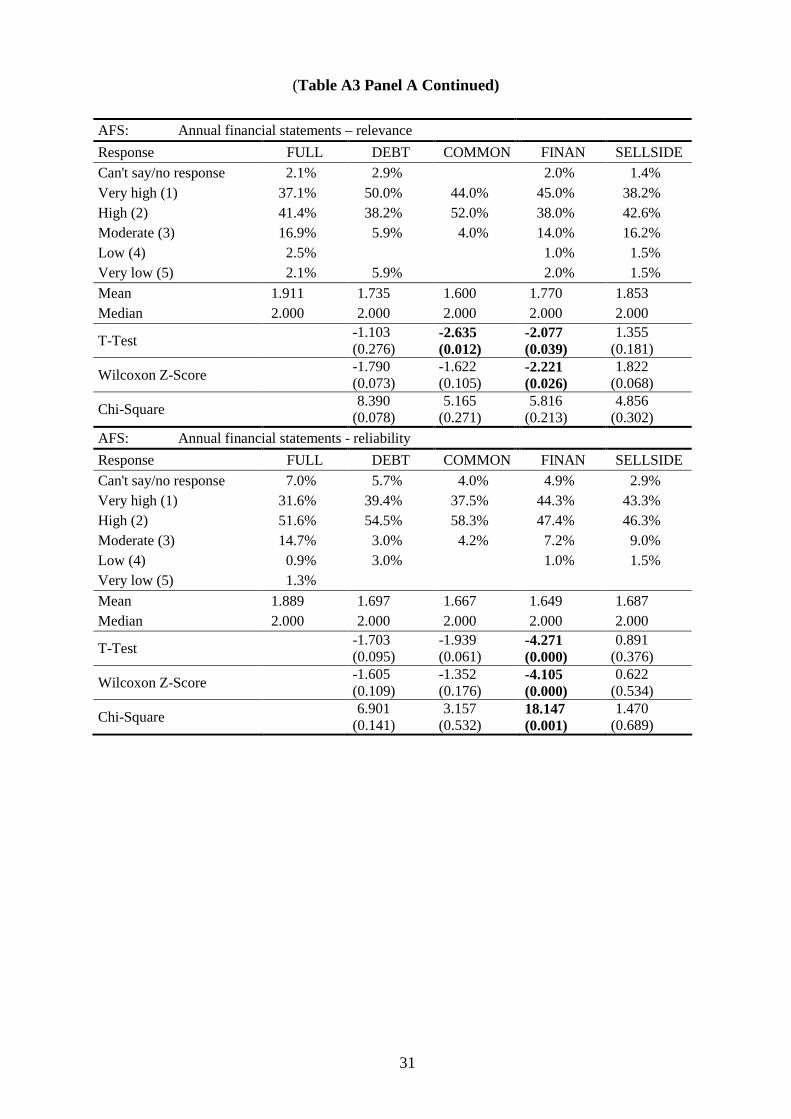
(Table A3 Panel A Continued)
AFS: Annual financial statements – relevance
Response FULL DEBT COMMON FINAN SELLSIDE
Can't say/no response 2.1% 2.9% 2.0% 1.4%
Very high (1) 37.1% 50.0% 44.0% 45.0% 38.2%
High (2) 41.4% 38.2% 52.0% 38.0% 42.6%
Moderate (3) 16.9% 5.9% 4.0% 14.0% 16.2%
Low (4) 2.5% 1.0% 1.5%
Very low (5) 2.1% 5.9% 2.0% 1.5%
Mean 1.911 1.735 1.600 1.770 1.853
Median 2.000 2.000 2.000 2.000 2.000
T-Test -1.103 (0.276)
-2.635 (0.012)
-2.077 (0.039)
1.355 (0.181)
Wilcoxon Z-Score -1.790 (0.073)
-1.622 (0.105)
-2.221 (0.026)
1.822 (0.068)
Chi-Square 8.390
(0.078) 5.165
(0.271) 5.816
(0.213) 4.856
(0.302)
AFS: Annual financial statements - reliability
Response FULL DEBT COMMON FINAN SELLSIDE
Can't say/no response 7.0% 5.7% 4.0% 4.9% 2.9%
Very high (1) 31.6% 39.4% 37.5% 44.3% 43.3%
High (2) 51.6% 54.5% 58.3% 47.4% 46.3%
Moderate (3) 14.7% 3.0% 4.2% 7.2% 9.0%
Low (4) 0.9% 3.0% 1.0% 1.5%
Very low (5) 1.3%
Mean 1.889 1.697 1.667 1.649 1.687
Median 2.000 2.000 2.000 2.000 2.000
T-Test -1.703 (0.095)
-1.939 (0.061)
-4.271 (0.000)
0.891 (0.376)
Wilcoxon Z-Score -1.605 (0.109)
-1.352 (0.176)
-4.105 (0.000)
0.622 (0.534)
Chi-Square 6.901
(0.141) 3.157
(0.532) 18.147 (0.001)
1.470 (0.689)
31
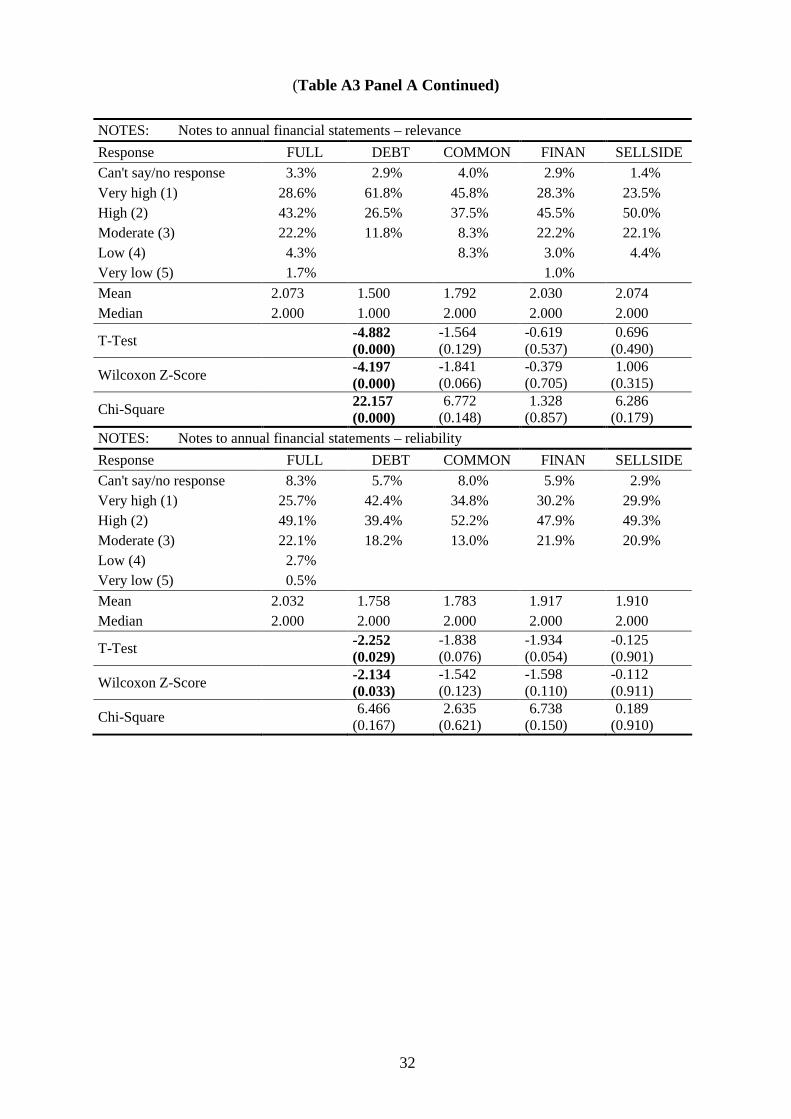
(Table A3 Panel A Continued)
NOTES: Notes to annual financial statements – relevance
Response FULL DEBT COMMON FINAN SELLSIDE
Can't say/no response 3.3% 2.9% 4.0% 2.9% 1.4%
Very high (1) 28.6% 61.8% 45.8% 28.3% 23.5%
High (2) 43.2% 26.5% 37.5% 45.5% 50.0%
Moderate (3) 22.2% 11.8% 8.3% 22.2% 22.1%
Low (4) 4.3% 8.3% 3.0% 4.4%
Very low (5) 1.7% 1.0%
Mean 2.073 1.500 1.792 2.030 2.074
Median 2.000 1.000 2.000 2.000 2.000
T-Test -4.882 (0.000)
-1.564 (0.129)
-0.619 (0.537)
0.696 (0.490)
Wilcoxon Z-Score -4.197 (0.000)
-1.841 (0.066)
-0.379 (0.705)
1.006 (0.315)
Chi-Square 22.157 (0.000)
6.772 (0.148)
1.328 (0.857)
6.286 (0.179)
NOTES: Notes to annual financial statements – reliability
Response FULL DEBT COMMON FINAN SELLSIDE
Can't say/no response 8.3% 5.7% 8.0% 5.9% 2.9%
Very high (1) 25.7% 42.4% 34.8% 30.2% 29.9%
High (2) 49.1% 39.4% 52.2% 47.9% 49.3%
Moderate (3) 22.1% 18.2% 13.0% 21.9% 20.9%
Low (4) 2.7%
Very low (5) 0.5%
Mean 2.032 1.758 1.783 1.917 1.910
Median 2.000 2.000 2.000 2.000 2.000
T-Test -2.252 (0.029)
-1.838 (0.076)
-1.934 (0.054)
-0.125 (0.901)
Wilcoxon Z-Score -2.134 (0.033)
-1.542 (0.123)
-1.598 (0.110)
-0.112 (0.911)
Chi-Square 6.466
(0.167) 2.635
(0.621) 6.738
(0.150) 0.189
(0.910)
32
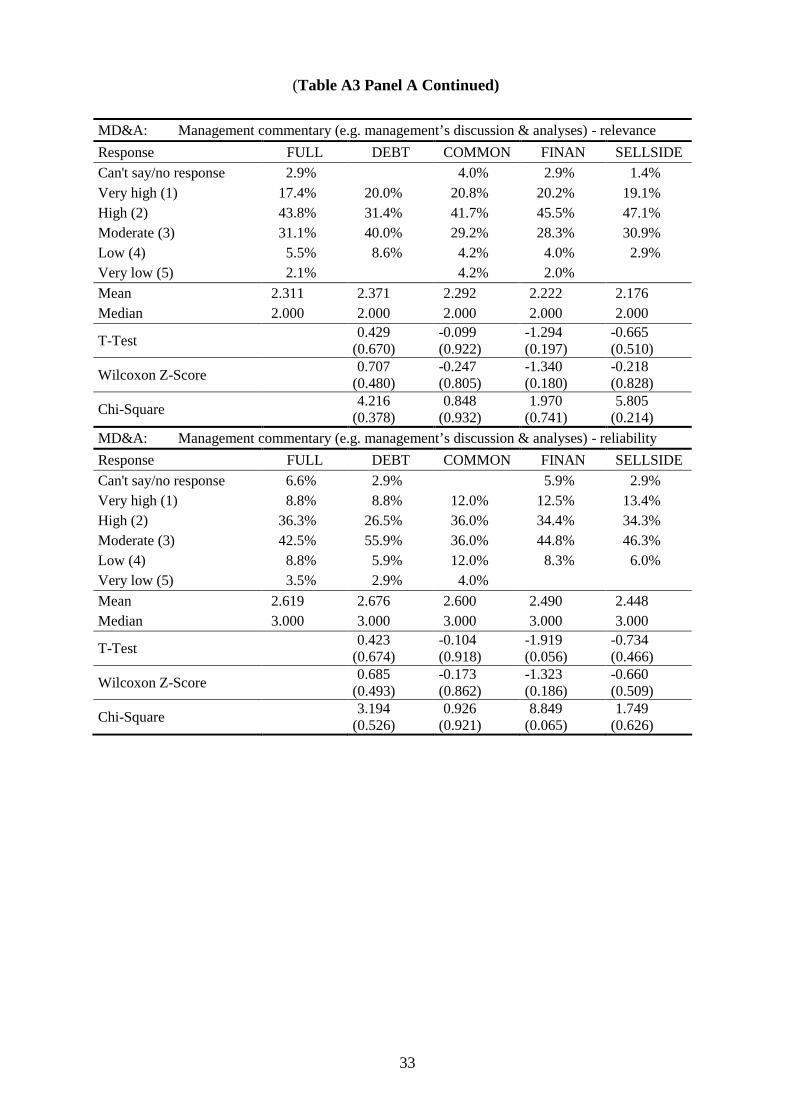
(Table A3 Panel A Continued)
MD&A: Management commentary (e.g. management’s discussion & analyses) - relevance
Response FULL DEBT COMMON FINAN SELLSIDE
Can't say/no response 2.9% 4.0% 2.9% 1.4%
Very high (1) 17.4% 20.0% 20.8% 20.2% 19.1%
High (2) 43.8% 31.4% 41.7% 45.5% 47.1%
Moderate (3) 31.1% 40.0% 29.2% 28.3% 30.9%
Low (4) 5.5% 8.6% 4.2% 4.0% 2.9%
Very low (5) 2.1% 4.2% 2.0%
Mean 2.311 2.371 2.292 2.222 2.176Median 2.000 2.000 2.000 2.000 2.000
0.429 -0.099 -1.294 -0.665 T-Test
(0.670) (0.922) (0.197) (0.510) 0.707 -0.247 -1.340 -0.218
Wilcoxon Z-Score (0.480) (0.805) (0.180) (0.828)
Chi-Square 4.216 0.848 1.970 5.805
(0.378) (0.932) (0.741) (0.214)
MD&A: Management commentary (e.g. management’s discussion & analyses) - reliability
Response FULL DEBT COMMON FINAN SELLSIDE
Can't say/no response 6.6% 2.9% 5.9% 2.9%
Very high (1) 8.8% 8.8% 12.0% 12.5% 13.4%
High (2) 36.3% 26.5% 36.0% 34.4% 34.3%
Moderate (3) 42.5% 55.9% 36.0% 44.8% 46.3%
Low (4) 8.8% 5.9% 12.0% 8.3% 6.0%
Very low (5) 3.5% 2.9% 4.0%
Mean 2.619 2.676 2.600 2.490 2.448
Median 3.000 3.000 3.000 3.000 3.000
T-Test 0.423
(0.674) -0.104 (0.918)
-1.919 (0.056)
-0.734 (0.466)
Wilcoxon Z-Score 0.685
(0.493) -0.173 (0.862)
-1.323 (0.186)
-0.660 (0.509)
Chi-Square 3.194
(0.526) 0.926
(0.921) 8.849
(0.065) 1.749
(0.626)
33
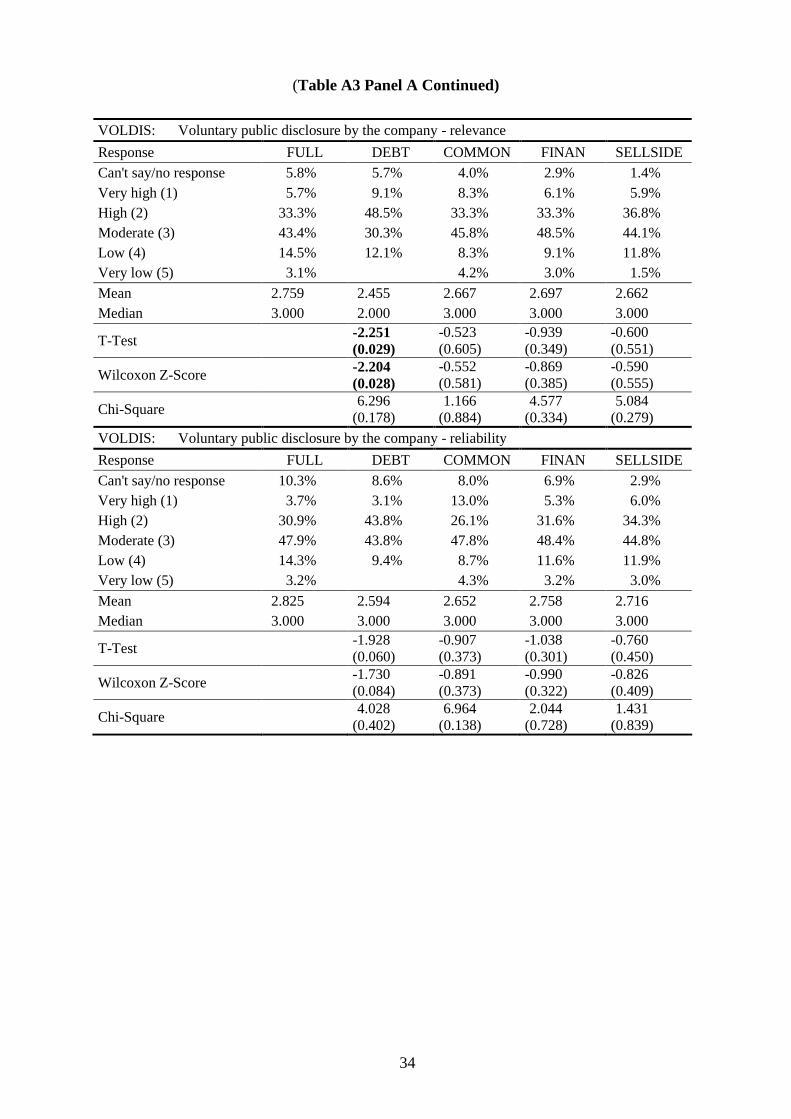
(Table A3 Panel A Continued)
VOLDIS: Voluntary public disclosure by the company - relevance
Response FULL DEBT COMMON FINAN SELLSIDE
Can't say/no response 5.8% 5.7% 4.0% 2.9% 1.4%
Very high (1) 5.7% 9.1% 8.3% 6.1% 5.9%
High (2) 33.3% 48.5% 33.3% 33.3% 36.8%
Moderate (3) 43.4% 30.3% 45.8% 48.5% 44.1%
Low (4) 14.5% 12.1% 8.3% 9.1% 11.8%
Very low (5) 3.1% 4.2% 3.0% 1.5%
Mean 2.759 2.455 2.667 2.697 2.662
Median 3.000 2.000 3.000 3.000 3.000
T-Test -2.251 (0.029)
-0.523 (0.605)
-0.939 (0.349)
-0.600 (0.551)
Wilcoxon Z-Score -2.204 (0.028)
-0.552 (0.581)
-0.869 (0.385)
-0.590 (0.555)
Chi-Square 6.296
(0.178) 1.166
(0.884) 4.577
(0.334) 5.084
(0.279)
VOLDIS: Voluntary public disclosure by the company - reliability
Response FULL DEBT COMMON FINAN SELLSIDE
Can't say/no response 10.3% 8.6% 8.0% 6.9% 2.9%
Very high (1) 3.7% 3.1% 13.0% 5.3% 6.0%
High (2) 30.9% 43.8% 26.1% 31.6% 34.3%
Moderate (3) 47.9% 43.8% 47.8% 48.4% 44.8%
Low (4) 14.3% 9.4% 8.7% 11.6% 11.9%
Very low (5) 3.2% 4.3% 3.2% 3.0%
Mean 2.825 2.594 2.652 2.758 2.716
Median 3.000 3.000 3.000 3.000 3.000
T-Test -1.928 (0.060)
-0.907 (0.373)
-1.038 (0.301)
-0.760 (0.450)
Wilcoxon Z-Score -1.730 (0.084)
-0.891 (0.373)
-0.990 (0.322)
-0.826 (0.409)
Chi-Square 4.028
(0.402) 6.964
(0.138) 2.044
(0.728) 1.431
(0.839)
34
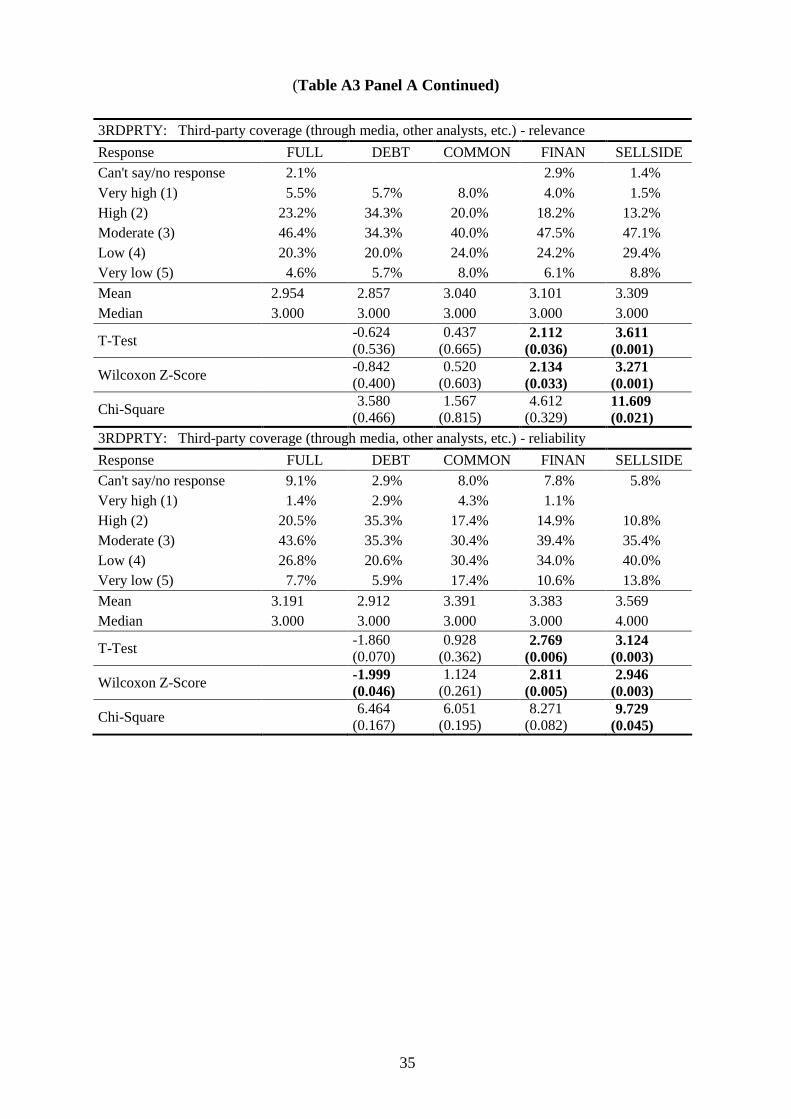
(Table A3 Panel A Continued)
3RDPRTY: Third-party coverage (through media, other analysts, etc.) - relevance
Response FULL DEBT COMMON FINAN SELLSIDE
Can't say/no response 2.1% 2.9% 1.4%
Very high (1) 5.5% 5.7% 8.0% 4.0% 1.5%
High (2) 23.2% 34.3% 20.0% 18.2% 13.2%
Moderate (3) 46.4% 34.3% 40.0% 47.5% 47.1%
Low (4) 20.3% 20.0% 24.0% 24.2% 29.4%
Very low (5) 4.6% 5.7% 8.0% 6.1% 8.8%
Mean 2.954 2.857 3.040 3.101 3.309
Median 3.000 3.000 3.000 3.000 3.000
T-Test -0.624 (0.536)
0.437 (0.665)
2.112 (0.036)
3.611 (0.001)
Wilcoxon Z-Score -0.842 (0.400)
0.520 (0.603)
2.134 (0.033)
3.271 (0.001)
Chi-Square 3.580
(0.466) 1.567
(0.815) 4.612
(0.329) 11.609 (0.021)
3RDPRTY: Third-party coverage (through media, other analysts, etc.) - reliability
Response FULL DEBT COMMON FINAN SELLSIDE
Can't say/no response 9.1% 2.9% 8.0% 7.8% 5.8%
Very high (1) 1.4% 2.9% 4.3% 1.1%
High (2) 20.5% 35.3% 17.4% 14.9% 10.8%
Moderate (3) 43.6% 35.3% 30.4% 39.4% 35.4%
Low (4) 26.8% 20.6% 30.4% 34.0% 40.0%
Very low (5) 7.7% 5.9% 17.4% 10.6% 13.8%
Mean 3.191 2.912 3.391 3.383 3.569
Median 3.000 3.000 3.000 3.000 4.000
T-Test -1.860 (0.070)
0.928 (0.362)
2.769 (0.006)
3.124 (0.003)
Wilcoxon Z-Score -1.999 (0.046)
1.124 (0.261)
2.811 (0.005)
2.946 (0.003)
Chi-Square 6.464
(0.167) 6.051
(0.195) 8.271
(0.082) 9.729
(0.045)
35
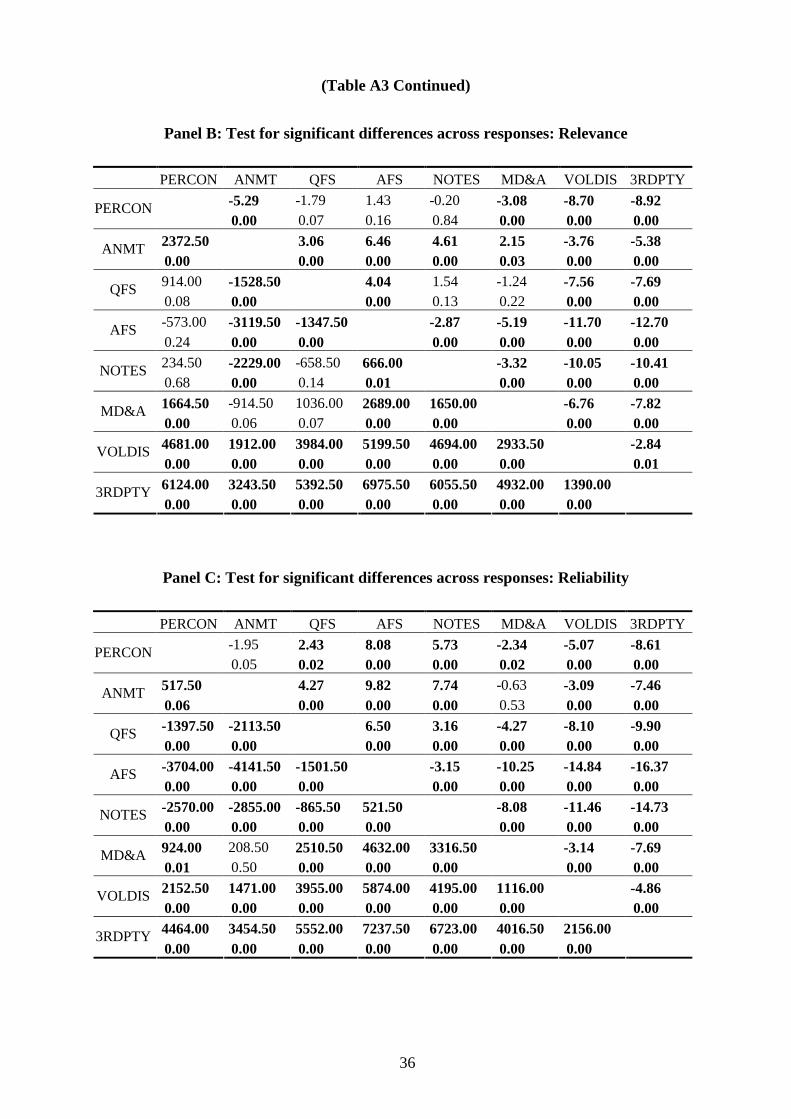
(Table A3 Continued)
Panel B: Test for significant differences across responses: Relevance
PERCON ANMT QFS AFS NOTES MD&A VOLDIS 3RDPTY
PERCON -5.29
0.00
-1.79
0.07
1.43
0.16
-0.20
0.84
-3.08
0.00
-8.70
0.00
-8.92
0.00
ANMT 2372.50
0.00
3.06
0.00
6.46
0.00
4.61
0.00
2.15
0.03
-3.76
0.00
-5.38
0.00
QFS 914.00
0.08
-1528.50
0.00
4.04
0.00
1.54
0.13
-1.24
0.22
-7.56
0.00
-7.69
0.00
AFS -573.00
0.24
-3119.50
0.00
-1347.50
0.00
-2.87
0.00
-5.19
0.00
-11.70
0.00
-12.70
0.00
NOTES 234.50
0.68
-2229.00
0.00
-658.50
0.14
666.00
0.01
-3.32
0.00
-10.05
0.00
-10.41
0.00
MD&A 1664.50
0.00
-914.50
0.06
1036.00
0.07
2689.00
0.00
1650.00
0.00
-6.76
0.00
-7.82
0.00
VOLDIS 4681.00
0.00
1912.00
0.00
3984.00
0.00
5199.50
0.00
4694.00
0.00
2933.50
0.00
-2.84
0.01
6124.00 3243.50 5392.50 6975.50 6055.50 4932.00 1390.003RDPTY
0.00 0.00 0.00 0.00 0.00 0.00 0.00
Panel C: Test for significant differences across responses: Reliability
PERCON ANMT QFS AFS NOTES MD&A VOLDIS 3RDPTY
PERCON -1.95
0.05
2.43
0.02
8.08
0.00
5.73
0.00
-2.34
0.02
-5.07
0.00
-8.61
0.00
ANMT 517.50 4.27 9.82 7.74 -0.63 -3.09 -7.46
0.06 0.00 0.00 0.00 0.53 0.00 0.00
QFS -1397.50
0.00
-2113.50
0.00
6.50
0.00
3.16
0.00
-4.27
0.00
-8.10
0.00
-9.90
0.00
AFS -3704.00 -4141.50 -1501.50 -3.15 -10.25 -14.84 -16.37
0.00 0.00 0.00 0.00 0.00 0.00 0.00
NOTES -2570.00 -2855.00 -865.50 521.50 -8.08 -11.46 -14.73
0.00 0.00 0.00 0.00 0.00 0.00 0.00
MD&A 924.00
0.01
208.50
0.50
2510.50
0.00
4632.00
0.00
3316.50
0.00
-3.14
0.00
-7.69
0.00
VOLDIS 2152.50 1471.00 3955.00 5874.00 4195.00 1116.00 -4.86
0.00 0.00 0.00 0.00 0.00 0.00 0.00
3RDPTY 4464.00 3454.50 5552.00 7237.50 6723.00 4016.50 2156.00
0.00 0.00 0.00 0.00 0.00 0.00 0.00
36
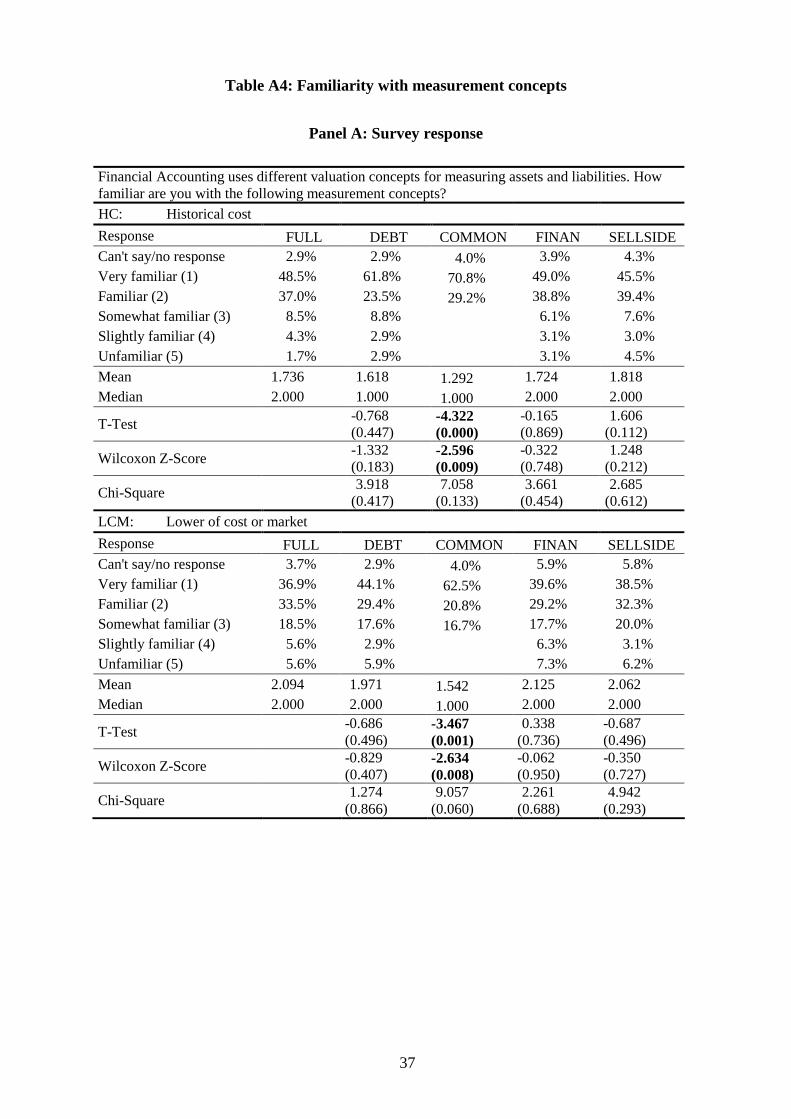
Table A4: Familiarity with measurement concepts
Panel A: Survey response
Financial Accounting uses different valuation concepts for measuring assets and liabilities. How familiar are you with the following measurement concepts?
HC: Historical cost
Response FULL DEBT COMMON FINAN SELLSIDE
Can't say/no response 2.9% 2.9% 4.0% 3.9% 4.3%
Very familiar (1) 48.5% 61.8% 70.8% 49.0% 45.5%
Familiar (2) 37.0% 23.5% 29.2% 38.8% 39.4%
Somewhat familiar (3) 8.5% 8.8% 6.1% 7.6%
Slightly familiar (4) 4.3% 2.9% 3.1% 3.0%
Unfamiliar (5) 1.7% 2.9% 3.1% 4.5%
Mean 1.736 1.618 1.292 1.724 1.818Median 2.000 1.000 1.000 2.000 2.000
-0.768 -4.322 -0.165 1.606T-Test
(0.447) (0.869) (0.112) -1.332 -2.596 -0.322 1.248
(0.000)
Wilcoxon Z-Score (0.183) (0.748) (0.212) (0.009) 3.918 7.058 3.661 2.685
Chi-Square (0.417) (0.454) (0.133) (0.612)
LCM: Lower of cost or market
Response FULL DEBT COMMON FINAN SELLSIDE
Can't say/no response 3.7% 2.9% 4.0% 5.9% 5.8%
Very familiar (1) 36.9% 44.1% 62.5% 39.6% 38.5%
Familiar (2) 33.5% 29.4% 20.8% 29.2% 32.3%
Somewhat familiar (3) 18.5% 17.6% 16.7% 17.7% 20.0%
Slightly familiar (4) 5.6% 2.9% 6.3% 3.1%
Unfamiliar (5) 5.6% 5.9% 7.3% 6.2%
Mean 2.094 1.971 1.542 2.125 2.062Median 2.000 2.000 1.000 2.000 2.000
-0.686 -3.467 0.338 -0.687 T-Test
(0.496) (0.736) (0.496) -0.829 -2.634 -0.062 -0.350
(0.001)
Wilcoxon Z-Score (0.407) (0.950) (0.727)
Chi-Square 1.274 9.057 2.261 4.942
(0.008)
(0.866) (0.060) (0.688) (0.293)
37
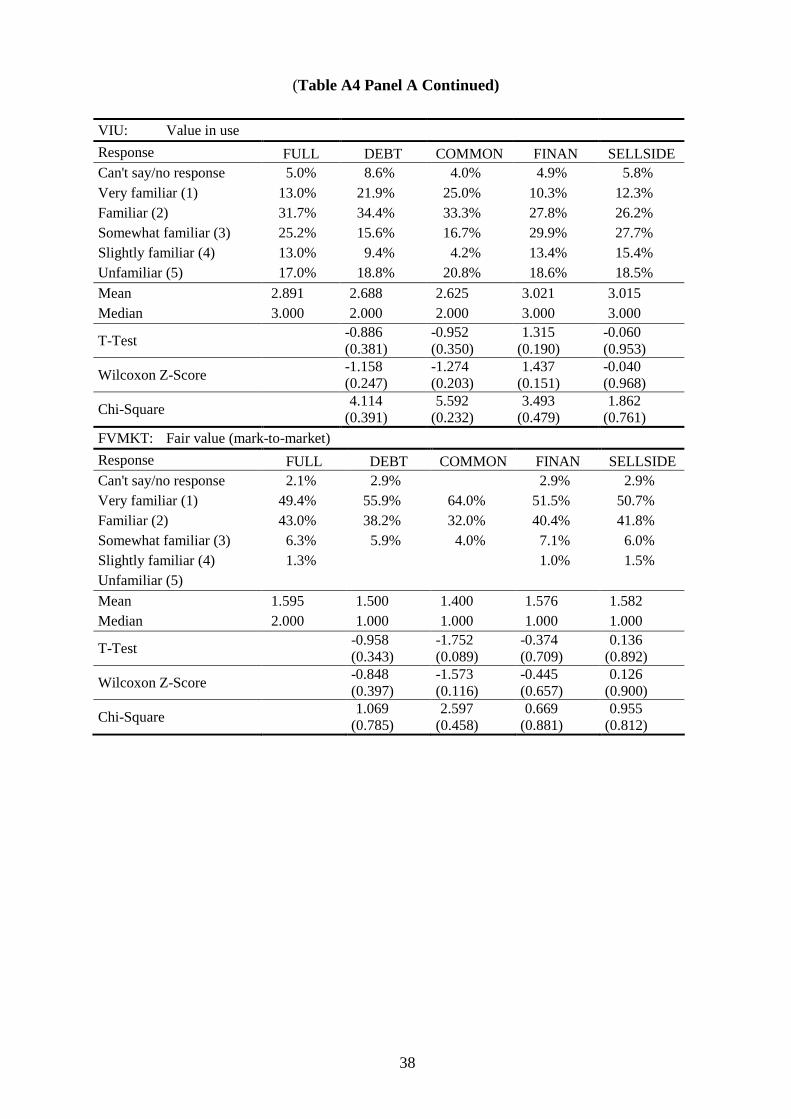
(Table A4 Panel A Continued)
VIU: Value in use
Response FULL DEBT COMMON FINAN SELLSIDE
Can't say/no response 5.0% 8.6% 4.0% 4.9% 5.8%
Very familiar (1) 13.0% 21.9% 25.0% 10.3% 12.3%
Familiar (2) 31.7% 34.4% 33.3% 27.8% 26.2%
Somewhat familiar (3) 25.2% 15.6% 16.7% 29.9% 27.7%
Slightly familiar (4) 13.0% 9.4% 4.2% 13.4% 15.4%
Unfamiliar (5) 17.0% 18.8% 20.8% 18.6% 18.5%
Mean 2.891 2.688 2.625 3.021 3.015
Median 3.000 2.000 2.000 3.000 3.000
T-Test -0.886 (0.381)
-0.952 (0.350)
1.315 (0.190)
-0.060 (0.953)
Wilcoxon Z-Score -1.158 (0.247)
-1.274 (0.203)
1.437 (0.151)
-0.040 (0.968)
Chi-Square 4.114
(0.391) 5.592
(0.232) 3.493
(0.479) 1.862
(0.761)
FVMKT: Fair value (mark-to-market)
Response FULL DEBT COMMON FINAN SELLSIDE
Can't say/no response 2.1% 2.9% 2.9% 2.9%
Very familiar (1) 49.4% 55.9% 64.0% 51.5% 50.7%
Familiar (2) 43.0% 38.2% 32.0% 40.4% 41.8%
Somewhat familiar (3) 6.3% 5.9% 4.0% 7.1% 6.0%
Slightly familiar (4) 1.3% 1.0% 1.5%
Unfamiliar (5)
Mean 1.595 1.500 1.400 1.576 1.582
Median 2.000 1.000 1.000 1.000 1.000
T-Test -0.958 (0.343)
-1.752 (0.089)
-0.374 (0.709)
0.136 (0.892)
Wilcoxon Z-Score -0.848 (0.397)
-1.573 (0.116)
-0.445 (0.657)
0.126 (0.900)
Chi-Square 1.069
(0.785) 2.597
(0.458) 0.669
(0.881) 0.955
(0.812)
38
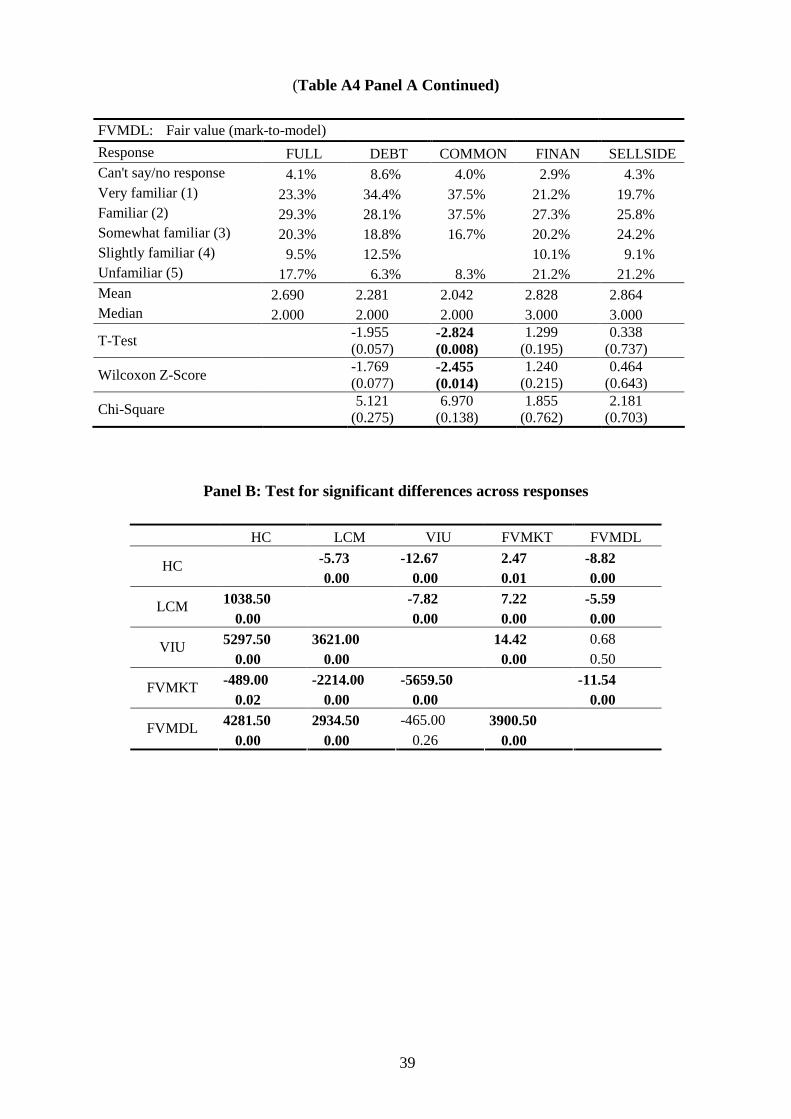
(Table A4 Panel A Continued)
FVMDL: Fair value (mark-to-model)
Response FULL DEBT COMMON FINAN SELLSIDE
Can't say/no response 4.1% 8.6% 4.0% 2.9% 4.3%
Very familiar (1) 23.3% 34.4% 37.5% 21.2% 19.7%
Familiar (2) 29.3% 28.1% 37.5% 27.3% 25.8%
Somewhat familiar (3) 20.3% 18.8% 16.7% 20.2% 24.2%
Slightly familiar (4) 9.5% 12.5% 10.1% 9.1%
Unfamiliar (5) 17.7% 6.3% 8.3% 21.2% 21.2%
Mean 2.690 2.281 2.042 2.828 2.864Median 2.000 2.000 2.000 3.000 3.000
-1.955 -2.824 1.299 0.338T-Test
(0.057) (0.195) (0.737) -1.769 -2.455 1.240 0.464
(0.008)
Wilcoxon Z-Score (0.077) (0.215) (0.643) (0.014) 5.121 6.970 1.855 2.181
Chi-Square (0.275) (0.762) (0.138) (0.703)
Panel B: Test for significant differences across responses
HC LCM VIU FVMKT FVMDL
-5.73 -12.67 2.47 -8.82 HC
0.00 0.00 0.01 0.00
1038.50 -7.82 7.22 -5.59 LCM
0.00 0.00 0.00 0.00
5297.50 3621.00 14.42 0.68VIU
0.00 0.00 0.00 0.50
-489.00 -2214.00 -5659.50 -11.54 FVMKT
0.02 0.00 0.00 0.00
4281.50 2934.50 -465.00 3900.50FVMDL
0.00 0.00 0.26 0.00
39
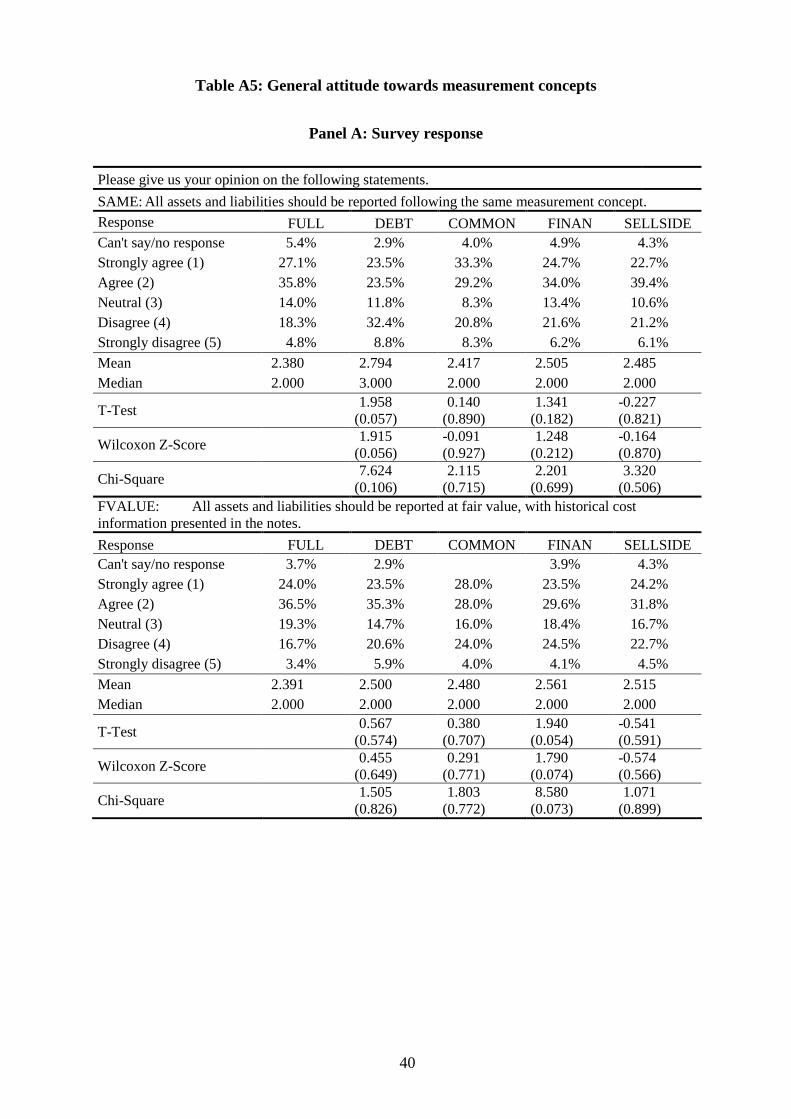
Table A5: General attitude towards measurement concepts
Panel A: Survey response
Please give us your opinion on the following statements.
SAME: All assets and liabilities should be reported following the same measurement concept.Response FULL DEBT COMMON FINAN SELLSIDECan't say/no response 5.4% 2.9% 4.0% 4.9% 4.3%
Strongly agree (1) 27.1% 23.5% 33.3% 24.7% 22.7%
Agree (2) 35.8% 23.5% 29.2% 34.0% 39.4%
Neutral (3) 14.0% 11.8% 8.3% 13.4% 10.6%
Disagree (4) 18.3% 32.4% 20.8% 21.6% 21.2%
Strongly disagree (5) 4.8% 8.8% 8.3% 6.2% 6.1%
Mean 2.380 2.794 2.417 2.505 2.485Median 2.000 3.000 2.000 2.000 2.000
1.958 0.140 1.341 -0.227 T-Test
(0.057) (0.890) (0.182) (0.821) 1.915 -0.091 1.248 -0.164
Wilcoxon Z-Score (0.056) (0.927) (0.212) (0.870) 7.624 2.115 2.201 3.320
Chi-Square (0.106) (0.699) (0.715) (0.506)
FVALUE: All assets and liabilities should be reported at fair value, with historical cost information presented in the notes.
Response FULL DEBT COMMON FINAN SELLSIDE
Can't say/no response 3.7% 2.9% 3.9% 4.3%
Strongly agree (1) 24.0% 23.5% 28.0% 23.5% 24.2%
Agree (2) 36.5% 35.3% 28.0% 29.6% 31.8%
Neutral (3) 19.3% 14.7% 16.0% 18.4% 16.7%
Disagree (4) 16.7% 20.6% 24.0% 24.5% 22.7%
Strongly disagree (5) 3.4% 5.9% 4.0% 4.1% 4.5%
Mean 2.391 2.500 2.480 2.561 2.515
Median 2.000 2.000 2.000 2.000 2.000
T-Test
Wilcoxon Z-Score
Chi-Square
0.567 (0.574) 0.455
(0.649) 1.505
(0.826)
0.380 (0.707) 0.291
(0.771) 1.803
(0.772)
1.940 (0.054) 1.790
(0.074) 8.580
(0.073)
-0.541 (0.591) -0.574 (0.566) 1.071
(0.899)
40
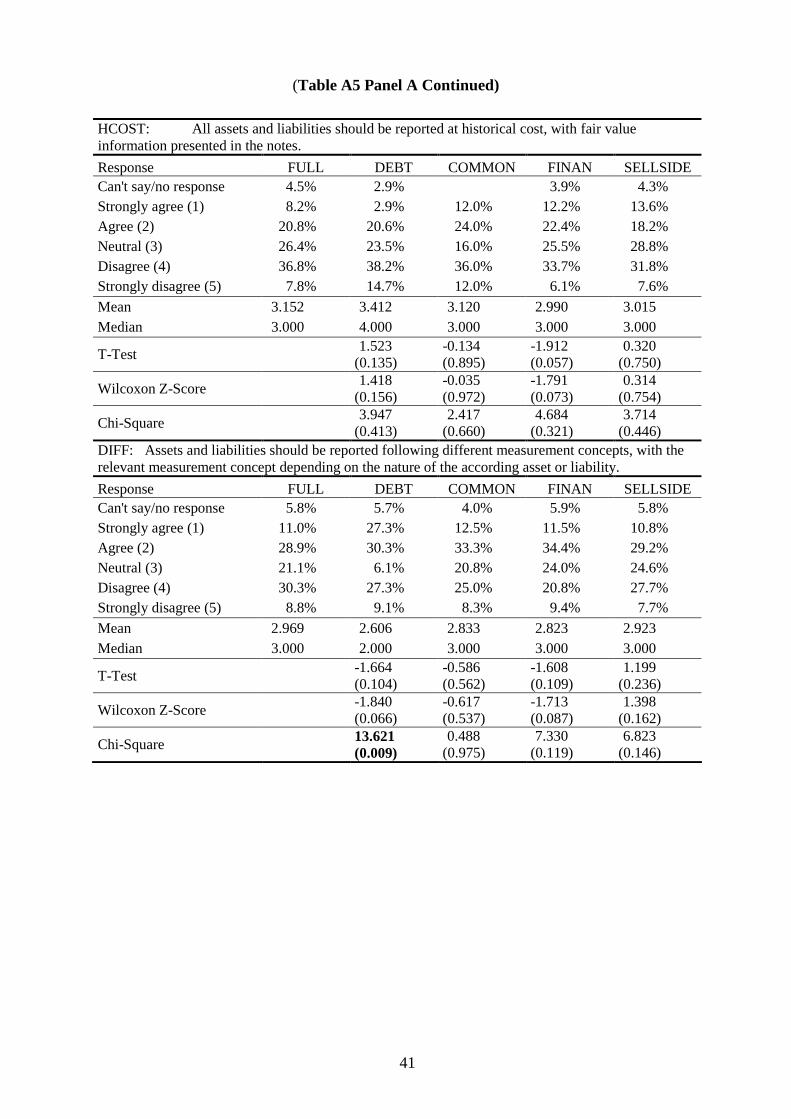
(Table A5 Panel A Continued)
HCOST: All assets and liabilities should be reported at historical cost, with fair value information presented in the notes.
Response FULL DEBT COMMON FINAN SELLSIDE
Can't say/no response 4.5% 2.9% 3.9% 4.3%
Strongly agree (1) 8.2% 2.9% 12.0% 12.2% 13.6%
Agree (2) 20.8% 20.6% 24.0% 22.4% 18.2%
Neutral (3) 26.4% 23.5% 16.0% 25.5% 28.8%
Disagree (4) 36.8% 38.2% 36.0% 33.7% 31.8%
Strongly disagree (5) 7.8% 14.7% 12.0% 6.1% 7.6%
Mean 3.152 3.412 3.120 2.990 3.015Median 3.000 4.000 3.000 3.000 3.000
1.523 -0.134 -1.912 0.320T-Test
(0.135) (0.895) (0.057) (0.750) 1.418 -0.035 -1.791 0.314
Wilcoxon Z-Score (0.156) (0.972) (0.073) (0.754) 3.947 2.417 4.684 3.714
Chi-Square (0.413) (0.321) (0.660) (0.446)
DIFF: Assets and liabilities should be reported following different measurement concepts, with the relevant measurement concept depending on the nature of the according asset or liability.
Response FULL DEBT COMMON FINAN SELLSIDE
Can't say/no response 5.8% 5.7% 4.0% 5.9% 5.8%
Strongly agree (1) 11.0% 27.3% 12.5% 11.5% 10.8%
Agree (2) 28.9% 30.3% 33.3% 34.4% 29.2%
Neutral (3) 21.1% 6.1% 20.8% 24.0% 24.6%
Disagree (4) 30.3% 27.3% 25.0% 20.8% 27.7%
Strongly disagree (5) 8.8% 9.1% 8.3% 9.4% 7.7%
Mean 2.969 2.606 2.833 2.823 2.923
Median 3.000 2.000 3.000 3.000 3.000
T-Test
Wilcoxon Z-Score
Chi-Square
-1.664 (0.104) -1.840 (0.066) 13.621 (0.009)
-0.586 (0.562) -0.617 (0.537) 0.488
(0.975)
-1.608 (0.109) -1.713 (0.087) 7.330
(0.119)
1.199 (0.236) 1.398
(0.162) 6.823
(0.146)
41
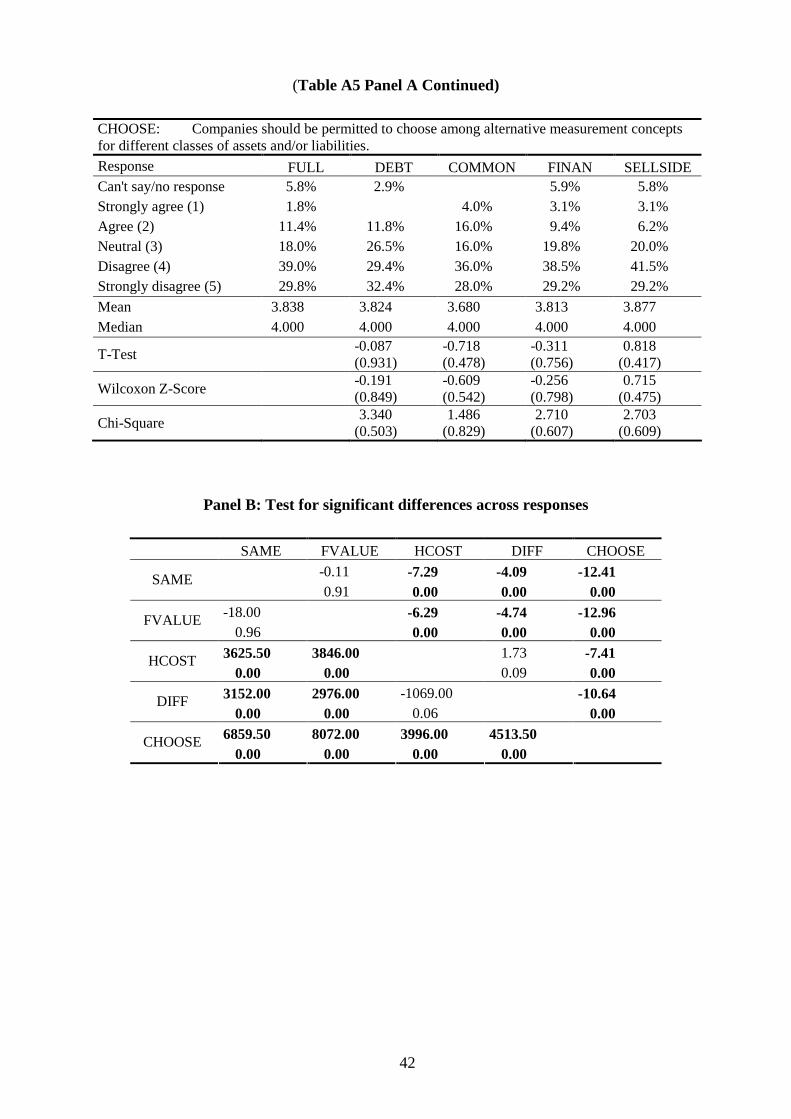
(Table A5 Panel A Continued)
CHOOSE: Companies should be permitted to choose among alternative measurement concepts for different classes of assets and/or liabilities.
Response FULL DEBT COMMON FINAN SELLSIDE
Can't say/no response 5.8% 2.9% 5.9% 5.8%
Strongly agree (1) 1.8% 4.0% 3.1% 3.1%
Agree (2) 11.4% 11.8% 16.0% 9.4% 6.2%
Neutral (3) 18.0% 26.5% 16.0% 19.8% 20.0%
Disagree (4) 39.0% 29.4% 36.0% 38.5% 41.5%
Strongly disagree (5) 29.8% 32.4% 28.0% 29.2% 29.2%
Mean 3.838 3.824 3.680 3.813 3.877Median 4.000 4.000 4.000 4.000 4.000
-0.087 -0.718 -0.311 0.818 T-Test
(0.931) (0.478) (0.756) (0.417) -0.191 -0.609 -0.256 0.715
Wilcoxon Z-Score (0.849) (0.542) (0.798) (0.475) 3.340 1.486 2.710 2.703
Chi-Square (0.503) (0.607) (0.829) (0.609)
Panel B: Test for significant differences across responses
SAME FVALUE HCOST DIFF CHOOSE
-0.11 -7.29 -4.09 -12.41 SAME
0.91 0.00 0.00 0.00
-18.00 -6.29 -4.74 -12.96 FVALUE
0.96 0.00 0.00 0.00
3625.50 3846.00 1.73 -7.41 HCOST
0.00 0.00 0.09 0.00
3152.00 2976.00 -1069.00 -10.64 DIFF
0.00 0.00 0.06 0.00
6859.50 8072.00 3996.00 4513.50CHOOSE
0.00 0.00 0.00 0.00
42
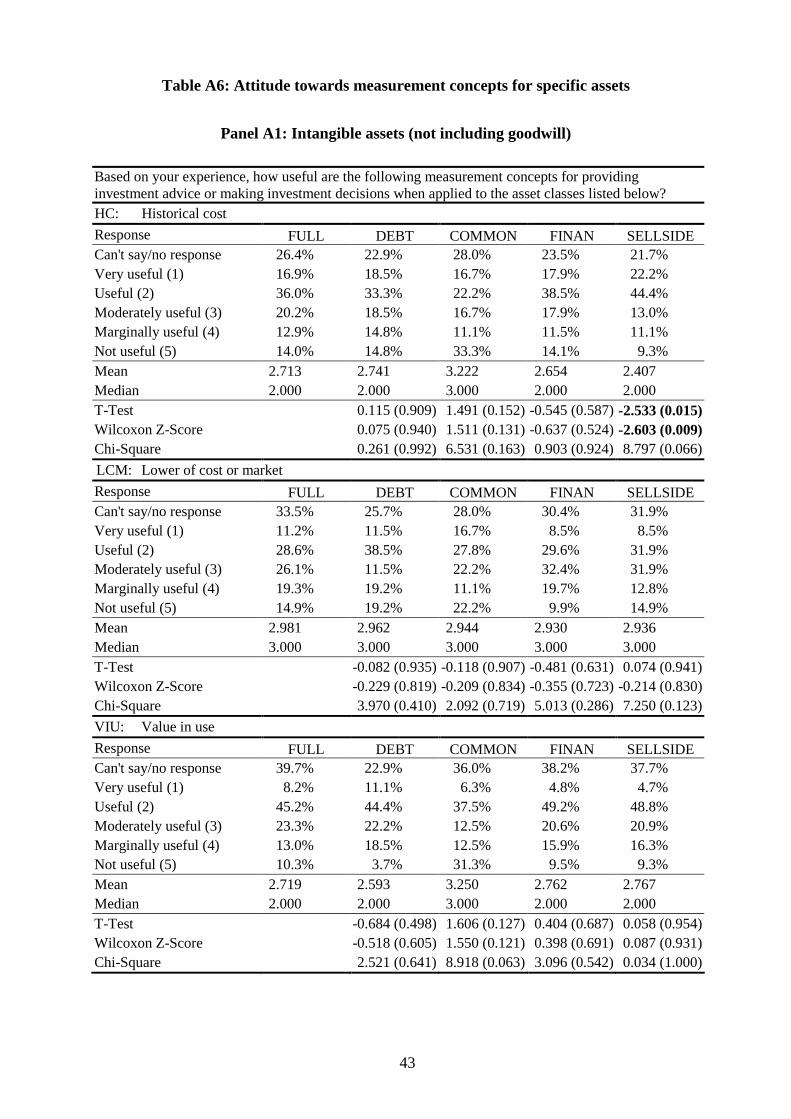
Table A6: Attitude towards measurement concepts for specific assets
Panel A1: Intangible assets (not including goodwill)
Based on your experience, how useful are the following measurement concepts for providing investment advice or making investment decisions when applied to the asset classes listed below?
HC: Historical cost
Response FULL DEBT COMMON FINAN SELLSIDE
Can't say/no response 26.4% 22.9% 28.0% 23.5% 21.7%
Very useful (1) 16.9% 18.5% 16.7% 17.9% 22.2%
Useful (2) 36.0% 33.3% 22.2% 38.5% 44.4%
Moderately useful (3) 20.2% 18.5% 16.7% 17.9% 13.0%
Marginally useful (4) 12.9% 14.8% 11.1% 11.5% 11.1%
Not useful (5) 14.0% 14.8% 33.3% 14.1% 9.3%
Mean 2.713 2.741 3.222 2.654 2.407
Median 2.000 2.000 3.000 2.000 2.000
T-Test 0.115 (0.909) 1.491 (0.152) -0.545 (0.587) -2.533 (0.015)
Wilcoxon Z-Score 0.075 (0.940) 1.511 (0.131) -0.637 (0.524) -2.603 (0.009)
Chi-Square 0.261 (0.992) 6.531 (0.163) 0.903 (0.924) 8.797 (0.066)
LCM: Lower of cost or market
Response FULL DEBT COMMON FINAN SELLSIDE
Can't say/no response 33.5% 25.7% 28.0% 30.4% 31.9%
Very useful (1) 11.2% 11.5% 16.7% 8.5% 8.5%
Useful (2) 28.6% 38.5% 27.8% 29.6% 31.9%
Moderately useful (3) 26.1% 11.5% 22.2% 32.4% 31.9%
Marginally useful (4) 19.3% 19.2% 11.1% 19.7% 12.8%
Not useful (5) 14.9% 19.2% 22.2% 9.9% 14.9%
Mean 2.981 2.962 2.944 2.930 2.936
Median 3.000 3.000 3.000 3.000 3.000
T-Test -0.082 (0.935) -0.118 (0.907) -0.481 (0.631) 0.074 (0.941)
Wilcoxon Z-Score -0.229 (0.819) -0.209 (0.834) -0.355 (0.723) -0.214 (0.830)
Chi-Square 3.970 (0.410) 2.092 (0.719) 5.013 (0.286) 7.250 (0.123)
VIU: Value in use
Response FULL DEBT COMMON FINAN SELLSIDE
Can't say/no response 39.7% 22.9% 36.0% 38.2% 37.7%
Very useful (1) 8.2% 11.1% 6.3% 4.8% 4.7%
Useful (2) 45.2% 44.4% 37.5% 49.2% 48.8%
Moderately useful (3) 23.3% 22.2% 12.5% 20.6% 20.9%
Marginally useful (4) 13.0% 18.5% 12.5% 15.9% 16.3%
Not useful (5) 10.3% 3.7% 31.3% 9.5% 9.3%
Mean 2.719 2.593 3.250 2.762 2.767
Median 2.000 2.000 3.000 2.000 2.000
T-Test -0.684 (0.498) 1.606 (0.127) 0.404 (0.687) 0.058 (0.954)
Wilcoxon Z-Score -0.518 (0.605) 1.550 (0.121) 0.398 (0.691) 0.087 (0.931)
Chi-Square 2.521 (0.641) 8.918 (0.063) 3.096 (0.542) 0.034 (1.000)
43
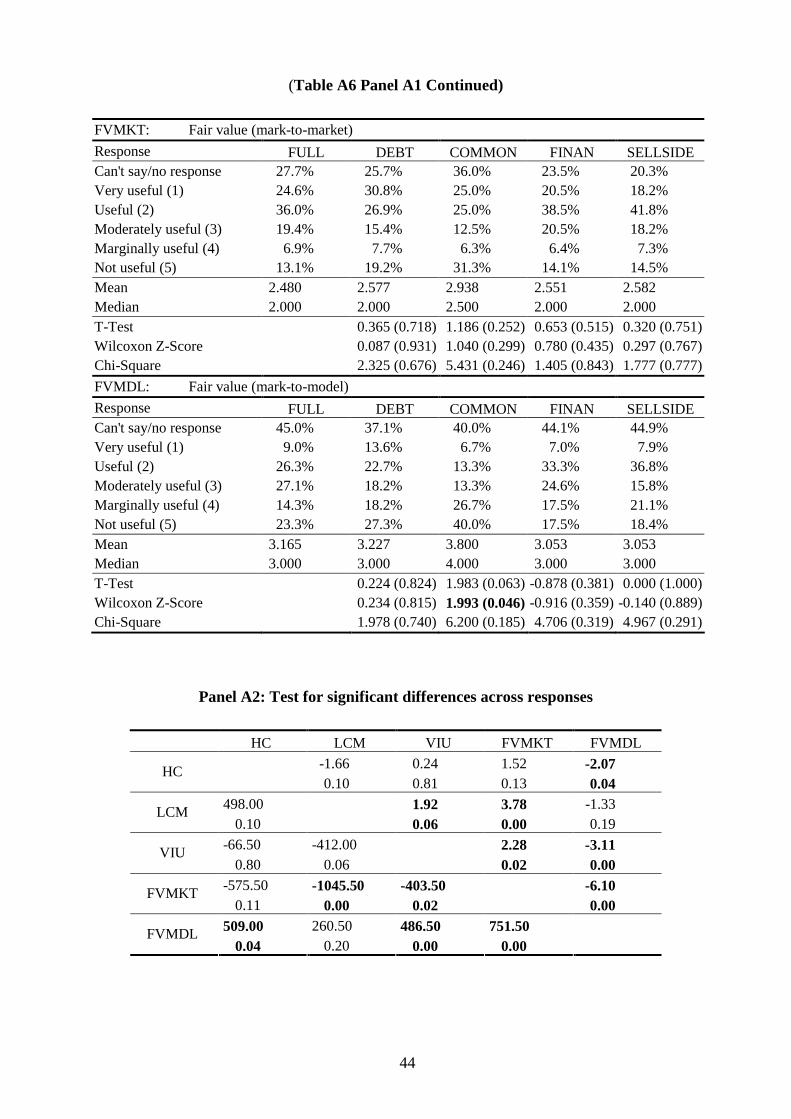
(Table A6 Panel A1 Continued)
FVMKT: Fair value (mark-to-market)
Response FULL DEBT COMMON FINAN SELLSIDE
Can't say/no response 27.7% 25.7% 36.0% 23.5% 20.3%
Very useful (1) 24.6% 30.8% 25.0% 20.5% 18.2%
Useful (2) 36.0% 26.9% 25.0% 38.5% 41.8%
Moderately useful (3) 19.4% 15.4% 12.5% 20.5% 18.2%
Marginally useful (4) 6.9% 7.7% 6.3% 6.4% 7.3%
Not useful (5) 13.1% 19.2% 31.3% 14.1% 14.5%
Mean 2.480 2.577 2.938 2.551 2.582
Median 2.000 2.000 2.500 2.000 2.000
T-Test 0.365 (0.718) 1.186 (0.252) 0.653 (0.515) 0.320 (0.751)
Wilcoxon Z-Score 0.087 (0.931) 1.040 (0.299) 0.780 (0.435) 0.297 (0.767)
Chi-Square 2.325 (0.676) 5.431 (0.246) 1.405 (0.843) 1.777 (0.777)
FVMDL: Fair value (mark-to-model)
Response FULL DEBT COMMON FINAN SELLSIDE
Can't say/no response 45.0% 37.1% 40.0% 44.1% 44.9%
Very useful (1) 9.0% 13.6% 6.7% 7.0% 7.9%
Useful (2) 26.3% 22.7% 13.3% 33.3% 36.8%
Moderately useful (3) 27.1% 18.2% 13.3% 24.6% 15.8%
Marginally useful (4) 14.3% 18.2% 26.7% 17.5% 21.1%
Not useful (5) 23.3% 27.3% 40.0% 17.5% 18.4%
Mean 3.165 3.227 3.800 3.053 3.053
Median 3.000 3.000 4.000 3.000 3.000
T-Test 0.224 (0.824) 1.983 (0.063) -0.878 (0.381) 0.000 (1.000)
Wilcoxon Z-Score 0.234 (0.815) 1.993 (0.046) -0.916 (0.359) -0.140 (0.889)
Chi-Square 1.978 (0.740) 6.200 (0.185) 4.706 (0.319) 4.967 (0.291)
Panel A2: Test for significant differences across responses
HC LCM VIU FVMKT FVMDL
HC -1.66
0.10
0.24
0.81
1.52
0.13
-2.07
0.04
LCM 498.00
0.10
1.92
0.06
3.78
0.00
-1.33
0.19
VIU -66.50 -412.00 2.28 -3.11
0.80 0.06 0.02 0.00
FVMKT -575.50
0.11
-1045.50
0.00
-403.50
0.02
-6.10
0.00
FVMDL 509.00
0.04
260.50
0.20
486.50
0.00
751.50
0.00
44
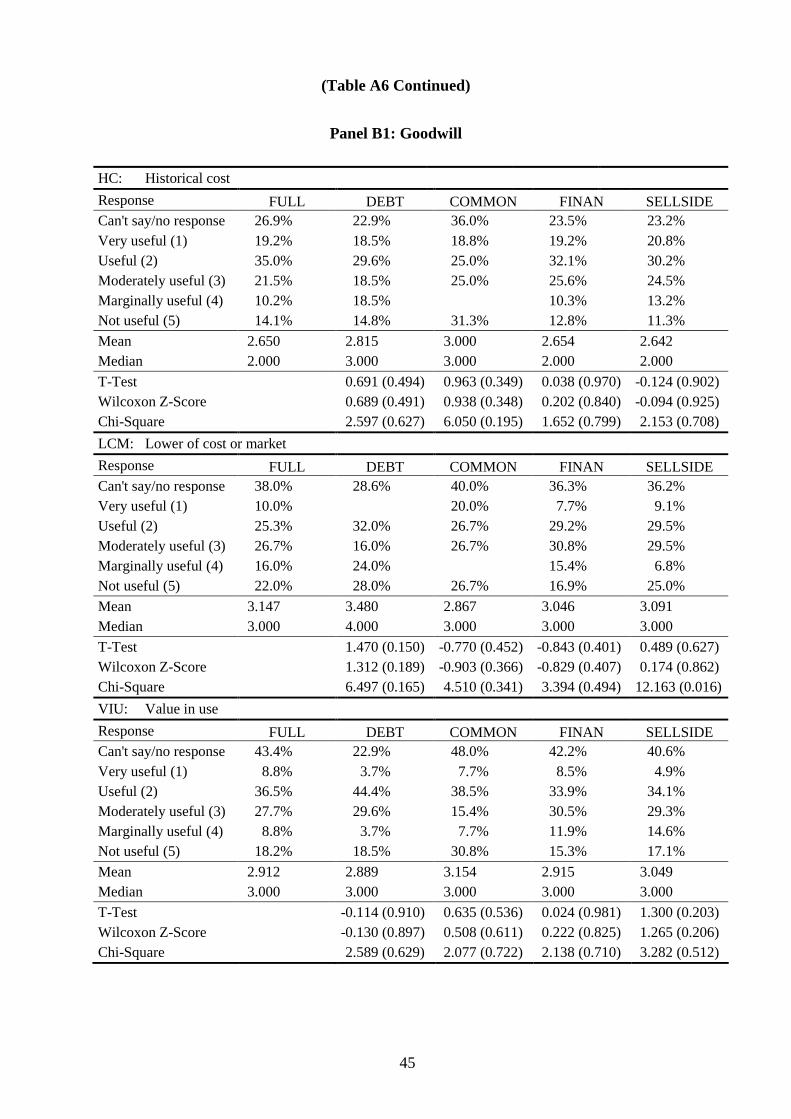
(Table A6 Continued)
Panel B1: Goodwill
HC: Historical cost
Response FULL DEBT COMMON FINAN SELLSIDE
Can't say/no response 26.9% 22.9% 36.0% 23.5% 23.2%
Very useful (1) 19.2% 18.5% 18.8% 19.2% 20.8%
Useful (2) 35.0% 29.6% 25.0% 32.1% 30.2%
Moderately useful (3) 21.5% 18.5% 25.0% 25.6% 24.5%
Marginally useful (4) 10.2% 18.5% 10.3% 13.2%
Not useful (5) 14.1% 14.8% 31.3% 12.8% 11.3%
Mean 2.650 2.815 3.000 2.654 2.642
Median 2.000 3.000 3.000 2.000 2.000
T-Test 0.691 (0.494) 0.963 (0.349) 0.038 (0.970) -0.124 (0.902)
Wilcoxon Z-Score 0.689 (0.491) 0.938 (0.348) 0.202 (0.840) -0.094 (0.925)
Chi-Square 2.597 (0.627) 6.050 (0.195) 1.652 (0.799) 2.153 (0.708)
LCM: Lower of cost or market
Response FULL DEBT COMMON FINAN SELLSIDE
Can't say/no response 38.0% 28.6% 40.0% 36.3% 36.2%
Very useful (1) 10.0% 20.0% 7.7% 9.1%
Useful (2) 25.3% 32.0% 26.7% 29.2% 29.5%
Moderately useful (3) 26.7% 16.0% 26.7% 30.8% 29.5%
Marginally useful (4) 16.0% 24.0% 15.4% 6.8%
Not useful (5) 22.0% 28.0% 26.7% 16.9% 25.0%
Mean 3.147
Median 3.000
3.480
4.000
2.867
3.000
3.046
3.000
3.091
3.000
T-Test 1.470 (0.150) -0.770 (0.452) -0.843 (0.401) 0.489 (0.627)
Wilcoxon Z-Score 1.312 (0.189) -0.903 (0.366) -0.829 (0.407) 0.174 (0.862)
Chi-Square 6.497 (0.165) 4.510 (0.341) 3.394 (0.494) 12.163 (0.016)
VIU: Value in use
Response FULL DEBT COMMON FINAN SELLSIDE
Can't say/no response 43.4% 22.9% 48.0% 42.2% 40.6%
Very useful (1) 8.8% 3.7% 7.7% 8.5% 4.9%
Useful (2) 36.5% 44.4% 38.5% 33.9% 34.1%
Moderately useful (3) 27.7% 29.6% 15.4% 30.5% 29.3%
Marginally useful (4) 8.8% 3.7% 7.7% 11.9% 14.6%
Not useful (5) 18.2% 18.5% 30.8% 15.3% 17.1%
Mean 2.912 2.889 3.154 2.915 3.049
Median 3.000 3.000 3.000 3.000 3.000
T-Test -0.114 (0.910) 0.635 (0.536) 0.024 (0.981) 1.300 (0.203)
Wilcoxon Z-Score -0.130 (0.897) 0.508 (0.611) 0.222 (0.825) 1.265 (0.206)
Chi-Square 2.589 (0.629) 2.077 (0.722) 2.138 (0.710) 3.282 (0.512)
45

(Table A6 Panel B1 Continued)
FVMKT: Fair value (mark-to-market)
Response FULL DEBT COMMON FINAN SELLSIDE
Can't say/no response 29.3% 20.0% 32.0% 23.5% 20.3%
Very useful (1) 24.6% 25.0% 11.8% 20.5% 20.0%
Useful (2) 39.8% 32.1% 41.2% 42.3% 45.5%
Moderately useful (3) 14.6% 14.3% 11.8% 16.7% 10.9%
Marginally useful (4) 5.3% 3.6% 5.9% 3.8% 5.5%
Not useful (5) 15.8% 25.0% 29.4% 16.7% 18.2%
Mean 2.480 2.714 3.000 2.538 2.564
Median 2.000 2.000 2.000 2.000 2.000
T-Test 0.905 (0.371) 1.525 (0.144) 0.526 (0.600) 0.269 (0.789)
Wilcoxon Z-Score 0.737 (0.461) 1.578 (0.114) 0.757 (0.449) -0.069 (0.945)
Chi-Square 2.476 (0.649) 3.605 (0.462) 2.218 (0.696) 5.682 (0.224)
FVMDL: Fair value (mark-to-model)
Response FULL DEBT COMMON FINAN SELLSIDE
Can't say/no response 46.7% 37.1% 40.0% 42.2% 39.1%
Very useful (1) 6.2% 9.1% 6.7% 5.1% 4.8%
Useful (2) 29.5% 27.3% 13.3% 33.9% 35.7%
Moderately useful (3) 24.0% 18.2% 13.3% 22.0% 21.4%
Marginally useful (4) 14.7% 13.6% 20.0% 15.3% 11.9%
Not useful (5) 25.6% 31.8% 46.7% 23.7% 26.2%
Mean 3.240 3.318 3.867 3.186 3.190
Median 3.000 3.000 4.000 3.000 3.000
T-Test 0.286 (0.777) 1.918 (0.072) -0.434 (0.665) 0.039 (0.969)
Wilcoxon Z-Score 0.284 (0.776) 1.974 (0.048) -0.490 (0.624) -0.017 (0.986)
Chi-Square 1.202 (0.878) 5.582 (0.233) 1.293 (0.863) 1.640 (0.802)
Panel B2: Test for significant differences across responses
HC LCM VIU FVMKT FVMDL
HC -3.08 -1.42 0.77 -2.33
0.00 0.16 0.44 0.02
LCM 744.00
0.00
1.78
0.08
3.32
0.00
-0.85
0.40
VIU 309.50
0.20
-344.00
0.09
3.18
0.00
-1.51
0.13
FVMKT -306.00
0.38
-833.50
0.00
-462.00
0.00
-5.68
0.00
FVMDL 620.00
0.03
154.00
0.42
207.50
0.14
683.00
0.00
46
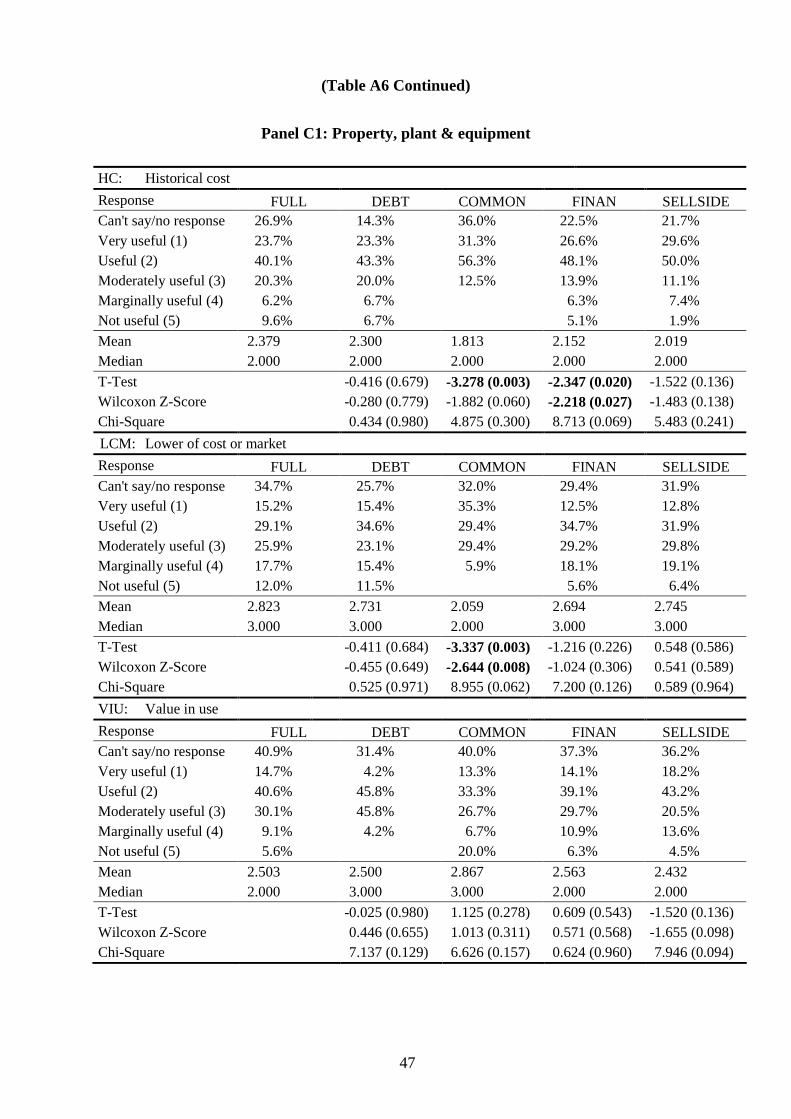
(Table A6 Continued)
Panel C1: Property, plant & equipment
HC: Historical cost
Response FULL DEBT COMMON FINAN SELLSIDE
Can't say/no response
Very useful (1)
Useful (2)
Moderately useful (3)
Marginally useful (4)
Not useful (5)
26.9%
23.7%
40.1%
20.3%
6.2%
9.6%
14.3%
23.3%
43.3%
20.0%
6.7%
6.7%
36.0%
31.3%
56.3%
12.5%
22.5%
26.6%
48.1%
13.9%
6.3%
5.1%
21.7%
29.6%
50.0%
11.1%
7.4%
1.9%
Mean
Median
2.379
2.000
2.300
2.000
1.813
2.000
2.152
2.000
2.019
2.000
T-Test -0.416 (0.679) -3.278 (0.003) -2.347 (0.020) -1.522 (0.136)
Wilcoxon Z-Score -0.280 (0.779) -1.882 (0.060) -2.218 (0.027) -1.483 (0.138)
Chi-Square 0.434 (0.980) 4.875 (0.300) 8.713 (0.069) 5.483 (0.241)
LCM: Lower of cost or market
Response FULL DEBT COMMON FINAN SELLSIDE
Can't say/no response
Very useful (1)
Useful (2)
Moderately useful (3)
Marginally useful (4)
Not useful (5)
34.7%
15.2%
29.1%
25.9%
17.7%
12.0%
25.7%
15.4%
34.6%
23.1%
15.4%
11.5%
32.0%
35.3%
29.4%
29.4%
5.9%
29.4%
12.5%
34.7%
29.2%
18.1%
5.6%
31.9%
12.8%
31.9%
29.8%
19.1%
6.4%
Mean 2.823
Median 3.000
T-Test
Wilcoxon Z-Score
Chi-Square
VIU: Value in use
Response F
2.731
3.000
-0.411 (0.684)
-0.455 (0.649)
0.525 (0.971)
ULL DEBT
2.059
2.000
-3.337 (0.003)
-2.644 (0.008)
8.955 (0.062)
COMMON
2.694
3.000
-1.216 (0.226)
-1.024 (0.306)
7.200 (0.126)
FINAN
2.745
3.000
0.548 (0.586)
0.541 (0.589)
0.589 (0.964)
SELLSIDE
Can't say/no response 40.9%
Very useful (1) 14.7%
Useful (2) 40.6%
Moderately useful (3) 30.1%
Marginally useful (4) 9.1%
Not useful (5) 5.6%
31.4%
4.2%
45.8%
45.8%
4.2%
40.0%
13.3%
33.3%
26.7%
6.7%
20.0%
37.3%
14.1%
39.1%
29.7%
10.9%
6.3%
36.2%
18.2%
43.2%
20.5%
13.6%
4.5%
Mean 2.503
Median 2.000
2.500
3.000
2.867
3.000
2.563
2.000
2.432
2.000
T-Test
Wilcoxon Z-Score
Chi-Square
-0.025 (0.980)
0.446 (0.655)
7.137 (0.129)
1.125 (0.278)
1.013 (0.311)
6.626 (0.157)
0.609 (0.543)
0.571 (0.568)
0.624 (0.960)
-1.520 (0.136)
-1.655 (0.098)
7.946 (0.094)
47
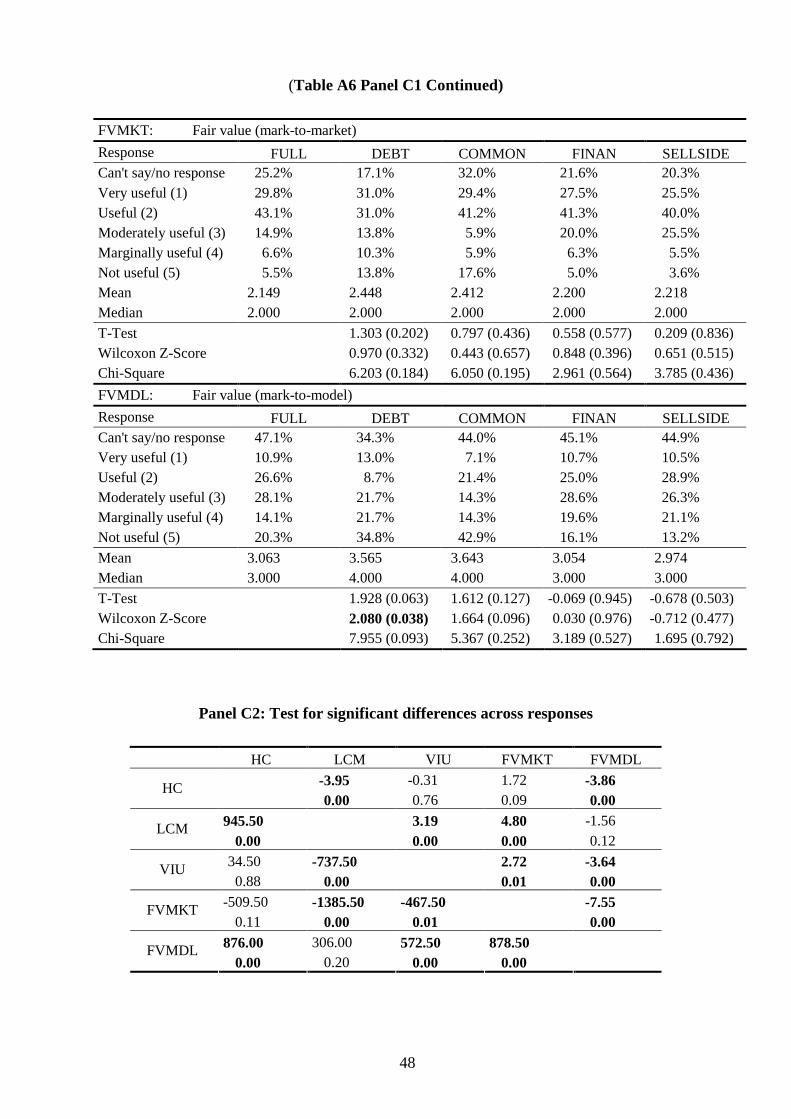
(Table A6 Panel C1 Continued)
FVMKT: Fair value (mark-to-market)
Response FULL DEBT COMMON FINAN SELLSIDE
Can't say/no response 25.2% 17.1% 32.0% 21.6% 20.3%
Very useful (1) 29.8% 31.0% 29.4% 27.5% 25.5%
Useful (2) 43.1% 31.0% 41.2% 41.3% 40.0%
Moderately useful (3) 14.9% 13.8% 5.9% 20.0% 25.5%
Marginally useful (4) 6.6% 10.3% 5.9% 6.3% 5.5%
Not useful (5) 5.5% 13.8% 17.6% 5.0% 3.6%
Mean 2.149 2.448 2.412 2.200 2.218
Median 2.000 2.000 2.000 2.000 2.000
T-Test 1.303 (0.202) 0.797 (0.436) 0.558 (0.577) 0.209 (0.836)
Wilcoxon Z-Score 0.970 (0.332) 0.443 (0.657) 0.848 (0.396) 0.651 (0.515)
Chi-Square 6.203 (0.184) 6.050 (0.195) 2.961 (0.564) 3.785 (0.436)
FVMDL: Fair value (mark-to-model)
Response FULL DEBT COMMON FINAN SELLSIDE
Can't say/no response 47.1% 34.3% 44.0% 45.1% 44.9%
Very useful (1) 10.9% 13.0% 7.1% 10.7% 10.5%
Useful (2) 26.6% 8.7% 21.4% 25.0% 28.9%
Moderately useful (3) 28.1% 21.7% 14.3% 28.6% 26.3%
Marginally useful (4) 14.1% 21.7% 14.3% 19.6% 21.1%
Not useful (5) 20.3% 34.8% 42.9% 16.1% 13.2%
Mean 3.063 3.565 3.643 3.054 2.974
Median 3.000 4.000 4.000 3.000 3.000
T-Test 1.928 (0.063) 1.612 (0.127) -0.069 (0.945) -0.678 (0.503)
Wilcoxon Z-Score 2.080 (0.038) 1.664 (0.096) 0.030 (0.976) -0.712 (0.477)
Chi-Square 7.955 (0.093) 5.367 (0.252) 3.189 (0.527) 1.695 (0.792)
Panel C2: Test for significant differences across responses
HC LCM VIU FVMKT FVMDL
-3.95 -0.31 1.72 -3.86 HC
0.00 0.76 0.09 0.00
945.50 3.19 4.80 -1.56 LCM
0.00 0.00 0.00 0.12
34.50 -737.50 2.72 -3.64 VIU
0.88 0.00 0.01 0.00
-509.50 -1385.50 -467.50 -7.55 FVMKT
0.11 0.00 0.01 0.00
876.00 306.00 572.50 878.50 FVMDL
0.00 0.20 0.00 0.00
48
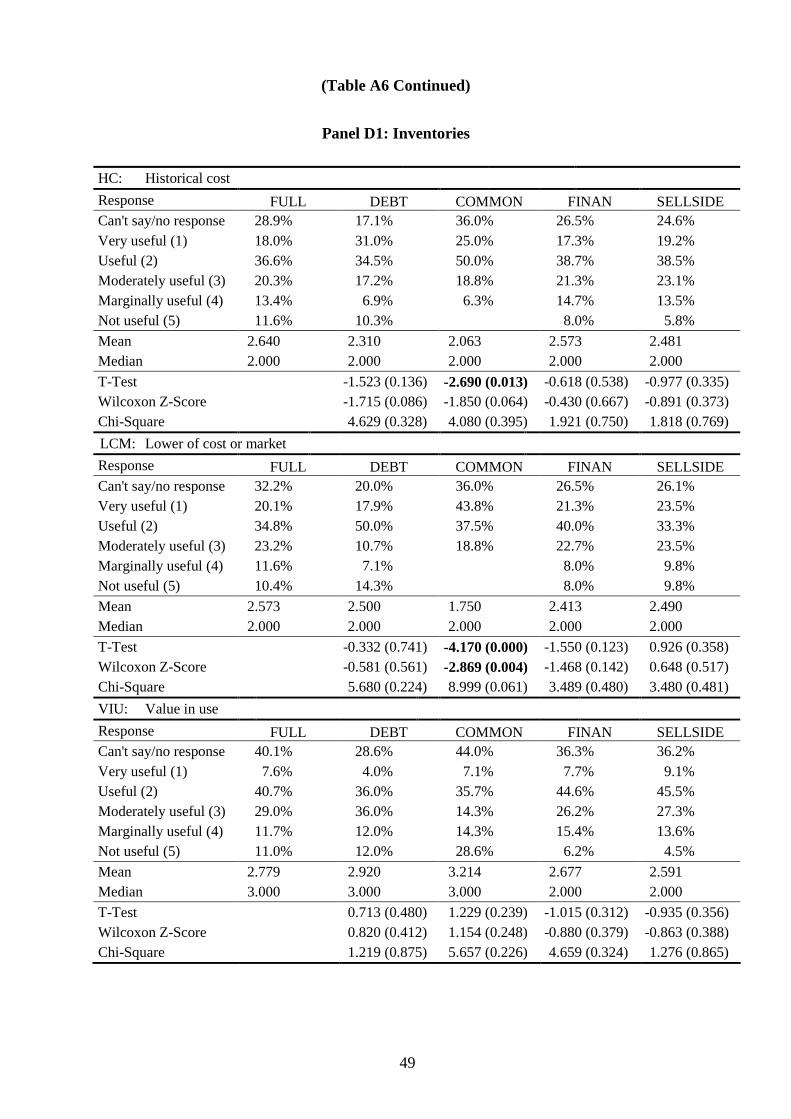
(Table A6 Continued)
Panel D1: Inventories
HC: Historical cost
Response FULL DEBT COMMON FINAN SELLSIDE
Can't say/no response
Very useful (1)
Useful (2)
Moderately useful (3)
Marginally useful (4)
Not useful (5)
28.9%
18.0%
36.6%
20.3%
13.4%
11.6%
17.1%
31.0%
34.5%
17.2%
6.9%
10.3%
36.0%
25.0%
50.0%
18.8%
6.3%
26.5%
17.3%
38.7%
21.3%
14.7%
8.0%
24.6%
19.2%
38.5%
23.1%
13.5%
5.8%
Mean
Median
2.640
2.000
2.310
2.000
2.063
2.000
2.573
2.000
2.481
2.000
T-Test -1.523 (0.136) -2.690 (0.013) -0.618 (0.538) -0.977 (0.335)
Wilcoxon Z-Score -1.715 (0.086) -1.850 (0.064) -0.430 (0.667) -0.891 (0.373)
Chi-Square 4.629 (0.328) 4.080 (0.395) 1.921 (0.750) 1.818 (0.769)
LCM: Lower of cost or market
Response FULL DEBT COMMON FINAN SELLSIDE
Can't say/no response
Very useful (1)
Useful (2)
Moderately useful (3)
Marginally useful (4)
Not useful (5)
32.2%
20.1%
34.8%
23.2%
11.6%
10.4%
20.0%
17.9%
50.0%
10.7%
7.1%
14.3%
36.0%
43.8%
37.5%
18.8%
26.5%
21.3%
40.0%
22.7%
8.0%
8.0%
26.1%
23.5%
33.3%
23.5%
9.8%
9.8%
Mean 2.573
Median 2.000
T-Test
Wilcoxon Z-Score
Chi-Square
VIU: Value in use
Response F
2.500
2.000
-0.332 (0.741)
-0.581 (0.561)
5.680 (0.224)
ULL DEBT
1.750
2.000
-4.170 (0.000)
-2.869 (0.004)
8.999 (0.061)
COMMON
2.413
2.000
-1.550 (0.123)
-1.468 (0.142)
3.489 (0.480)
FINAN
2.490
2.000
0.926 (0.358)
0.648 (0.517)
3.480 (0.481)
SELLSIDE
Can't say/no response 40.1%
Very useful (1) 7.6%
Useful (2) 40.7%
Moderately useful (3) 29.0%
Marginally useful (4) 11.7%
Not useful (5) 11.0%
28.6%
4.0%
36.0%
36.0%
12.0%
12.0%
44.0%
7.1%
35.7%
14.3%
14.3%
28.6%
36.3%
7.7%
44.6%
26.2%
15.4%
6.2%
36.2%
9.1%
45.5%
27.3%
13.6%
4.5%
Mean 2.779
Median 3.000
2.920
3.000
3.214
3.000
2.677
2.000
2.591
2.000
T-Test
Wilcoxon Z-Score
Chi-Square
0.713 (0.480)
0.820 (0.412)
1.219 (0.875)
1.229 (0.239)
1.154 (0.248)
5.657 (0.226)
-1.015 (0.312)
-0.880 (0.379)
4.659 (0.324)
-0.935 (0.356)
-0.863 (0.388)
1.276 (0.865)
49

(Table A6 Panel D1 Continued)
FVMKT: Fair value (mark-to-market)
Response FULL DEBT COMMON FINAN SELLSIDE
Can't say/no
Very useful (1)
Useful (2)
Moderately useful (3)
Marginally useful (4)
Not useful (5)
response 26.0%
30.2%
44.7%
13.4%
6.7%
5.0%
1
3
5
7.1%
1.0%
1.7%
6.9%
3.4%
6.9%
32.0%
23.5%
52.9%
17.6%
5.9%
21.6%
27.5%
41.3%
16.3%
8.8%
6.3%
20.3%
29.1%
40.0%
12.7%
9.1%
9.1%
Mean
Median
2.117
2.000
2.034
2.000
2.059
2.000
2.250
2.000
2.291
2.000
T-Test
Wilcoxon Z-Score
Chi-Square
FVMDL:
-0.450 (0.655)
-0.574 (0.566)
2.273 (0.686)
Fair value (mark-to-model)
-0.296 (0.770) 1.474 (0.143) 0.533 (0.596)
0.181 (0.856) 1.405 (0.160) -0.016 (0.987)
1.775 (0.777) 2.929 (0.570) 3.869 (0.424)
Response FULL DEBT COMMON FINAN SELLSIDE
Can't say/no response
Very useful (1)
Useful (2)
Moderately useful (3)
Marginally useful (4)
Not useful (5)
47.1%
6.3%
28.9%
22.7%
19.5%
22.7%
34.3%
8.7%
17.4%
17.4%
26.1%
30.4%
44.0%
14.3%
21.4%
21.4%
42.9%
44.1%
3.5%
28.1%
21.1%
26.3%
21.1%
43.5%
5.1%
30.8%
17.9%
25.6%
20.5%
Mean
Median
3.234
3.000
3.522
4.000
3.929
4.000
3.333
3.000
3.256
3.000
T-Test
Wilcoxon Z-Score
Chi-Square
1.147 (0.260)
1.235 (0.217)
3.263 (0.515)
2.384 (0.029)
2.168 (0.030)
5.016 (0.286)
0.800 (0.425)
0.777 (0.437)
3.915 (0.418)
-0.744 (0.461)
-0.681 (0.496)
1.847 (0.764)
Panel D2: Test for significant differences across responses
HC LCM VIU FVMKT FVMDL
0.64 -0.99 3.66 -3.25 HC
0.52 0.32 0.00 0.00
-215.50 -1.31 3.36 -3.96 LCM
0.41 0.19 0.00 0.00
169.50 291.50 5.27 -3.38 VIU
0.44 0.18 0.00 0.00
-1184.00 -1035.00 -901.50 -8.60 FVMKT
0.00 0.00 0.00 0.00
734.50 778.00 421.50 1264.00FVMDL
0.00 0.00 0.00 0.00
50
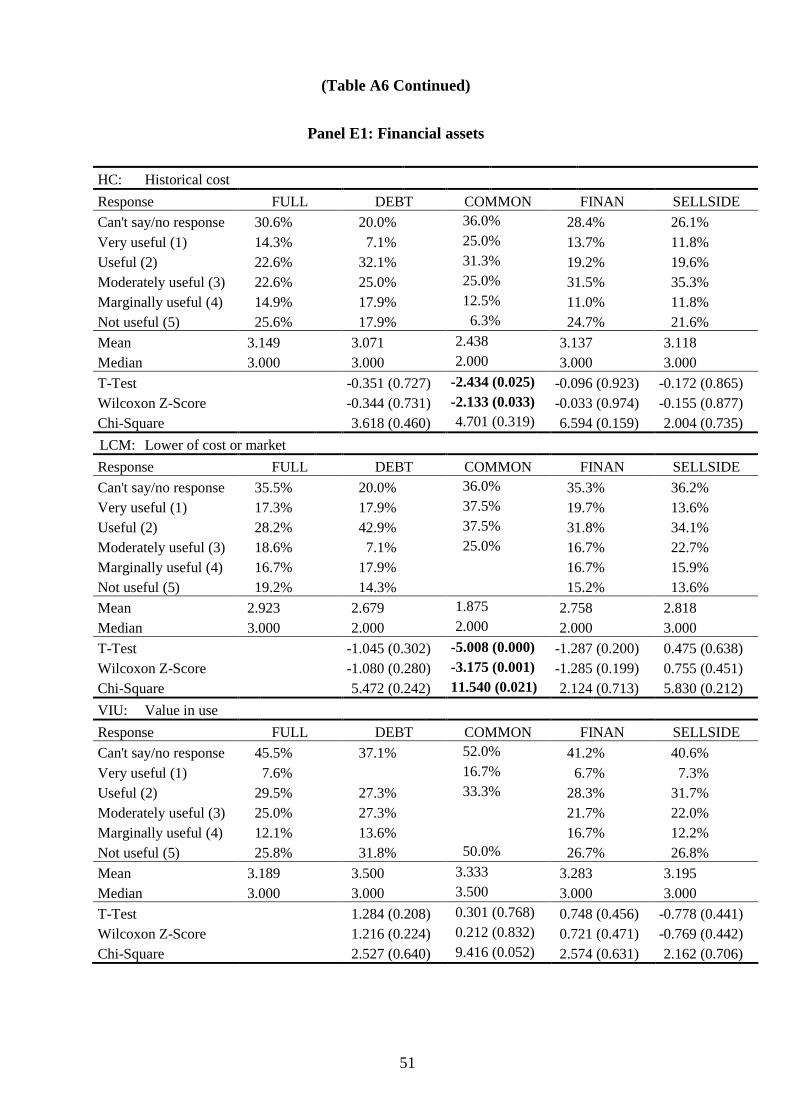
(Table A6 Continued)
Panel E1: Financial assets
HC: Historical cost
Response FULL DEBT COMMON FINAN SELLSIDE
Can't say/no response 30.6% 20.0% 36.0% 28.4% 26.1%
Very useful (1) 14.3% 7.1% 25.0% 13.7% 11.8%
Useful (2) 22.6% 32.1% 31.3% 19.2% 19.6%
Moderately useful (3) 22.6% 25.0% 25.0% 31.5% 35.3%
Marginally useful (4) 14.9% 17.9% 12.5% 11.0% 11.8%
Not useful (5) 25.6% 17.9% 6.3% 24.7% 21.6%
Mean 3.149 3.071 2.438 3.137 3.118
Median 3.000 3.000 2.000 3.000 3.000
T-Test -0.351 (0.727) -2.434 (0.025) -0.096 (0.923) -0.172 (0.865)
Wilcoxon Z-Score -0.344 (0.731) -2.133 (0.033) -0.033 (0.974) -0.155 (0.877)
Chi-Square 3.618 (0.460) 4.701 (0.319) 6.594 (0.159) 2.004 (0.735)
LCM: Lower of cost or market
Response FULL DEBT COMMON FINAN SELLSIDE
Can't say/no response 35.5% 20.0% 36.0% 35.3% 36.2%
Very useful (1) 17.3% 17.9% 37.5% 19.7% 13.6%
Useful (2) 28.2% 42.9% 37.5% 31.8% 34.1%
Moderately useful (3) 18.6% 7.1% 25.0% 16.7% 22.7%
Marginally useful (4) 16.7% 17.9% 16.7% 15.9%
Not useful (5) 19.2% 14.3% 15.2% 13.6%
Mean 2.923 2.679 1.875 2.758 2.818
Median 3.000 2.000 2.000 2.000 3.000
T-Test -1.045 (0.302) -5.008 (0.000) -1.287 (0.200) 0.475 (0.638)
Wilcoxon Z-Score -1.080 (0.280) -3.175 (0.001) -1.285 (0.199) 0.755 (0.451)
Chi-Square 5.472 (0.242) 11.540 (0.021) 2.124 (0.713) 5.830 (0.212)
VIU: Value in use
Response FULL DEBT COMMON FINAN SELLSIDE
Can't say/no response 45.5% 37.1% 52.0% 41.2% 40.6%
Very useful (1) 7.6% 16.7% 6.7% 7.3%
Useful (2) 29.5% 27.3% 33.3% 28.3% 31.7%
Moderately useful (3) 25.0% 27.3% 21.7% 22.0%
Marginally useful (4) 12.1% 13.6% 16.7% 12.2%
Not useful (5) 25.8% 31.8% 50.0% 26.7% 26.8%
Mean 3.189 3.500 3.333 3.283 3.195
Median 3.000 3.000 3.500 3.000 3.000
T-Test 1.284 (0.208) 0.301 (0.768) 0.748 (0.456) -0.778 (0.441)
Wilcoxon Z-Score 1.216 (0.224) 0.212 (0.832) 0.721 (0.471) -0.769 (0.442)
Chi-Square 2.527 (0.640) 9.416 (0.052) 2.574 (0.631) 2.162 (0.706)
51
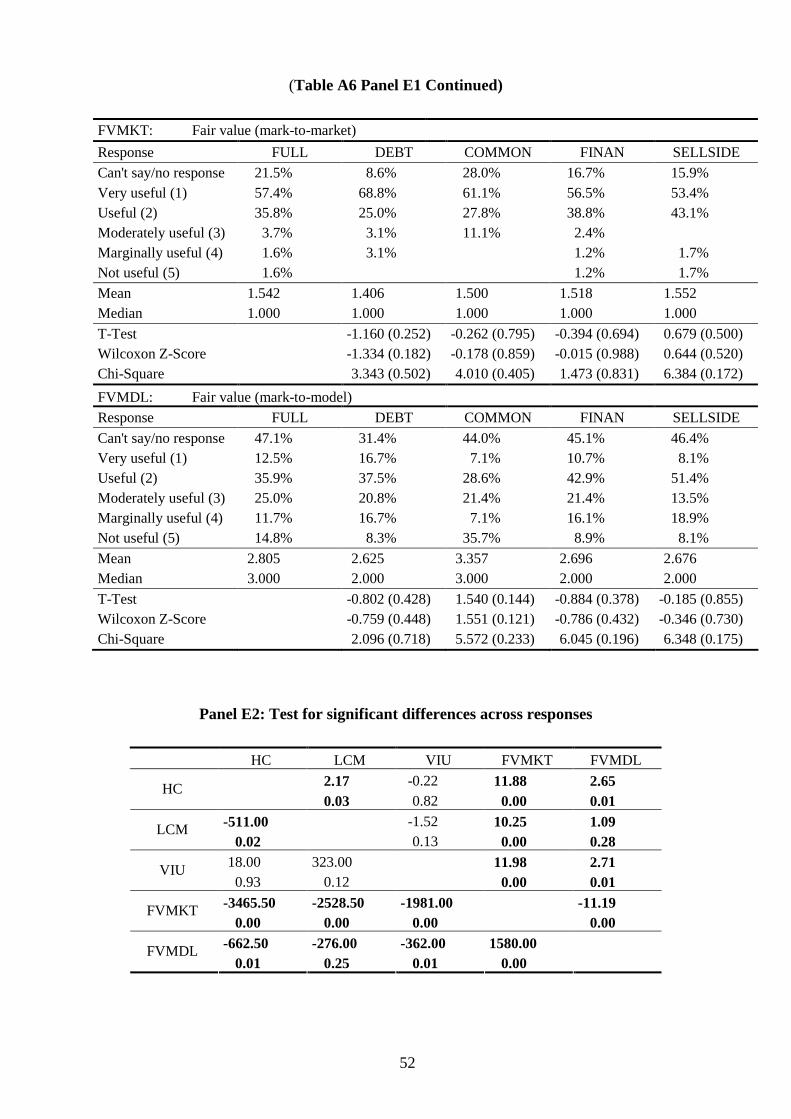
(Table A6 Panel E1 Continued)
FVMKT: Fair value (mark-to-market)
Response FULL DEBT COMMON FINAN SELLSIDE
Can't say/no response 21.5% 8.6% 28.0% 16.7% 15.9%
Very useful (1) 57.4% 68.8% 61.1% 56.5% 53.4%
Useful (2) 35.8% 25.0% 27.8% 38.8% 43.1%
Moderately useful (3) 3.7% 3.1% 11.1% 2.4%
Marginally useful (4) 1.6% 3.1% 1.2% 1.7%
Not useful (5) 1.6% 1.2% 1.7%
Mean 1.542 1.406 1.500 1.518 1.552
Median 1.000 1.000 1.000 1.000 1.000
T-Test -1.160 (0.252) -0.262 (0.795) -0.394 (0.694) 0.679 (0.500)
Wilcoxon Z-Score -1.334 (0.182) -0.178 (0.859) -0.015 (0.988) 0.644 (0.520)
Chi-Square 3.343 (0.502) 4.010 (0.405) 1.473 (0.831) 6.384 (0.172)
FVMDL: Fair value (mark-to-model)
Response FULL DEBT COMMON FINAN SELLSIDE
Can't say/no response 47.1% 31.4% 44.0% 45.1% 46.4%
Very useful (1) 12.5% 16.7% 7.1% 10.7% 8.1%
Useful (2) 35.9% 37.5% 28.6% 42.9% 51.4%
Moderately useful (3) 25.0% 20.8% 21.4% 21.4% 13.5%
Marginally useful (4) 11.7% 16.7% 7.1% 16.1% 18.9%
Not useful (5) 14.8% 8.3% 35.7% 8.9% 8.1%
Mean 2.805 2.625 3.357 2.696 2.676
Median 3.000 2.000 3.000 2.000 2.000
T-Test -0.802 (0.428) 1.540 (0.144) -0.884 (0.378) -0.185 (0.855)
Wilcoxon Z-Score -0.759 (0.448) 1.551 (0.121) -0.786 (0.432) -0.346 (0.730)
Chi-Square 2.096 (0.718) 5.572 (0.233) 6.045 (0.196) 6.348 (0.175)
Panel E2: Test for significant differences across responses
HC LCM VIU FVMKT FVMDL
HC 2.17 -0.22 11.88 2.65
0.03 0.82 0.00 0.01
LCM -511.00
0.02
-1.52
0.13
10.25
0.00
1.09
0.28
VIU 18.00
0.93
323.00
0.12
11.98
0.00
2.71
0.01
FVMKT -3465.50 -2528.50 -1981.00 -11.19
0.00 0.00 0.00 0.00
FVMDL -662.50 -276.00 -362.00 1580.00
0.01 0.25 0.01 0.00
52
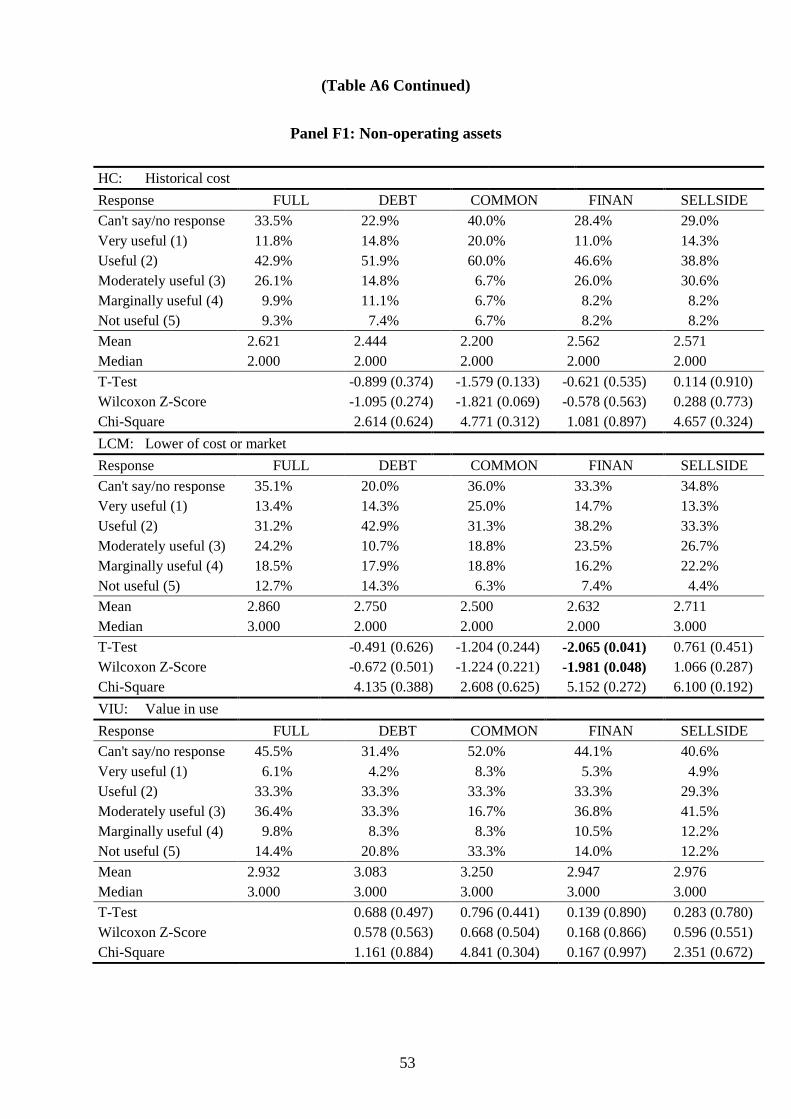
(Table A6 Continued)
Panel F1: Non-operating assets
HC: Historical cost
Response FULL DEBT COMMON FINAN SELLSIDE
Can't say/no response
Very useful (1)
Useful (2)
Moderately useful (3)
Marginally useful (4)
Not useful (5)
33.5%
11.8%
42.9%
26.1%
9.9%
9.3%
22.9%
14.8%
51.9%
14.8%
11.1%
7.4%
40.0%
20.0%
60.0%
6.7%
6.7%
6.7%
28.4%
11.0%
46.6%
26.0%
8.2%
8.2%
29.0%
14.3%
38.8%
30.6%
8.2%
8.2%
Mean
Median
2.621
2.000
2.444
2.000
2.200
2.000
2.562
2.000
2.571
2.000
T-Test -0.899 (0.374) -1.579 (0.133) -0.621 (0.535) 0.114 (0.910)
Wilcoxon Z-Score -1.095 (0.274) -1.821 (0.069) -0.578 (0.563) 0.288 (0.773)
Chi-Square 2.614 (0.624) 4.771 (0.312) 1.081 (0.897) 4.657 (0.324)
LCM: Lower of cost or market
Response FULL DEBT COMMON FINAN SELLSIDE
Can't say/no response
Very useful (1)
Useful (2)
Moderately useful (3)
Marginally useful (4)
Not useful (5)
35.1%
13.4%
31.2%
24.2%
18.5%
12.7%
20.0%
14.3%
42.9%
10.7%
17.9%
14.3%
36.0%
25.0%
31.3%
18.8%
18.8%
6.3%
33.3%
14.7%
38.2%
23.5%
16.2%
7.4%
34.8%
13.3%
33.3%
26.7%
22.2%
4.4%
Mean 2.860
Median 3.000
T-Test
Wilcoxon Z-Score
Chi-Square
VIU: Value in use
Response F
2.750
2.000
-0.491 (0.626)
-0.672 (0.501)
4.135 (0.388)
ULL DEBT
2.500
2.000
-1.204 (0.244)
-1.224 (0.221)
2.608 (0.625)
COMMON
2.632
2.000
-2.065 (0.041)
-1.981 (0.048)
5.152 (0.272)
FINAN
2.711
3.000
0.761 (0.451)
1.066 (0.287)
6.100 (0.192)
SELLSIDE
Can't say/no response 45.5%
Very useful (1) 6.1%
Useful (2) 33.3%
Moderately useful (3) 36.4%
Marginally useful (4) 9.8%
Not useful (5) 14.4%
31.4%
4.2%
33.3%
33.3%
8.3%
20.8%
52.0%
8.3%
33.3%
16.7%
8.3%
33.3%
44.1%
5.3%
33.3%
36.8%
10.5%
14.0%
40.6%
4.9%
29.3%
41.5%
12.2%
12.2%
Mean 2.932
Median 3.000
3.083
3.000
3.250
3.000
2.947
3.000
2.976
3.000
T-Test
Wilcoxon Z-Score
Chi-Square
0.688 (0.497)
0.578 (0.563)
1.161 (0.884)
0.796 (0.441)
0.668 (0.504)
4.841 (0.304)
0.139 (0.890)
0.168 (0.866)
0.167 (0.997)
0.283 (0.780)
0.596 (0.551)
2.351 (0.672)
53
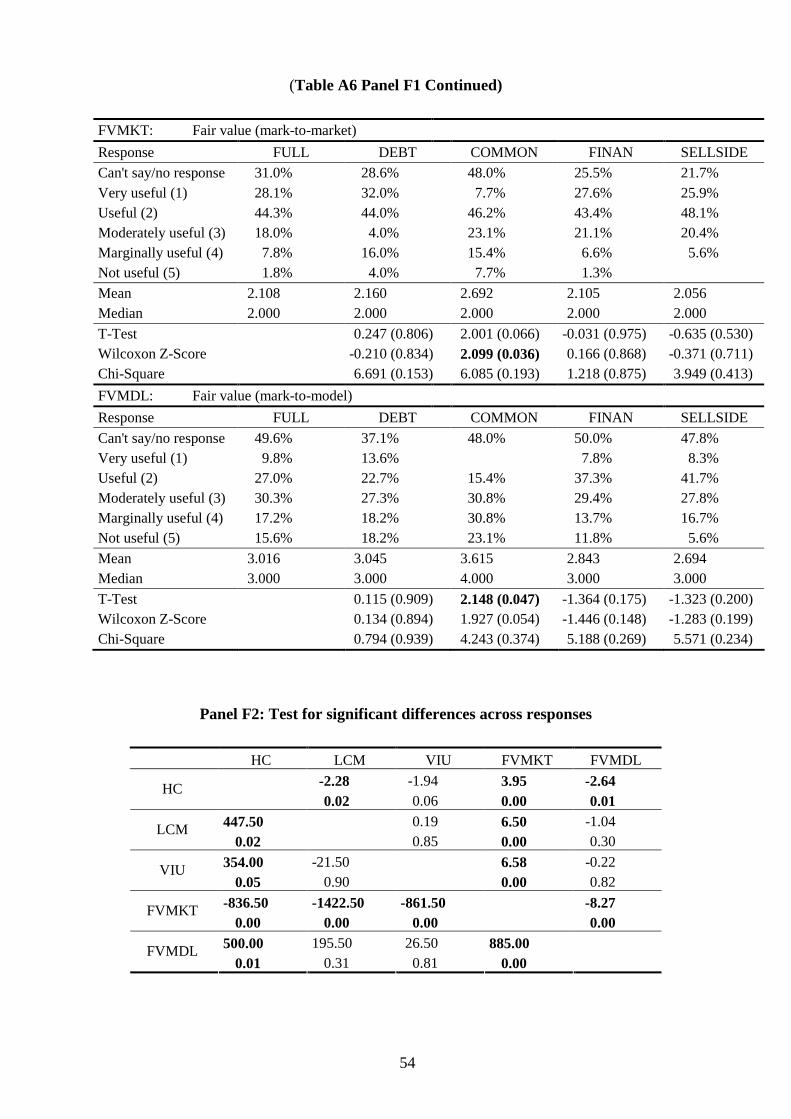
(Table A6 Panel F1 Continued)
FVMKT: Fair value (mark-to-market)
Response FULL DEBT COMMON FINAN SELLSIDE
Can't say/no response 31.0% 28.6% 48.0% 25.5% 21.7%
Very useful (1) 28.1% 32.0% 7.7% 27.6% 25.9%
Useful (2) 44.3% 44.0% 46.2% 43.4% 48.1%
Moderately useful (3) 18.0% 4.0% 23.1% 21.1% 20.4%
Marginally useful (4) 7.8% 16.0% 15.4% 6.6% 5.6%
Not useful (5) 1.8% 4.0% 7.7% 1.3%
Mean 2.108 2.160 2.692 2.105 2.056
Median 2.000 2.000 2.000 2.000 2.000
T-Test 0.247 (0.806) 2.001 (0.066) -0.031 (0.975) -0.635 (0.530)
Wilcoxon Z-Score -0.210 (0.834) 2.099 (0.036) 0.166 (0.868) -0.371 (0.711)
Chi-Square 6.691 (0.153) 6.085 (0.193) 1.218 (0.875) 3.949 (0.413)
FVMDL: Fair value (mark-to-model)
Response FULL DEBT COMMON FINAN SELLSIDE
Can't say/no response 49.6% 37.1% 48.0% 50.0% 47.8%
Very useful (1) 9.8% 13.6% 7.8% 8.3%
Useful (2) 27.0% 22.7% 15.4% 37.3% 41.7%
Moderately useful (3) 30.3% 27.3% 30.8% 29.4% 27.8%
Marginally useful (4) 17.2% 18.2% 30.8% 13.7% 16.7%
Not useful (5) 15.6% 18.2% 23.1% 11.8% 5.6%
Mean 3.016 3.045 3.615 2.843 2.694
Median 3.000 3.000 4.000 3.000 3.000
T-Test 0.115 (0.909) 2.148 (0.047) -1.364 (0.175) -1.323 (0.200)
Wilcoxon Z-Score 0.134 (0.894) 1.927 (0.054) -1.446 (0.148) -1.283 (0.199)
Chi-Square 0.794 (0.939) 4.243 (0.374) 5.188 (0.269) 5.571 (0.234)
Panel F2: Test for significant differences across responses
HC LCM VIU FVMKT FVMDL
HC -2.28 -1.94 3.95 -2.64
0.02 0.06 0.00 0.01
LCM 447.50
0.02
0.19
0.85
6.50
0.00
-1.04
0.30
VIU 354.00
0.05
-21.50
0.90
6.58
0.00
-0.22
0.82
FVMKT -836.50 -1422.50 -861.50 -8.27
0.00 0.00 0.00 0.00
FVMDL 500.00
0.01
195.50
0.31
26.50
0.81
885.00
0.00
54
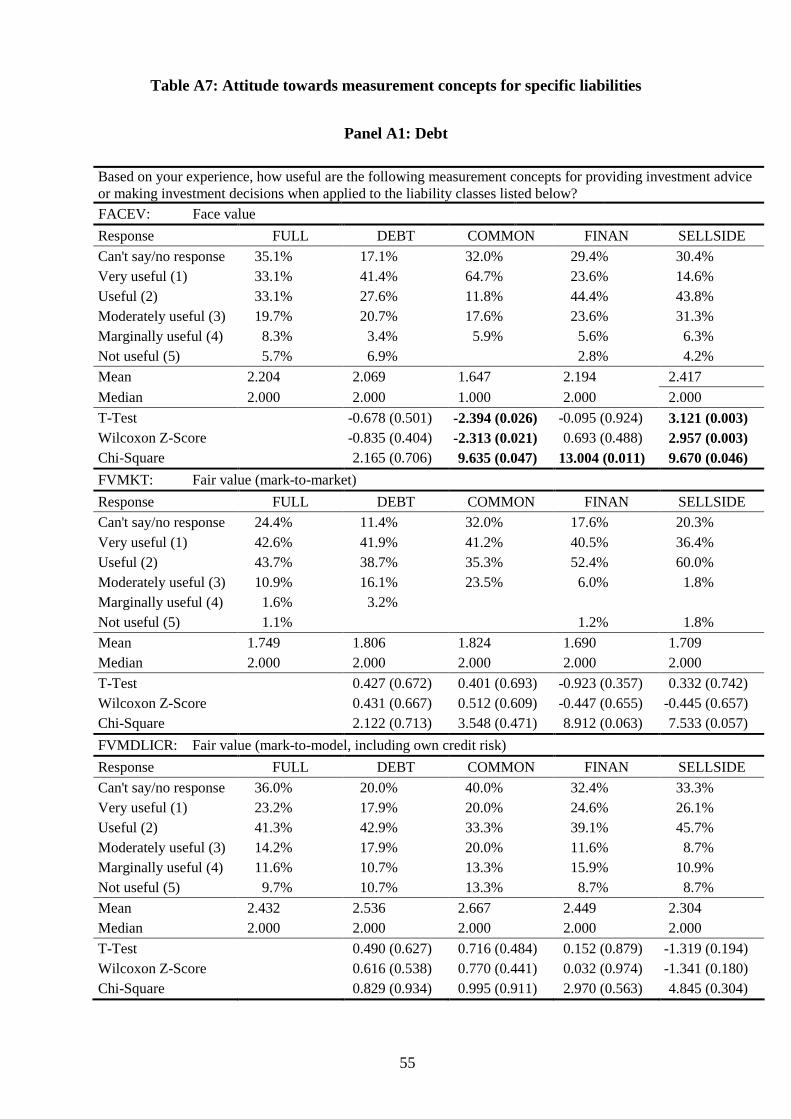
Table A7: Attitude towards measurement concepts for specific liabilities
Panel A1: Debt
Based on your experience, how useful are the following measurement concepts for providing investment advice or making investment decisions when applied to the liability classes listed below?
FACEV: Face value
Response FULL DEBT COMMON FINAN SELLSIDE
Can't say/no response 35.1% 17.1% 32.0% 29.4% 30.4%
Very useful (1) 33.1% 41.4% 64.7% 23.6% 14.6%
Useful (2) 33.1% 27.6% 11.8% 44.4% 43.8%
Moderately useful (3) 19.7% 20.7% 17.6% 23.6% 31.3%
Marginally useful (4) 8.3% 3.4% 5.9% 5.6% 6.3%
Not useful (5) 5.7% 6.9% 2.8% 4.2%
Mean 2.204 2.069 1.647 2.194 2.417
Median 2.000 2.000 1.000 2.000 2.000
T-Test -0.678 (0.501) -2.394 (0.026) -0.095 (0.924) 3.121 (0.003)
Wilcoxon Z-Score -0.835 (0.404) -2.313 (0.021) 0.693 (0.488) 2.957 (0.003)
Chi-Square 2.165 (0.706) 9.635 (0.047) 13.004 (0.011) 9.670 (0.046)
FVMKT: Fair value (mark-to-market)
Response FULL DEBT COMMON FINAN SELLSIDE
Can't say/no response 24.4% 11.4% 32.0% 17.6% 20.3%
Very useful (1) 42.6% 41.9% 41.2% 40.5% 36.4%
Useful (2) 43.7% 38.7% 35.3% 52.4% 60.0%
Moderately useful (3) 10.9% 16.1% 23.5% 6.0% 1.8%
Marginally useful (4) 1.6% 3.2%
Not useful (5) 1.1% 1.2% 1.8%
Mean 1.749 1.806 1.824 1.690 1.709
Median 2.000 2.000 2.000 2.000 2.000
T-Test 0.427 (0.672) 0.401 (0.693) -0.923 (0.357) 0.332 (0.742)
Wilcoxon Z-Score 0.431 (0.667) 0.512 (0.609) -0.447 (0.655) -0.445 (0.657)
Chi-Square 2.122 (0.713) 3.548 (0.471) 8.912 (0.063) 7.533 (0.057)
FVMDLICR: Fair value (mark-to-model, including own credit risk)
Response FULL DEBT COMMON FINAN SELLSIDE
Can't say/no response 36.0% 20.0% 40.0% 32.4% 33.3%
Very useful (1) 23.2% 17.9% 20.0% 24.6% 26.1%
Useful (2) 41.3% 42.9% 33.3% 39.1% 45.7%
Moderately useful (3) 14.2% 17.9% 20.0% 11.6% 8.7%
Marginally useful (4) 11.6% 10.7% 13.3% 15.9% 10.9%
Not useful (5) 9.7% 10.7% 13.3% 8.7% 8.7%
Mean 2.432 2.536 2.667 2.449 2.304
Median 2.000 2.000 2.000 2.000 2.000
T-Test 0.490 (0.627) 0.716 (0.484) 0.152 (0.879) -1.319 (0.194)
Wilcoxon Z-Score 0.616 (0.538) 0.770 (0.441) 0.032 (0.974) -1.341 (0.180)
Chi-Square 0.829 (0.934) 0.995 (0.911) 2.970 (0.563) 4.845 (0.304)
55
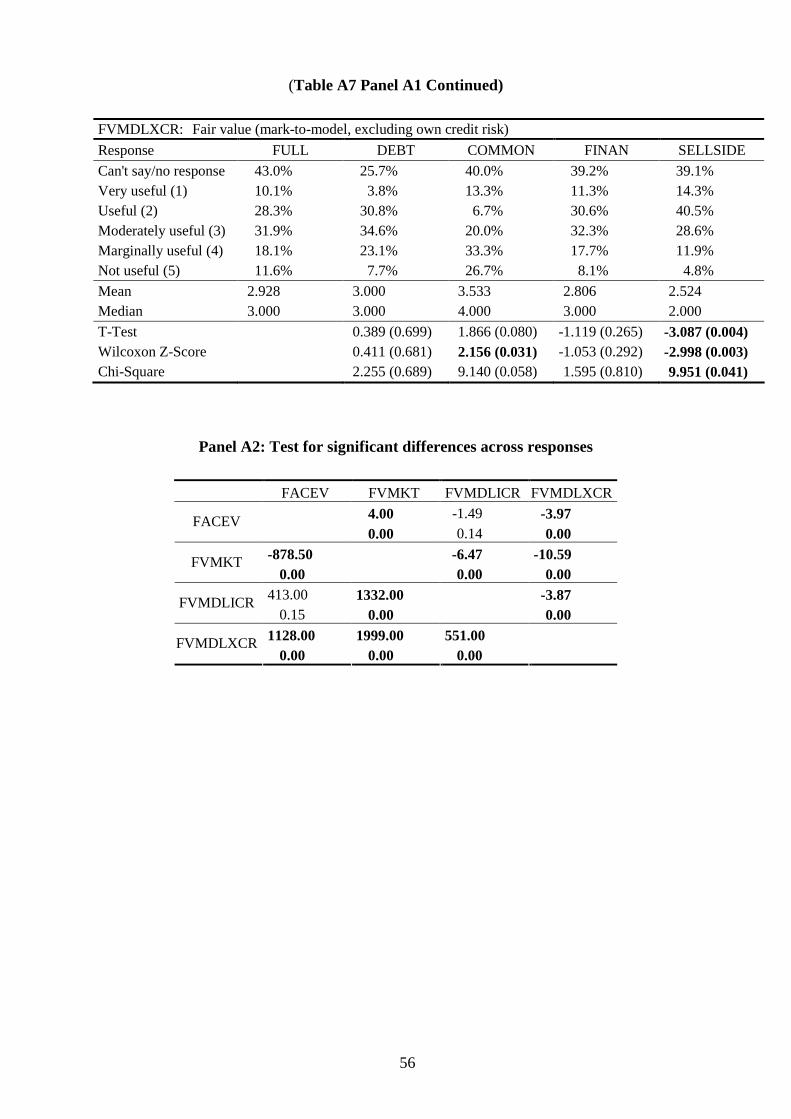
(Table A7 Panel A1 Continued)
FVMDLXCR: Fair value (mark-to-model, excluding own credit risk)
Response FULL DEBT COMMON FINAN SELLSIDE
Can't say/no response 43.0% 25.7% 40.0% 39.2% 39.1%
Very useful (1) 10.1% 3.8% 13.3% 11.3% 14.3%
Useful (2) 28.3% 30.8% 6.7% 30.6% 40.5%
Moderately useful (3) 31.9% 34.6% 20.0% 32.3% 28.6%
Marginally useful (4) 18.1% 23.1% 33.3% 17.7% 11.9%
Not useful (5) 11.6% 7.7% 26.7% 8.1% 4.8%
Mean 2.928 3.000 3.533 2.806 2.524
Median 3.000 3.000 4.000 3.000 2.000
T-Test 0.389 (0.699) 1.866 (0.080) -1.119 (0.265) -3.087 (0.004)
Wilcoxon Z-Score 0.411 (0.681) 2.156 (0.031) -1.053 (0.292) -2.998 (0.003)
Chi-Square 2.255 (0.689) 9.140 (0.058) 1.595 (0.810) 9.951 (0.041)
Panel A2: Test for significant differences across responses
FACEV FVMKT FVMDLICR FVMDLXCR
FACEV 4.00
0.00
-1.49
0.14
-3.97
0.00
FVMKT -878.50
0.00
-6.47
0.00
-10.59
0.00
FVMDLICR 413.00
0.15
1332.00
0.00
-3.87
0.00
FVMDLXCR 1128.00
0.00
1999.00
0.00
551.00
0.00
56
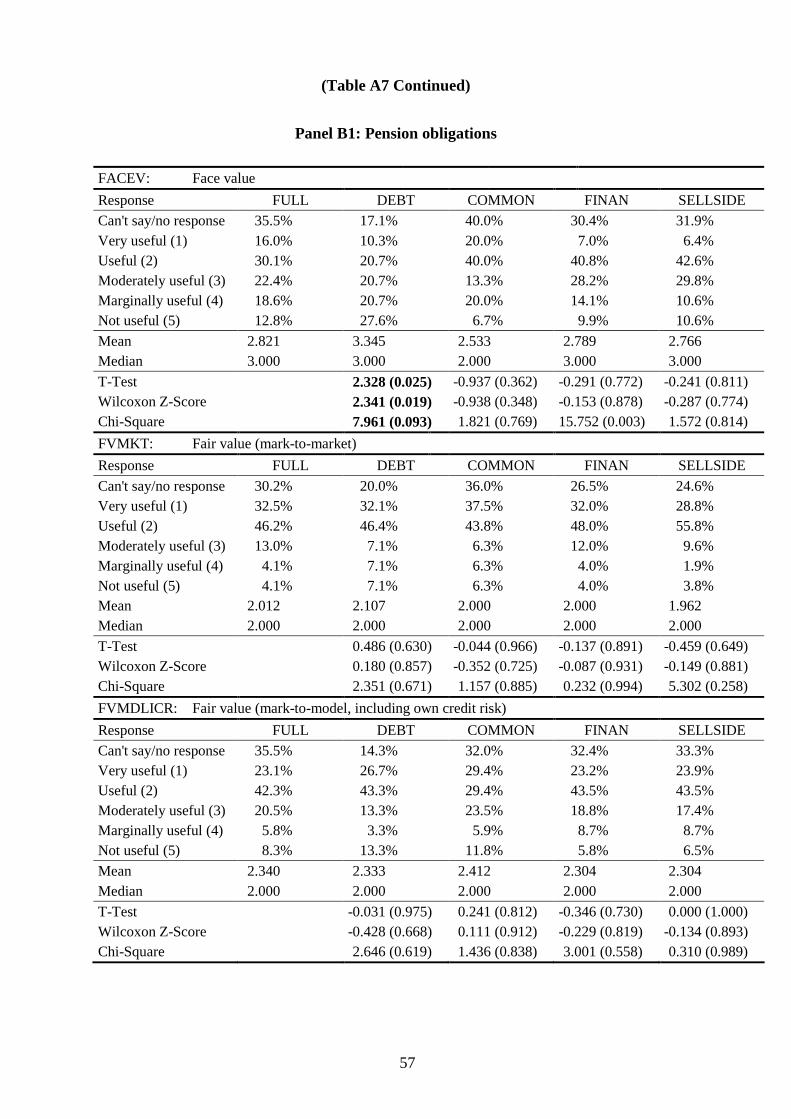
(Table A7 Continued)
Panel B1: Pension obligations
FACEV: Face value
Response FULL DEBT COMMON FINAN SELLSIDE
Can't say/no response 35.5% 17.1% 40.0% 30.4% 31.9%
Very useful (1) 16.0% 10.3% 20.0% 7.0% 6.4%
Useful (2) 30.1% 20.7% 40.0% 40.8% 42.6%
Moderately useful (3) 22.4% 20.7% 13.3% 28.2% 29.8%
Marginally useful (4) 18.6% 20.7% 20.0% 14.1% 10.6%
Not useful (5) 12.8% 27.6% 6.7% 9.9% 10.6%
Mean 2.821 3.345 2.533 2.789 2.766
Median 3.000 3.000 2.000 3.000 3.000
T-Test 2.328 (0.025) -0.937 (0.362) -0.291 (0.772) -0.241 (0.811)
Wilcoxon Z-Score 2.341 (0.019) -0.938 (0.348) -0.153 (0.878) -0.287 (0.774)
Chi-Square 7.961 (0.093) 1.821 (0.769) 15.752 (0.003) 1.572 (0.814)
FVMKT: Fair value (mark-to-market)
Response FULL DEBT COMMON FINAN SELLSIDE
Can't say/no response 30.2% 20.0% 36.0% 26.5% 24.6%
Very useful (1) 32.5% 32.1% 37.5% 32.0% 28.8%
Useful (2) 46.2% 46.4% 43.8% 48.0% 55.8%
Moderately useful (3) 13.0% 7.1% 6.3% 12.0% 9.6%
Marginally useful (4) 4.1% 7.1% 6.3% 4.0% 1.9%
Not useful (5) 4.1% 7.1% 6.3% 4.0% 3.8%
Mean 2.012 2.107 2.000 2.000 1.962
Median 2.000 2.000 2.000 2.000 2.000
T-Test 0.486 (0.630) -0.044 (0.966) -0.137 (0.891) -0.459 (0.649)
Wilcoxon Z-Score 0.180 (0.857) -0.352 (0.725) -0.087 (0.931) -0.149 (0.881)
Chi-Square 2.351 (0.671) 1.157 (0.885) 0.232 (0.994) 5.302 (0.258)
FVMDLICR: Fair value (mark-to-model, including own credit risk)
Response FULL DEBT COMMON FINAN SELLSIDE
Can't say/no response 35.5% 14.3% 32.0% 32.4% 33.3%
Very useful (1) 23.1% 26.7% 29.4% 23.2% 23.9%
Useful (2) 42.3% 43.3% 29.4% 43.5% 43.5%
Moderately useful (3) 20.5% 13.3% 23.5% 18.8% 17.4%
Marginally useful (4) 5.8% 3.3% 5.9% 8.7% 8.7%
Not useful (5) 8.3% 13.3% 11.8% 5.8% 6.5%
Mean 2.340 2.333 2.412 2.304 2.304
Median 2.000 2.000 2.000 2.000 2.000
T-Test -0.031 (0.975) 0.241 (0.812) -0.346 (0.730) 0.000 (1.000)
Wilcoxon Z-Score -0.428 (0.668) 0.111 (0.912) -0.229 (0.819) -0.134 (0.893)
Chi-Square 2.646 (0.619) 1.436 (0.838) 3.001 (0.558) 0.310 (0.989)
57
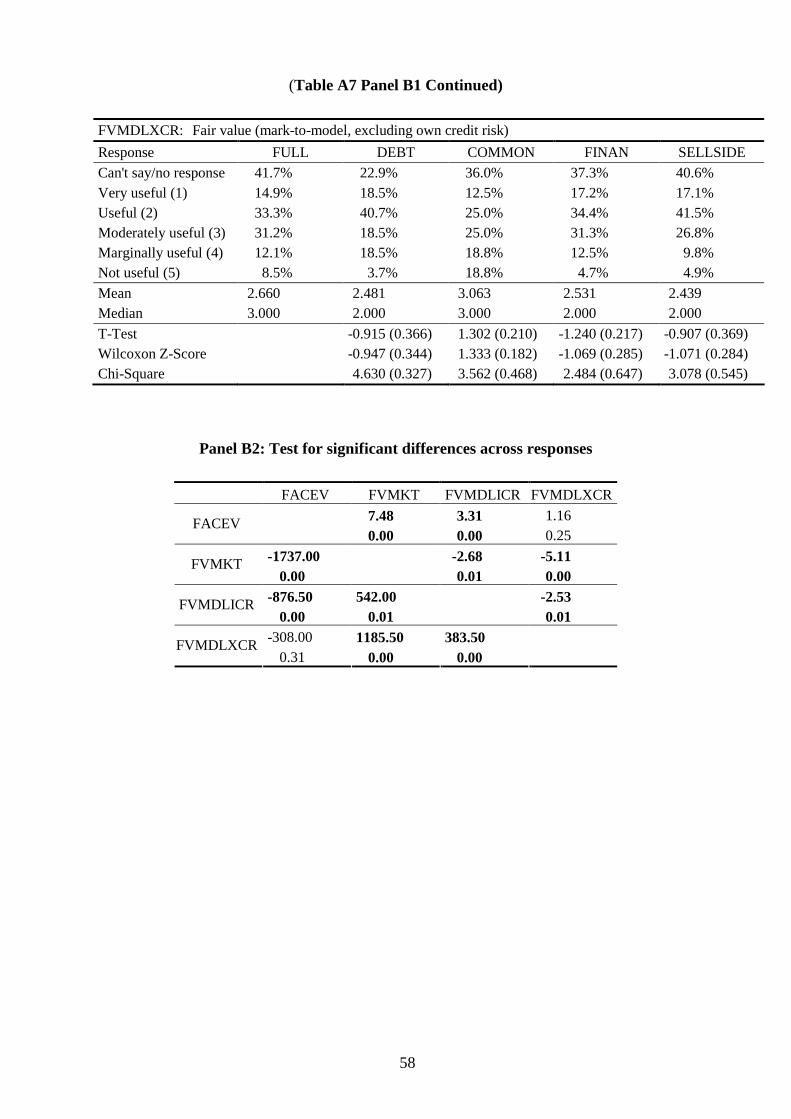
(Table A7 Panel B1 Continued)
FVMDLXCR: Fair value (mark-to-model, excluding own credit risk)
Response FULL DEBT COMMON FINAN SELLSIDE
Can't say/no response 41.7% 22.9% 36.0% 37.3% 40.6%
Very useful (1) 14.9% 18.5% 12.5% 17.2% 17.1%
Useful (2) 33.3% 40.7% 25.0% 34.4% 41.5%
Moderately useful (3) 31.2% 18.5% 25.0% 31.3% 26.8%
Marginally useful (4) 12.1% 18.5% 18.8% 12.5% 9.8%
Not useful (5) 8.5% 3.7% 18.8% 4.7% 4.9%
Mean 2.660 2.481 3.063 2.531 2.439
Median 3.000 2.000 3.000 2.000 2.000
T-Test -0.915 (0.366) 1.302 (0.210) -1.240 (0.217) -0.907 (0.369)
Wilcoxon Z-Score -0.947 (0.344) 1.333 (0.182) -1.069 (0.285) -1.071 (0.284)
Chi-Square 4.630 (0.327) 3.562 (0.468) 2.484 (0.647) 3.078 (0.545)
Panel B2: Test for significant differences across responses
FACEV FVMKT FVMDLICR FVMDLXCR
FACEV 7.48
0.00
3.31
0.00
1.16
0.25
FVMKT -1737.00
0.00
-2.68
0.01
-5.11
0.00
FVMDLICR -876.50
0.00
542.00
0.01
-2.53
0.01
FVMDLXCR -308.00
0.31
1185.50
0.00
383.50
0.00
58
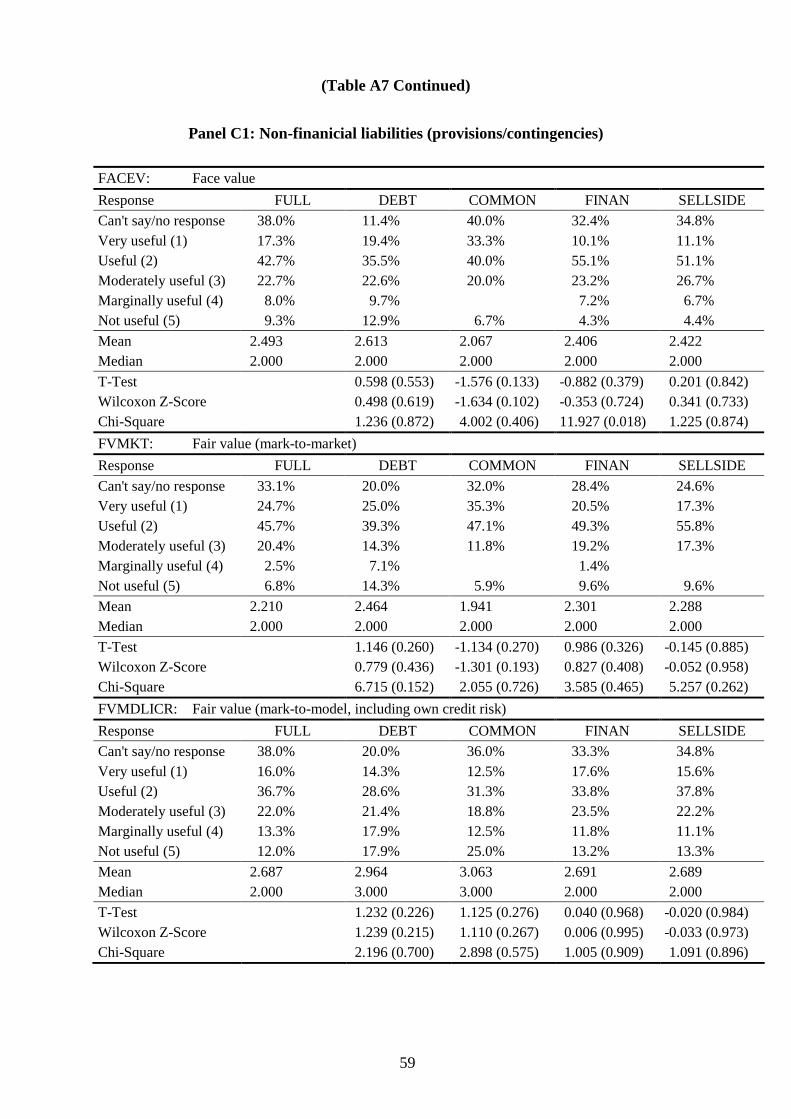
(Table A7 Continued)
Panel C1: Non-finanicial liabilities (provisions/contingencies)
FACEV: Face value
Response FULL DEBT COMMON FINAN SELLSIDE
Can't say/no response 38.0% 11.4% 40.0% 32.4% 34.8%
Very useful (1) 17.3% 19.4% 33.3% 10.1% 11.1%
Useful (2) 42.7% 35.5% 40.0% 55.1% 51.1%
Moderately useful (3) 22.7% 22.6% 20.0% 23.2% 26.7%
Marginally useful (4) 8.0% 9.7% 7.2% 6.7%
Not useful (5) 9.3% 12.9% 6.7% 4.3% 4.4%
Mean 2.493 2.613 2.067 2.406 2.422
Median 2.000 2.000 2.000 2.000 2.000
T-Test 0.598 (0.553) -1.576 (0.133) -0.882 (0.379) 0.201 (0.842)
Wilcoxon Z-Score 0.498 (0.619) -1.634 (0.102) -0.353 (0.724) 0.341 (0.733)
Chi-Square 1.236 (0.872) 4.002 (0.406) 11.927 (0.018) 1.225 (0.874)
FVMKT: Fair value (mark-to-market)
Response FULL DEBT COMMON FINAN SELLSIDE
Can't say/no response 33.1% 20.0% 32.0% 28.4% 24.6%
Very useful (1) 24.7% 25.0% 35.3% 20.5% 17.3%
Useful (2) 45.7% 39.3% 47.1% 49.3% 55.8%
Moderately useful (3) 20.4% 14.3% 11.8% 19.2% 17.3%
Marginally useful (4) 2.5% 7.1% 1.4%
Not useful (5) 6.8% 14.3% 5.9% 9.6% 9.6%
Mean 2.210 2.464 1.941 2.301 2.288
Median 2.000 2.000 2.000 2.000 2.000
T-Test 1.146 (0.260) -1.134 (0.270) 0.986 (0.326) -0.145 (0.885)
Wilcoxon Z-Score 0.779 (0.436) -1.301 (0.193) 0.827 (0.408) -0.052 (0.958)
Chi-Square 6.715 (0.152) 2.055 (0.726) 3.585 (0.465) 5.257 (0.262)
FVMDLICR: Fair value (mark-to-model, including own credit risk)
Response FULL DEBT COMMON FINAN SELLSIDE
Can't say/no response 38.0% 20.0% 36.0% 33.3% 34.8%
Very useful (1) 16.0% 14.3% 12.5% 17.6% 15.6%
Useful (2) 36.7% 28.6% 31.3% 33.8% 37.8%
Moderately useful (3) 22.0% 21.4% 18.8% 23.5% 22.2%
Marginally useful (4) 13.3% 17.9% 12.5% 11.8% 11.1%
Not useful (5) 12.0% 17.9% 25.0% 13.2% 13.3%
Mean 2.687 2.964 3.063 2.691 2.689
Median 2.000 3.000 3.000 2.000 2.000
T-Test 1.232 (0.226) 1.125 (0.276) 0.040 (0.968) -0.020 (0.984)
Wilcoxon Z-Score 1.239 (0.215) 1.110 (0.267) 0.006 (0.995) -0.033 (0.973)
Chi-Square 2.196 (0.700) 2.898 (0.575) 1.005 (0.909) 1.091 (0.896)
59

(Table A7 Panel C1 Continued)
FVMDLXCR: Fair value (mark-to-model, excluding own credit risk)
Response FULL DEBT COMMON FINAN SELLSIDE
Can't say/no response 44.6% 25.7% 36.0% 40.2% 42.0%
Very useful (1) 11.2% 7.7% 12.5% 13.1% 12.5%
Useful (2) 21.6% 19.2% 12.5% 23.0% 25.0%
Moderately useful (3) 38.1% 34.6% 12.5% 37.7% 37.5%
Marginally useful (4) 17.9% 26.9% 37.5% 16.4% 17.5%
Not useful (5) 11.2% 11.5% 25.0% 9.8% 7.5%
Mean 2.963 3.154 3.500 2.869 2.825
Median 3.000 3.000 4.000 3.000 3.000
T-Test 0.965 (0.341) 1.714 (0.104) -0.869 (0.386) -0.394 (0.696)
Wilcoxon Z-Score 1.020 (0.308) 2.060 (0.039) -0.866 (0.387) -0.371 (0.711)
Chi-Square 2.007 (0.734) 10.835 (0.028) 0.790 (0.940) 0.979 (0.913)
Panel C2: Test for significant differences across responses
FACEV FVMKT FVMDLICR FVMDLXCR
FACEV 2.53
0.01
-1.31
0.19
-2.73
0.01
FVMKT -530.00
0.01
-4.51
0.00
-5.75
0.00
FVMDLICR 370.50
0.18
600.50
0.00
-1.78
0.08
FVMDLXCR 664.00
0.01
1107.00
0.00
224.00
0.05
60
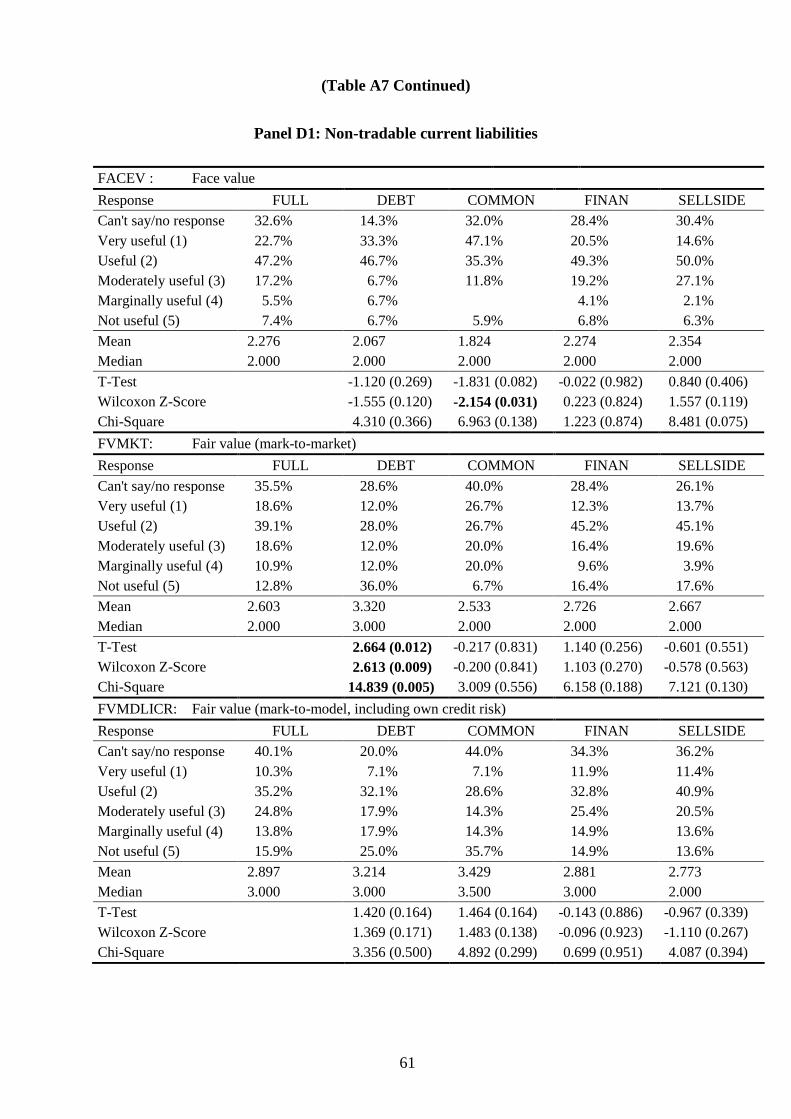
(Table A7 Continued)
Panel D1: Non-tradable current liabilities
FACEV : Face value
Response FULL DEBT COMMON FINAN SELLSIDE
Can't say/no response 32.6% 14.3% 32.0% 28.4% 30.4%
Very useful (1) 22.7% 33.3% 47.1% 20.5% 14.6%
Useful (2) 47.2% 46.7% 35.3% 49.3% 50.0%
Moderately useful (3) 17.2% 6.7% 11.8% 19.2% 27.1%
Marginally useful (4) 5.5% 6.7% 4.1% 2.1%
Not useful (5) 7.4% 6.7% 5.9% 6.8% 6.3%
Mean 2.276 2.067 1.824 2.274 2.354
Median 2.000 2.000 2.000 2.000 2.000
T-Test -1.120 (0.269) -1.831 (0.082) -0.022 (0.982) 0.840 (0.406)
Wilcoxon Z-Score -1.555 (0.120) -2.154 (0.031) 0.223 (0.824) 1.557 (0.119)
Chi-Square 4.310 (0.366) 6.963 (0.138) 1.223 (0.874) 8.481 (0.075)
FVMKT: Fair value (mark-to-market)
Response FULL DEBT COMMON FINAN SELLSIDE
Can't say/no response 35.5% 28.6% 40.0% 28.4% 26.1%
Very useful (1) 18.6% 12.0% 26.7% 12.3% 13.7%
Useful (2) 39.1% 28.0% 26.7% 45.2% 45.1%
Moderately useful (3) 18.6% 12.0% 20.0% 16.4% 19.6%
Marginally useful (4) 10.9% 12.0% 20.0% 9.6% 3.9%
Not useful (5) 12.8% 36.0% 6.7% 16.4% 17.6%
Mean 2.603 3.320 2.533 2.726 2.667
Median 2.000 3.000 2.000 2.000 2.000
T-Test 2.664 (0.012) -0.217 (0.831) 1.140 (0.256) -0.601 (0.551)
Wilcoxon Z-Score 2.613 (0.009) -0.200 (0.841) 1.103 (0.270) -0.578 (0.563)
Chi-Square 14.839 (0.005) 3.009 (0.556) 6.158 (0.188) 7.121 (0.130)
FVMDLICR: Fair value (mark-to-model, including own credit risk)
Response FULL DEBT COMMON FINAN SELLSIDE
Can't say/no response 40.1% 20.0% 44.0% 34.3% 36.2%
Very useful (1) 10.3% 7.1% 7.1% 11.9% 11.4%
Useful (2) 35.2% 32.1% 28.6% 32.8% 40.9%
Moderately useful (3) 24.8% 17.9% 14.3% 25.4% 20.5%
Marginally useful (4) 13.8% 17.9% 14.3% 14.9% 13.6%
Not useful (5) 15.9% 25.0% 35.7% 14.9% 13.6%
Mean 2.897 3.214 3.429 2.881 2.773
Median 3.000 3.000 3.500 3.000 2.000
T-Test 1.420 (0.164) 1.464 (0.164) -0.143 (0.886) -0.967 (0.339)
Wilcoxon Z-Score 1.369 (0.171) 1.483 (0.138) -0.096 (0.923) -1.110 (0.267)
Chi-Square 3.356 (0.500) 4.892 (0.299) 0.699 (0.951) 4.087 (0.394)
61

(Table A7 Panel D1 Continued)
FVMDLXCR: Fair value (mark-to-model, excluding own credit risk)
Response FULL DEBT COMMON FINAN SELLSIDE
Can't say/no response 44.2% 22.9% 40.0% 42.2% 43.5%
Very useful (1) 8.9% 7.4% 13.3% 10.2% 15.4%
Useful (2) 21.5% 22.2% 13.3% 18.6% 25.6%
Moderately useful (3) 34.8% 18.5% 13.3% 35.6% 30.8%
Marginally useful (4) 17.0% 25.9% 20.0% 16.9% 12.8%
Not useful (5) 17.8% 25.9% 40.0% 18.6% 15.4%
Mean 3.133 3.407 3.600 3.153 2.872
Median 3.000 4.000 4.000 3.000 3.000
T-Test 1.242 (0.222) 1.306 (0.210) 0.162 (0.871) -2.846 (0.006)
Wilcoxon Z-Score 1.299 (0.194) 1.577 (0.115) 0.218 (0.828) -2.507 (0.012)
Chi-Square 5.492 (0.240) 7.908 (0.095) 0.649 (0.957) 8.663 (0.070)
Panel D2: Test for significant differences across responses
FACEV FVMKT FVMDLICR FVMDLXCR
FACEV -2.04
0.04
-4.13
0.00
-5.62
0.00
FVMKT 450.00
0.04
-2.96
0.00
-4.54
0.00
FVMDLICR 1048.00
0.00
353.50
0.00
-1.95
0.05
FVMDLXCR 1264.50
0.00
747.50
0.00
184.00
0.01
62
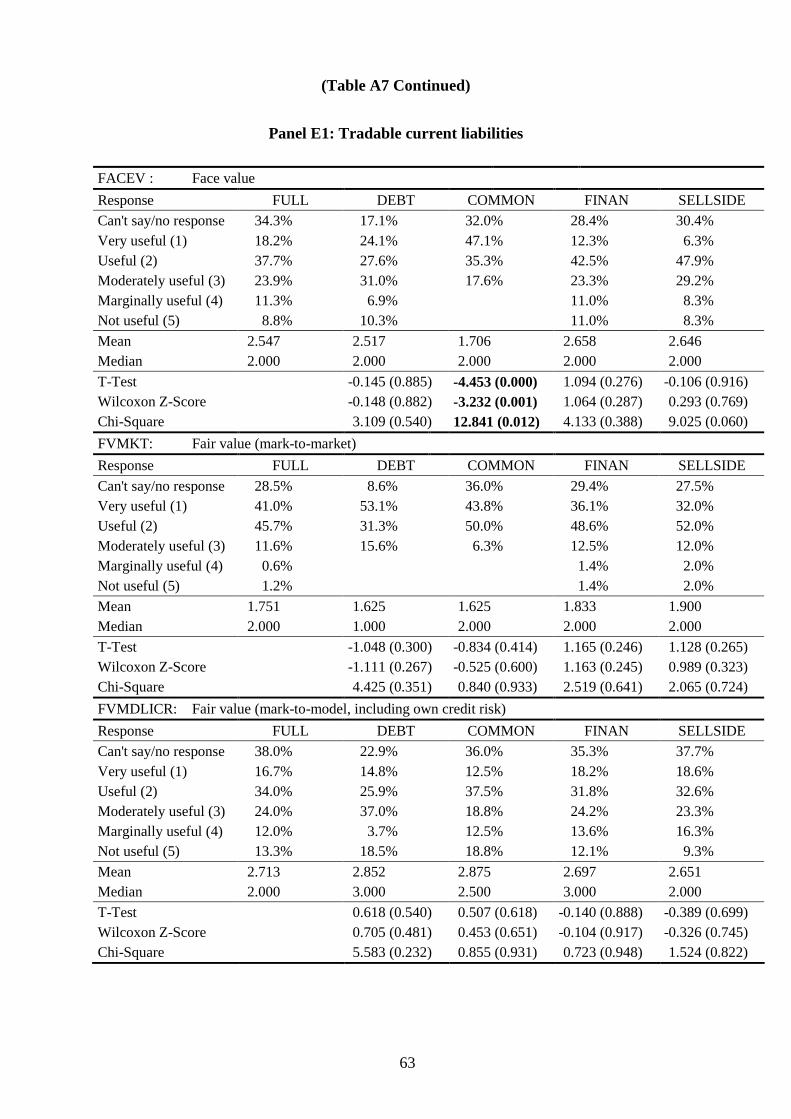
(Table A7 Continued)
Panel E1: Tradable current liabilities
FACEV : Face value
Response FULL DEBT COMMON FINAN SELLSIDE
Can't say/no response 34.3% 17.1% 32.0% 28.4% 30.4%
Very useful (1) 18.2% 24.1% 47.1% 12.3% 6.3%
Useful (2) 37.7% 27.6% 35.3% 42.5% 47.9%
Moderately useful (3) 23.9% 31.0% 17.6% 23.3% 29.2%
Marginally useful (4) 11.3% 6.9% 11.0% 8.3%
Not useful (5) 8.8% 10.3% 11.0% 8.3%
Mean 2.547 2.517 1.706 2.658 2.646
Median 2.000 2.000 2.000 2.000 2.000
T-Test -0.145 (0.885) -4.453 (0.000) 1.094 (0.276) -0.106 (0.916)
Wilcoxon Z-Score -0.148 (0.882) -3.232 (0.001) 1.064 (0.287) 0.293 (0.769)
Chi-Square 3.109 (0.540) 12.841 (0.012) 4.133 (0.388) 9.025 (0.060)
FVMKT: Fair value (mark-to-market)
Response FULL DEBT COMMON FINAN SELLSIDE
Can't say/no response 28.5% 8.6% 36.0% 29.4% 27.5%
Very useful (1) 41.0% 53.1% 43.8% 36.1% 32.0%
Useful (2) 45.7% 31.3% 50.0% 48.6% 52.0%
Moderately useful (3) 11.6% 15.6% 6.3% 12.5% 12.0%
Marginally useful (4) 0.6% 1.4% 2.0%
Not useful (5) 1.2% 1.4% 2.0%
Mean 1.751 1.625 1.625 1.833 1.900
Median 2.000 1.000 2.000 2.000 2.000
T-Test -1.048 (0.300) -0.834 (0.414) 1.165 (0.246) 1.128 (0.265)
Wilcoxon Z-Score -1.111 (0.267) -0.525 (0.600) 1.163 (0.245) 0.989 (0.323)
Chi-Square 4.425 (0.351) 0.840 (0.933) 2.519 (0.641) 2.065 (0.724)
FVMDLICR: Fair value (mark-to-model, including own credit risk)
Response FULL DEBT COMMON FINAN SELLSIDE
Can't say/no response 38.0% 22.9% 36.0% 35.3% 37.7%
Very useful (1) 16.7% 14.8% 12.5% 18.2% 18.6%
Useful (2) 34.0% 25.9% 37.5% 31.8% 32.6%
Moderately useful (3) 24.0% 37.0% 18.8% 24.2% 23.3%
Marginally useful (4) 12.0% 3.7% 12.5% 13.6% 16.3%
Not useful (5) 13.3% 18.5% 18.8% 12.1% 9.3%
Mean 2.713 2.852 2.875 2.697 2.651
Median 2.000 3.000 2.500 3.000 2.000
T-Test 0.618 (0.540) 0.507 (0.618) -0.140 (0.888) -0.389 (0.699)
Wilcoxon Z-Score 0.705 (0.481) 0.453 (0.651) -0.104 (0.917) -0.326 (0.745)
Chi-Square 5.583 (0.232) 0.855 (0.931) 0.723 (0.948) 1.524 (0.822)
63

(Table A7 Panel E1 Continued)
FVMDLXCR: Fair value (mark-to-model, excluding own credit risk)
Response FULL DEBT COMMON FINAN SELLSIDE
Can't say/no response 43.8% 25.7% 40.0% 42.2% 43.5%
Very useful (1) 7.4% 3.8% 6.7% 10.2% 12.8%
Useful (2) 22.8% 23.1% 20.0% 18.6% 23.1%
Moderately useful (3) 37.5% 38.5% 13.3% 37.3% 35.9%
Marginally useful (4) 16.9% 15.4% 20.0% 20.3% 20.5%
Not useful (5) 15.4% 19.2% 40.0% 13.6% 7.7%
Mean 3.103 3.231 3.667 3.085 2.872
Median 3.000 3.000 4.000 3.000 3.000
T-Test 0.634 (0.530) 1.693 (0.110) -0.161 (0.872) -2.002 (0.052)
Wilcoxon Z-Score 0.555 (0.579) 1.862 (0.063) 0.034 (0.973) -1.910 (0.056)
Chi-Square 0.890 (0.926) 9.375 (0.052) 2.876 (0.579) 4.990 (0.288)
Panel E2: Test for significant differences across responses
FACEV FVMKT FVMDLICR FVMDLXCR
FACEV 7.50
0.00
-1.04
0.30
-3.25
0.00
FVMKT -1715.50
0.00
-8.52
0.00
-11.64
0.00
FVMDLICR 252.50
0.33
1297.00
0.00
-3.63
0.00
FVMDLXCR 840.50
0.00
1983.50
0.00
354.50
0.00
64
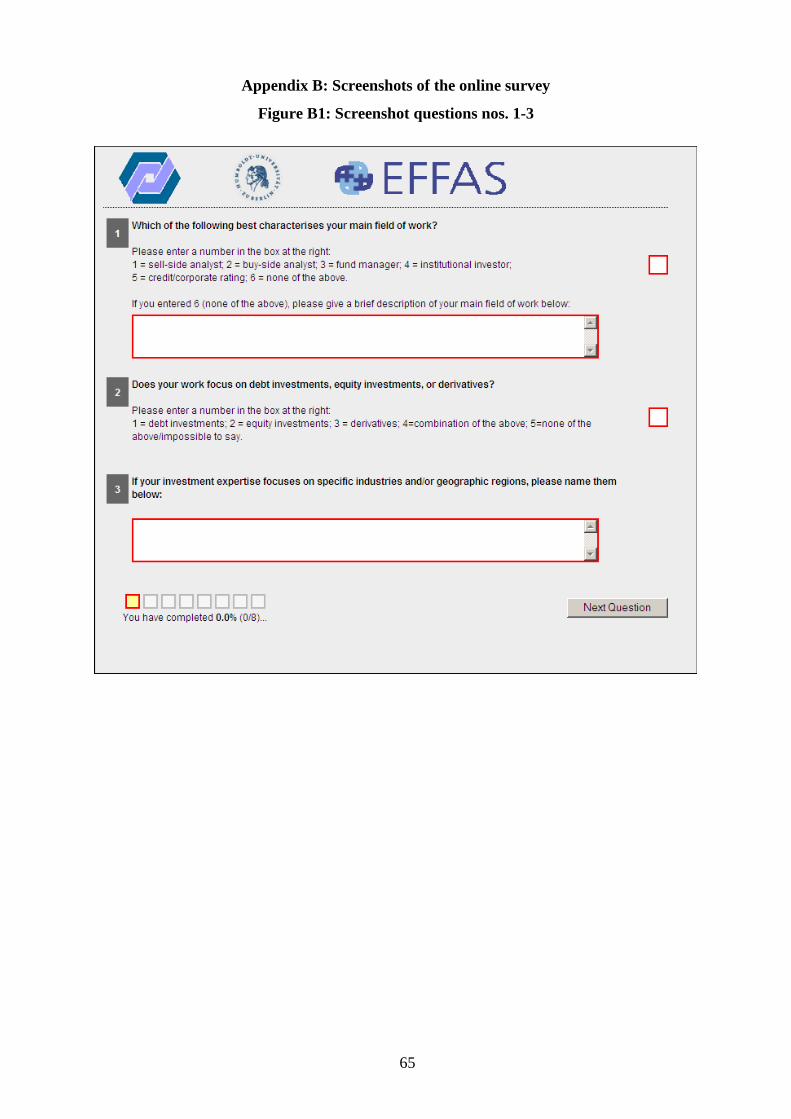
Appendix B: Screenshots of the online survey
Figure B1: Screenshot questions nos. 1-3
65
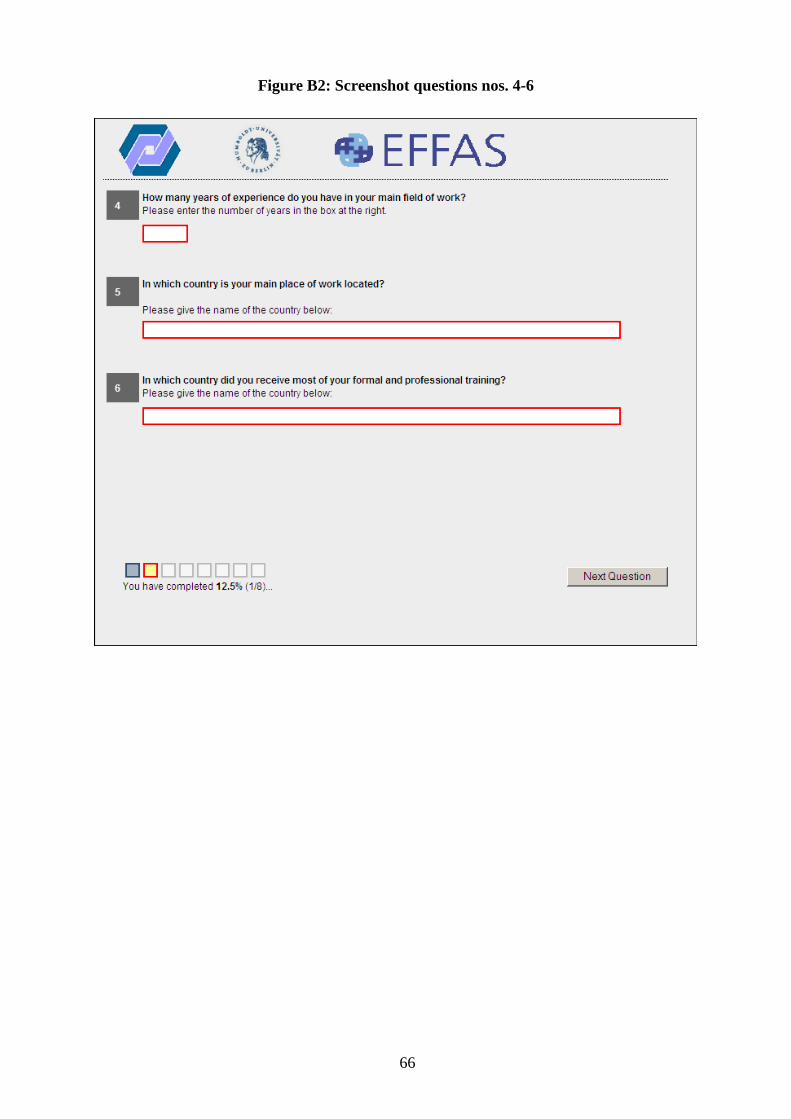
Figure B2: Screenshot questions nos. 4-6
66
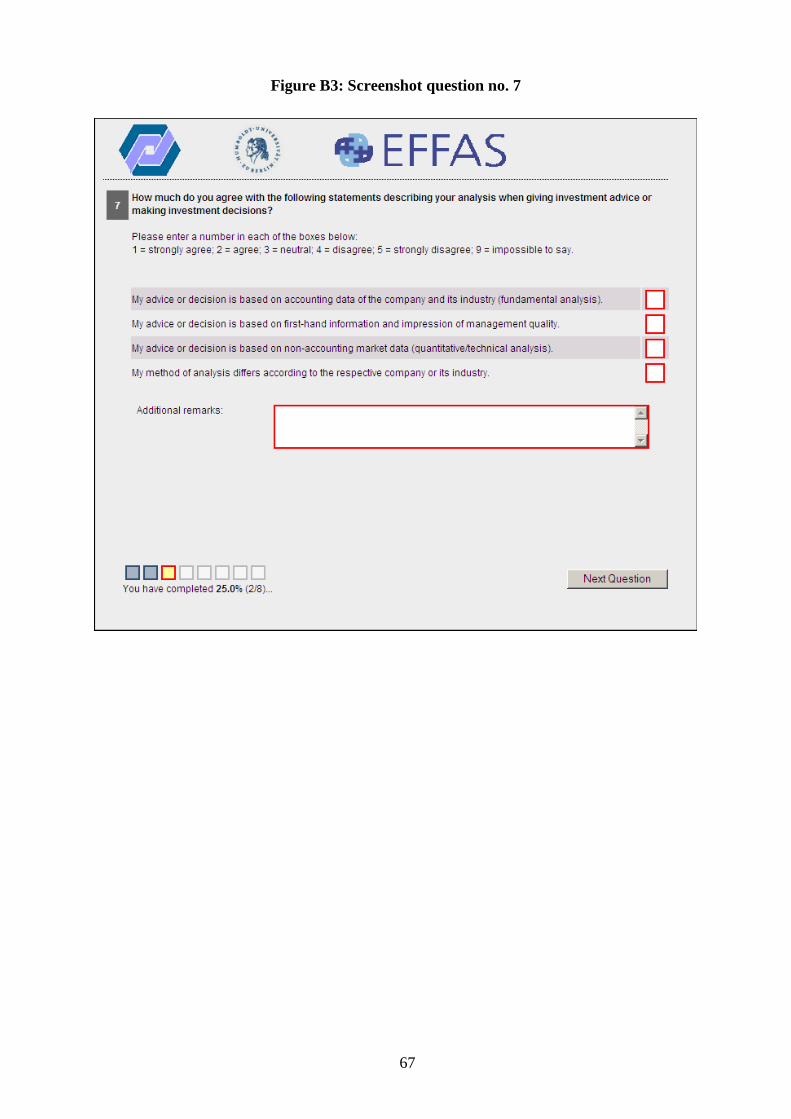
Figure B3: Screenshot question no. 7
67
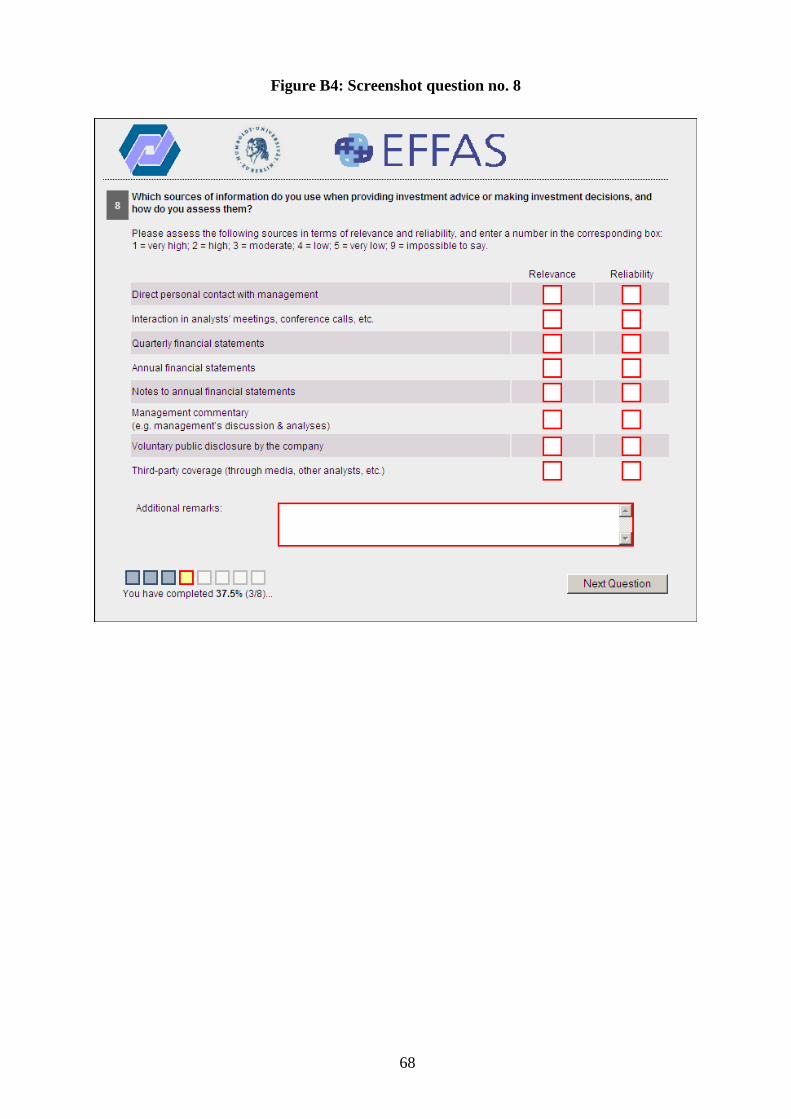
Figure B4: Screenshot question no. 8
68
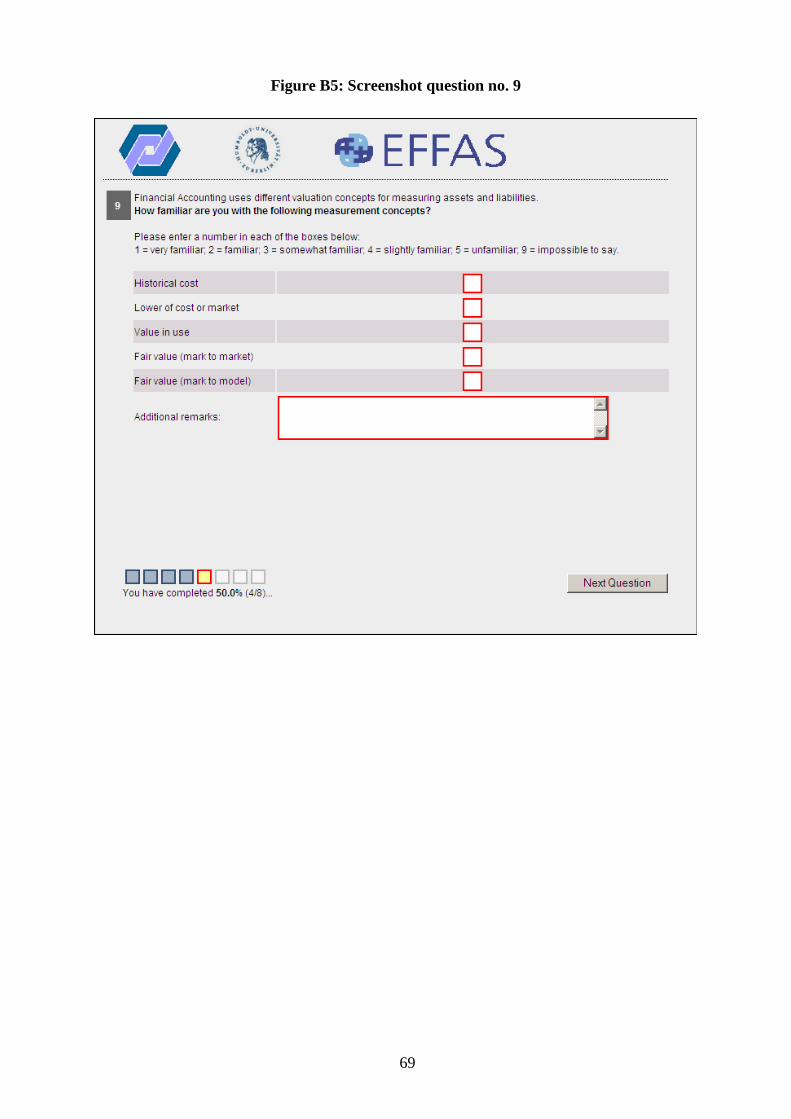
Figure B5: Screenshot question no. 9
69
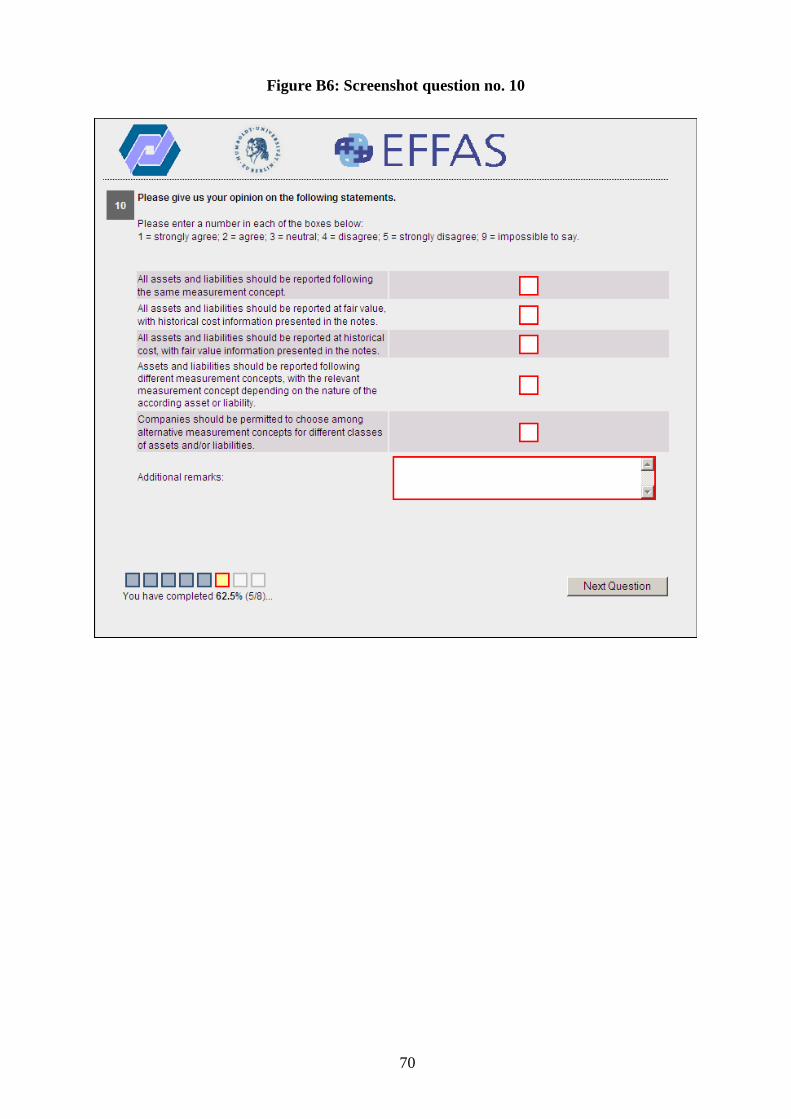
Figure B6: Screenshot question no. 10
70
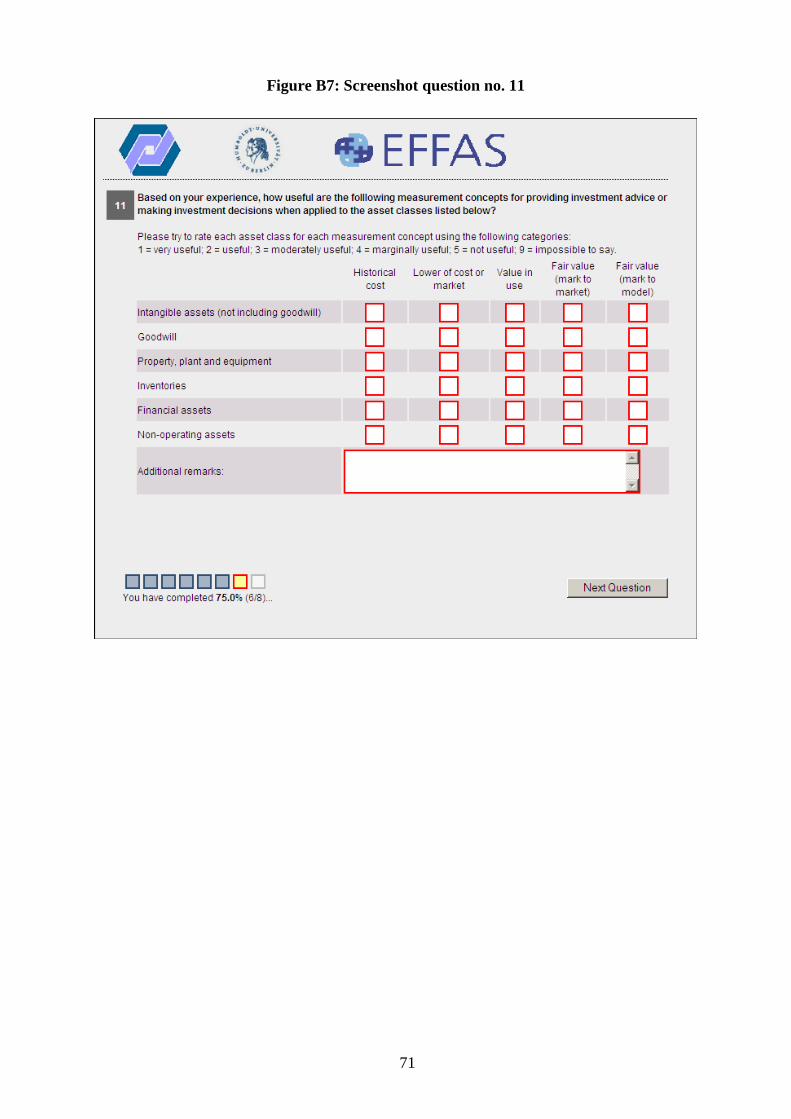
Figure B7: Screenshot question no. 11
71
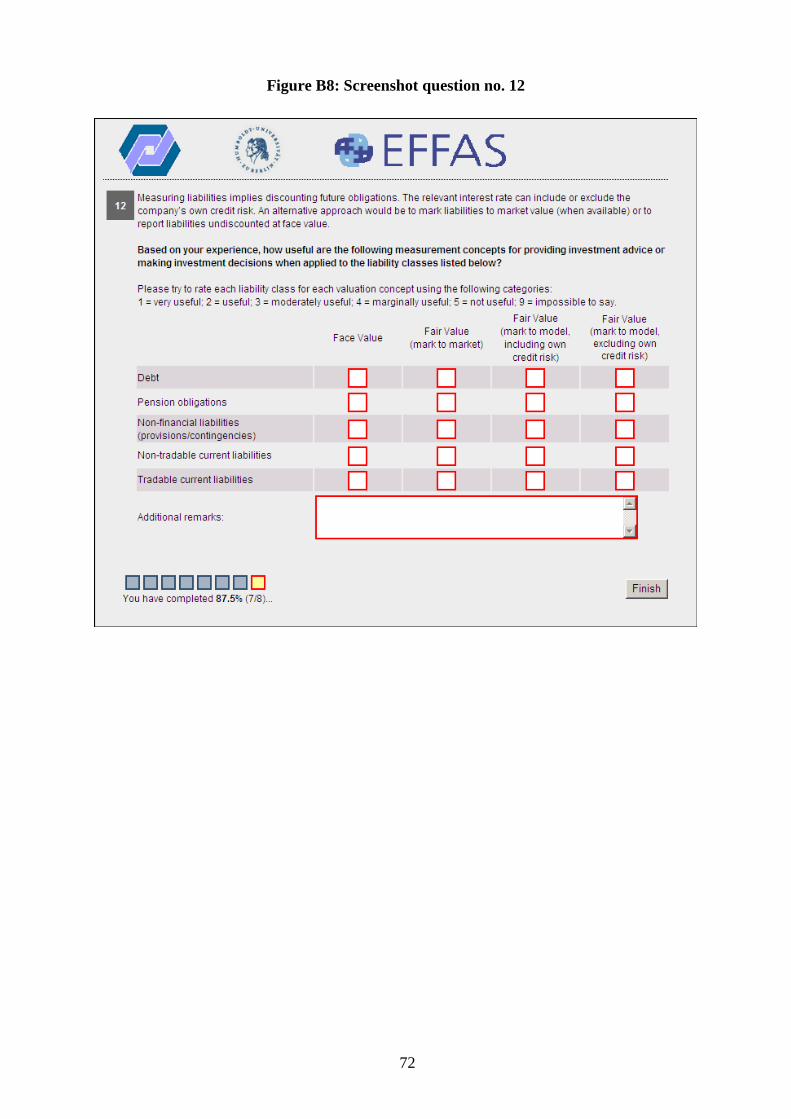
Figure B8: Screenshot question no. 12
72

73