Institute of Crop Science and Rescource Conservation - Phytomedicine
Biological control of leaf pathogens of tomato plants by Bacillus subtilis (strain FZB24):
antagonistic effects and induced plant resistance
Inaugural-Dissertation
zur Erlangung des Grades
Doktor der Agrarwissenschaften
(Dr. agr.)
der
Hohen Landwirtschaftlichen Fakultät
der
Rheinischen Friedrich-Wilhelms-Universität
zu Bonn
vorgelegt am 06.06.2012
von
Muna Sultan
aus
Damaskus, Syrien

II
Referent: Prof. Dr. H.-W. Dehne
Koreferent: Prof. Dr. Karl Schellander
Tag der mündlichen Prüfung: 21.08.2012
Erscheinungsjahr: 2012

III
Dedicated to my beloved bleeding national SYRIA

IV
V
Abstract
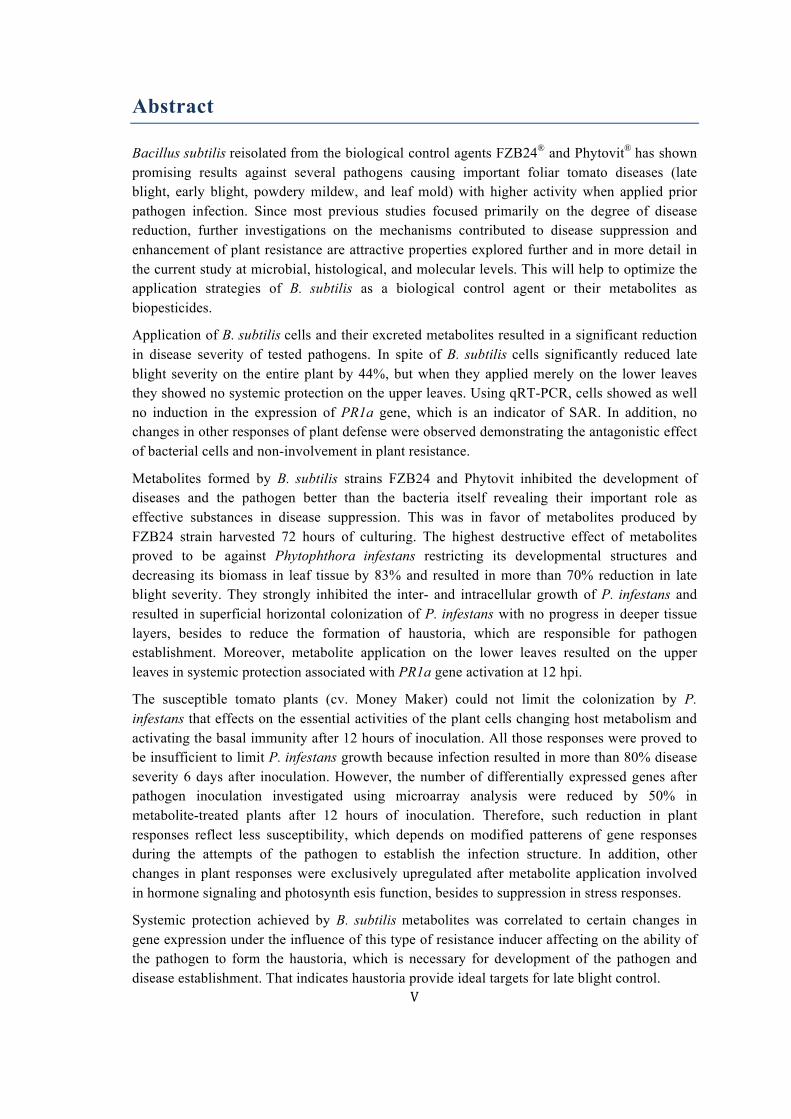
Bacillus subtilis reisolated from the biological control agents FZB24® and Phytovit® has shown promising results against several pathogens causing important foliar tomato diseases (late blight, early blight, powdery mildew, and leaf mold) with higher activity when applied prior pathogen infection. Since most previous studies focused primarily on the degree of disease reduction, further investigations on the mechanisms contributed to disease suppression and enhancement of plant resistance are attractive properties explored further and in more detail in the current study at microbial, histological, and molecular levels. This will help to optimize the application strategies of B. subtilis as a biological control agent or their metabolites as biopesticides.
Application of B. subtilis cells and their excreted metabolites resulted in a significant reduction in disease severity of tested pathogens. In spite of B. subtilis cells significantly reduced late blight severity on the entire plant by 44%, but when they applied merely on the lower leaves they showed no systemic protection on the upper leaves. Using qRT-PCR, cells showed as well no induction in the expression of PR1a gene, which is an indicator of SAR. In addition, no changes in other responses of plant defense were observed demonstrating the antagonistic effect of bacterial cells and non-involvement in plant resistance.
Metabolites formed by B. subtilis strains FZB24 and Phytovit inhibited the development of diseases and the pathogen better than the bacteria itself revealing their important role as effective substances in disease suppression. This was in favor of metabolites produced by FZB24 strain harvested 72 hours of culturing. The highest destructive effect of metabolites proved to be against Phytophthora infestans restricting its developmental structures and decreasing its biomass in leaf tissue by 83% and resulted in more than 70% reduction in late blight severity. They strongly inhibited the inter- and intracellular growth of P. infestans and resulted in superficial horizontal colonization of P. infestans with no progress in deeper tissue layers, besides to reduce the formation of haustoria, which are responsible for pathogen establishment. Moreover, metabolite application on the lower leaves resulted on the upper leaves in systemic protection associated with PR1a gene activation at 12 hpi.
The susceptible tomato plants (cv. Money Maker) could not limit the colonization by P. infestans that effects on the essential activities of the plant cells changing host metabolism and activating the basal immunity after 12 hours of inoculation. All those responses were proved to be insufficient to limit P. infestans growth because infection resulted in more than 80% disease severity 6 days after inoculation. However, the number of differentially expressed genes after pathogen inoculation investigated using microarray analysis were reduced by 50% in metabolite-treated plants after 12 hours of inoculation. Therefore, such reduction in plant responses reflect less susceptibility, which depends on modified patterens of gene responses during the attempts of the pathogen to establish the infection structure. In addition, other changes in plant responses were exclusively upregulated after metabolite application involved in hormone signaling and photosynth esis function, besides to suppression in stress responses.
Systemic protection achieved by B. subtilis metabolites was correlated to certain changes in gene expression under the influence of this type of resistance inducer affecting on the ability of the pathogen to form the haustoria, which is necessary for development of the pathogen and disease establishment. That indicates haustoria provide ideal targets for late blight control.

VI
Kurzfassung
Bacillus subtilis, isoliert aus den biologischen Pflanzenschutzpräparaten FZB24® and Phytovit®, zeigte an Tomaten vielversprechende Wirkungen gegenüber verschiedenen Blattkrankheiten - Braunfäule, Dürrfleckenkrankheit, Echtem Mehltau und Samtfleckenkrankheit- insbesondere wenn die Applikation vor der Infektion mit den Pathogen erfolgte. Während erste Untersuchungen sich vor allem auf das Ausmaß möglicher Befallsreduktionen konzentrierten, wurden im weiteren mit Hilfe von mikrobiologischen, histologischen und molekularbiologischen Methoden die Mechanismen, die die Entwicklung der Krankheiten verhindern und die Resistenz der Pflanzen bedingen können, detailiert untersucht. Dies sollte dazu beitragen, die Applikationsstrategien für B. subtilis als biologisches Pflanzenschutzpräparat oder dessen Metaboliten als Biopestizid zu optimieren.
Die Applikation von Zellen von B. subtilis oder deren ausgeschiedene Metaboliten führten zu signifikanten Verminderungen des Befalls mit Phytophthora infestans, Alternaria solani, Oidium neolycopersicum und Cladosporium fulvum. Die Befallsintensität mit P. infestans der gesamten Pflanze verminderte sich um 45%, wenn Zellen des Bakteriums appliziert wurden, allerdings bewirkten die Behandlung der unteren Blätter der Pflanzen keinen systemischen Schutz höher inserierter Blätter. Mit Hilfe von qRT-PCR wurde nachgewiesen, dass es in diesen Pflanzen nicht zur gesteigerten Expression des Gens PR1a kam, das als Indikator von systemisch induzierter Resistenz (SAR) angesehen wird. Verminderungen des Befalls werden auf antagonistische Effekte zurückgeführt, da auch keine weiteren anderen pflanzlichen Abwehrreaktionen beobachtet wurden. Die Metaboliten, gebildet von den B. subtilis Stämmen FZB24 and Phytovit, hemmten die Entwicklung der Krankheiten und der verschiedenen Pathogene effektiver als die Bakterien selber. Die beste Wirksamkeit zeigten die Metaboliten, die von dem Stamm FZB24 nach 72-stündiger Kulturzeit produziert wurden. Sie verminderten die Entwicklung der Infektionsstrukturen von P. infestans, was zu einer Reduktion der Pathogenbiomasse im Pflanzengewebe von 83% und zu einer Befallreduktion von mehr als 70% führte. Es wurde ein stark eingeschränktes inter- und intrazelluläres Myzelwachstum, vor allem in die tieferen Gewebeschichten, und eine verringerte Ausbildung von Haustorien, die verantwortlich sind für die erfolgreiche Etablierung des Pathogens, beobachtet. Darüber hinaus führte die Applikation der Metaboliten in höher inserierenden Blättern zu systemisch induziertem Schutz, der assoziiert war mit einer gesteigerten Expression des Gens PR1a 12 Stunden nach Inokulation. Die hochanfällige Tomatensorte ‘Money Maker’ war nicht in der Lage, die Besiedlung durch P. infestans zu verhindern, so dass 6 Tage nach Inokulation die Pflanzen eine Befallsintensität von mehr als 80% aufwiesen. Dies ging mit tiefgreifenden Veränderungen der Genexpression der infizierten Pflanzen gegenüber nicht befallenen Pflanzen bereits zu einem sehr frühen Zeitpunkt der Pathogenese einher. Betroffen waren Gene, die in primäre wie auch sekundäre Stoffwechselaktivitäten involviert sind, wie auch in die Aktivierung basaler Abwehrreaktionen 12 Stunden nach Inokulation.
Mit Hilfe von Microarry-Analysen wurde in mit Metaboliten von B. subtilis FZB24 behandelten Pflanzen 12 Stunden nach Inokulation mit P. infestans eine um circa 50% verminderte differentielle Expression von Genen gegenüber unbehandelten Pflanzen nachgewiesen. Diese Reduktion der pflanzlichen Reaktionen spiegelt die geringere Anfälligkeit wider, die auf einem veränderten Muster der Genexpression während der Etablierungsversuche des Pathogen beruht. Darüber hinaus waren nach Behandlung mit den Metaboliten in infizierten Pflanzen Gene, die an Phytohormon-Signalling und Photosynthese beteiligt sind, exklusiv verstärkt exprimiert.
Der systemische Schutz, der durch die Metaboliten von B. subtilis ausgelöst wurde und verbunden war mit Veränderungen der Genexpression, beeinflusste die Fähigkeit des Pathogens, Haustorien zu bilden, die damit ein wichtiges Ziel für die Kontrolle des Pathogens darstellen.

VII
List of abbreviations
ACC. No Gene bank accession number ATP Adenosine triphosphate BLAST Basic local alignment search cDNA Complementary deoxy ribonucleic acid cRNA Complementary ribonucleic acid DBI Day before inoculation DEGs Differentially expressed genes DEPC Diethylpyrocarbonate DMSO Dimethyl sulfoxide DNase Deoxyribonuclease dNTP Deoxynucleotide triphosphate DPI Day post inoculation DTCS Dye terminator cycle sequencing E. coli Escherichia coli EDTA Ethylenediaminetetraacetic acid ESTs Expressed sequence tags FDR False discovery rate GCRMA Guanine cytokine multi array GTP Guanosine triphosphate HPI Hours post inoculation IPTG Isopropyl β-D-1-thiogalactopyranoside IVT In vitro transcription TFGD Tomato Functional Genomics Database LIMMA Linear models for microarray data NAOAc Sodium oxaloacetic acid NCBI National center for biotechnological information RIN Ribonucleic acid integrity number RNase Ribonuclease rpm Rotation per minute SAS Statistical Analysis System SDS Sodium dodecyl sulfate / Sequence detection system SGM Synthesis growth medium SSC Sodium chloride sodium citrate TAE Tris acetate ethylendiamin tetra acetat TE Tris-ethylendiamin-tetra acetat UTP Uracil triphosphate X-gal 5-bromo-4-chloro-3-indolyl-beta-D-galactopyranoside

VIII
CONTENTS
1 INTRODUCTION 1
2 MATERIALS AND METHODS 9
2.1 Plants 9
2.2 Bacteria 9
2.3 Pathogens 9
2.4 Chemicals, kits, and biological materials 9
2.5 Media, buffers, and reagents 12
2.5.1 Culture media 12
2.5.1.1 Growth media for culturing of pathogens 12
2.5.1.2 Growth media for culturing of bacteria 13
2.5.1.3 Growth media for cloning 13
2.5.2 Buffers and reagents 14
2.6 Equipments 15
2.7 Programs (soft wares) and statistical packages used 16
2.8 Plant cultivation 17
2.9 Bacterial culturing and metabolite production 17
2.9.1 Isolation of bacteria from biological control agents 17
2.9.2 Production of bacterial metabolites 17
2.10 Culturing of pathogens 18
2.11 Inoculation 18
2.12 Measurement of pathogen growth and symptom development
parameters
19
2.13 In vivo bioassays with Bacillus subtilis 20
2.13.1 Test on antagonistic effect against different diseases 20
2.13.2 Systemic activity of B. subtilis 20
2.13.2.1 Translaminar translocation 20
2.13.2.2 Apical translocation 21
2.14 In vitro bioassays with Bacillus subtilis 21
IX
2.14.1 Inhibition of mycelial growth 21
2.14.2 Inhibition of spore germination 21
2.15 Microscopical investigations of Bacillus subtilis effects on
pathogen development
22
2.15.1 Light microscopy 22
2.15.2 Specimen preparation techniques 22
2.15.2.1 Glass surface 22
2.15.2.2 Fresh specimen 23
2.15.2.3 Fixed specimen 23
2.15.3 Staining techniques 23
2.15.3.1 Bruzzese and Hasan solution 23
2.15.3.2 Acid Fuchsin 23
2.15.3.3 Diethanol (Uvitex 2B) 24
2.16 Molecular investigations on quantification of Phytophthora
infestans biomass in leaf tissue
24
2.16.1 Growth of P. infestans depending on inoculum concentration 24
2.16.2 Influence of B. subtilis strain FZB24 on P. infestans biomass
throughout the infection course
24
2.16.3 DNA extraction 24
2.16.3.1 DNA extraction from P. infestans 24
2.16.3.2 DNA extraction from tomato leaves 25
2.16.4 Gel electrophoresis analysis 26
2.16.5 SYBR green® real-time PCR reactions 27
2.17 Expression profile of PR1a gene in leaf tissue 29
2.17.1 Experimental design and tissue collection 29
2.17.2 RNA extraction and DNA digestion 30
2.17.3 Synthesis of cDNA 30
2.17.4 Primer design and gene specific amplification 31
2.17.5 Preparation of plasmid DNA 32
2.17.5.1 PCR product extraction, ligation, and transformation 32
2.17.5.2 Blue/White colony secreening and colony picking 32
2.17.5.3 Plasmid isolation 33
X
2.17.5.4 Sequencing 34
2.17.5.5 Preparation of serial dilution from plasmids 35
2.17.6 Quantitative real-time PCR analysis 36
2.18 Microarray analysis of gene expression of tomato leaves 36
2.18.1 Experimental design and tissue collection 36
2.18.2 RNA extraction and DNA digestion 37
2.18.3 Biotin labeled cRNA synthesis 37
2.18.4 Affymetrix array hybridization and scanning 38
2.18.5 Microarray chip description 38
2.18.6 Affymetrix array data analysis 38
2.18.7 Pathways and networks analysis 39
2.18.8 Validation of microarray results using quantitative RT- PCR 40
2.19 Statistical analysis 43
3 RESULTS 44
3.1 Influence of foliar application of bacterial biocontrol agents
FZB24® and Phytovit® on different leaf diseases of tomatoes
44
3.2 Influence of Bacillus subtilis isolated from FZB24® and
Phytovit® on growth of different leaf pathogens
47
3.2.1 Influence of application time of B. subtilis on myclial growth 47
3.2.2 Influence of inoculum density of B. subtilis on myclial growth 47
3.2.3 Influence of B. subtilis on spore germination of different leaf
pathogens
47
3.2.4 Influence of B. subtilis on developmental structures of different
pathogens on tomato leaf surfaces
50
3.2.4.1 Oidium neolycopersici 50
3.2.4.2 Alternaria Solani 50
3.2.4.3 Phytophthora infestans 52
3.3 Evaluating the efficacy of metabolites secreted by Bacillus
subtilis on late blight disease
53
3.4 Influence of cells and metabolites from Bacillus subtilis strain 54

XI
FZB24 on development of late blight and Phytophthora infestans 3.4.1 Effects on colonization of leaves 54
3.4.1.1 Influence on late blight disease development 54
3.4.1.2 Influences on biomass of P. infestans in leaf tissue 56
3.4.1.2.1 Effect of inoculum density of P. infestans on leaf colonization 56
3.4.1.2.2 Influence on biomass of P. infestans over the time of infection 56
3.4.1.3 Influence on development structures of P. infestans 58
3.4.1.3.1 Influence on the germ tube length of P. infestans on different
surfaces
61
3.4.2 Systemic activity of B. subtilis strain FZB24 in tomato plants 62
3.4.2.1 Translaminar translocation 62
3.4.2.2 Apical translocation 63 3.5 Influence of cells and metabolites of Bacillus subtilis strain
FZB24 on expression level of PR1a gene in tomato leaves
65
3.5.1 Expression level of PR1a in non-inoculated leaves 65
3.5.2 Expression level of PR1a in P. infestans-inoculated leaves 65
3.6 Effects of Bacillus subtilis strain FZB24 on gene expression of
infected leaves with Phytophthora infestans
68
3.6.1 Host responses towards P. infestans infection 68
3.6.1.1 Functional classification and pathway analysis 69
3.6.2 Effects of B. subtilis on host responses 76
3.6.2.1 Response in non-inoculated plants 76
3.6.2.2 Response in P. infestans-inoculated plants 77
3.6.2.2.1 Gene expression after cells application 77
3.6.2.2.2 Gene expression after metabolites application 77
3.6.3 Validation of microarray data using quantitative RT-PCR 83
4 DISCUSSION 85
5 SUMMARY 102
6 REFERENCES 106
7 APPENDICES 129
Introduction
1
1 INTRODUCTION
Plant diseases cause severe crop losses and make agriculture highly dependent on
adequate disease control. Managing and controlling plant diseases efficiently is
important for crop growers, environmentalists, legislators, policy maker and
implementers. Disease management strategies primarily depend on sanitary practices
and well-timed pesticides applications. Many plant diseases heavily depends on
agrochemicals and mainly relies on fungicides. These fungicides can prevent infection
but not all have curative activity; therefore the interval between sprayings is usually
short. In addition to the appearances of more aggressive isolates, and isolates that are no
longer inhibited by chemical protectants, hence, the burden on the environment is high.
Subsequently, plant pathogens are responsible for large amounts of chemical fungicides
applied annually exacerbating control strategies (Deahl et al., 1993; Fry et al., 1993;
Niederhauser, 1993). To cope with these problems and due to the increase of public
concern about adverse effects of agrochemicals on food safety and environment, there is
need to stimulate the search for control strategies that are more durable and preferably
based on natural products. Therefore, alternative approaches that can be incorporated
into integrated pest management of plant diseases are needed.
Biological control agents, which include effective microorganisms and microbial
products, and organic fertilizers, have been attracting attention as alternatives to
chemical agents (Fravel, 2005). Many species of Bacillus including B. cereus, B.
subtilis, B. mycoides are known to suppress several pathogens belonging to the genera
Rhizoctonia, Sclerotinia, Fusarium, Gaeummanomyces, Pythium and Phytophthora
(Cook and Baker, 1983; McKnight, 1993; Fiddaman and Rossall, 1994). Several strains
of B. subtilis have been reported that have potential for biological control of several
plant diseases. For example B. subtilis strains 5PVB, B94 and RC-2 against Botrytis
elliptica, a pathogen of lily grey mould, Rhizoctonia seedling disease on soybeans, and
Colletotrichum dematium, mulberry anthracnose fungus, respectively (Bonmatin et al.,
2003; Mukherjee et al., 2005; Stein, 2005). Since the B. subtilis group is considered as
safe and have “generally recognized as safe” status (Emmert and Handelsman, 1999), B.
subtilis have been developed as commercially available biological control agents such
as FZB24® and Phytovit® against soil borne diseases. The use of bacteria strain FZB24
Introduction
2
has been successfully applied to control plant diseases. B. subtilis strain FZB24 is able
to reduce the Fusarium wilt infection on ornamentals (Grosch et al., 1999) and showed
distinctly less attack by P. infestans and by Botrytis cinerea on tomato by up to 50%
reduction in disease severity (Kilian et al., 2000). B. subtilis strain B2g from Phytovit®
is able to suppress soil-borne pathogens e.g. Pythium ultimum, Rhizoctonia solani in the
rhizosphere of plants.
Tomato (Solanum lycopersicum L.) or (Lycopersicon esculentum Mill.) is one of the
most widely grown vegetable food crops in the world, second only to the potato with
world production about 152.9 million ton ($74.1 billion) according to FAOSTAT
Database (2009). Tomato plant is attacked from many serious diseases under
greenhouse and field conditions. Several important diseases of tomato reduce crop yield
and the most devastating plant pathogens are fungi and oomycetes (Agrios, 2005). For
example, the early blight disease caused by Alternaria solani can be severely damaged
incurring a loss of 50 to 80% on tomato susceptible hybrids (Mathur and Shekhawat,
1986). Other important diseases are powdery mildew and leaf mold (Panthee and Chen,
2010). The powdery mildew caused by Oidium neolycopersici is one of the principal
main foliar tomato diseases in greenhouse conditions (Bardin et al., 2008) and affecting
tomato in commercial organic production fields. Powdery mildew damage is increased
when plants are stressed due to heavy fruit load or insufficient water. While, leaf mould
caused by the fungus Cladosporium fulvum (syn. Fulvia fulva), which is in the absence
of control measures large portions of the leaves can be killed resulting in significant
yield reduction (Smith et al., 1969), is one of the most destructive foliar diseases of
tomato grown under humid conditions.
The destructive late blight disease caused by Phytophthora infestans, awaits the tomato
where it is cultivated in moist, cool, rainy, and humid environments. This plant
pathogen is one of the most notorious and devastating organisms in recent human
history, being responsible for the terrible Irish potato (Solanum tuberosum) famine in
the 1840s, and it is arguably the most important pathogen of potatoes and tomatoes
worldwide. The pathogen can cause up to 100% yield losses. And, although this
pathogen (Erwin and Ribeiro, 1996; Govers and Latijnhouwers, 2004) has been
intensively studied by scientists now for close to 150 years, it still continues to cause

Introduction
3
upwards of $7 billion in annual agricultural losses around the globe causing threaten to
food security worldwide.
The devastating economic impact of late blight disease intensified the related pathology
and genetics research. There is, however, an insufficient number of potato and tomato
cultivars with late blight resistance, resulting in continued expensive as well as the
hazardous and increasingly ineffective use of chemicals for disease control. In an era
when both host plants and P. infestans genomes are sequenced and considerable
genomic information is available, it is not unexpected that a more sustainable solution
to controlling late blight is on the horizon. Many of the crucial steps involved in late
blight defense response in host plants have been elucidated through the use of modern
cytological and molecular biology techniques. Also, genetic and biochemical studies
have revealed differences between oomycetes and pathogenic fungi, which has led to
more selective use of chemicals for late blight control. Furthermore, the discovery of P.
infestans two mating types and the resultant generation of more aggressive lineages by
sexual recombination stresses the need for an integrated and sustainable approach to late
blight control. These measures would include the use of cultural practices, selective
fungicide applications, and genetic resistance. Taking into consideration that many
important plant diseases are caused by oomycetes, there is a high demand for novel
agents that specifically target oomycetes; especially that environmental friendly control
of plant disease is an imperative need for agriculture in the 21st century (Emmert and
Handelsman 1999).
To control late blight biologically, several antagonistic agents have been tested for their
activity against P. infestans, including nonpathogenic P. cryptogea (Stromberg and
Brishammar, 1991) and other endophytic microorganisms such as Cellulomonas
flavigena, Candida sp., and Cryptococcus sp. (Lourenço Júnior et al., 2006). Although
some effective fungal antagonists were identified, bacterial antagonists have shown by
far the most promising results to date. Bacteria with antagonistic activities against P.
infestans are mainly found in the genera of Pseudomonas and Bacillus (Sanchez, 1998;
Yan et al., 2002; Daayf et al., 2003; Kloepper et al., 2004).

Introduction
4
Over decades, cyclic lipopeptides (CLPs) produced by Pseudomonas and Bacillus
species have received considerable attention for their activity against a range of
microorganisms, including mycoplasmas, trypanosomes, bacteria, fungi, viruses and
Oomycetes (Nybroe and Sørensen, 2004; Raaijmakers et al., 2006). Lipopeptide
production was demonstrated for Bacillus populations growing on roots, leaves and
fruits (Asaka and Shoda, 1996; Bais et al., 2004; Toure´ et al., 2004; Ongena et al.,
2007; Romero et al., 2007). The members of the Bacillus genus are often considered
microbial factories for the production of a vast array of biologically active molecules
potentially inhibitory for phytopathogen growth. Their ability to form spores also makes
these bacteria some of the best candidates for developing efficient biopesticide products
from a technological point of view. Loeffler (1990) found that the lipopeptides formed
by B. subtilis are released into the medium only at the time of endogenous spore
formation during the stationary phase of the culture. However, Lin et al. (1998) and
Koumoutsi et al. (2004) showed that in artificial media cells in the transition from
exponential phase to stationary phase mostly produce surfactins, which is a very
powerful biosurfactant, while fengycin synthesis is delayed to early stationary phase,
and iturins, exhibiting powerful antifungal activities, accumulate later. These three
substances consist of amino acids and fatty acids as side chains and thus are easily
biodegradable in soil in sharp contrast with persistent chemical pesticides. These three
families of Bacillus lipopeptides are known to act in a synergistic manner as suggested
by several studies on surfactin and iturin (Maget-Dana et al., 1992), surfactin and
fengycin (Ongena et al., 2007) and iturin and fengycin (Koumoutsi et al., 2004; Romero
et al., 2007). Therefore, it is speculated that the mixed production of these substances
and the cooperative function against plant pathogens are the main reasons why B.
subtilis has a wid broad suppressive spectrum against various plant pathogens.
Since numerous studies have shown the potential of the iturin family as alternative
antifangal agents. Leclère et al. (2005) revealed that LPs are important determinants of
biocontrol activity, when he found that overproduction of mycosubtilin, which is a
member of iturin family, by B. subtilis strain BBG100 had significant antagonistic
properties against phytopathogenic fungi, such as Pythium aphanidermatum on tomato
seedlings. In addition, B. subtilis strain FZB24 produces iturin-like lipopeptides such as

Introduction
5
those described by Krebs et al. (1996). Noteworthy, iturin production seems to be
restricted to B. subtilis (Bonmatin et al., 2003) and B. amyloliquefaciens (Koumoutsi et
al., 2004).
Interestingly, recent advances show that these LPs can act not only as ‘antagonists’ or
‘killers’ by inhibiting phytopathogen growth but also as ‘spreaders’ by facilitating root
colonization and as ‘immuno-stimulators’ by reinforcing host resistance potential.
Recent investigations direct attention on the fact that these lipopeptides have a key role
in the beneficial interaction of Bacillus species with plants by stimulating host defense
mechanisms (Ongena and Jacques, 2008).
Although activity and effects of B. subtilis strain FZB24 in soil application have been
reported, the underlying effects and mechanisms of action of its foliar applications
against pathogens causing diseases on plant foliage are not fully understood, in addition
to the relatively few studies of B. subtilis effects against late blight disease. Also, the
little available information and the deficiency in such knowledge often hinder attempts
to optimize the biological activity by employing tailored application strategies. Better
understanding of the interactions between antagonistic agents and plant pathogens is
needed to optimize methods of application.
The life cycle of the heterothallic hemibiotrophic oomycete P. infestans (Mont.) de
Bary differentiates into many cell types involved in sexual and asexual reproduction,
propagule dispersal, spore germination, host penetration, and biotrophic or necrotrophic
phases of infection. Germination becomes possible once sporangia detached from
sporangiophores encounter liquid. While, indirect germination predominates in the
absence of nutrients and at cool temperatures, typically below 12°C (Ribeiro, 1983), the
direct germination is favoured by higher temperatures and nutrients. Germination takes
about one hour and involves the cleavage of sporangial cytoplasm into multiple
zoospores displaying several tactic behaviours (Deacon and Donaldson, 1993; Hill,
1998) until encystment occurs in response to chemical or physical stimulation (Griffith
et al., 1988). Cysts subsequently elaborate a germ tube that swells to form appressorium
for host epidermal cell penetration.
Introduction
6
After breaching the plant cuticle and cell wall, an intracellular, biotrophic infection
vesicle is produced in the epidermal cell. Afterwards, the pathogen grows well
intercellularly and then intracellularly (Coffey and Wilson 1983). The hyphae grow
intercellularly into the mesophyll cell layers and produce haustoria, as new host cells
are encountered and well establishment of the biotrophic phase of interaction. During
the first hours of the interaction with potato, the first cells involved in the interaction die
and host cells remain apparently unaffected by P. infestans, but within three to five
days, the dead cells at the initial penetration site produce characteristic macroscopic
symptoms. While necrotic lesions develop even in highly compatible interactions
between potato and P. infestans, an extended period of biotrophy occurs during the
interaction between tomato and certain isolates of P. infestans (Berg 1926; Vega-
Sanchez et al., 2000). This interaction results in rapid growth of the pathogen and can
lead to severe epidemics.
Macro- and microscopic observations have provided a fairly complete phenotypic
description of this hemibiotrophic interaction, but there have been relatively few studies
of gene expression during the compatible interaction (Dellagi et al., 2000; Beyer et al.,
2001). Upon pathogen infection, once extracellular pathogen-associated molecular
patterns (PAMPs) are recognised by plant transmembrane pattern recognition receptors
(PRRs), basal defense responses in the host plant are activated (Nürnberger et al., 2004;
Zipfel and Felix, 2005).
The terminal step in the defense-signaling cascade is the activation of defense genes,
called pathogenesis-related (PR) genes that encode PR-proteins, which are highly
correlated with acquired resistance (Ward et al., 1991; Uknes et al., 1992). Systemic
acquired resistance (SAR) is one of the most widely studied mechanisms resulting in a
defense response against a broad spectrum of pathogens throughout the plant (Ryals et
al., 1994; Sticher et al., 1997). Since, SA-dependent pathways (SAR) seem to be
involved in defense mechanisms against biotrophic pathogens and lead to
hypersensitive response (HR) and/or local resistance (Durrant et al., 2004), SAR was
exhibited in tomato plants against late blight disease in studies accomplished by Cohen
et al. (1994) and Stierl et al. (1997) and exhibited as well as a result of inoculating the
lower leaves of tomato with P. infestans (Heller and Gessler, 1986) or with tobacco
Introduction
7
necrosis virus (TNV) (Anfoka and Buchenauer, 1997). Therefore, expression level of
PR1a gene, which have been frequently used as marker genes for SAR in many plant
species, such as tobacco, Arabidopsis, and rice (Ward et al., 1991; Friedrich et al.,
1996; van Loon and van Strien, 1999; Agrawal et al., 2001), was followed to determine
if its induction is correlated with the systemic protection achieved by B. subtilis cells or
metabolites applied prior P. infestans inoculation.
Phytophthora species, like many pathogens, secrete effector proteins (Catanzariti et al.,
2006; Kamoun, 2006; Whisson et al., 2007) that alter host physiology and facilitate
colonization. Part of P. infestans success is accounted for by its biological lifestyle and
remarkable capacity to rapidly adapt to overcome the resistance in plants (McDonald
and Linde, 2002). The pathogen has developed mechanisms to overcome detection by
release effectors into plant cells, which interfere with signaling cascades and thereby
abolish basal defense response in susceptible host. As part of these mechanisms, genes
have to be temporally and spatially regulated. Several previous studies focusing on
potato genes regulated during colonization by P. infestans demonstrated that the attack
of P. infestans leads to transcriptional activation of various genes (Zhu et al., 1995;
Avrova et al., 1999; Beyer et al., 2001; Collinge and Boller, 2001; Restrepo et al.,
2005; Tian et al., 2006). Herein, to explore the molecular features of plant
susceptibility to infection caused by P. infestans, changes in the tomato transcriptome at
the stage of haustorium formation involved in establishment of the pathogen, were
examined. Since, the molecular characteristics of host cell responses at this particular
infection step are not well understood, knowledge of the early host cell alterations
generated in response to attack by this virulent pathogen might lead to a better
understanding of the molecular processes involved in tomato infection, as well as
potentially contributing to the development of biotechnological strategies for the fight
against this disease by identifying the process involved in pathogen inhibition as a result
of applying B. subtilis cells and metabolites.
Hypothesis
Since, most studies of the biological control agent B. subtilis have focused primarily on
the degree of disease reduction, in the current study further investigations were carried

Introduction
8
out on the mechanisms of suppression have not been as extensively investigated,
hypothesizing the involvement of bacterial cells and metabolites in elevation of host
resistance to suppress late blight disease in addition to their direct effect. Therefore, the
present study, which shows the various effects produced by B. subtilis and their secreted
metabolites on pathogen and disease development and the proposed mechanisms for
those effects as well as the interactions between the antagonist, the plant, and the
pathogen, is to answer the following questions in order to optimize the application
strategies:
Ø Is foliar application able to induce protection in tomato plants or inhibit the
foliar pathogens?
Ø What is the mode of action of the cells and metabolites?
Ø Does the protection of the plants depend on alterations in gene expression?

Materials and Methods
9
2 MATERIALS AND METHODS
2.1 Plants
Tomato plants (Lycopersicum esculentum Mill.) of the highly susceptible cv. Money
Maker were used for all experiments.
2.2 Bacteria
Two commercial bacterial biological control agents Phytovit® and FZB24®
(PROPHYTA Biologischer Pflanzenschutz GmbH, FZB Biotechnik GmbH, Germany)
were used to determinate their effects against different pathogens of tomato plants.
Bacillus subtilis B2g strain Phytovit with the concentration of 1.25 × 10¹⁰ viable
endospores per gram and Bacillus subtilis strain FZB24 consisting of 5 × 10¹⁰
endospores per gram were the two tested strains.
2.3 Pathogens
Phytophthora infestans (Mont.) de Bary late blight
Alternaria solani (Ellis et Martin) Sorauer early blight
Oidium neolycopersici Cooke et Masse powdery mildew
Cladosporium fulvum Cooke leaf mold
2.4 Chemicals, kits, and biological materials
Chemicals or biological materials Manufacturer/Supplier
10x PCR buffer Promega, WI, USA
2-Mercaptoethanol Sigma-Aldrich Chemie GmbH, Munich,
Germany
2x rapid ligation buffer Promega, WI, USA
5x First-Stand buffer Invitrogen Life Technologies, Karlsruhe,
Germany
Acetic acid Roth, Karlsruhe, Germany
Materials and Methods
10
Agar-Agar Roth, Karlsruhe, Germany
Agarose Sigma-Aldrich Chemie GmbH, Munich,
Germany
Ampicillin Roth , Karlsruhe, Germany
Bromophenol blue Roth, Karlsruhe, Germany
Calcium chloride Sigma-Aldrich Chemie GmbH, Munich,
Germany
Chloroform Roth , Karlsruhe, Germany
Dimethyl sulfoxide (DMSO) Roth , Karlsruhe, Germany
DNase I, EDTA Invitrogen, Karlsruhe, Germany
dNTPs Roth , Karlsruhe, Germany
DTT Invitrogen Life Technologies, Karlsruhe,
Germany
Dye terminator cycle sequencing
(DTCS)
Beckman Coulter, Krefeld, Germany
E. coli competent cells Stratagene, Amsterdam, The Neatherlands
Ethanol Roth, Karlsruhe, Germany
Ethidium bromide Roth, Karlsruhe, Germany
Ethylenediaminetetra acetic acid
(EDTA)
Roth , Karlsruhe, Germany
Eukaryotic poly-A RNA control kit Affymetrix, CA, USA
ExoSAP-IT USB, Ohio, USA
FZB24® FZB Biotechnik GmbH, Germany
GenEluteTM plasmid mini prep kit Sigma-Aldrich, St.Lous, MO, USA
Glycogen for sequencing Beckman Coulter, Krefeld, Germany
High-Capacity cDNA Reverse
Transcription Kits
Applied biosystems, CA, USA
Hydrochloric acid Roth, Karlsruhe, Germany
Isopropyl -D-thiogalactoside (IPTG) Roth, Karlsruhe, Germany
iTaq SYBR Green Supermix with ROX Bio-Rad laboratories, Munich, Germany
Leadder 100 pb Promega, WI, USA
Magnesium chloride Sigma-Aldrich Chemie GmbH, Munich,
Materials and Methods
11
Germany
MEGAscript® T7 Kit Applied Biosystems, CA, USA
Mineral oil Sigma-Aldrich Chemie GmbH, Munich,
Germany
NucleoSpin® 8 RNA Kit Machery-Nagel GmbH & Co. KG, Düren,
Germany
NucleoSpin® RNA purification Kit Machery-Nagel GmbH & Co. KG, Düren,
Germany
Oligonucleotide primers MWG Biotech, Eberberg, Germany
Penicillin Sigma-Aldrich Chemie GmbH, Taufkirchen,
Germany
Pepton Roth , Karlsruhe, Germany
pGEM®-T vector Promega, WI, USA
Phytovit® PROPHYTA Biologischer pflanzenschutz
GmbH, Germany
Potassium chloride Sigma-Aldrich Chemie GmbH, Munich,
Germany
Potato dextrose agar Merck, Darmstadt, Germany
Primers Biomers.net GmbH, Ulm, Germany
QIAquick PCRTM Purification Kit Qiagen, Hilden, Germany
Random primer Promega, WI, USA
Ribo-nuclease inhibitor (RNasin) Promega, WI, USA
RNA 6000 Nano LabChip® Kit Agilent Technologies Inc, CA, USA
RNeasy plant mini kit Qiagen, Hilden, Germany
RQ1 RNase-free Dnase Promega, Madison, WI, USA
Sample loading solution (SLS) Beckman Coulter, Krefeld, Germany
Sodium acetate Roth , Karlsruhe, Germany
Sodium chloride Roth , Karlsruhe, Germany
Sodium dodecyl sulfate (SDS) Sigma-Aldrich Inc, MO, USA
Sodium pyruvate Sigma-Aldrich Inc, MO, USA
Superscript II reverse transcriptase Invitrogen, CA, USA
SYBR® Green Jump startTM Sigma-Aldrich Chemie GmbH,

Materials and Methods
12
Taq Ready MixTM Steinheim, Germany
T4 DNA ligase Promega, WI, USA
Taq DNA polymerase Sigma-Aldrich Inc, MO, USA
Tomato juice agar EDEKA bio, Germany
Tris Roth ,Karlsruhe, Germany
X-Gal (5-bromo-4-chloro-3-indolylbeta-
Dgalactopyranoside)
Roth, Karlsruhe, Germany
Yeast extract Roth, Karlsruhe, Germany
2.5 Media, buffers, and reagents
2.5.1 Culture media
The following media were used for isolation and in vitro tests. The stated recipes are per
liter of distilled water. The culture media were autoclaved at 121°C for 20 minutes at 1
bar pressure allowed to cool to about 55°C and dispensed into 9 cm diameter disposable
petri dishes.
2.5.1.1 Growth media for culturing of pathogens
Potato dextrose agar (PDA, Merck, Darmstadt, Germany)
Potato dextrose agar 39 g
Aqua. dest. H2O 1000 mL
Tomato juice agar (TA, EDEKA bio, Germany)
Potato dextrose broth (DifcoTM, France) 12.8 g
Agar 21.3 g
CaCO3 3 g
Tomato juice 200 mL
Aqua. dest. H2O 800 mL
In case of contamination, the following ingredients were used:
Ampicillin 50 mg
Ensofloxacin 20 mg
Materials and Methods
13
Rifampicin 50 mg
2.5.1.2 Growth media for culturing of bacteria
Synthetic Growth Medium (SGM) (Schlegel, 1976)
Na2HPO4.2 H2O 0.50 g
NH4Cl 0.60 g
KH2PO4 0.29 g
NaCl 0.10 g
MgSO4.7 H2O 0.20 g
CaCO3 0.022 g
D(+)-Sucrose 5 g
Yeast extracts 0.5 g
Iron citrate solution (3.8 m M) 5 mL
Trace element solution 1 mL
Aqua dest. H2O 1000 mL
To solidify the medium 20 g of agar was added to it. The PH value of SGM medium
was adjusted to 7.8 with NaOH 3 M before autoclaving with the help of pH meter.
Ingredients of trace element solutions
ZnSO4.7 H2O 0.10 g
MnCl2.4 H2O 0.03 g
H3BO3 0.30 g
COCl2.6 H2O 0.20 g
CuSO4.5 H2O 0.015 g
NiCl2.6 H2O 0.02 g
Na2MoO4.2 H2O 0.03 g
Aqua dest. H2O 1000 mL 2.5.1.3 Growth media for cloning
LB-agar Sodium chloride 8.0 g
Peptone 8.0 g
Yeast extract 4.0 g
Materials and Methods
14
Agar-Agar 12.0 g
Sodium hydroxide (40 mg/ml) 480.0 µl
ddH2O added to 800.0 ml
LB-broth Sodium chloride 8.0 g
Peptone 8.0 g
Yeast extract 4.0 g
Sodium hydroxide (40 mg/ml) 480.0 µl
ddH2O added to 800.0 ml
2.5.2 Buffers and reagents
All solutions used in these investigations were prepared with deionized Millipore water
(ddH2O) and pH was adjusted with sodium hydroxide (NaOH) or hydrochloric acid
(HCl). During this experiment, the following reagents and media formulation were used.
DEPC-treated water Diethylpyrocarbonate 1 ml
added to water 1000 ml
TAE (50x) buffer, pH 8.0 Tris 242.0 mg
Acetic acid 57.1 ml
EDTA (0.5 M) 100.0 ml
ddH2O added to 1000.0 ml
X-gal X-gal 50.0 mg
N, N’-dimethylformamide 1.0 ml
Agarose loading buffer Bromophenol blue 0.0625 g
Xylencyanol 0.0625 g
Glycerol 7.5 ml
ddH2O added to 25 ml
IPTG solution IPTG 1.2 g
ddH2O added to 10.0 µl
3M Sodium Acetate, pH 5.2 Sodium Acetate 123.1 g
ddH2O added to 500 ml
1M EDTA, pH 8.0 EDTA 37.3 g

Materials and Methods
15
ddH2O added to 1000 ml
Phenol Chloroform Phenol : Chloroform 1 : 1 (v/v)
SDS solution Sodium dodecylsulfat in ddH2O 10% (w/v)
2.6 Equipments
Equipment Manufacturer
ABI PRISM® 7000 SDS Applied Bio systems, Foster city, USA
Affymetrix®GeneChip Fluidics Station 450 Affymetrix, CA, USA
Affymetrix®GeneChip Hybridization
oven 640
Affymetrix, CA, USA
Affymetrix®GeneChip™3000 scanner Affymetrix, CA, USA
Agilent 2100 bioanalyzer Agilent Technologies , CA, USA
Centrifuge Z 200 Hermle, Wehing
CEQTM 8000 Genetic Analysis system BeckmanCoulter,Krefeld, Germany
Electrophoresis (for agarose gels) BioRad, Munich, Germany
GeneChip® Tomato Genome Array Affymetrix, CA, USA
Incubator Heraeus, Hanau, Germany
Inverted fluorescence microscope DM IRB Leica Microsystems, Wetzlar, Germany
Leica Stereomicroscope SMZ 16 F Leica Microsystems, Wetzlar, Germany
Lyovac GT2 freeze dryer lyophilizer Leybold Heraeus, Cologne, Germany
Millipore apparatus Millipore corporation, USA
My Cycler Thermal cycler Bio-RadLaboratories, CA, USA
Nanodrop 8000 Spectrophotometer Thermo Fisher Scientific, Wilmington,
DE, USA
pH meter Kohermann, Germany
Power supply PAC 3000 Biorad, Munich, Germany
Rigid thin wall 96 X 0.2 ml skirted
microplates for real-time PCR
STARLAB GmbH, Ahrensburg, Germany
Savant SpeedVac® TeleChem International, Sunnyvale, USA
Shaker (Certomat) Braun Biotech, Melsungen, Germany
SHKE6000-8CE refrigerated Stackable Thermoscinentific, IWA, USA

Materials and Methods
16
Shaker
Thermal incubator Memmert, Schwabach, Germany
Thermalshake Gerhardt John Morris scientific, Melbourne;
Australia
Tuttnauer autoclave Connections unlimited, Wettenberg,
Germany
Universal centrifuge Z233 MK Hermle Labortechnik, Wehingen,
Germany
2.7 Programs (soft wares) and statistical packages used
Programs (soft wares)
and statistical packages
Source of the programs (soft wares)
and statistical packages
GeneChip® Operating System Affymetrix, CA, USA
R statistical computing and graphics
software
http://www.r-project.org/
Bioconductor packages http://www.bioconductor.org/
Library (affy), Library (marray)
Library (GCRMA), Library (LIMMA)
Library (sma), Library (anotate)
Library (gostats), Library (Go)
Library (qualityMetrix), Library (gplots)
SAS (version 9.2) SAS Institute Inc., NC, USA
Tomato Functional Genomics Database
(TFGD)
(Fei et al., 2011)
Mapman (ver. 3.5.1) (Thimm et al., 2004)
Entrez Gene http://www.ncbi.nlm.nih.gov/sites/entrez?db=gene
EndNote X4 Thomoson
Primer 3 (version 4) http://frodo.wi.mit.edu/primer3/
BLAST program A265 http://blast.ncbi.nlm.nih.gov/Blast.cgi
Prism for windows (ver.5.0) GraphPad software, Inc.

Materials and Methods
17
2.8 Plant cultivation
Tomato seeds were cultivated in a tray filled with Klassmann® potting substrate
(Klassmann-Deilmann, Geeste, Germany). Two weeks after germination the seedlings
were transferred to 11 cm diameter plastic pots (one plant per pot). Seedlings were
grown on greenhouse benches at 18 to 24°C and 16 h light photoperiod for 4-6 weeks.
2.9 Bacterial culturing and metabolite production
2.9.1 Isolation of bacteria from biological control agents
One gram from each product FZB24® and Phytovit® was dissolved in 5 mL of sterile
distilled water (SDW) and 100 µL of the suspension was streaked on synthetic growth
medium SGM (Schlegel, 1976). The plates were incubated for 3 days under room
temperature. Bacterial cells were recovered from the plates using 10 mL sterile distilled
water to obtain pure culture for in vitro bioassays. The suspension was passed through
muslin cloth to get pure solution without any debris. The number of bacterial cells per
milliliter was counted using counting chamber (Thoma). For the tests, different
concentrations of bacterial suspension (ranging from 104 to 107 cells mL-1) were
prepared.
2.9.2 Production of bacterial metabolites
To harvest the metabolites, the re-isolated bacterial cells were grown in broth medium
of SGM (Schlegel, 1976) on a rotary shaker at 130 rpm min-1 for 72 hours at 30°C, final
O.D.480 approximately 1.5. Subsequently, the broth was centrifuged at 5000 xg for 15
min at 20°C, filtered through a sterile 0.2 µm nylon filter, and used as metabolites
suspensions and called M72. A part of M72 was autoclaved for 20 min at 121°C to
verify the stability of effectiveness of the ingredients and was called (M72heated). The
pellets containing the cells were washed twice and re-suspended in water and shook
over one hour and then centrifuged and filtered as previously. The resulting metabolites
were called (M1). The obtained pellets again were re-suspended in water and incubated
under room conditions for 24 hours. The solution was centrifuged and filtered as
previous and was called (M24). The pellet of bacterial cells, which is called in all
experiments cell-treatment, was finally re-suspended in water and the concentration was
Materials and Methods
18
adjusted to 108-109 cells mL-1. Broth medium without bacteria was used once as a
control to be sure that it has no effect on pathogen development.
2.10 Culturing of pathogens
Alternaria solani and Cladosporium fulvum were cultured on potato dextrose agar for
10 days in darkness at 21°C. Spores were harvested by washing the mycelium with
sterile distilled water and lightly scraping with spatula to dislodge the spores. The
suspension was passed through double-layered cheesecloth and the desired
concentration spore mL-1 was prepared for the inoculum using a Fuchs-Rosenthal
hemocytometer.
Phythophthora infestans (Mont.) de Bary was grown on modified tomato juice agar
(identical to V8 agar except V8 juice was replaced by tomato juice, Smart et al., 2000)
and maintained at 18°C in the dark for 8 days. Sporangia were washed from cultures
and the concentration was adjusted as sporangia mL-1. To release zoospores, the
sporangia suspension was chilled for 2.5 hours at 4°C and incubated for at least 20 min
at 20°C before inoculation. Oidium neolycopersici, which is an obligate fungus, was
maintained on tomato plants in the greenhouse for use in experiments.
2.11 Inoculation
The adjustment of inoculum density and the incubation conditions of the various
pathogens throughout the experimental periods are listed in table (2.1). In general, the
aerial parts of tomato plants were sprayed with the pathogen inoculum using air hand
sprayers, unless the experiment was designed for specific purpose. Both the upper and
the lower leaf surfaces of tomatoes were inoculated. Powdery mildew caused by Oidium
neolycopersici was inoculated with spores from infected plants by shaking the diseased
leaves gently over them. All tomato plants used in the experiments were incubated
under optimal conditions for the pathogen of interest until symptoms developed and
disease severity was evaluated. In case of insect infection such as whitefly and thrips,
the plants were treated with suitable pesticides.
Materials and Methods
19
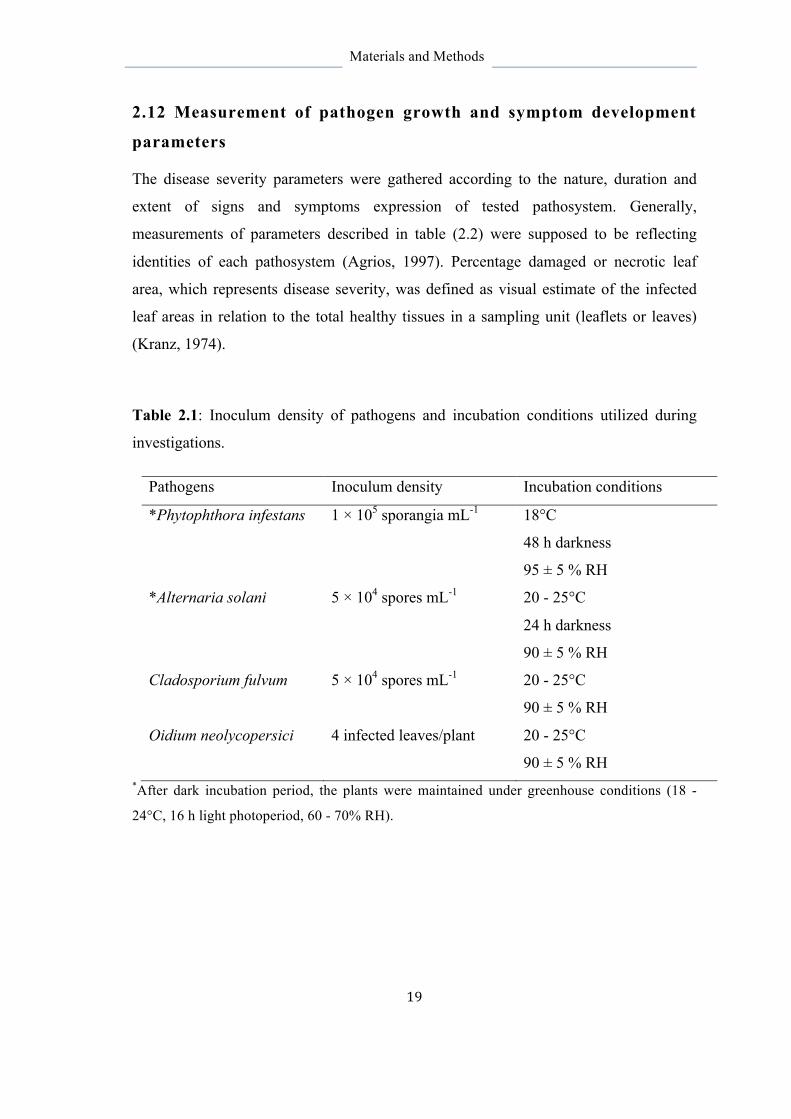
2.12 Measurement of pathogen growth and symptom development
parameters
The disease severity parameters were gathered according to the nature, duration and
extent of signs and symptoms expression of tested pathosystem. Generally,
measurements of parameters described in table (2.2) were supposed to be reflecting
identities of each pathosystem (Agrios, 1997). Percentage damaged or necrotic leaf
area, which represents disease severity, was defined as visual estimate of the infected
leaf areas in relation to the total healthy tissues in a sampling unit (leaflets or leaves)
(Kranz, 1974).
Table 2.1: Inoculum density of pathogens and incubation conditions utilized during
investigations.
Pathogens Inoculum density Incubation conditions
*Phytophthora infestans 1 × 10⁵ sporangia mL-1 18°C
48 h darkness
95 ± 5 % RH
*Alternaria solani 5 × 10⁴ spores mL-1 20 - 25°C
24 h darkness
90 ± 5 % RH
Cladosporium fulvum 5 × 10⁴ spores mL-1 20 - 25°C
90 ± 5 % RH
Oidium neolycopersici 4 infected leaves/plant 20 - 25°C
90 ± 5 % RH *After dark incubation period, the plants were maintained under greenhouse conditions (18 -
24°C, 16 h light photoperiod, 60 - 70% RH).
Materials and Methods
20
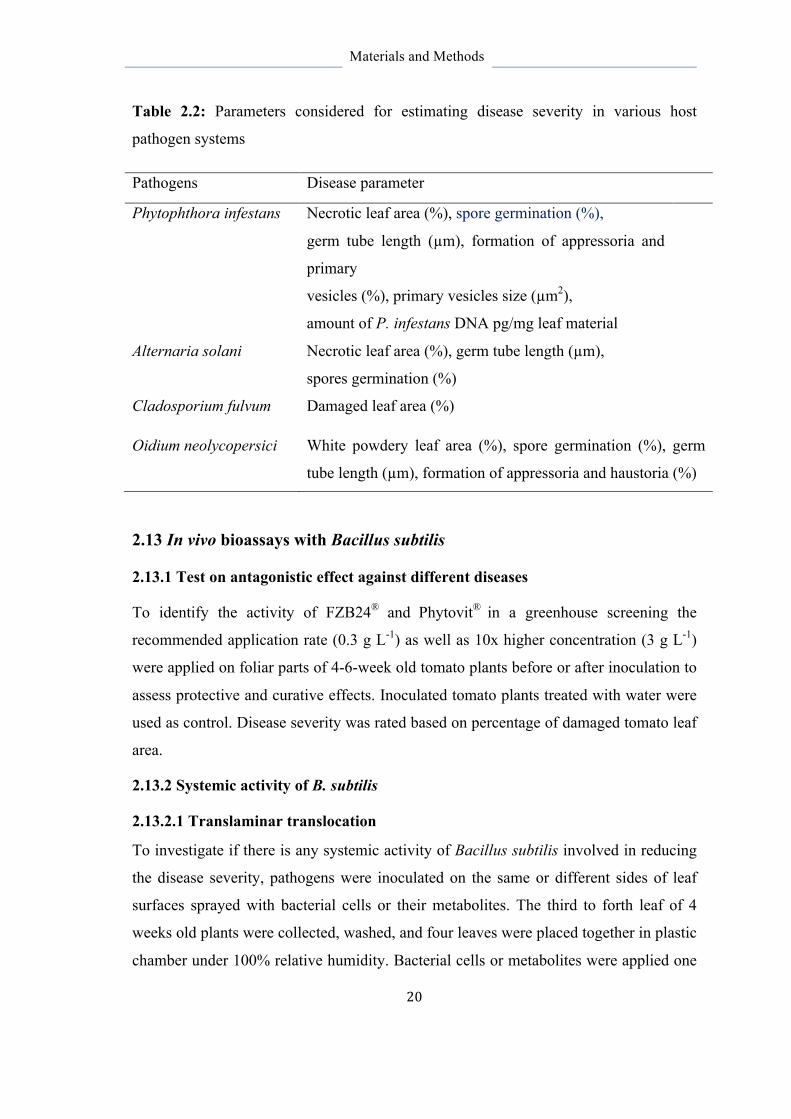
Table 2.2: Parameters considered for estimating disease severity in various host
pathogen systems
Pathogens Disease parameter
Phytophthora infestans Necrotic leaf area (%), spore germination (%),
germ tube length (µm), formation of appressoria and
primary
vesicles (%), primary vesicles size (µm2),
amount of P. infestans DNA pg/mg leaf material
Alternaria solani Necrotic leaf area (%), germ tube length (µm),
spores germination (%)
Cladosporium fulvum Damaged leaf area (%)
Oidium neolycopersici White powdery leaf area (%), spore germination (%), germ
tube length (µm), formation of appressoria and haustoria (%)
2.13 In vivo bioassays with Bacillus subtilis
2.13.1 Test on antagonistic effect against different diseases
To identify the activity of FZB24® and Phytovit® in a greenhouse screening the
recommended application rate (0.3 g L-1) as well as 10x higher concentration (3 g L-1)
were applied on foliar parts of 4-6-week old tomato plants before or after inoculation to
assess protective and curative effects. Inoculated tomato plants treated with water were
used as control. Disease severity was rated based on percentage of damaged tomato leaf
area.
2.13.2 Systemic activity of B. subtilis
2.13.2.1 Translaminar translocation
To investigate if there is any systemic activity of Bacillus subtilis involved in reducing
the disease severity, pathogens were inoculated on the same or different sides of leaf
surfaces sprayed with bacterial cells or their metabolites. The third to forth leaf of 4
weeks old plants were collected, washed, and four leaves were placed together in plastic
chamber under 100% relative humidity. Bacterial cells or metabolites were applied one

Materials and Methods
21
day before inoculation with P. infestans. In the first case, both B. subtilis (cells and
metabolites) and pathogen inoculum were applied on the same surface of tomato leaves,
either on the upper or lower side. In the other case, B. subtilis cells or metabolites was
applied on the upper leaf surface and the pathogen inoculum on the lower leaf surface
and vice versa. The boxes were then incubated under optimal conditions for P.
infestans.
2.13.2.2 Apical translocation
Bacillus subtilis strain FZB24 cells or metabolites were sprayed on a pair of lower
leaves of 6 week-old tomato. Each fully-expanded pair of leaves were incubated
separately in plastic bags, and into each of these a manual sprayer was introduced in
such way that the B. subtilis suspensions could not drop on the pot substrate or touch
any of the remaining aerial plant parts. After spraying, the device and the plastic bags
were carefully retrieved. One day after application, leaves from treated and untreated
plants were inoculated with P. infestans. For the control, the lower leaf pairs were
sprayed with water.
2.14 In vitro bioassays with Bacillus subtilis
2.14.1 Inhibition of mycelial growth
The effect of B. subtilis against the pathogens was tested at different application times
using different concentrations. Dual culture test was used to determine the application
time of the antagonists. Two cylindrical pieces (Ø 9 mm) of agar colonized by the
pathogens were placed on two edges of a Petri dish. Bacterial colonies of three-day old
culture were streaked between the pathogen disks, one day before, one day after, or at
the same time of pathogen culturing. To evaluate the effective concentration of bacterial
strains, 250 µL of 104, 105, 106, and 107 cells mL-1 of bacterial cells were distributed on
culture medium. After one day of incubation in darkness at 21°C, one disk of individual
pathogen was placed in the centre of the plates.
2.14.2 Inhibition of spore germination
The effect of B. subtilis on spore germination was studied according to the method
described by Nair and Ellingboe (1962). A drop of each isolate of bacterial cells was
Materials and Methods
22
deposited on dried clean glass slides as a film. A drop of the spore suspension of the
pathogen was spread over this film. Control treatment was prepared as a film of
sterilized distilled water. Percentage of spore germination was determined
microscopically using 400 folds magnification.
2.15 Microscopical investigations of Bacillus subtilis effects on
pathogen development
To investigate the effects of B. subtilis strains FZB and Phytovit on the development of
Oidium neolycopersici, Alternaria solani, and Phytophthora infestans on tomato leaves,
light microscopy and different histochemical techniques were used.
2.15.1 Light microscopy
The Leitz microscope DMR photomicroscope from Leica Microsystems (Wetzlar,
Germany) was used with Nomarski-interference contrast and with UV-excitation for
epifluorescence. The filter combinations that were used are given in table (2.3). Images
of the observed specimens were photographed with a fitted digital camera and could be
observed on a screen. The images were saved using the program "Discus" (Technisches
Büro Hilger, Königswinter, Germany).
Table 2.3: Filter combinations for the incident fluorescence microscope
Exciter filter (nm) Chromatic beam splitter (nm) Barrier filter (nm)
BP 340-380 FT 400 LP 430
BP 355-425 FT 455 LP 460
2.15.2 Specimen preparation techniques
2.15.2.1 Glass surface
To evaluate the direct effect of B. subtilis strain FZB24 on development of P. infestans
on glass surface, sporangium of P. infestans suspension (105 sporangia mL-1) was added
on a glass slide over a drop of B. subtilis cells or metabolites. The effects on germ tubes
elongation were evaluated 6 hours after incubation in darkness at 18°C.

Materials and Methods
23
2.15.2.2 Fresh specimen
Leaf samples inoculated with P. infestans taken 3 hours post inoculation were used to
determine zoospore germination on untreated and leaf surfaces treated with B. subtilis
strain FZB24.
2.15.2.3 Fixed specimen
Detached tomato leaves treated with B. subtilis strains one day before pathogen
inoculation were used to determine post-germination and pre-penetration pathogen
structures on the leaf surfaces. Circular leaflet samples cut out from infected detached
tomato leaves were taken 24 hours after O. neolycopersici inoculation, 12 hours after A.
solani inoculation, and 3, 6, 12 and 24 hours after P. infestans inoculation.
In order to observe and describe the pathogen structures inside the leaf tissue, the
chlorophyll was first removed and the samples then were stained with various staining
solutions. The pathogen structures were fixed either on the leaf surfaces or in leaf
components. The leaflets were cleared in saturated chloralhydrate (250 g/100 mL H2O)
at room temperature for at least 7 days.
2.15.3 Staining techniques
2.15.3.1 Bruzzese and Hasan solution
Different aspects of fungal growth of O. neolycopersici on and in tomato leaf tissues
were monitored. Such parameter included observations of conidia germination,
elongation of germ tubes, and fungal penetration by forming appressoria and haustoria.
The tomato leaflets (24 hpi) were fixed, cleared and then stained for 5 minutes in a
solution (300 mL 95% ethanol, 150 mL chloroform, 125 mL 90% lactic acid, 450 g
chlorohydrate, and 0.6 g aniline blue) according to Bruzzese and Hasan (1983).
The stained samples were mounted on a microscope slide and covered with a cover slip
for light microscopic observations under interference contrast.
2.15.3.2 Acid Fuchsin

Materials and Methods
24
The development of fungal structures were stained with 0.01% acid Fuchsin acid for 24
h. Proteins in pathogens and damaged plant cells are stained pink. The samples were
observed with interference contrast.
2.15.3.3 Diethanol (Uvitex 2B)
To determine the germination rate and to describe the pre-penetration structures of the
pathogens on leaves, fresh leaf specimens with P. infestans were stained in 10 µl of
0.05% diethanol (w/v) and then covered with a cover slip and observed with the BP340-
380/FT 400/LP 430 filter combination. Diethanol binds to polysaccharides with β-
glycosidic bonds. The stain does not penetrate the plant cuticle; therefore it stains the
cell wall of the pathogen on the plant surface fluorescence under UV-light.
2.16 Molecular investigations on quantification of Phytophthora
infestans biomass in leaf tissue
2.16.1 Growth of P. infestans depending on inoculum concentration
To monitor the growth of P. infestans biomass in leaf tissues, tomato leaves were
inoculated with 3 × 10², 3 × 10³, or 3 × 10⁴ sporangia mL-1 of P. infestans to quantify
the amount of P. infestans DAN as indicator of biomass.
2.16.2 Influence of B. subtilis strain FZB24 on P. infestans biomass throughout the
infection course
Bacillus subtilis strain FZB24 cells and their metabolites harvested 72 hour after
culturing were applied on foliar parts of tomato plants in the greenhouse 24 h before
inoculation with P. infestans (105 sporangia mL-1). Immediately after inoculation, leaves
of half of the plants (detached leaves) were cut and incubated in plastic boxes under the
same incubation conditions of individual plants (samples are called attached leaves).
Untreated inoculated plants were used as positive control and the non-inoculated plants
were a negative control to see if there is any natural infection. The samples were taken
3, 6, 12, 48, 96, and 144 hours after inoculation. For each treatment, four individual
plants were maintained and 10 leaflets per plant were taken as one sample.
Materials and Methods
25
2.16.3 DNA extraction
2.16.3.1 DNA extraction from P. infestans
Genomic DNA from P. infestans was extracted using the CTAB method (Murray and
Thompson, 1980) simplified by Stewart and Via (1993) for preparing standard dilution
series for the corresponding target. The CTAB protocol was further modified to obtain
high quality DNA.
DNA was extracted from 10 day-old cultures of P. infestans grown on TA. The mycelia
were collected in 2 milliliter tubes and frozen at -80°C. Mycelia were ground under
liquid nitrogen to a fine powder using mortar and pestle and then 100 - 250 mg mycelia
powder were transferred to 50 milliliter tubes. DNA was extracted under a fumes
chamber.
Ten mL of CTAB-extraction buffer (10 mM Tris, 20 mM EDTA, 0.02 M CTAB, 0.8 M
NaCl, 0.03 M N-laurylsarcosine, 0.13 M sorbitol, 1%(w/v) polyvinylpolypyrolidone,
pH set to 8.0 with NaOH); 40 µL mercaptoethanol and 50 µL proteinase K (from a
stock solution 10 mg mL-1), were added to the ground mycelium (approximately 200
mg) in 50 mL plastic centrifugation tube and mixed vigorously. The mixture was
incubated at 65°C for 60 min and mixed after every 10 min. Eight hundred µL of the
upper phase was transferred to a 2 mL new tube containing 10 µL of RNAase (50 mg
mL-1) and incubated for 10 min at 65°C, Nine hundred µL of chloroform-isoamyl
alcohol (24:1) was added into each tube. The samples were mixed by inverting the tubes
and centrifuged for 10 min at 5,000 g at room temperature. The upper phase (600 µL)
was transferred into a 2 mL tube and the precipitation step with chloroform-isoamyl
alcohol (24:1) was repeated twice to obtain high quality DNA. After the last
centrifugation, the aqueous phase was transferred into a 1.5 mL tube containing 500 µL
isopropanol, mixed and incubated for 20 min at room temperature and centrifuged for
15 min at 15,000 g at room temperature. The pellet was washed twice with 70% (v/v)
ethanol, dried and dissolved in 200 µL TE buffer and incubated at 4°C over night and
then in -20°C until use. The quality and quantity of isolated DNA were checked on
agarose gel and with a spectrophotometer. A 10-fold dilution series (from 0.9 to 9000
pg µL-1) of purified DNA were used for generating a standard curve in every real-time
PCR run.
Materials and Methods
26
2.16.3.2 DNA extraction from tomato leaves
DNA from non-inoculated and P. infestans-inoculated leaves was extracted using the
Plant Mini kit Method "Wizard® Magnetic DNA Purification System for Food"
(Promega, Mannheim, Germany) following the manufacturer`s protocol. Briefly, the
collected leaves were frozen at -80°C and ground under liquid nitrogen to a fine powder
of less than 0.1 mm using an ultracentrifugal mill (Retsch, Haan, Germany). Into 2 mL
Eppendorf tube, 18-22 mg of ground tomato leaves was weighed and stored at room
temperature. Four hundreds microliters of lysis buffer A and 4 µL RNase A were added,
the tube was capped and vortexed vigorously. Tow hundreds microliters of lysis buffer
B was added, vortexed for 10-15 seconds and incubated for 10 minutes at room
temperature (23 ± 2°C) with occasional mixing. Six hundreds microliters of
precipitation solution was added and vortexed vigorously. The mixture was spinned for
10 minutes in a microcentrifuge at 13000 rpm. The supernatant was immediately
transferred to a new 2 mL tube. The Magnesil® PMPS bottle was shaken by hand to
thoroughly re-suspend the Magnesil® PMPS before dispensing in each sample. Fifty
micro iters of Magnesil® was added to the supernatant and the tubes vigorously shaken
by hand. Approximately 1 mL isopropanol was added; then the tubes were inverted 10-
15 times and the samples were incubated for 5 minutes at room temperature with
occasional mixing by hand. The tubes were placed on the magnesphere® (magnetic
separation stand) and left for 1 minute. The liquid phase was discarded by turning round
the tubes and excess liquid dried on paper towels.
The tubes were removed from the stand and 250 µL of lysis buffer B added. The tubes
were inverted 2-3 times and placed back in the stand. The Magnesil® was allowed to
separate for 1 minute and the liquid phase removed by turning round the tubes by hand.
One milliliter of wash solution (70% ethanol) was added to the tubes, which were then
placed on the stand. The tubes were turned several times to wash the DNA. The liquid
phase was discarded like before. This step was repeated twice for a total of 3 washes.
Using a pipette, as much liquid as possible was removed and discarded to remove the
rest of the alcohol. The particles were dried for 10 minutes at 65°C, 100 µL of sterile
water was added to dilute the DNA, vortexed and incubated for 5 minutes at 65°C. The
tubes were placed onto magnetic stand for 1 minute. The liquid was removed without
Magnesil® PMPS carefully to a clean tube. The extracted DNA was stored at 4°C for

Materials and Methods
27
some days or -22°C for a longer period. The quality and quantity of isolated DNA were
checked on agarose gel and with a spectrophotometer.
2.16.4 Gel electrophoresis analysis
The agarose gel that was used in this analysis was prepared with 1X Tris-Acetate EDTA
Buffer (TAE, AppliChem). For this, 2.5 g agarose (Sigma) was added to 250 mL of
TAE buffer and heated for 5 minutes in a microwave (MW800, Continent) at 650 watts.
After cooling at approx. 50°C, 2.5 µL of 10 mg mL-1 ethidium bromide (AppliChem)
was added. This solution was poured into an electrophoresis tray and left for approx. 30
minutes until the gel had solidified. The gel was subsequently transferred to the gel
electrophoresis chamber filled with 1X TAE buffer. After transferring all samples to the
wells of the gel, electrophoresis was conducted for 20 minutes at 120 Volt. The
presence and specificity of DNA bands were observed under BioRad Chemidoc XRS
Gel Documentation System (Biorad, München, Germany).
2.16.5 SYBR green® real-time PCR reactions
Quantitative PCR was carried out in an ABI Prism® 7000 SDS (Applied Bio systems,
Foster city, USA) instrument based on the changes in fluorescence proportional to the
increase of the PCR product. SYBR Green, which emits a fluorescent signal upon
binding to double stranded DNA, was used as a detector. Fluorescence values were
recorded during every cycle representing the amount of product amplified to a point
known as threshold cycle (Ct). The higher the initial transcript amount, the sooner
accumulated product was detected in the PCR.
The PinfRAS-Forward and PinfRAS-Reverse P. infestans primers,
(CATTACATTGCTCACATGGCTTTC) and (ATCACGCGGGGACAAATG),
respectively, were designed according to Atallah et al. (2006). Prior to quantification,
preimers concentrations were optimized using different combinations of forward and
reverse (0.2, 0.3 and 0.4 µL of 10 pg µL-1) in presence of low concentration template
(DNA) and non-template as control to avoid primer dimer formation. At the end of the
run, the dissociation curve was generated to check the absence of the nonspecific
amplification and subsequent confirmation by analysis of the PCR products on agarose
gel electrophoresis. The primer combination with the lowest threshold cycle and
without primer dimer formation was used to perform subsequent PCRs.

Materials and Methods
28
Standard curve was generated using a serial dilution (0.9, 9, 90, 900 and 9000 pg) of
purified genomic DNA of P. infestans. Polymerase chain reactions (PCRs) were carried
out in 20 µL reaction volume containing 10 µL SYBR® Green Jump startTM Taq Ready
MixTM (Sigma-Aldrich Chemie, Steinheim, Germany), 0.2 µL Rox as internal reference
dye, 0.3 µL of forward primer and 0.4 µL of reverse primer, 2 µL genomic DNA and
7.1 µL sterile Millipore water. PCR reactions were performed in duplicates for standard
curves and samples to control the reproducibility of quantitative results. A universal
thermal cycling programme (10 sec at 50°C, 10 min at 95°C, 40 cycles of 15 sec at
95°C and 60 sec at 60°C) was used for the quantification. The specificity of
amplification was confirmed by generating melting curve at the end of PCR reactions
revealing the presence of a single peak for P. infestans (Fig. 2.1). The curve was used as
control for the specificity of real-time PCR during the quantification. Final
quantification of pathogen DNA analysis was performed using the standard curve
method (User bulletin of ABI PRISM 7700 SDS, Http://docs.appliedbiosystems.com).
The results were reported as the absolute amount of P. infestans DNA. The correlation
coefficient (R2-value) of the standard curve was at least 0.99 while the slope ranged
from –3.1 to – 3.8 (Fig. 2.2).
Figure 2.1: Dissociation curve (fluorescence derivative versus temperature oC) of specific Phytophthora infestans amplicon in tomato leaf matrix. Peaks of amplification plots indicated species-specific amplification in real-time PCR with a mixture of plant and pathogen DNA in different samples.
Temperature (oC)

Materials and Methods
29
Figure 2.2: Calibration curve based on 40 threshold cycles from ten-fold serially
diluted DNA in two replications of RT-PCR using SYBR Green® for the
quantification of Phytophthora infestans DNA. R2 = 0.997, slope = -3.3.
(Ct): cycle threshold, (Log C0): log of standard.
2.17 Expression profile of PR1a gene in leaf tissue
2.17.1 Experimental design and tissue collection
Bacillus subtilis strain FZB24 cells and metabolites were sprayed on the lower leaves
24 hours before P. infestans inoculation on both the untreated upper leaves and the cell-
or metabolite-treated lower leaves. Plants were divided into two groups, P. infestans-
inoculated and non-inoculated plants, each consisted of three subgroups untreated
(water-treated), cell-treated, and metabolite-treated plants. The samples were taken from
4 plants for each group. Each sample was taken from a pool of 10 leaflets from the
bottom treated and upper induced leaf pairs per plant. In addition to 4 sampling times
corresponded to the pathogen development also other sampling times were taken to
investigate the influence of B. subtilis on the gene expression of lower treated leaves
before inoculation (Fig. 2.3). Leaf samples from the bottom as well as from the upper
leaves for each individual plant were separately transferred into 15 mL plastic tubes and
immediately frozen in liquid nitrogen. Plant material was lypholized using a Lyovac
GT2 freeze dryer lyophilizer (Leybold Heraeus, Cologne, Germany) for 24 hours. The
frozen dried samples were stored at -80°C until RNA extraction.
Log C0
Ct

Materials and Methods
30
Figure 2.3: Sampling times to collect the lower and upper leaves from non-inoculated
and P. infestans-inoculated plants. Black numbers indicate the time after
application of Bacillus subtilis strain FZB24 cells or metabolites on the
lower leaves. Green numbers indicate the time after Phytophthora
infestans inoculation correspondung to its development stages.
2.17.2 RNA extraction and DNA digestion
Total RNA was isolated from frozen dried tomato leaves, approximately 20 mg, using
the NucleoSpin® 8 RNA Isolation Kit (Machery-Nagel GmbH & Co. KG, Düren,
Germany). The samples were homogenized with a mortar and pestle in liquid nitrogen
and the ground powder was transferred to a polypropylene tube to follow the
manufacturer`s protocols. RNA yield and quality were assessed using the Nanodrop
8000 spectrophotometer (Thermo Fisher Scientific Inc, DE, USA) at 260 and 280 nm.
RNA integrity was confirmed by agarose gel (1.5% w/v). Prior to subsequent
application, genomic DNA contamination of the samples was removed using DNA
digestion kit (Invitrogen, Karlsruhe, Germany) according to the manufacturer`s
protocol. Then the samples were stored at -80°C.
2.17.3 Synthesis of cDNA
One microgram of total RNA were reverse transcribed in 20 µL reaction using High-
Capacity cDNA Reverse Transcription Kit (Applied Biosystems, Foster City, USA).
Nine microliters mixture consisting of 2 µL of 10x RT buffer, 2 µL of 10x random
primers, 0.8 µ1 (25 nM) dNTPs, 1 µL MultiScribe reverse transcriptase, and 3.2
nuclease-free water was added to 11 µL RNA sample, then reverse transcription was
Materials and Methods
31
run using the following protocol: 25°C for 10 min, 37°C for 120 min, 85°C for 5 min
and holding at 4°C. The synthesized cDNA was stored at -20°C for further use.
2.17.4 Primer design and gene specific amplification
In the current study, quantitative RT-PCR was used to quantify the PR1a gene in leaf
tissue depending on different treatments. The primers for the target gene LePr1a and the
internal control gene TIP41, designed based on tomato mRNA sequence deposited in
GenBank, were choosen accourding to Aimé et al. (2008) and Expósito-Rodríguez et al.
(2008), respectively. All primers were purchased from biomers.net GmbH (Ulm,
Germany). Primer sequences, size of amplified products, annealing temperature and
GenBank accession numbers are shown in table (2.4). PCR reaction was carried out for
each primer in 20 µL reaction volume using 4 µL of 5x PCR buffer (Sigma-Aldrich),
0.5 µL of dNTPs (50 µM), 0.5 µL of each specific primer (10 pmole forward and
reverse), 0.2 µL of Taq polymerase (Sigma-Aldrich) and 12.3 µL Millipore water which
finally added to 2 µL of cDNA templates or to 2 µL genomic DNA as positive control
and 2 µL of Millipore water as negative control. The thermal cycling program was set
as: denaturation at 95°C for 5 min, followed by 40 cycles at 95°C for 30 sec, annealing
at the corresponding temperature as shown in table 3 for 30 sec and extension at 72°C
for 1 min, final extension step at 72°C for 10 min and then at 4°C forever. Finally, 2 µL
of loading buffer were added to the PCR products and loaded on 2 % agarose gel in 1X
TAE buffer by staining with ethidium bromide. PCR products were electrophoresed for
30 min at 120 voltages. The presence and specificity of DNA bands were observed
using BioRad Chemidoc XRS Gel Documentation System (Biorad, Munich, Germany).
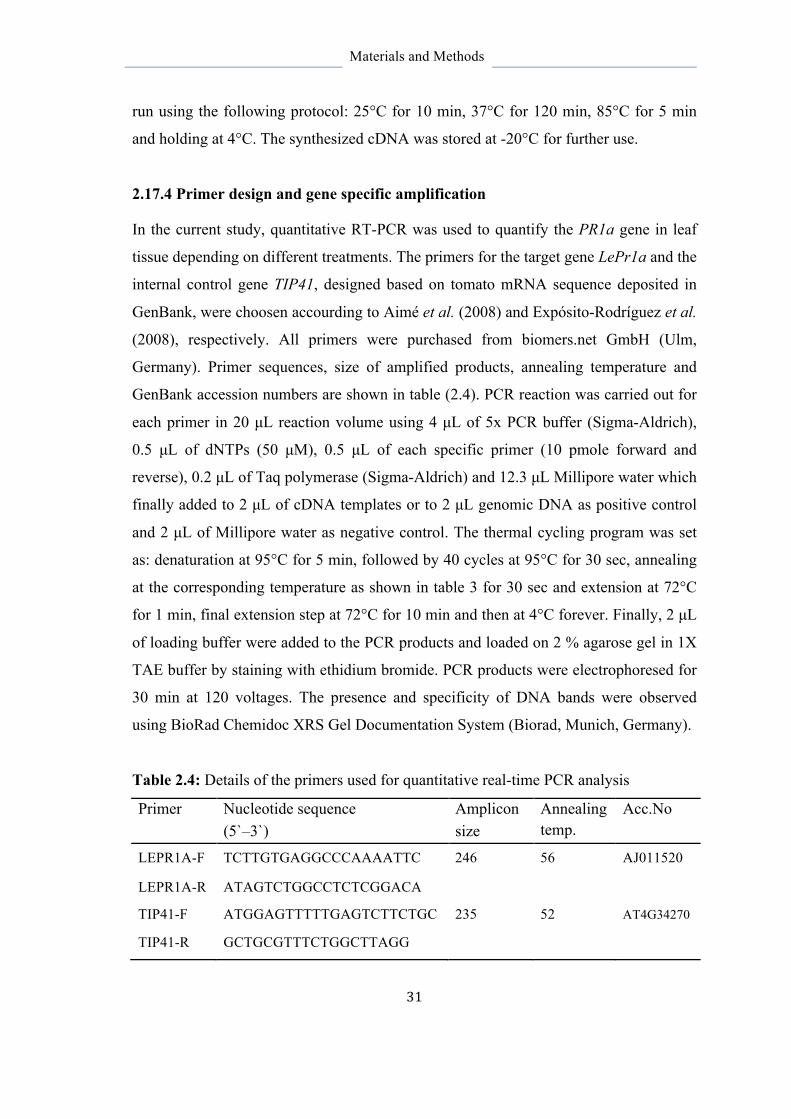
Table 2.4: Details of the primers used for quantitative real-time PCR analysis
Primer Nucleotide sequence Amplicon Annealing temp.
Acc.No (5`–3`) size
LEPR1A-F TCTTGTGAGGCCCAAAATTC 246 56 AJ011520
LEPR1A-R ATAGTCTGGCCTCTCGGACA
TIP41-F ATGGAGTTTTTGAGTCTTCTGC 235 52 AT4G34270
TIP41-R GCTGCGTTTCTGGCTTAGG
Materials and Methods
32
2.17.5 Preparation of plasmid DNA
2.17.5.1 PCR product extraction, ligation, and transformation
The PCR product was purified using QIAquick PCR Purification Kit (Qiagen, Hilden,
Germany) and ligated to pGEM®-T easy vectors using pGEM®-T Vector System I
ligation kit (Promega, WI, USA), according to the manufacturer`s instructions. Ligation
was performed in 6 µL reaction mix containing 3 µL 2X rapid ligation buffer, 0.5 µL
pGEM vector (50 ng), 0.5 µL T4 DNA ligase enzyme (3 units µL-1), and 2 µL of
purified PCR product. The reaction was then incubated at 4°C overnight. The ligation
reaction was incubated in a thermocycler at 20°C for 2 hours. Transformation was
performed by combining 3 µL of each ligation product with 70 µL of competent E. coli
cells (JM109 strain) in a 15 mL sterile falcon tube. The tubes were gently flicked and
placed for 20 min on ice followed by 90 sec at 42°C and immediately returned to ice for
2 min. Afterwards, 650 µL of Luria-Bertani (LB) broth was added to the previous
mixture and cultured at 37°C in SHKE6000-8CE refrigerated stackable shaker
(Thermoscinentific, IWA, USA) for 90 min with speed of 110 rpm. After 70 min, 20 µL
of IPTG and 20 µL of X-gal were added and homogeneously spread with a glass
spreader on the LB agar-ampicillin plate (5 µL ampicillin (10 mg mL-1) per mL of LB
agar medium) and plates were left until the chemicals were absorbed for 20 min under
laminar prior to culture transformation. After the incubation period, 300 µL of each
transformation culture was transferred to duplicate LB agar/ampicillin/IPTG/X-gal plate
and incubated overnight at 37°C till the colonies become visible.
2.17.5.2 Blue/White colony secreening and colony picking
Successful cloning of DNA insert in the pGEM-T Easy vectors was checked based on
the activity of β-galactosidase. β-galactosidase is an enzyme produced by lacZ gene in
pGEM®-T vector which interacts with IPTG to produce a blue colony. On the other
hand, when an insert was successfully cloned, lacZ is disrupted leading to interrupt the
coding sequence of β-galactosidase resulting recombinants in white colony formation.
Following this screening, four independent white colonies (assumed to contain inserts)
in addition to one blue colony (as control) were picked up and transferred into 30 µL 1X
PCR buffer for M13 reaction for further confirmation of transformation and sequencing
Materials and Methods
33
(Messing et al., 1981). At the same time, colonies were also cultured in 650 µL LB-
broth with ampicillin (5 mg per 100 mL) and incubated at 37°C and 110 rpm on
SHKE6000-8CE refrigerated stackable shaker (Thermoscinentific, IWA, USA). The
bacterial suspension in the 30 µL 1xPCR was lysed by heating for 15 min at 95°C. The
colonies were screened for the insert by performing a PCR reaction using M13 specific
primers designed from the promoter region of the vector. 20 µL total reaction volume
containing 10 µL of lysate cells as a template, 0.5 µL dNTPs (10 mM), 0.5 µL of each
M13 primers (forward: 5´- TTGAAAACGACGGCCAGT-3´, reverse: 5´-
CAGGAAACAGCTATGACC-3´), 0.1 µL (0.5 U) Taq polymerase (Sigma) in 1 µL
10X PCR reaction buffer and 7.4 µL water was amplified. M13 PCR reaction was
carried out following this protocol: first denaturation at 95°C for 3 min, followed by 35
cycles that repeated at 95°C for 30 sec, 60°C for 30 sec, 70°C for 2 min. M13 PCR
reaction was terminated after final extension at 72°C for 10 min. 5 µL of the M13
product mixed with 2 µL loading buffer was loaded to 2% agarose gel stained with
ethidium bromide. The colonies that contained PCR fragments (white colonies) were
identified depending on the distance travelled by DNA fragment in 2% agarose gel
electrophoresis. Clones having insert would have higher molecular weight fragments
than blue clones.
The best confirmed samples for the presence of PCR fragment were selected and
transferred to 15 mL sterile tube and additional 5 milli Liter LB broth/ampicillin was
added. The bacterial suspension was further cultured over night at 37°C to increase
numbers and therefore the amount of DNA.
2.17.5.3 Plasmid isolation
The plasmid was isolated using GenEluteTM plasmid mini prep kit (Sigma-Aldrich,
St.Lous, USA) based on the manufacturer’s instructions. Briefly, overnight cultured
competent cells were centrifuged at 12000 rpm for 1 min. The supernatant was
discarded and the pellets were re-suspended in 200 µL lysis solution. After a short
vortex, the solution was removed and again 200 µL lysis solutions were added and
mixed by gently inverting the tubes until it became clear and viscous. After incubating
at room temperature for 4 min, 350 µL neutralization/binding buffers was added, the
cell suspension was centrifuged for 10 minutes at 14000 rpm for 30 sec and the clean
Materials and Methods
34
suspension was taken by avoiding the sediment. Then, 500 µL of column preparation
solution was added to the GenEluteTM Miniprep binding column inserted into a
provided 2 mL microcentrifuge tube and centrifuged at 12000 rpm for 30 sec. The
cleared lysate was then transferred to the column and centrifuge at 12000 rpm for 1 min.
The filtrate was decanted and 750 µL of the diluted wash solution was added to the
column followed by centrifugation at 13000 rpm for 1 min. The flow-through liquid
was discarded and the column was centrifuged again at maximum speed for 2 minutes
to eliminate excess ethanol and make sure that there is no liquid in the column tube.
Finally, the spin column was transferred into a fresh collection tube, 30 µL of Millipore
water was added to the centre of the spin column membrane and the tubes were
incubated for 5 min, and then centrifuged at 12000 rpm for 1 min to elute the plasmid
DNA. Again, 20 µl of Millipore water was added and incubated for 5 minutes and
centrifuged at high speed for 5 min.
To confirm the presence of the plasmid DNA, 5 µL of the plasmid DNA with 2 µl
loading buffer was loaded on 2% agarose gel stained with ethidium bromide and run in
1X TAE buffer. Concentration and quality of the plasmid was measured by reading the
absorbance at 260 and 280 nm using Nanodrop 8000 spectrophotometer (Thermo Fisher
Scientific, Wilmington, DE, USA). An aliquot of DNA plasmid was subjected to
sequence check; the rest was stored at -20°C to be used for setting up the standard curve
for real-time PCR.
2.17.5.4 Sequencing
The specificity of gene cloning was further validated by sequencing of M13 PCR
product, in spite of identification of recombinants on LB-agar/ampicillin/IPTG/X-gal
plate as a result of insertional inactivation of the α-peptide. Only the M13 PCR products
from white colonies containing inserts were used as a template for subsequent
sequencing. A volume of 5 µL of M13 products was purified by adding 1 µL of
ExoSAP-IT (USB, Ohio, USA) then incubated at 37°C for 30 min followed by enzyme
inactivation at 80°C for 15 min. The purified DNA product (6 µL) was subsequently
used as template for the sequencing PCR which contains 8 µL of Millipore water, 2 µL
of 1.6 pmole M13 forward or reverse primer, 4 µL master mix (DTCS). The PCR
sequencing reaction was performed for 30 cycles at 96°C for 20 sec, 50°C for 20 sec

Materials and Methods
35
and 60°C for 4 min, followed by holding step at 4°C. The stop solution was prepared in
a volume of 2.0 µL of 3M NaOAc (pH: 5.2), 2.0 µL of 100 mM EDTA (pH: 8) and 1.0
µL of glycogen (20 mg mL-1). The sequencing PCR product was transferred to a 1.5 mL
sterile tube and mixed with 5 µL stop solution and homogenized by vortexing. A
volume of 60 µL 98 % cold ethanol was added and mixed by vortex and then
centrifuged at 14000 rpm for 15 min at 4°C in refrigerated universal centrifuge
Z233MK (Hermle Labortechnik, Wehingen, Germany). The supernatant was removed
and the pellet washed 2 times with 200 µL 70 % cold ethanol and centrifuged for 5 min
at 4°C and left to be dry by the speed vacuum machine for 10 min at 35°C and re-
suspended in 40 µL SLS (Sample loading solution). Dried pellet were transferred to the
sequencing plate (Beckman Coulter, Krefeld, Germany). After covering the plate with
mineral oil and immediately loaded to CEQTM 8000 Genetic Analysis sequencing
machine (Beckman Coulter, Krefeld, Germany). The similarity of the sequence result to
the original sequence was verified using the NCBI/BLAST search tool
(http://blast.ncbi.nlm.nih.gov/Blast.cgi).
2.17.5.5 Preparation of serial dilution from plasmids
The copy number per microlitre of plasmid DNA was calculated based on the nucleic
acid size (size of the pGEM®-T easy vectors (2 kb) + PCR fragment for each gene) and
the plasmid concentration (ng µL-1). The plasmid serial dilution was prepared by
converting concentration of plasmid into numbers of molecules using the online tool
(http://molbiol.ru/eng/scripts/01_07.html). After selecting the dilution that contains 109
molecules (copies µL-1), it was then determined in 50 µL volume based on the number
of molecules obtained in 1 µL plasmid DNA. Using 5 µL of 109 dilutions and 45 µL
Millipore water, the 108 dilutions were prepared. The remaining 107-101 dilutions were
prepared in a similar way. Serial dilutions were then stored at -20°C and a PCR reaction
was performed to test whether the serial dilution could be a suitable standard curve for
RT-PCR. Afterwards, the plasmid DNA serial dilutions were used as template to
generate the standard curve during RT-PCR analysis.
Materials and Methods
36
2.17.6 Quantitative real-time PCR analysis
After selection of primer concentration as previously described (2.17.4), similar amount
of cDNA (2 µl) from the upper and lower leaves were used to compare samples from
different treatment groups. Quantitative PCR was performed in 20 µL reaction volume
containing iTaq SYBR Green Supermix with ROX (Bio-Rad laboratories, Munich,
Germany), cDNA samples, up and down stream primers. Thermal parameters used to
amplify the template started with an initial denaturation at 95°C for 3 min followed by
40 cycles of 95°C for 15 sec and 60°C for 45 sec annealing and extension. The
specificity of amplification for each gene was evaluated by monitoring the dissociation
(melting) curve at the end of the last cycle by collecting the fluorescence data at 60°C
and taking measurements every 7 sec until the temperature reached 95°C.
The relative standard curve method was used to determine transcript abundance of the
samples using a serial dilution of 101-109 copy numbers of target plasmid DNA. The
data generated was considered for further analysis. The slope and the regression line
(R2) of the standard curve were (-3.2 to -3.6) and > 0.99, respectively. The copy
numbers of the target genes were normalized against the housekeeping gene TIP 41,
which expression was not significantly different between the samples to be compared.
The results were reported as the relative expression as compared to the calibrator after
normalization of the transcript level to the endogenous control.
2.18 Microarray analysis of gene expression of tomato leaves
2.18.1 Experimental design and tissue collection
In order to get an overview of molecular plant process involved in P. infestans – tomato
interaction and in reducing late blight disease severity using B. subtilis strain FZB24, an
experiment was conducted using the design of the previous experiment (B. subtilis
strain FZB24 cells and metabolites were sprayed on the lower leaves 24 hours befor P.
infestans inoculation on both the untreated upper and the treated lower leaves.). The
plants were divided into two groups, non-inoculated and P. infestans-inoculated plants,
then each group consisted of three subgroups untreated (water-treated), cell-treated, and
metabolite-treated plants. After 12 hours of inoculation, only the upper leaves were
collected to perform this analysis. Four replicates of each subgroup were maintained

Materials and Methods
37
and each replicate was collected from three plants (10 leaflets of each plant) to prepare
a pool of leaf tissue in one plastic tube. Samples were individually transferred into 15
mL plastic tubes and immediately frozen in liquid nitrogen. Plant materials were
lypholized using a Lyovac GT2 freeze dryer lyophilizer (Leybold Heraeus, Cologne,
Germany) for 24 hours. The Freeze-dried samples were stored at -80°C until RNA
extraction.
2.18.2 RNA extraction and DNA digestion
Total RNA was extracted from four pools of both non-inoculated and P. infestans-
inoculated plants at two times, first for RNA amplification and further hybridization on
the array and second for validation of array results using quantitative RT-PCR. Total
RNA was isolated from freeze-dried tomato leaves, approximately 20 mg, using the
NucleoSpin® 8 RNA Isolation Kit (Machery-Nagel GmbH & Co. KG, Düren,
Germany). Samples were homogenized with a mortar and pestle in liquid nitrogen. The
ground powder was transferred to a polypropylene tube according to manufacturer`s
protocols. Prior to subsequent application, genomic DNA contamination was removed
by performing DNA digestion using RQ1 RNase-free DNase (Promega, Madison, WI,
USA) and then samples were further purified using RNeasy Plant mini kit (Qiagen,
Hilden, Germany), following the manufacture’s recommendation. RNA yield and
quality were assessed using the Nanodrop 8000 spectrophotometer (Thermo Fisher
Scientific Inc, DE, USA) at 260 and 280 nm. RNA integrity was confirmed by agarose
gel (1.5% w/v) and evaluated using Agilent 2100 bioanalyzer with RNA 6000 Nano
LabChip® Kit (Agilent Technologies Inc, CA, USA). The ribosomal RNA ratio (28S to
18S) of the RNA samples was between 1.9 and 2.1 and the RNA integrity number (RIN)
was about 7.
2.18.3 Biotin labeled cRNA synthesis
For microarray analysis, total RNAs were processed for use on Affymetrix Tomato
Genechip arrays as described in the GeneChip® Expression Analysis Technical Manual.
Starting material containing 250 ng of total RNA was used in a reverse transcription
reaction to generate cDNAs. After amplification the resulting double-stranded cDNA, it

Materials and Methods
38
was labeled using a biotinylated nucleotide analog/ribonucleotide mix using GeneChip
IVT Labeling Kit (Affymetrix, Inc., Santa Clara, CA, USA). The biotin labeled cRNA
was fragmented and analyzed in the Bioanalyzer and the RNA peaks evaluated the
success of fragmentation.
2.18.4 Affymetrix array hybridization and scanning
A hybridization mixture consisting of fragmented and labeled cRNA (5 µg), 20X
eukaryotic hybridization controls (bioB, bioC, bioD, cre), 2X hybridization mix, control
oligonucleotide B2 (3 nM), DMSO, and RNAse free water was mixed. The final volume
of 200 µL was heated to 99°C for 5 minutes, and then incubated at 45°C for 5 min. The
samples were then hybridized to the Affymetrix tomato GeneChip for 16 h. For each
group, four biotin-labeled cRNA hybridizations were performed. The arrays were
washed and stained using the Fluidics Station 450 and scanned using the GeneChip®
scanner 3000 integrated with Affymetrix® Microarray Suite software.
2.18.5 Microarray chip description
The GeneChip tomato genome array (Affymetrix) was used in the current experimet.
This oligonucleotide array contains over 10,000 L, esculentum probe sets monitoring
gene expression for over 9,200 L, esculentum genes. The GeneChip Tomato Genome
array is a169-format, 11-micron array design and contains 11 probe pairs per probe set.
A description of the GeneChip tomato genome array is available at the manufacturer’s
website.
2.18.6 Affymetrix array data analysis
The microarray data normalization and background correction was performed using
Guanine Cytosine Robust Multi-Array Analysis (GCRMA) according to Vardhanabhuti
et al. (2006). R software, (www.r-project.org) and bioconductor packages
(www.bioconductor.org) were used. During normalization, the CEL files were
converted into expression set using GCRMA considering probe sequence and the GC-
content background correction. Following this and starting with the probe-level data
from a set of GeneChips, the perfect-match values were background corrected,
Materials and Methods
39
normalized and finally summarized resulting in a set of expression measures (App. 1).
After hybridization, the quality of the arrays was assessed by the absent and present
calls of the control probesets. Differentially expressed genes (DEGs) were obtained
using Linear Models for Microarray Data Analysis (LIMMA) (Smyth 2005). The DEGs
were selected based on p < 0.05, fold changes ≥ 2 and false discovery rate (FDR) ≤ 0.1.
P-values were adjusted using the Benjamini–Hochberg procedure, which controls the
false discovery rate (Benjamini and Hochberg 1995). The raw and normalized data from
non-inoculated and P. infestans-inoculated untreated plants are available at Gene
Expression Omnibus (GEO), http://www.ncbi.nlm.nih.gov/geo/ with accession numbers
(GSE33177).
Additionally, the DEGs dataset was compared to all available tomato microarray
analysis in the genevestigator database (334 experiments) (Hruz et al., 2008). Figure 2.4
shows a portion of the results obtained by genevestigator, which shows the best
correlated experiments and genes that were correlated with our study.
2.18.7 Pathways and networks analysis
Molecular pathways associated with resulted DEGs, were identified by using Mapman
(ver. 3.5.1) (Thimm et al., 2004). Gene Ontology (GO) Slim enrichment and GO
annotation of DEGs was done by using the Tomato Functional Genomics Database
(TFGD) (Fei et al., 2011). Fisher’s exact test was used to calculate a P-value
determining the probability that each biological function or canonical pathway assigned
to the data set was because by chance alone.
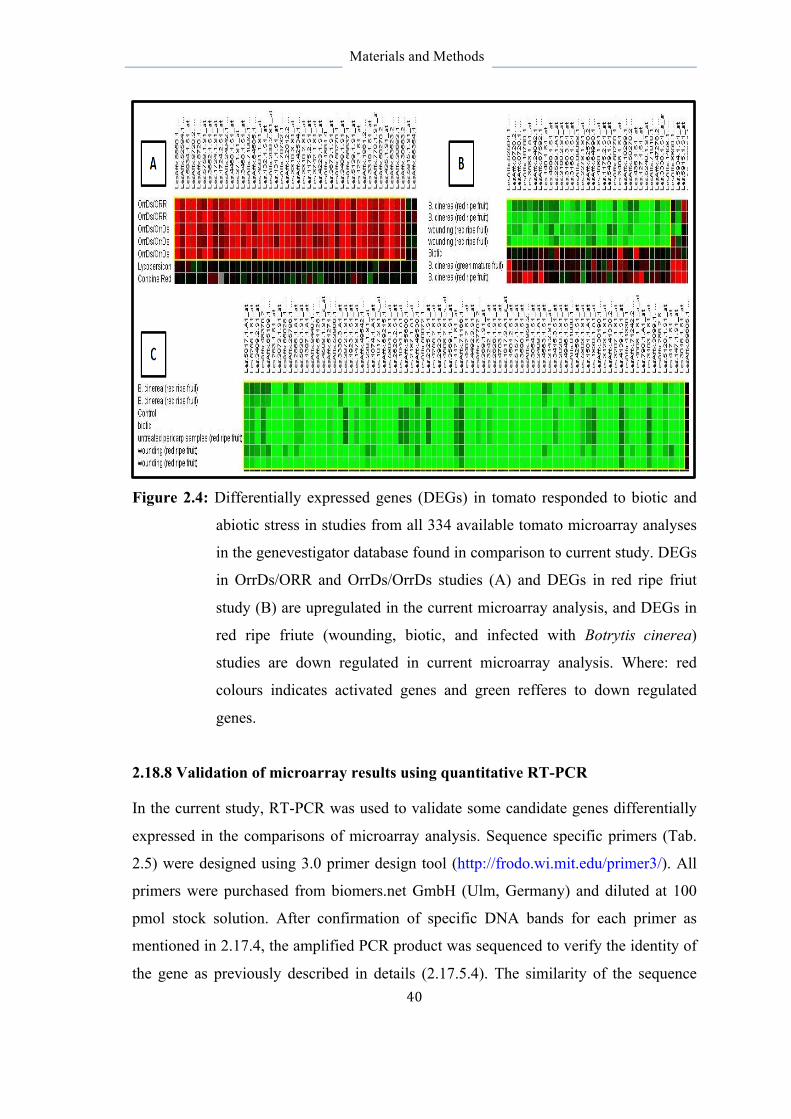
Materials and Methods
40
Figure 2.4: Differentially expressed genes (DEGs) in tomato responded to biotic and
abiotic stress in studies from all 334 available tomato microarray analyses
in the genevestigator database found in comparison to current study. DEGs
in OrrDs/ORR and OrrDs/OrrDs studies (A) and DEGs in red ripe friut
study (B) are upregulated in the current microarray analysis, and DEGs in
red ripe friute (wounding, biotic, and infected with Botrytis cinerea)
studies are down regulated in current microarray analysis. Where: red
colours indicates activated genes and green refferes to down regulated
genes.
2.18.8 Validation of microarray results using quantitative RT-PCR
In the current study, RT-PCR was used to validate some candidate genes differentially
expressed in the comparisons of microarray analysis. Sequence specific primers (Tab.
2.5) were designed using 3.0 primer design tool (http://frodo.wi.mit.edu/primer3/). All
primers were purchased from biomers.net GmbH (Ulm, Germany) and diluted at 100
pmol stock solution. After confirmation of specific DNA bands for each primer as
mentioned in 2.17.4, the amplified PCR product was sequenced to verify the identity of
the gene as previously described in details (2.17.5.4). The similarity of the sequence

Materials and Methods
41
result to the original sequence was verified using the NCBI /BLAST search tool
(http://blast.ncbi.nlm.nih.gov/Blast.cgi).
The total RNA samples from the same biological replicates used for microarray analysis
were used for RT-PCR verification. Total RNase-free DNase-treated and purified RNAs
isolated as described previously were reverse transcribed into cDNA template in 20 µL
reaction using MultiScribeTM Reverse Transcriptase (High-Capacity cDNA Reverse
Transcription Kits, Applied Biosystems) applying the following protocol: 25°C for 10
min, 37°C for 120 min, 85°C for 5 min, and then hold at 4°C. For quantifications, the
RT-PCRs were performed in 20 µL reaction volume containing iTaq SYBR Green
Supermix with ROX (Bio-Rad laboratories, Munich, Germany), the cDNA samples, the
specific forward and reverse primer in ABI PRISM® 7000 sequence detection system
instrument (Applied Biosystems). The thermal cycling parameter was set as 95oC for 3
min, 40 cycles of 15 sec at 95oC and 45 sec at 60oC.
The quantification of gene expression was performed using the relative ΔΔCT method,
which has been described in Applied Biosystems User Bulletin No. 2 (P/N 4303859), by
comparing the data with two internal control genes (GAPDH and TIP41) whose
expression was determined to remain constant under different treatment conditions. The
data was normalized by geometric mean of two endogenous controls. Where, relative
aboundance = 2-ΔΔct
Δct = average ct target – average ct endogenous control*
ΔΔct = Δct target – Δct calibrator**
Expression level (fold chang) = 2-ΔΔct
* Geometric mean of endogenous controls (GAPDH and TIP 41) was used to normalize
each target gene expression 12 hours post inoculation.
** the one with the highest Δct value among the groups was used as a calibrator.

Materials and Methods
42
Table 2.5: Details of primers used for validation of microarrayy results using
quantitative Real Time-PCR analysis
Gene name ACC. No. Primer sequences 5`-3` bp Alpha-DOX1 AY344539 F: AGGCCAGATCCTATTGACCTT
R: CGCCATGAGTCCCACTAATAA 210
Auxin-regulated dual specificity cytosolic kinase
GU184126 F: CTTGGAACCAGTCTTGGACAT R: GACTCTCCGTTGCTTAGCATT
201
chitinase Z15138 F: CTGTGCTTCAAGTCAGCAGTG R: CTGTTGTGCTGTCATCCAGAA
202
Calmodulin-binding protein
B3H796 F: ACAGATGATGAACGCGAAGAC R: AGGGCCATACATGTTGAAACC
201
Expansin12 AF096776 F: CAAGTGATGGAAGGACACTCA R: ACCACAGCAATAGAGCCAAAC
209
Expansin AF059489 F: GATGGTCGCACTGTTGTTTC R: GACAAAAAGTGCCAAACTGC
229
GAPDH U97257 F: GTTGTGGGTGTCAACGAGAAT R: AGCTCTTCCACCTCTCCAGTC
210
Hexose transporter protein
AJ010942 F: TATGATCCCACTTCTCGGTTG R: CCAAATGCACACCTATTTTGTG
179
Hypothetical LOC543672
AF308937 F: TTGTCCACCAACAACAAAGG R: AAGTGTTGTGCAAAGGCAAG
178
Lipoxygenase U37840 F: GACACATTCCCCAGATGAAGA R: CCTGAACTTGGTGCCAATAGT
210
Pathogenesis-related protein P2
X58548 F: CTAGCGTTTACTGCGCTACCT R: TAGCCCAATCCATTAGTGTCC
244
Peroxidase X94943 F: AGATCTTGTCACCCTTGTTGG R: CCGACCATTCCTCAAGTTAGA
241
Pti5 U89256 F: TCGTCCATTACAGTGCATAGG R: ACTGAAACAGAGGCGTTCACT
231
Subtilisin-like protease AJ006377 F: CGTACCACGACGAATAATTGC R: CCCATCTATGGCATCATCGAT
201
TI P 41 AT4G34270
F: ATGGAGTTTTTGAGTCTTCTGC R: GCTGCGTTTCTGGCTTAGG
235
TSI-1 protein Y15846 F: CAAATTTGAAGCTGCTGGAG R: TCTCTCACGTGTGGATCTTTG
212
bp: Amplicon length; F: forwarded primer; R: reverse primer
Materials and Methods
43
2.19 Statistical analysis
The experiments were conducted under completely randomized design. The mean value
of the replicates for each treatment was presented in the results.
All data were analyzed using the Statistical Analysis System (SAS) software package
version 9.2 (SAS Institute Inc., NC, USA). The parameters were analysed using the General
Linear Model of SAS. Mean comparisons were made using Duncan`s Multiple Range test or
Tukey`s Honestly Significant Difference test at 5 % of error probability.
Disease severity parameters were gathered as percentage of infected leaf areas and the
RNA expression analysis for the studied genes was performed based on the relative
standard curve method. Efficacy of bacterial cells and their metabolites against test
pathogens in vitro and in vivo was computed by applying the methods of Abbott (1925).
(Ut- Tr) Efficacy (%) = ------------ × 100 Ut
Whereby; Ut = untreated control
Tr = treated with bacterial cells or metabolites

Results
44
3 RESULTS
3.1 Influence of foliar application of bacterial biocontrol agents FZB24® and
Phytovit® on different leaf diseases of tomatoes
To identify the activity of the biocontrol agents FZB24® and Phytovit® under greenhouse conditions two concentrations were applied on leaves of tomato plants before and after inoculation of the pathogens. The results showed significant reductions in disease severity when the agents were applied prior to inoculation (protective effect). There were no significant differences between the two application rates in most cases, but the suppression was more pronounced with the high application rate 3 g L-1.
Both products reduced severity of late blight disease when applied before and after inoculation of Phytophthora infestans. No significant differences between the two application rates were observed. The reduction achieved by FZB24® when applied before inoculation was higher than 80% with the high concentration (3 g L-1) and over than 60% for the recommended application rate (0.3 g L-1). Phytovit® suppressed disease severity in average about 50% reduction with the exception of spraying the high concentration 3 days before inoculation, which caused 83% reduction compared to the control (Fig. 3.1A).
The efficacy of antagonists to suppress the early blight disease varied in respect to the time and rate of application (Fig. 3.1B). The disease was significantly suppressed by applying FZB24® prior and post Alternaria solani inoculation with one exception when the antagonist (0.3 g L-1) was sprayed one day post inoculation. The antagonistic effect was more pronounced for the higher concentration prior to inoculation. The highest antagonistic activity achieved by FZB24® (3 g L-1) applied one day before inoculation was 85% reduction. Application of Phytovit® resulted in significant reduction of the disease severity by about 50% once the high concentration was used before inoculation.
In figure 3.2A, the data show that Cladosporium fulvum attacked tomato plants causing leaf mold disease with 27% leaf damaged area. The antagonists slightly reduced the disease severity either before or after the inoculation. The reduction was significant approximately 60% using the high application rate of both antagonists applied one day prior to inoculation. Applying the products resulted in no significant differences between the application times and between rates. For Oidium neolycopersici (Fig. 3.2B), the results showed no significant difference in the efficacy between the two products against powdery mildew disease. The antagonists significantly suppressed the disease by 50-70% regardless the application time or the concentrations of the products compared to disease level on untreated control plants.
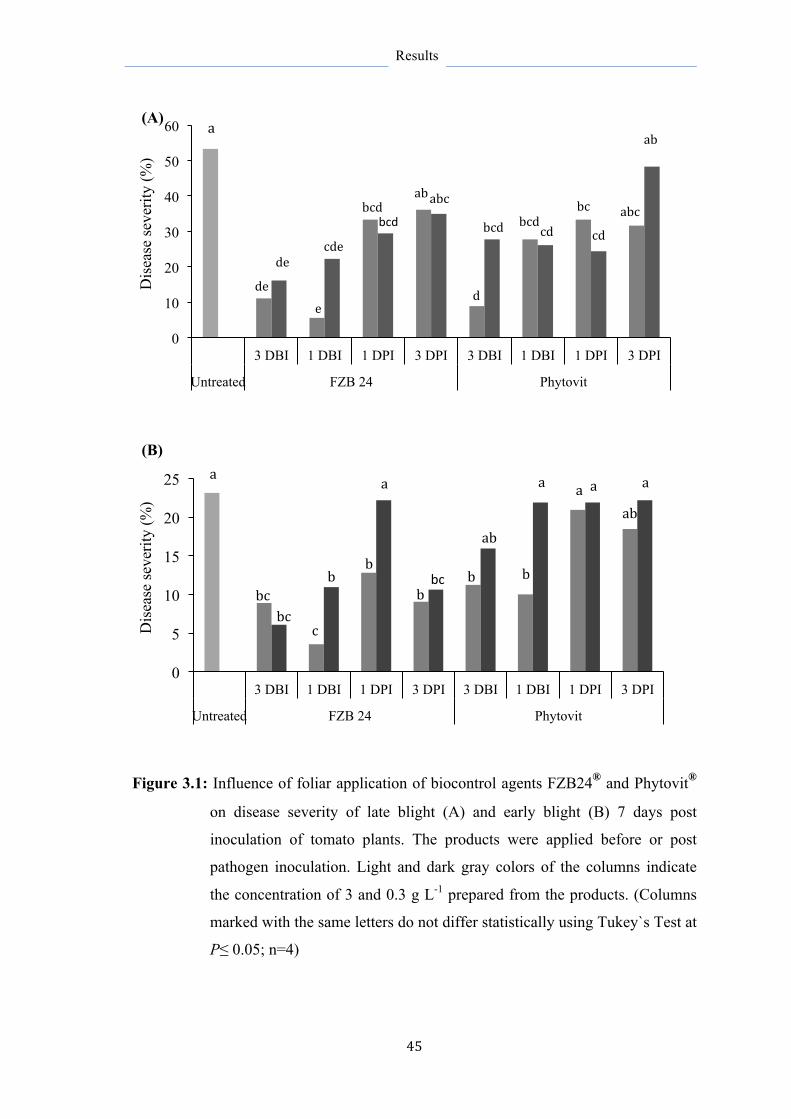
Results
45
Figure 3.1: Influence of foliar application of biocontrol agents FZB24® and Phytovit®
on disease severity of late blight (A) and early blight (B) 7 days post
inoculation of tomato plants. The products were applied before or post
pathogen inoculation. Light and dark gray colors of the columns indicate
the concentration of 3 and 0.3 g L-1 prepared from the products. (Columns
marked with the same letters do not differ statistically using Tukey`s Test at
P≤ 0.05; n=4)
0
10
20
30
40
50
60
3 DBI 1 DBI 1 DPI 3 DPI 3 DBI 1 DBI 1 DPI 3 DPI
Untreated FZB 24 Phytovit
Dis
ease
seve
rity
(%)
a
abc ab
cde
e de
de
d
abc bcd bcd cd
bc
ab
bcd
bcd
cd
(A)
0
5
10
15
20
25
3 DBI 1 DBI 1 DPI 3 DPI 3 DBI 1 DBI 1 DPI 3 DPI
Untreated FZB 24 Phytovit
Dis
ease
seve
rity
(%)
a a aaaab
ab
bc bc
bc b
b bb
c
b
a
(B)
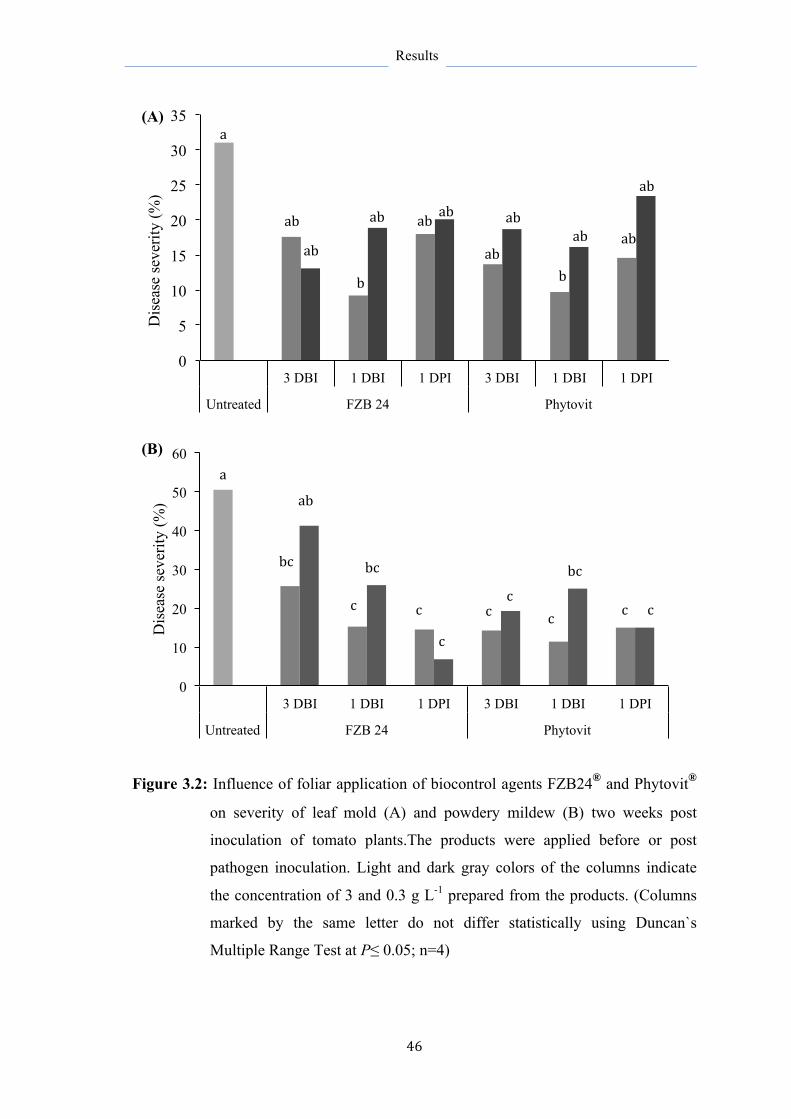
Results
46
Figure 3.2: Influence of foliar application of biocontrol agents FZB24® and Phytovit®
on severity of leaf mold (A) and powdery mildew (B) two weeks post
inoculation of tomato plants.The products were applied before or post
pathogen inoculation. Light and dark gray colors of the columns indicate
the concentration of 3 and 0.3 g L-1 prepared from the products. (Columns
marked by the same letter do not differ statistically using Duncan`s
Multiple Range Test at P≤ 0.05; n=4)
0
5
10
15
20
25
30
35
3 DBI 1 DBI 1 DPI 3 DBI 1 DBI 1 DPI
Untreated FZB 24 Phytovit
Dis
ease
seve
rity
(%)
a
ab ab ab ab
ab
ab ab
ab
ab
b bab
(A)
0
10
20
30
40
50
60
3 DBI 1 DBI 1 DPI 3 DBI 1 DBI 1 DPI
Untreated FZB 24 Phytovit
Dis
ease
seve
rity
(%)
a
c c c
bc
c c c c
c
bc bc
ab
(B)
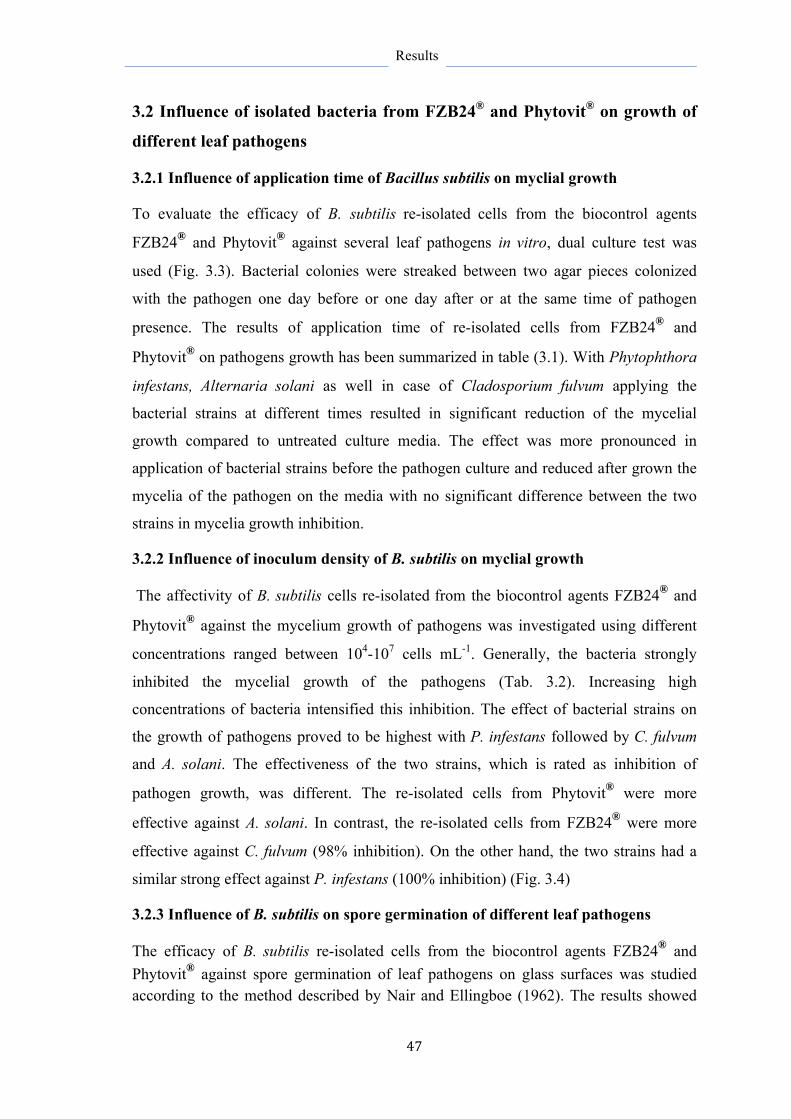
Results
47
3.2 Influence of isolated bacteria from FZB24® and Phytovit® on growth of
different leaf pathogens
3.2.1 Influence of application time of Bacillus subtilis on myclial growth
To evaluate the efficacy of B. subtilis re-isolated cells from the biocontrol agents
FZB24® and Phytovit® against several leaf pathogens in vitro, dual culture test was
used (Fig. 3.3). Bacterial colonies were streaked between two agar pieces colonized
with the pathogen one day before or one day after or at the same time of pathogen
presence. The results of application time of re-isolated cells from FZB24® and
Phytovit® on pathogens growth has been summarized in table (3.1). With Phytophthora
infestans, Alternaria solani as well in case of Cladosporium fulvum applying the
bacterial strains at different times resulted in significant reduction of the mycelial
growth compared to untreated culture media. The effect was more pronounced in
application of bacterial strains before the pathogen culture and reduced after grown the
mycelia of the pathogen on the media with no significant difference between the two
strains in mycelia growth inhibition.
3.2.2 Influence of inoculum density of B. subtilis on myclial growth
The affectivity of B. subtilis cells re-isolated from the biocontrol agents FZB24® and
Phytovit® against the mycelium growth of pathogens was investigated using different
concentrations ranged between 104-107 cells mL-1. Generally, the bacteria strongly
inhibited the mycelial growth of the pathogens (Tab. 3.2). Increasing high
concentrations of bacteria intensified this inhibition. The effect of bacterial strains on
the growth of pathogens proved to be highest with P. infestans followed by C. fulvum
and A. solani. The effectiveness of the two strains, which is rated as inhibition of
pathogen growth, was different. The re-isolated cells from Phytovit® were more
effective against A. solani. In contrast, the re-isolated cells from FZB24® were more
effective against C. fulvum (98% inhibition). On the other hand, the two strains had a
similar strong effect against P. infestans (100% inhibition) (Fig. 3.4)
3.2.3 Influence of B. subtilis on spore germination of different leaf pathogens
The efficacy of B. subtilis re-isolated cells from the biocontrol agents FZB24® and Phytovit® against spore germination of leaf pathogens on glass surfaces was studied according to the method described by Nair and Ellingboe (1962). The results showed
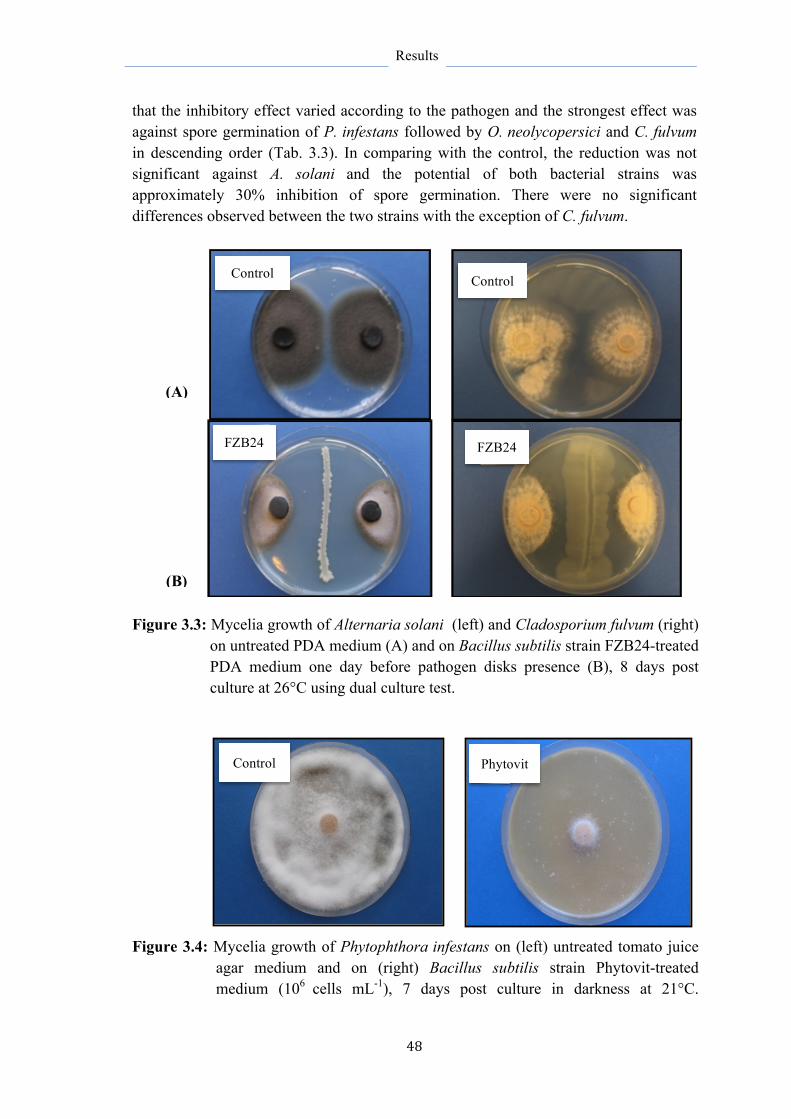
Results
48
that the inhibitory effect varied according to the pathogen and the strongest effect was against spore germination of P. infestans followed by O. neolycopersici and C. fulvum in descending order (Tab. 3.3). In comparing with the control, the reduction was not significant against A. solani and the potential of both bacterial strains was approximately 30% inhibition of spore germination. There were no significant differences observed between the two strains with the exception of C. fulvum.
Figure 3.3: Mycelia growth of Alternaria solani (left) and Cladosporium fulvum (right) on untreated PDA medium (A) and on Bacillus subtilis strain FZB24-treated PDA medium one day before pathogen disks presence (B), 8 days post culture at 26°C using dual culture test.
Figure 3.4: Mycelia growth of Phytophthora infestans on (left) untreated tomato juice
agar medium and on (right) Bacillus subtilis strain Phytovit-treated medium (106 cells mL-1), 7 days post culture in darkness at 21°C.
Control Control
FZB24 FZB24
(A)
(B)
Control Phytovit
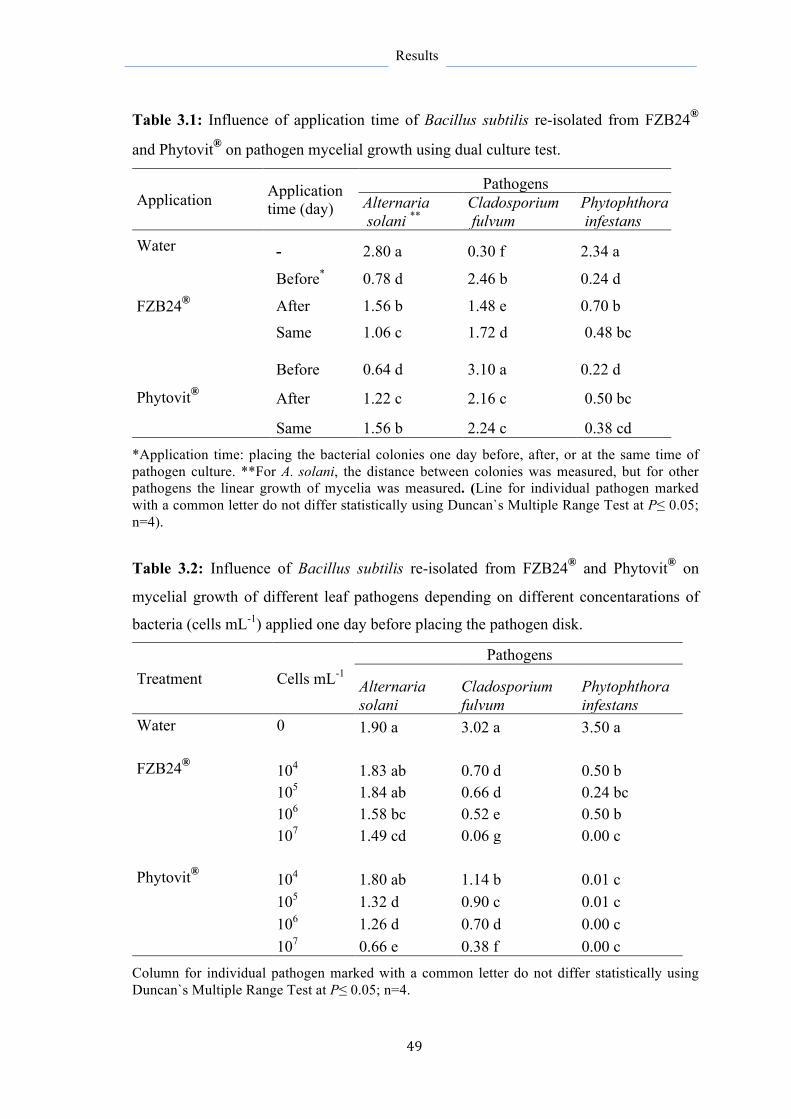
49
Results
Table 3.1: Influence of application time of Bacillus subtilis re-isolated from FZB24®
and Phytovit® on pathogen mycelial growth using dual culture test.
Application Application time (day)
Pathogens Alternaria solani **
Cladosporium fulvum
Phytophthora infestans
Water - 2.80 a 0.30 f 2.34 a
FZB24®
Before* 0.78 d 2.46 b 0.24 d
After 1.56 b 1.48 e 0.70 b
Same 1.06 c 1.72 d 0.48 bc
Phytovit®
Before 0.64 d 3.10 a 0.22 d
After 1.22 c 2.16 c 0.50 bc
Same 1.56 b 2.24 c 0.38 cd *Application time: placing the bacterial colonies one day before, after, or at the same time of pathogen culture. **For A. solani, the distance between colonies was measured, but for other pathogens the linear growth of mycelia was measured. (Line for individual pathogen marked with a common letter do not differ statistically using Duncan`s Multiple Range Test at P≤ 0.05; n=4).
Table 3.2: Influence of Bacillus subtilis re-isolated from FZB24® and Phytovit® on
mycelial growth of different leaf pathogens depending on different concentarations of
bacteria (cells mL-1) applied one day before placing the pathogen disk.
Treatment Cells mL-1 Pathogens
Alternaria solani
Cladosporium fulvum
Phytophthora infestans
Water 0 1.90 a 3.02 a 3.50 a
FZB24®
104 1.83 ab 0.70 d 0.50 b 105 1.84 ab 0.66 d 0.24 bc 106 1.58 bc 0.52 e 0.50 b 107 1.49 cd 0.06 g 0.00 c
Phytovit® 104 1.80 ab 1.14 b 0.01 c 105 1.32 d 0.90 c 0.01 c 106 1.26 d 0.70 d 0.00 c 107 0.66 e 0.38 f 0.00 c
Column for individual pathogen marked with a common letter do not differ statistically using Duncan`s Multiple Range Test at P≤ 0.05; n=4.

50
Results
Table 3.3: Inhibitory effects of Bacillus subtilis re-isolated cells from FZB24® and
Phytovit® on spore germination of different leaf pathogens on glass surface.
Pathogens Germination % Reduction (%)
FZB24® Phytovit®
Phytophthora infestans 70.4 a 69 b 66 b
Alternaria solani 78.3 a 23 a 36 a
Cladosporium fulvum 21.0 a 43 b 76 c
Oidium neolycopersici 81.9 a 59 b 51 b
Means marked with a common letter for individual pathogen do not differ statistically using Duncan`s Multiple Range Test at P≤ 0.05; n=4.
3.2.4 Influence of B. subtilis on developmental structures of different pathogens on
tomato leaf surfaces
The detached leaf assays were carried out to investigate the influence of B. subtilis re-
isolated cells and metabolites from the biocontrol agents FZB24® and Phytovit® on
establishment of three pathogens different in their life cycle and disease development on
tomato leaves. Light microscope was used to make the evaluations.
3.2.4.1 Oidium neolycopersici
The leaflets samples taken 24 hours post inoculation with O. neolycopersici, cleared in
saturated chloralhydrate and stained in Bruzzese solution were observed under the
interference contrast (Fig. 3.5). Bacterial cells significantly suppressed the fungal
development through the whole growth stages; spore germination, appressoria
formation and haustoria by more than 50% inhibition with no obvious differences in the
inhibitory efficacy between FZB24 and Phytovit strains (Fig. 3.6).
3.2.4.2 Alternaria solani
The leaflets samples taken 12 hours post inoculation with A. solani, cleared in saturated
chloralhydrate, and stained in acid Fuchsin solution were observed under the
interference contrast. The fungus produces spores consisting of many cells, which
ranged from 2 to 18 (Fig. 3.5). The number of germinated cells per spore has been
counted and the germination rate of complete cells number of observed spores was
assessed. The bacteria significantly inhibited cell germination by 22.8% for FZB24 and
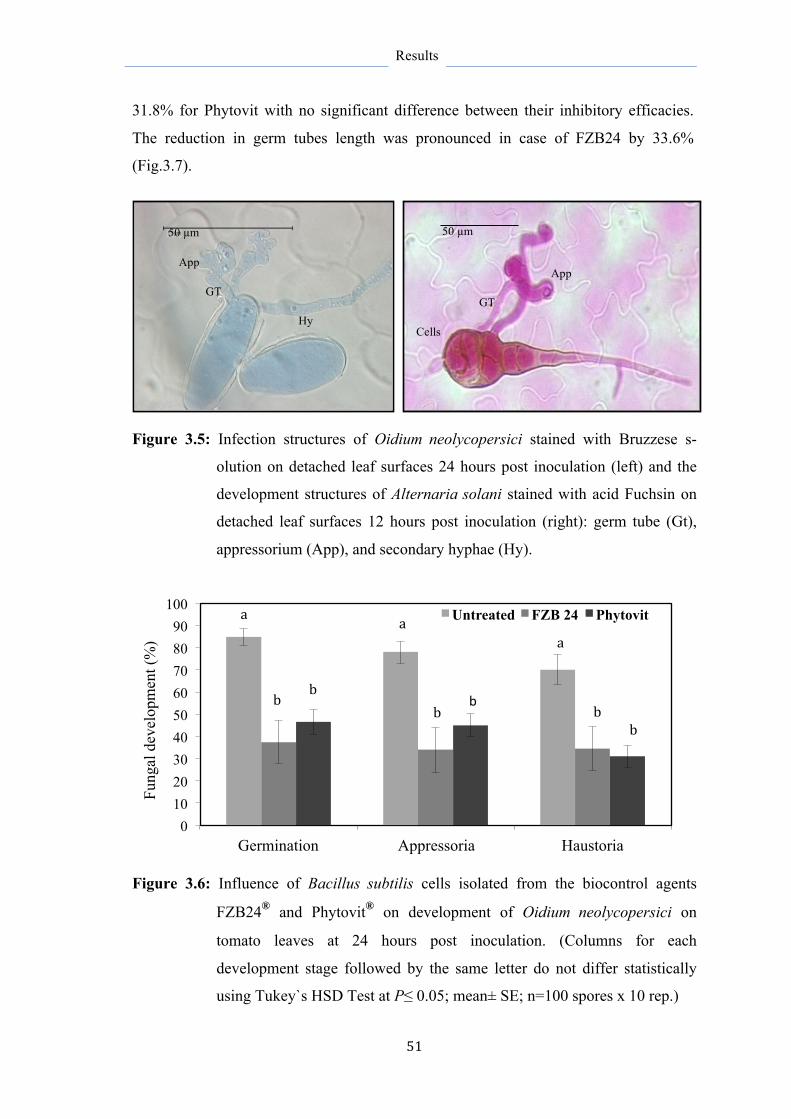
51
Results
31.8% for Phytovit with no significant difference between their inhibitory efficacies.
The reduction in germ tubes length was pronounced in case of FZB24 by 33.6%
(Fig.3.7).
Figure 3.5: Infection structures of Oidium neolycopersici stained with Bruzzese s-
olution on detached leaf surfaces 24 hours post inoculation (left) and the
development structures of Alternaria solani stained with acid Fuchsin on
detached leaf surfaces 12 hours post inoculation (right): germ tube (Gt),
appressorium (App), and secondary hyphae (Hy).
Figure 3.6: Influence of Bacillus subtilis cells isolated from the biocontrol agents
FZB24® and Phytovit® on development of Oidium neolycopersici on
tomato leaves at 24 hours post inoculation. (Columns for each
development stage followed by the same letter do not differ statistically
using Tukey`s HSD Test at P≤ 0.05; mean± SE; n=100 spores x 10 rep.)
0 10 20 30 40 50 60 70 80 90
100
Germination Appressoria Haustoria
Fung
al d
evel
opm
ent (
%)
Untreated FZB 24 Phytovit a
a a
b b
b b
b b
App
GT
Hy
App
GT
Cells
50 µm 50 µm
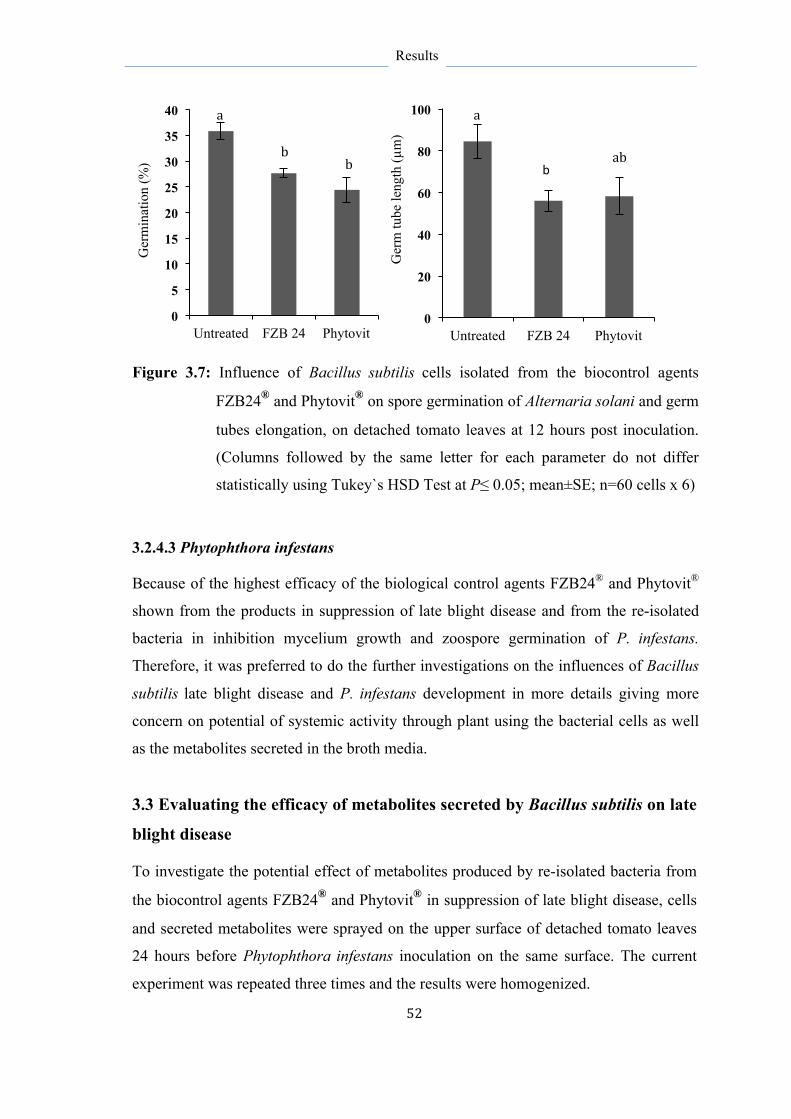
52
Results
Figure 3.7: Influence of Bacillus subtilis cells isolated from the biocontrol agents
FZB24® and Phytovit® on spore germination of Alternaria solani and germ
tubes elongation, on detached tomato leaves at 12 hours post inoculation.
(Columns followed by the same letter for each parameter do not differ
statistically using Tukey`s HSD Test at P≤ 0.05; mean±SE; n=60 cells x 6)
3.2.4.3 Phytophthora infestans
Because of the highest efficacy of the biological control agents FZB24® and Phytovit®
shown from the products in suppression of late blight disease and from the re-isolated
bacteria in inhibition mycelium growth and zoospore germination of P. infestans.
Therefore, it was preferred to do the further investigations on the influences of Bacillus
subtilis late blight disease and P. infestans development in more details giving more
concern on potential of systemic activity through plant using the bacterial cells as well
as the metabolites secreted in the broth media.
3.3 Evaluating the efficacy of metabolites secreted by Bacillus subtilis on late
blight disease
To investigate the potential effect of metabolites produced by re-isolated bacteria from
the biocontrol agents FZB24® and Phytovit® in suppression of late blight disease, cells
and secreted metabolites were sprayed on the upper surface of detached tomato leaves
24 hours before Phytophthora infestans inoculation on the same surface. The current
experiment was repeated three times and the results were homogenized.
0
5
10
15
20
25
30
35
40
Untreated FZB 24 Phytovit
Ger
min
atio
n (%
)
a
b b
0
20
40
60
80
100
Untreated FZB 24 Phytovit
Ger
m tu
be le
ngth
(µm
)
a
ab b

53
Results
Re-isolated cells and the metabolites harvested different times after culturing
significantly reduced the disease severity (Fig. 3.8). Metabolites clearly suppressed the
disease more than the bacterial cells compared to untreated leaves. The highest
reduction (89%) was achieved from metabolites of B. subtilis strain FZB24 extracted
after 72 hours of culturing (M72). In addition, the autoclaved metabolites (M72
autoclaved), heated at 121°C for 20 min, showed stability to suppress the disease by
70% reuction. The metabolites harvested from re-suspended bacterial cells in water for
one hour (M1) and for 24 hours (M24) reduced significantly the disease severity by 36-
70% reduction. In case of Phytovit strain, the reduction ranged between 42 and 61%.
No significant difference between FZB24 and Phytovit was declared in favor of the
FZB24. Moreover, application of culture medium (SGM) used in metabolites
production showed no potential activity to reduce the disease severity compared to the
control.
Figure 3.8: Influence of bacterial cells re-isolated from the biocontrol agents FZB24®
and Phytovit® and their metabolites (M) harvested 1, 24, and 72 hours of
culturing on late blight disease severity on detached tomato leaves 6 days
post inoculation with Phytophthora infestans, which applied 24 hours after
treatments spraying. (Columns marked with the same letters for each
products in comparison to the untreated do not differ statistically using
Tukey`s HSD Test at P≤ 0.05; mean ± SE; n=4)
0 10 20 30 40 50 60 70 80 90
Wat
er
Bro
th
Cel
ls
M 1
M 2
4
M 7
2hea
ted
M 7
2
Cel
ls
M 1
M 2
4
M 7
2hea
ted
M 7
2
Untreated FZB 24 Phytovit
Dis
ease
seve
rity
(%)
a a b bc bc c d b bc b bc c

54
Results
3.4 Influence of cells and metabolites from Bacillus subtilis strain FZB24 on development of late blight and Phytophthora infestans
3.4.1 Effects on colonization of leaves
3.4.1.1 Influence on late blight disease development
To investigate the influence of B. subtilis strain FZB24 cells and metabolites on progresses of late blight disease symptoms, the diseases severity was evaluated from P. infestans inoculated untreated leaves and cell-/metabolite-treated leaves, from both attached leaves (single plant) and detached leaves maintained in plastic boxes under the same conditions.
No symptoms of infection were observed on any of the tomato leaves in the first 24 hours following inoculation. Within several days (2-3), the first cells involved in the interaction died. Three days after inoculation, several small black lesions were seen on surfaces of leaves inoculated with P. infestans. By six days after inoculation, severe symptoms were observed on all inoculated attached and detached leaves. The progress of disease was slightly more on detached than attached leaves. The efficacy of protection was higher in attached than in detached leaves with accelerated senescence (Fig. 3.10). Both cells and metabolites were effective in preventing pathogen infection; they inhibited the disease development on tomato leaves and significantly reduced the expansion of existing late blight lesions (Fig. 3.9). More than 80% reduction of disease severity was calculated on inoculated attached treated leaves. However, the potential of treatments to suppress the disease development on detached leaves was about 70% reduction of disease severity. Likewise, no symptoms were observed on non-inoculated tomato plants treated with water.
Untreated leaf Cell-treated leaf Metabolite-treated leaf Figure 3.9: Effect of Bacillus subtilis cells and metabolites on disease symptoms of late
blight on detached tomato leaves 6 days post inoculation with Phytophthora infestans (105 sporangia mL-1).

55
Results
Figure 3.10: Influence of Bacillus subtilis strain FZB24 on late blight disease on
attached and detached tomato leaves. Cells and metabolites were applied
24 hours prior inoculation with Phytophthora infestans (105 sporangia
mL-1). (Star refers to a significant difference between leaf types at each
sampling point using Tukey‘s HSD Test at P≤ 0.05; mean ± SE; n= 4)
0
20
40
60
80
0 dpi 2 dpi 4 dpi 6 dpi
Dis
ease
seve
rity
(%)
Attached Detached
Untreated
0
20
40
60
80
0 dpi 2 dpi 4 dpi 6 dpi
Dis
ease
seve
rity
(%) Cell-treated
*
0
20
40
60
80
0 dpi 2 dpi 4 dpi 6 dpi
Dis
ease
seve
rity
(%) Metabolite-treated
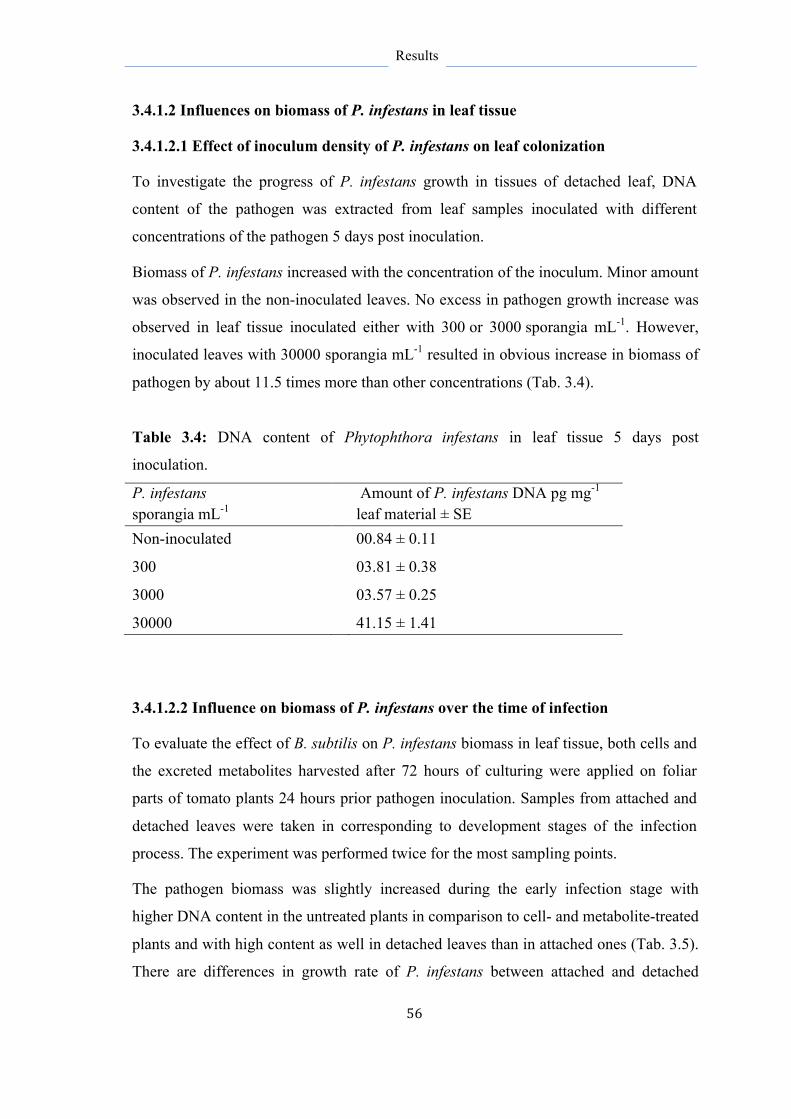
56
Results
3.4.1.2 Influences on biomass of P. infestans in leaf tissue
3.4.1.2.1 Effect of inoculum density of P. infestans on leaf colonization
To investigate the progress of P. infestans growth in tissues of detached leaf, DNA
content of the pathogen was extracted from leaf samples inoculated with different
concentrations of the pathogen 5 days post inoculation.
Biomass of P. infestans increased with the concentration of the inoculum. Minor amount
was observed in the non-inoculated leaves. No excess in pathogen growth increase was
observed in leaf tissue inoculated either with 300 or 3000 sporangia mL-1. However,
inoculated leaves with 30000 sporangia mL-1 resulted in obvious increase in biomass of
pathogen by about 11.5 times more than other concentrations (Tab. 3.4).
Table 3.4: DNA content of Phytophthora infestans in leaf tissue 5 days post
inoculation.
P. infestans sporangia mL-1
Amount of P. infestans DNA pg mg-1
leaf material ± SE Non-inoculated 00.84 ± 0.11
300 03.81 ± 0.38
3000 03.57 ± 0.25
30000 41.15 ± 1.41
3.4.1.2.2 Influence on biomass of P. infestans over the time of infection
To evaluate the effect of B. subtilis on P. infestans biomass in leaf tissue, both cells and
the excreted metabolites harvested after 72 hours of culturing were applied on foliar
parts of tomato plants 24 hours prior pathogen inoculation. Samples from attached and
detached leaves were taken in corresponding to development stages of the infection
process. The experiment was performed twice for the most sampling points.
The pathogen biomass was slightly increased during the early infection stage with
higher DNA content in the untreated plants in comparison to cell- and metabolite-treated
plants and with high content as well in detached leaves than in attached ones (Tab. 3.5).
There are differences in growth rate of P. infestans between attached and detached

57
Results
leaves. DNA contents 144 hours post inoculation were 100 times and about 485 times
more than 3 hours post inoculation in attached and detached untreated leaves,
respectively. That means P. infestans colonized detached leaf tissue better than attached
leaves and the increase in growth rate was 5 times faster. For treated plants, Data
showed that both cells and metabolites reduced pathogen biomass in leaf tissues with no
significant difference observed in efficacy between cells and metabolites. The
effectiveness to suppress the pathogen growth after 6 days of inoculation were more
than 80% in attached leaves compared to about 60% in detached ones for both the cells
and metabolites. Interestingly, the effect of cells and metabolites applied on attached
leaves showed higher reduction than in detached leaves by 2 fold, which means
probability of elevation in treatments efficacy to suppress the pathogen development in
the attached leaves. In addition, the approximately similar amounts of pathogen DNA
detected at 3 hpi showed no differences in inoculum density applied either on attached
or detached treated or untreated leaves. In non-inoculated leaves, the quantification
adjusted a small amount of pathogen DNA due to natural infection (data is not shown).
Table 3.5: DNA content of pathogen biomass [pg/mg leaf dry weight] in tomato leaf
tissues inoculated with 105 sporangia mL-1 of Phytophthora infestans after 24 hours of
Bacillus subtilis strain FZB24 cells or metabolites applications.
Sampling dates
Inoculated-attached leaves Inoculated-detached leaves Un treated
Cell-treated
Metabolite-treated
Un treated
Cell-treated
Metabolite-treated
3 hpi 62.1 a 48.0 a 58.1 a 63.1 a 68.8 a 51.6 a
6 hpi 62.8 a 37.6 a 28.0 a 64.0 a 47.8 a 54.2 a
12 hpi 81.6 a 62.1 a 61.6 a 121.1 a 67.9 a 79.9 a
24 hpi 76.5 a 58.7 a 54.7 a 123.4 a 102.4 a 73.1 a
48 hpi 172.9 a 78.9 a 84.0 a 215.6 a 99.2 a 98.4 a
96 hpi 1105.4 a 247.2 b 84.1 b 14007.4 a 1246.5 b 778.5 b
144 hpi 6226.5 a 1058.6 b 1126.0 b 29003.5 a 17310 a 11351.1 b
Data represent means of four measurements and each measurement is a mean of two runs in RT-PCR. (Means followed by the same letters within each line for attached or detached separately are not significantly different at P≤0.05; mean ± SE; n=4)
58
Results
3.4.1.3 Influence on development structures of P. infestans
To gain a better understanding in which way the B. subtilis strain FZB24 (cells and their
excreted metabolites harvested 72 of culturing) reduces disease severity and which
development structure are involved, their influences on early stages of P. infestans
growth were investigated. Samples taken in concerning the infection course, discolored
in saturated chloralhydrate, and stained using acid Fuchsin solution were used to
observe the growing stages of P. infestans on treated and untreated detached leaves (Fig.
3.11). The experiment was performed twice and the results represent the data of the
second once.
The results showed the effect of both cells and metabolites on the pathogen
development in the early infection stages before as well as after penetration of the host
plant cells (Fig. 3.12). Three hours post inoculation a slight decrease in the germination
rate followed by a significant reduction in the pathogen ability to form the appressoria
and to penetrate the epidermal cells was observed. Six hours post inoculation the
treatments affected on the ability of the pathogen to penetrate the epidermis cells and
form a primary vesicles, which was obviously reduced by 23% with a slight effect on
the vesicles size. However, metabolites application showed significant decrease in
haustoria formation inhibiting the intracellular growth of P. infestans by more than 30%,
while no influence was observed in cell-treated leaves. Pathogen after penetration the
epidermis continued growing intercellularly in the mesophyll at 12 hours post
inoculation. While no obvious effects on pathogen growth in palisade mesophyll in
treated leaves, both cells and metabolites significantly inhibited the further development
in spongy mesophyll at 12 hours post inoculation, followed after 24 hours of inoculation
by a strong reduction in the number of infected host cells per infection side by 25% and
45% for cells and metabolites, respectively. Subsequently, the inhibition effect of both
cells and metabolites on pathogen growth, which was evident from the first stages of
infection, resulted in significant reduction in late blight disease symptoms on tomato
leaves in favor of metabolites.

Results
59
Figure 3.11: Developmental structures of Phytophthora infestans in the early stages of
infection of tomato leaves: zoospore (Z), germ tube (Gt), appressorium
(App), primary vesicles (Pv), hyphae (Ha).
A) Zoospore germination, elongation of germ tube and appressorium
formation at 3 hours post inoculation
B) Primary vesicle body and haustoria in epidermis at 6 hours post
inoculation
C) Intercellular hyphae between the palisade mesophyll cells and
haustoria formation at 12 hours post inoculation
D) Pathogen structures inside damaged mesophyll cells at 24 hours post
inoculation
C D
10 µm 20 µm
A B
20 µm 20 µm
Pv Ha App z Gt
Hv Ha
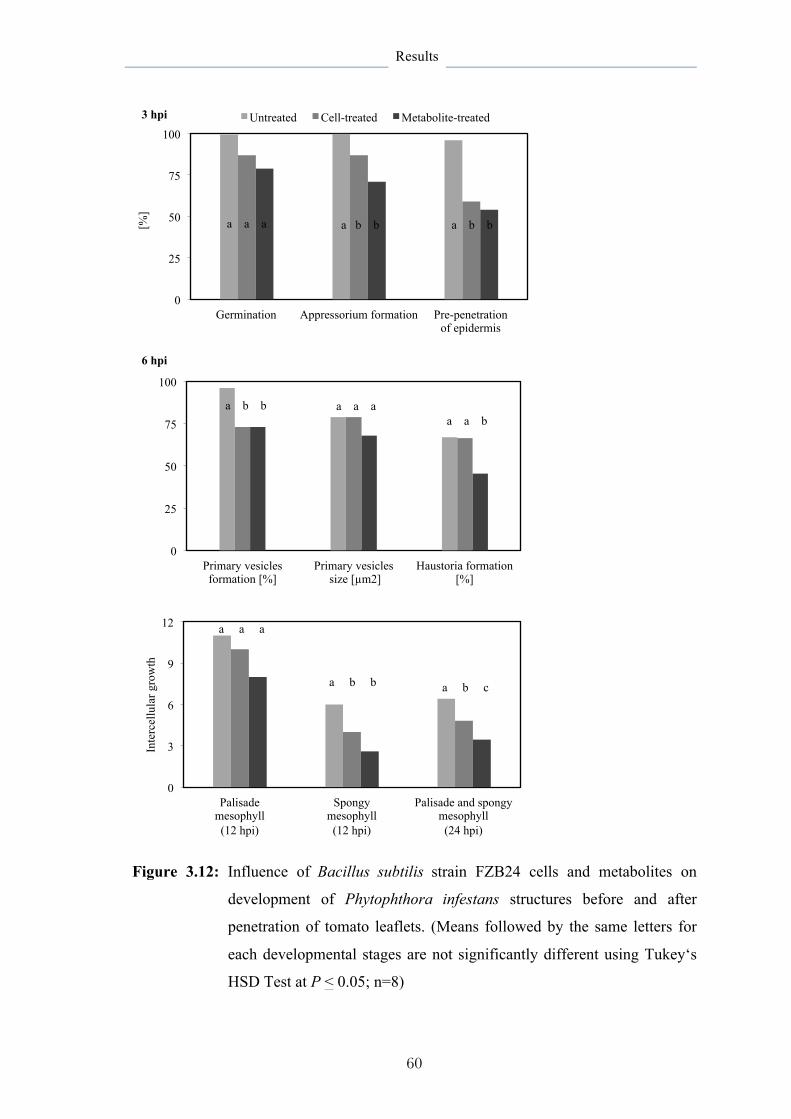
Results
60
Figure 3.12: Influence of Bacillus subtilis strain FZB24 cells and metabolites on
development of Phytophthora infestans structures before and after
penetration of tomato leaflets. (Means followed by the same letters for
each developmental stages are not significantly different using Tukey‘s
HSD Test at P < 0.05; n=8)
0
25
50
75
100
Germination Appressorium formation Pre-penetration of epidermis
[%]
Untreated Cell-treated Metabolite-treated
a a a
3 hpi
a b b a b b
0
25
50
75
100
Primary vesicles formation [%]
Primary vesicles size [µm2]
Haustoria formation [%]
6 hpi
a b b a a b
a a a
0
3
6
9
12
Palisade mesophyll (12 hpi)
Spongy mesophyll (12 hpi)
Palisade and spongy mesophyll (24 hpi)
Inte
rcel
lula
r gro
wth
a a a
a b b a b c
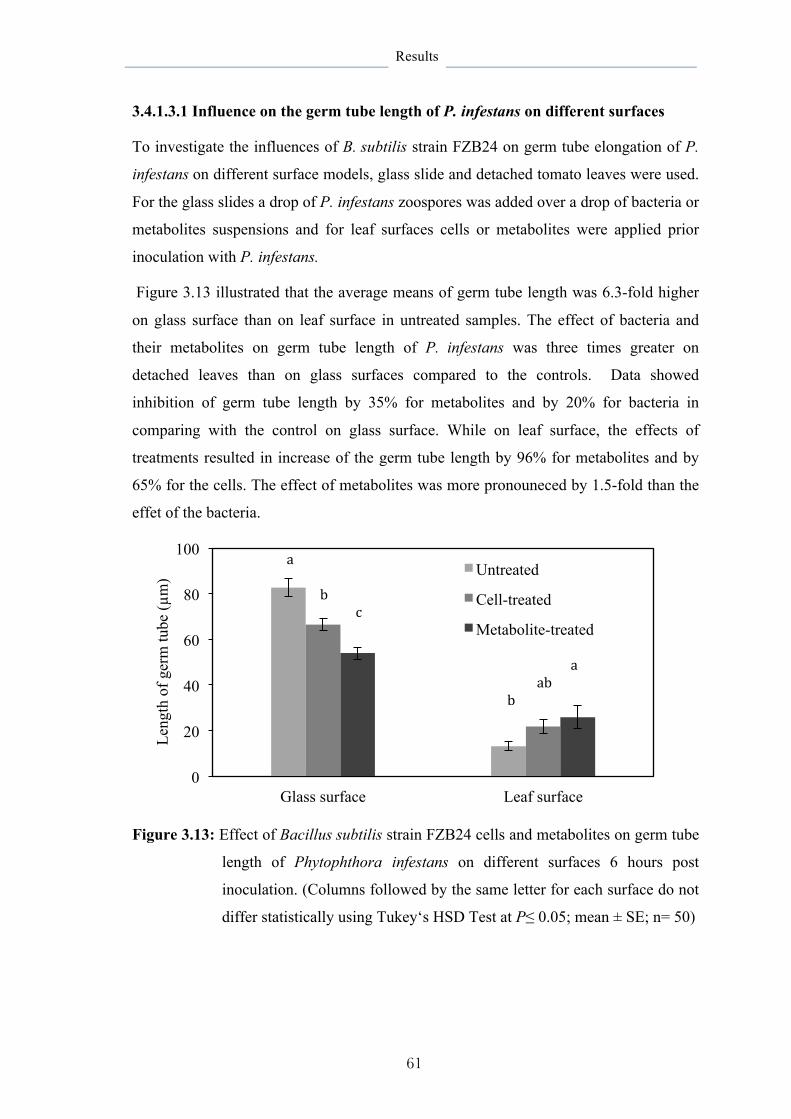
Results
61
3.4.1.3.1 Influence on the germ tube length of P. infestans on different surfaces
To investigate the influences of B. subtilis strain FZB24 on germ tube elongation of P.
infestans on different surface models, glass slide and detached tomato leaves were used.
For the glass slides a drop of P. infestans zoospores was added over a drop of bacteria or
metabolites suspensions and for leaf surfaces cells or metabolites were applied prior
inoculation with P. infestans.
Figure 3.13 illustrated that the average means of germ tube length was 6.3-fold higher
on glass surface than on leaf surface in untreated samples. The effect of bacteria and
their metabolites on germ tube length of P. infestans was three times greater on
detached leaves than on glass surfaces compared to the controls. Data showed
inhibition of germ tube length by 35% for metabolites and by 20% for bacteria in
comparing with the control on glass surface. While on leaf surface, the effects of
treatments resulted in increase of the germ tube length by 96% for metabolites and by
65% for the cells. The effect of metabolites was more pronouneced by 1.5-fold than the
effet of the bacteria.
Figure 3.13: Effect of Bacillus subtilis strain FZB24 cells and metabolites on germ tube
length of Phytophthora infestans on different surfaces 6 hours post
inoculation. (Columns followed by the same letter for each surface do not
differ statistically using Tukey‘s HSD Test at P≤ 0.05; mean ± SE; n= 50)
0
20
40
60
80
100
Glass surface Leaf surface
Leng
th o
f ger
m tu
be (µ
m) Untreated
Cell-treated
Metabolite-treated
a
b c
a ab
b

Results
62
3.4.2 Systemic activity of B. subtilis strain FZB24 in tomato plants
3.4.2.1 Translaminar translocation
To investigate the systemic protection of B. subtilis strain FZB24 to suppress late blight disease through leaf tissues, both cells and their metabolites harvested 72 hours after culturing were sprayed 24 hours prior P. infestans inoculation. Both B. subtilis and P. infestans were applied (i) on the same side of leaf surface either the upper or the lower side and (ii) on different sides one on the upper side and the other on the lower side or vice versa. The experiment was repeated three times given the same trend of results. When B. subtilis cells or metabolites and P. infestans were sprayed on the same surface, the reduction of disease severity was higher than when they were sprayed on different sides of tomato leaf surface indicating to the direct effect on the pathogen (Fig. 3.14). The results showed reduction in disease severity by 43% for cells, while the potential activity of metabolites was 70.3% on the lower leaf surface and more than 90% on the upper side. In case of B. subtilis cells or metabolites applied on one side and P. infestans applied on the other side of leaf surfaces, both cells and metabolites reduced disease severity. Cells when sprayed on the lower surface and P. infestans on upper side were more effective than when applied on the opposite sides causing 40% and 16% reduction, respectively. However, metabolites reduced disease severity more than 50 % regardless of the application side.
Figure 3.14: Influence of Bacillus subtilis strain FZB24 applied 24 hours prior
inoculation with Phytophthora infestans on late blight disease severity on detached tomato leaves 6 days post inoculation: pathogen (P), cells or metabolites treatment (T), spraying on the upper (+) and on the lower (-) leaf surface. (Columns marked with the same letters do not differ statistically using Tukey`s HSD Test at P≤ 0.05; mean ± SE; n=4)
0 10 20 30 40 50 60 70 80 90
P- P+ P- T- P+ T+ P- T- P+ T+ P- T+ P+ T- P- T+ P+ T-
Cells Metabolites Cells Metabolites
Untreated On the same surface On the different surfaces
Dis
ease
seve
rity
(%)
a b cde c
b
de e e
f g
a

Results
63
3.4.2.2 Apical translocation
To investigate the systemic activity of B. subtilis strain FZB24 through up tomato
plants, the re-isolated cells and metabolites harvested 72 hours after culturing were
sprayed on the lower leaf pairs of tomato plants 24 hours prior P. infestans inoculation,
which was sprayed on the lower and upper leaves of treated and untreated plants. The
experiment was repeated three times and the data shown are from the most
homogenized one.
Data showed that disease severity was more pronounced on the lower leaves than on the
upper ones in untreated and cell-treated plants, while was the opposite for metabolites
treated plants without significant difference in disease severity between lower and upper
leaves for each treatments (Fig. 3.15). No significant differences in reduction of disease
severity between lower and upper leaves in treated plants were observed. Reduction in
disease severity was more pronounced after the application of metabolites with
significant differences in efficacies between cells and metabolites only on the treated-
lower leaves. Results showed that cells reduced disease severity by 40% reduction,
which was significant on treated-lower leaves and not on untreated-upper ones.
However, metabolites applications resulted in significant reduction on both lower and
upper leaves by 57 and 68% reduction, respectively.
Results of evaluating the symptoms development of late blight disease on tomato leaves
during pathogenesis illustrate the mean of disease severity from both upper and lower
leaves (Fig. 3.16). The disease severity clearly increased by the time from 30% 2 days
after inoculation to over 80% 6 days after inoculation on the untreated plants. The
disease symptoms appeared in cell- and metabolite-treated plants slowly. Therefore, the
results showed a high reduction in disease severity of late blight achieved by B. subtilis
cells and metabolites in comparison to untreated plants.
Reduction in disease development was more pronounced after the application of
metabolites, which reduced the disease severity by 70%, while application of bacterial
cells reduced the severity by 44%.

Results
64
Figure 3.15: Apical translocation activity of Bacillus subtilis strain FZB24 through the
plants against late blight disease 5 days post inoculation. Cells and
metabolites were applied 24 hours on the lower leaves prior inoculation
with Phytophthora infestans (105 sporangia mL-1) on the upper and lower
leaves. (Columns followed by the same letter do not differ statistically
using Tukey`s HSD Test at P≤ 0.05; mean ± SE; n=4)
Figure 3.16: Influence of Bacillus subtilis strain FZB24 on symptom development of
late blight disease on tomato leaves. Cells and metabolites were applied
24 hours prior inoculation with Phytophthora infestans (105 sporangia
mL-1). (Means followed by the same letters at each time point are not
significantly different using Tukey‘s HSD Test at P < 0.05; n =4)
0
10
20
30
40
50
60
70
Untreated plants Cell-treated plants Metabolite-treated plants
Dis
ease
seve
rity
[%]
Treated-lower leaves Untreated-upper leaves a
ab
b
bc
d cd
0 10 20 30 40 50 60 70 80 90
2 3 4 5 6
Dis
ease
seve
rity
[%]
Days post inoculation
Untreated Cell-treated Metabolite-treated
a b b
a
a b
a
a b c c
b b b b

Results
65
3.5 Influence of cells and metabolites of Bacillus subtilis strain FZB24 on
expression profile of PR1a gene in tomato leaves
To gain a better understanding of the mode of action of B. subtilis strain FZB24 in
suppression of late blight disease, the effects of cells and metabolites harvested 72
hours after culturing on differential expression of PR1a gene in both pathogen free leaf
tissue and in Phytophthora infestans infected leaf tissue were investigated. The plants
were divided into two groups, non-inoculated and P. infestans-inoculated plants. Cells
and metabolites were applied on the lower leaf pairs 24 hours before pathogen
inoculation on the upper and lower leaves for each plant. Sampling times are in
corresponding with the pathogen development.
3.5.1 Expression level of PR1a in non-inoculated leaves
To measure the activation time of PR1a gene, lower and upper leaves detached from
non-inoculated plants different hours after cells and metabolites application were used.
There was an increase in the expression level of PR1a gene by the time in both
untreated and treated plants (Tab. 3.6). This alteration in gene expression slightly and
continuously increased in untreated and cell-treated leaves and then more clearly later
on. No significant difference in gene activation was observed between untreated and
cell-treated plants at all sampling dates. Activation in gene expression was detected
starting from 30 hours after application of metabolites in the lower leaves and later by 6
hours in the upper leaves (36 hours post application).
3.5.2 Expression level of PR1a in P. infestans-inoculated leaves
For the lower leaves, alterations in expression level of PR1a gene were measured two
hours after P. infestans inoculation, approx. 24 hours after cell- and metabolite-
applications, at the recognition time between pathogen and the host (Fig. 3.17). The
alterations in P. infestans-inoculated treated leaves were faster than in inoculated
untreated ones. A remarkable decrease in the expression level of the gene was observed
6 hours post inoculation in comparison to 2 hours post inoculation. Afterwards, 12
hours post inoculation, there was a significant stimulation observed in metabolite-
treated lower leaves in comparison to the untreated plants. Interestingly, highest level of

Results
66
expression has been found 48 hours post inoculation, the time of transition phase from
the biotrophic to the necrotrophic phase, in favour of untreated leaves.
In the upper leaves, the results showed activation in the expression levels of PR1a gene
in upper leaves of P. infestans-inoculated plants with progress of infection (Fig. 3.18).
No alterations in expression level of PR1a gene between treated and untreated plants
were determined 6 hours post inoculation. Twelve hours post inoculation, gene
expression level in upper leaves was in metabolite-treated plants significantly higher
than in cell-treated plants and as well higher than in untreated plants. A noteworthy
activation in the expression levels of PR1a gene has been found 48 hours post
inoculation regarding the huge number of altered cells in consequence of further
infections. This alteration in untreated plants was not significant but higher than in the
treated samples.
Table 3.6: Time course study of relative expression of PR1a gene in upper and lower
leaves of non-inoculated plants different hours after application of Bacillus subtilis
strain FZB24. Both cells and metabolites were applied on the lower leaves and were
detached from the plant different hours after application.
Leaf type Hours post application Untreated Cell-treated Metabolite-treated
Lower leaves 6 1092 b 138 b 107 c
12 68 b 162 b 270 c
24 557 ab 728 ab 1413 bc
30 276 b 698 b 2631* bc
36 2018 a 1237 ab 3271 b
72 1971 a 5318 a 8637* a
Upper leaves 6 20.8 b 31.3 b 28.8 b
12 24.6 b 25.4 b 69.3 b
24 31.1 b 32.3 b 55.8 b
30 61.8 b 45.5 b 39.1 b
36 142.9 b 155.8 b 499.3* b
72 741.1 a 1386 a 3404.4* a
Means followed by the same letters for each leaf type and separately for each treatment, while means followed by asterisks for each time date on the same line are not significantly different using Duncan's multiple range Test at P < 0.05; n=4.
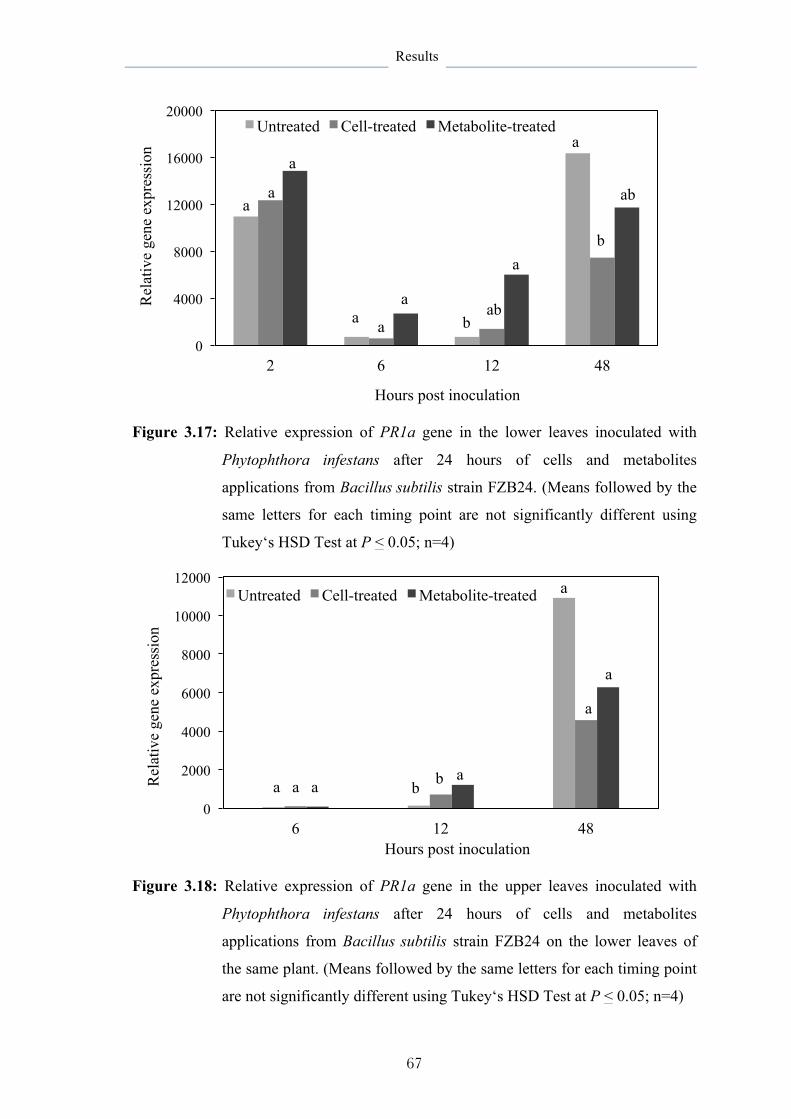
Results
67
Figure 3.17: Relative expression of PR1a gene in the lower leaves inoculated with
Phytophthora infestans after 24 hours of cells and metabolites
applications from Bacillus subtilis strain FZB24. (Means followed by the
same letters for each timing point are not significantly different using
Tukey‘s HSD Test at P < 0.05; n=4)
Figure 3.18: Relative expression of PR1a gene in the upper leaves inoculated with
Phytophthora infestans after 24 hours of cells and metabolites
applications from Bacillus subtilis strain FZB24 on the lower leaves of
the same plant. (Means followed by the same letters for each timing point
are not significantly different using Tukey‘s HSD Test at P < 0.05; n=4)
0
4000
8000
12000
16000
20000
2 6 12 48
Rel
ativ
e ge
ne e
xpre
ssio
n
Hours post inoculation
Untreated Cell-treated Metabolite-treated
a a
a
a a
a
a
ab a
b
ab
b
0
2000
4000
6000
8000
10000
12000
6 12 48
Rel
ativ
e ge
ne e
xpre
ssio
n
Hours post inoculation
Untreated Cell-treated Metabolite-treated
a a a a
a
a
b
a
b
Results
68
3.6 Effects of Bacillus subtilis strain FZB24 on gene expression of infected
leaves with Phytophthora infestans
After confirming the effectiveness of Bacillus subtilis strain FZB24 in reducing the
disease severity of late blight on tomato plants 6 days post inoculation (Fig. 3.16),
freeze-dried upper leaves harvested from treated and untreated, non-inoculated and P.
infestans-inoculated plants 12 hours post inoculation were used to isolate total RNAs,
which were further analyzed by hybridizing to the Affymetrix Tomato Genome Array
Gene Chip.
Following comparisons were made to investigate plant responses in absence and
presence of P. infestans either in treated or untreated plants:
Treatment Comparison
untreated Inoculated X Non-inoculated
Non-inoculated Cell-treated X Untreated
Metabolite-treated X Untreated
Cell-treated X metabolite- treated
Inoculated Cell-treated X Untreated
Metabolite-treated X Untreated
Cell-treated X metabolite- treated
3.6.1 Host responses towards P. infestans infection
Array analysis showed that pathogen infection, 12 hours post inoculation, affected the
expression level of a substantial number of genes compared to non-inoculated plants.
From the total 682 differentially expressed genes, the expression levels of 429 genes
were abundantly upregulated in inoculated leaves in which 75% exhibited 2 to 4 fold
change increase and 25% of them exhibited 4.1 to 44.8 fold change increased compared
to the non-inoculated plants. On the other hand, the expression level of 253
differentially expressed genes was reduced after infection. From those 96.2% exhibited
2 to 4 and 3.2% showed 4.1 to 10 fold change decreases in inoculated plants compared
to the non-inoculated ones (Fig. 3.19).

Results
69
To analyze the Gene Ontology (GO) annotation of the differentially expressed genes
after pathogen infection, the gene ontology (GO) of biological process (Fig. 3.20) and
molecular function (Fig. 3.21) was done to help investigating the nature and distribution
of the molecular changes after pathogen infection. Different biological processes were
found to be involved in the elevated differentially expressed genes (DEGs), which
revealed more intensively in the upregulated genes. Analyses indicated that metabolic
processes including lipid, carbohydrate, and amino acid; protein turnover process; cell
related functions including cell death, cellular growth and development, response to
stress and signaling; and the transcription processes were the most significant functions
that were targeted to be modulated by infection. Remarkably, the analysis showed down
regulation for most genes involved in photosynthesis function (LOC543976,
LOC543974, AT3G60370, AT1G77090, LHCA3, LHCA4, LHCB3, LHCB6, PSAO,
PSBW, POR2, NDF2, NDF4, NDF6, EGY1), besides to suppression in expression
levels of genes associated in regulation, cell wall process, and transcription factors.
3.6.1.1 Functional classification and pathway analysis
Most pathways and metabolism process participated by genes differentially changed
after infection are listed in Appendices 1 and 2.
Genes involved in signaling
In signaling pathways, 5.4% of DEGs (37 out of 682) were differentially expressed
(Fig. 3.22). Noteworthy to mention that all 20 genes involved in calcium signaling were
upregulated after pathogen infection, some genes with high expression level such as
calmodulin-binding protein (EDA39) and Ca2+-mediated signal transduction. In
addition, several genes involved in MAP kinases signaling, such as mitogen-activated
protein kinase 3 (MPK3) were activated.
Genes involved in hormone responses
In response to hormone stimulus, 7.9% of DEGs (54 out of 682) were observed (Fig.
3.22). From those 15 genes associated in ethylene signaling pathway, for example, Pti5
and ethylene response factor ERF4 showed high abundance. Besides to 3 genes such as
divinyl ether synthase (LeDES), allene oxide synthase (aos), and lipoxygenase (loxD),
which are involved in jasmonate synthesis, are activated. Other genes, which are
associated with pathogenesis-related proteins, such as EIX receptor 1 (EIX1) were also

Results
70
changed after infection. In addition, we found auxin signaling related proteins, of which
auxin-regulated dual specificity cytosolic kinase (LOC543684) was activated.
Defense and stress responsive genes
As stress responses 132 out of 682 genes were classified, which account to 19.4% of
total DEGs. From those, 26 genes were engaged in oxidative stress most of them
strongly upregulated including peroxidases (cevi16), NADPH-quinone oxidoreductase
(NQR), and alpha-DOX1 (LOC543895). In addition, 8.4% of DEGs (57 out of 682),
which implicated in defense responses, were changed after infection. From those are
chitinase (LOC544149), TSI-1 protein (TSI-1), PR-proteins. The current study showed
a large number of proteases during this early stage with high induction in expression
level of different genes involved in defense, such as subtilisin-like protease (Sbt4a),
which showed the highest level of upregulation, and also the Phytophthora-inhibited-
protease 1 (PIP1). The analysis showed presence of wide range of genes involved in the
ubiquitin-mediated protein degradation and modification pathways, such as ubiquitin-
protein ligases (Tab. S2).
Genes involved in metabolism
In formation of secondary metabolites 10.8% of DEGs (45 out of 682) are involved
(Fig. 3.23), 36 were upregulated and 9 were down regulated. Analyses showed
upregulation of many genes involved in phenylpropanoid pathway, for instance, 4-
Coumarate: CoA ligase 1 (4CL1) and in chorismate synthesis, such as shikimate kinase
precursor (LOC544078). The induction in many genes involved in amino acid synthesis
and carbohydrates, such as acid invertase (Wiv-1) and sucrose synthase (sus3), was
observed as well (Fig. 3.23 and Fig. 3.24).
Genes involved in cell wall
Most genes (29 out of 33) involved in cell wall modification and degradation process
such as expansin (LeXEP2), and xyloglucan endotransglycosylase hydrolase (XTH6),
were suppressed after infection, while, polygalacturonase inhibiting protein1 (PGIP1)
(Fig. 3.22).
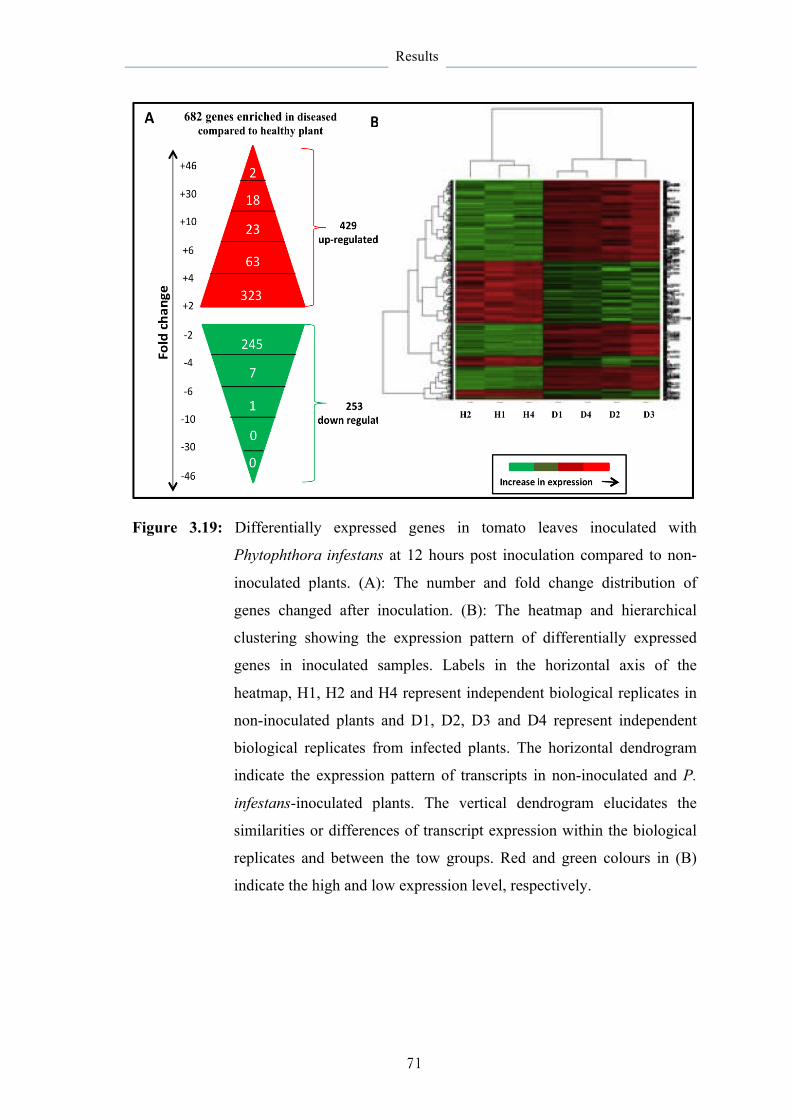
Results
71
Figure 3.19: Differentially expressed genes in tomato leaves inoculated with
Phytophthora infestans at 12 hours post inoculation compared to non-
inoculated plants. (A): The number and fold change distribution of
genes changed after inoculation. (B): The heatmap and hierarchical
clustering showing the expression pattern of differentially expressed
genes in inoculated samples. Labels in the horizontal axis of the
heatmap, H1, H2 and H4 represent independent biological replicates in
non-inoculated plants and D1, D2, D3 and D4 represent independent
biological replicates from infected plants. The horizontal dendrogram
indicate the expression pattern of transcripts in non-inoculated and P.
infestans-inoculated plants. The vertical dendrogram elucidates the
similarities or differences of transcript expression within the biological
replicates and between the tow groups. Red and green colours in (B)
indicate the high and low expression level, respectively.
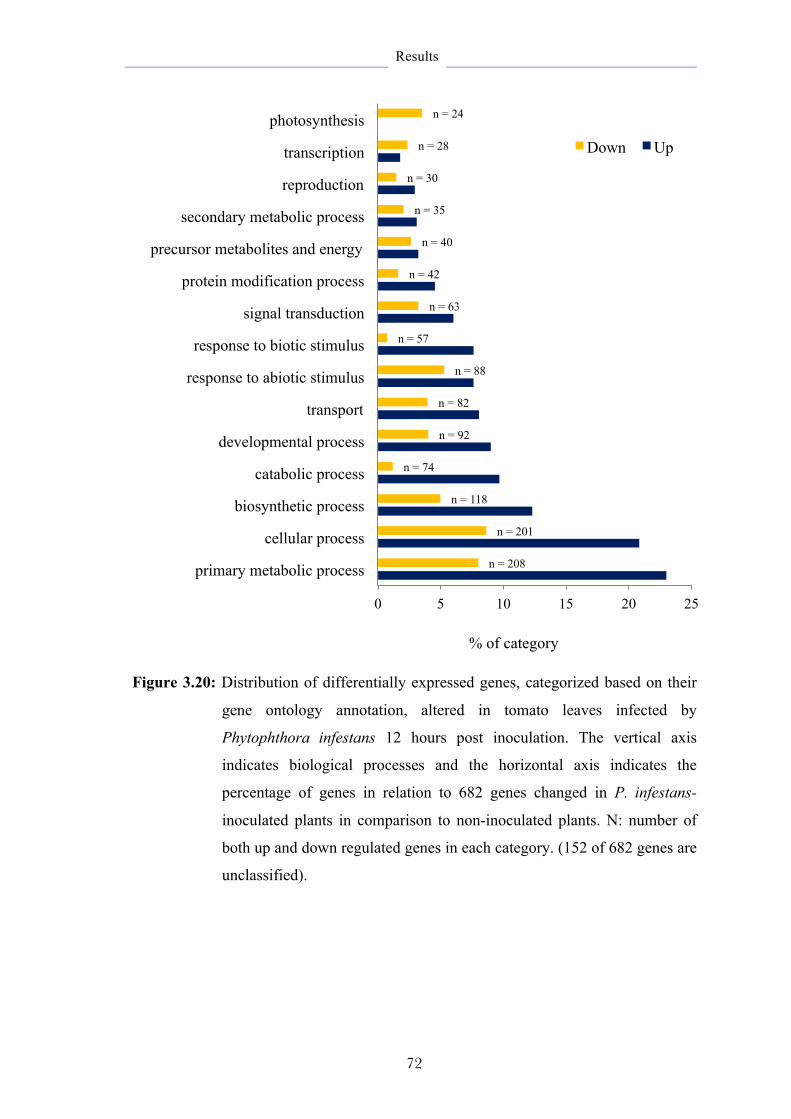
Results
72
Figure 3.20: Distribution of differentially expressed genes, categorized based on their
gene ontology annotation, altered in tomato leaves infected by
Phytophthora infestans 12 hours post inoculation. The vertical axis
indicates biological processes and the horizontal axis indicates the
percentage of genes in relation to 682 genes changed in P. infestans-
inoculated plants in comparison to non-inoculated plants. N: number of
both up and down regulated genes in each category. (152 of 682 genes are
unclassified).
n = 208
n = 201
n = 118
n = 74
n = 92
n = 82
n = 88
n = 57
n = 63
n = 42
n = 40
n = 35
n = 30
n = 28
n = 24
0 5 10 15 20 25
primary metabolic process
cellular process
biosynthetic process
catabolic process
developmental process
transport
response to abiotic stimulus
response to biotic stimulus
signal transduction
protein modification process
precursor metabolites and energy
secondary metabolic process
reproduction
transcription
photosynthesis
% of category
Down Up

Results
73
Figure 3.21: Distribution of differentially expressed genes, categorized based on their
gene ontology annotation, altered in tomato leaves infected by
Phytophthora infestans 12 hours post inoculation. The vertical axis
indicates molecular functions and the horizontal axis indicate the
percentage of genes in relation to 682 genes changed in P. infestans-
inoculated plants in comparison to the non-inoculated ones. N: number of
both up and down regulated genes in each category. (152 of 682 genes are
unclassified).
n = 114
n = 85
n = 40
n = 38
n = 19
n = 12
n = 7
n = 14
n = 8
n = 3
n = 7
n = 116
n = 80
n = 11
n = 26
n = 13
n = 8
n = 5
n = 3
0 2 4 6 8 10 12 14 16
transferase activity hydrolase activity
kinase activity transporter activity
receptor activity transcription factor activity
enzyme regulator activity transcription regulator activity
signal transducer activity nuclease activity
structural molecule activity
protein binding nucleotide binding
lipid binding DNA binding
carbohydrate binding RNA binding
nucleic acid binding receptor binding
% of category
Down Up
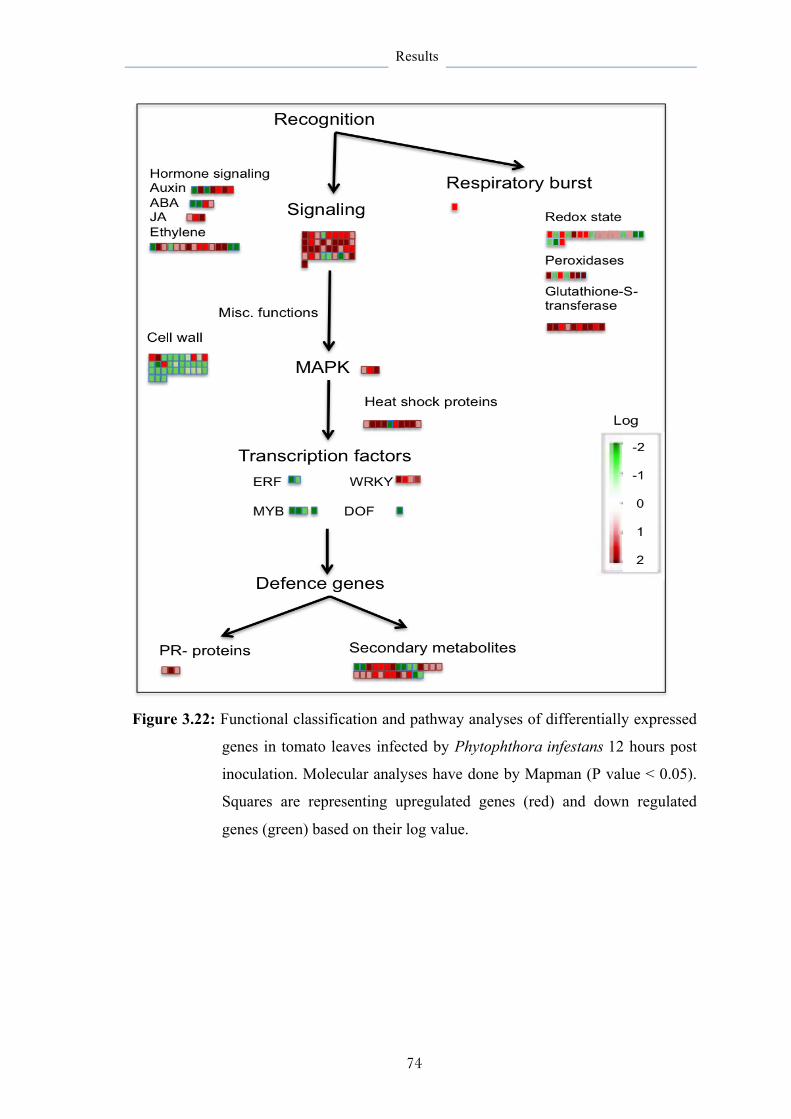
Results
74
Figure 3.22: Functional classification and pathway analyses of differentially expressed
genes in tomato leaves infected by Phytophthora infestans 12 hours post
inoculation. Molecular analyses have done by Mapman (P value < 0.05).
Squares are representing upregulated genes (red) and down regulated
genes (green) based on their log value.
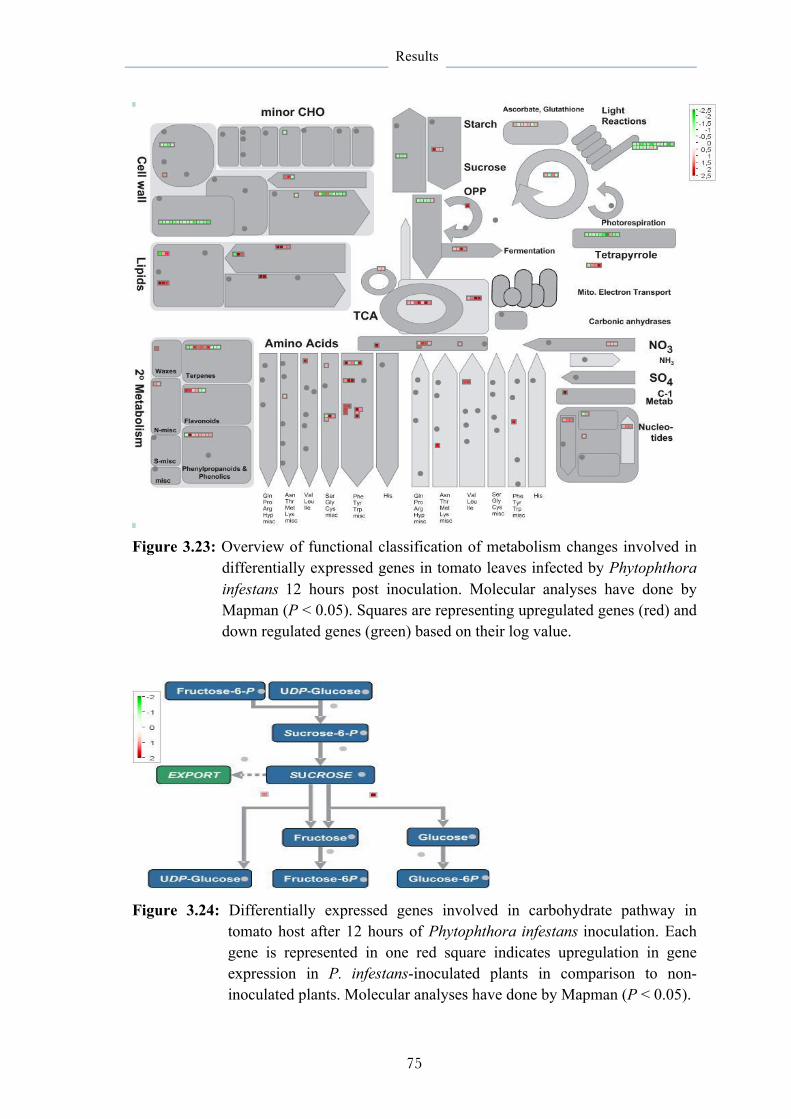
Results
75
Figure 3.23: Overview of functional classification of metabolism changes involved in
differentially expressed genes in tomato leaves infected by Phytophthora infestans 12 hours post inoculation. Molecular analyses have done by Mapman (P < 0.05). Squares are representing upregulated genes (red) and down regulated genes (green) based on their log value.
Figure 3.24: Differentially expressed genes involved in carbohydrate pathway in
tomato host after 12 hours of Phytophthora infestans inoculation. Each gene is represented in one red square indicates upregulation in gene expression in P. infestans-inoculated plants in comparison to non-inoculated plants. Molecular analyses have done by Mapman (P < 0.05).

Results
76
3.6.2 Effects of B. subtilis on host responses
3.6.2.1 Response in non-inoculated plants
Spraying of B. subtilis strain FZB24 cells and metabolites on the lower leaves of non-
inoculated plants resulted in 33 and 8 genes, respectively, differentially expressed in the
upper leaves compared to the upper leaves in non-inoculated untreated plants.
In cell-treated plants, expression levels of 33 genes, exhibited 2.3 to 12.5 fold change
were changed. Five genes were activated, for example, late elongated hypocotyl (LHY)
is the only gene functionally annotated to tomato, which is involved in transcription.
However, 28 genes were down regulated and from those that functionally annotated to
tomato or highly identical to Arabidopsis are alternaria stem canker resistance protein
(Asc), chlorophyll A-B binding-early light-inducible protein (ELIP1), lipoxygenase
(loxD), and UDP-apiose/xylose synthase (AXS2), which are involved in metabolism;
and xyloglycan endo-transglycosylase (tXET-B2), late embryogenesis (Lea)-like
protein (LOC544157), and ethylene-responsive late embryogenesis-like protein (ER5),
which are involved in response to abiotic stimuli. Two other genes namely regulator of
gene silencing (LOC543942) are involved in response to external stimuli as a plant-
pathogen interaction (organism-specific biosystem).
However other 7 genes were differentially expressed after metabolites application,
exhibited approx. 2 fold changes, while not changed after cells application compared to
non-inoculated untreated plants. Three genes were down regulated; one of them is ATP
synthase protein I (AT2G31040), which is involved in metabolic process and transport,
while the other two are weakly or moderately identical to Arabidopsis. Meanwhile, the
analysis revealed 5 DEGs activated after metabolites application and they are RNA
polymerase sigma factor (SIGE), protein late elongated hypocotyl (LHY), and Constans
1 (CO1) are involved in transcription and regulation of transcription; Elongation factor
1-alpha (LOC544055), which is involved in RNA transport pathway; and ligase family
protein (AT3G48990), which is involved in metabolic process.
Interestingly LHY is the only gene, which was activated in both cells and metabolites
treatments when compared to the non-inoculated untreated plants. While all other down
regulated genes after cells application were not changed after metabolites application in
comparison to untreated plants.

Results
77
3.6.2.2 Response in P. infestans-inoculated plants
3.6.2.2.1 Gene expression after cells application
The analysis showed that between 682 DEGs in P. infestans-inoculated untreated plants
compared to non-inoculated untreated plants and 656 DEGs in inoculated cell-treated
plants compared to non-inoculated untreated plants there are 489 common genes
differentially expressed in both, almost more than 86% of genes are changed regardless
cells application (Fig. 3.25A). However, a minor number (24) of DEGs are identified in
comparison done between inoculated cell-treated plants and inoculated untreated plants.
These 24 DEGs exhibited 2 to 5.6 fold change and might indicate the bacterial cell
function. One gene LeEXP2, involved in development and endogenous abiotic stimuli
was activated. However, all other 23 down regulated genes, for example LeCBF1,
LoxD, ER5, THM16, and LOC543942, are mostly involved in stress responses and
transcription (Fig. 3.25B).
3.6.2.2.2 Gene expression after metabolites application
The results revealed 299 common genes differentially expressed between 345 DEGs in
metabolite-treated plants and 682 DEGs in infected untreated plants when compared to
non-inoculated untreated plants (Fig. 3.26). These 299 DEGs are mostly involved in
infection because they changed after infection regardless application of metabolites.
However, further analysis done to find out the exclusive genes after infection between
untreated and treated plants declared that 79 DEGs, which exhibited 2 to 4 fold change,
were identified in metabolite-treated plants in comparison to untreated plants indicating
their potential importance for suppression of infection. 15 DEGs activated after
metabolites application are mostly involved in hormone metabolism, photosynthesis,
and cell wall modification (Tab. 3.7). However, among the other 64 down regulated
genes, 30.4% are genes involved in stress responses, 13.9% in metabolic process,
12.7% in catabolic process, and 7.6% in biosynthetic process. 18% correspond to genes
involved in transcription, 11.4% in signal transduction, 3.8% in secondary metabolic
process were most of them classified as involved in defense and 7.6% are correspond to
development process (cell growth, cell death) (Fig. 3.27). Data in Figure 30B illustrate

Results
78
the molecular functions involved in both up and down regulated genes in metabolite-
treated plants reflecting high number of genes involved in binding and transcription.
Noteworthy to mention that in these 79 genes differentially expressed after metabolites
application (Fig. 3.28), there are 22 genes common with genes differentially expressed
after cells application in inoculated plants compared to inoculated untreated plants and
20 genes commons with genes differentially expressed after cells application in non-
inoculated plants compared to non-inoculated untreated. In addition, analysis resulted in
14 common genes differentially expressed after cells applications between both non-
inoculated plants compared to non-inoculated untreated plants (33 DEGs) and in
inoculated plants compared to inoculated untreated (24 DEGs). From those 14 common
down regulated genes are regulator of gene silencing (LOC543942), Calmodulin-related
protein, putative (AT1G76640), auxin-regulated protein (LOC543701), zinc finger AN1
domain-containing stress-associated protein 12 (PMZ), lipoxygenase (loxD), late
embryogenesis (Lea)-like protein (LOC544157), and ethylene-responsive late
embryogenesis-like protein (ER5). Besides to 6 other common genes, which are
weakly similar to Arabidopsis.
However, still some genes down regulated only after metabolites application are
involved in transcription, protein modification process, transport and amino acid
metabolism from those: arogenate dehydratase 6 (ADT6), E3 ubiquitin-protein ligase
(PUB23), xyloglucan-specific fungal endoglucanase inhibitor protein precursor
(ACI25), ethylene-responsive transcription factor (ERF017), plant U-box 29 (PUB29),
phospholipaseA 2A (PLA2A), Pti5 (LOC544042), xyloglucan endotransglucosylase-
hydrolase XTH3 (XTH3), embryo sac development arrest 39 (EDA39), auxin-regulated
dual specificity cytosolic kinase (LOC543684).

Results
79
Figure 3.25: (A) Venn diagram displaying the number of differentially expressed genes
in cell-treated and untreated plants 12 hours after inoculation with
Phytophthora infestans compared to non-inoculated untreated plants. (B)
Biological process of 23 down regulated genes in P. infestans-inoculated
cell-treated plants compared to P. infestans-inoculated untreated plants 12
hours after Phytophthora infestans inoculation. (3 genes are unclassified)
9
6 5
4
2 1 1 1
0
5
10
15
20
25
30
35
40
% o
f cat
egor
y
(B)

Results
80
Figure 3.26: Venn diagram displaying the number of differentially expressed genes in
metabolite-treated and untreated plants 12 hours after inoculation with
Phytophthora infestans compared to non-inoculated untreated plants.
Figure 3.27: Function classification of differentially expressed genes in metabolite-
treated plants compared to untreated plants 12 hours after Phytophthora
infestans inoculation. (16 genes are unclassified)
25
15
14
10
12
7
9
4
5
6
0 10 20 30 40
Response to stress
Transcription
Metabolic process
Catabolic process
Signal transduction
Development
Biosynthetic process
Transport
Secondary metabolic process
Generation of metabolites &
% of category
Up regulated
Down regulated

Results
81
Figure 3.28: Venn diagram displaying the number of genes differentially expressed
after cells or metabolites applications in both non-inoculated and
Phytophthora infestans-inoculated plants compared to untreated plants.
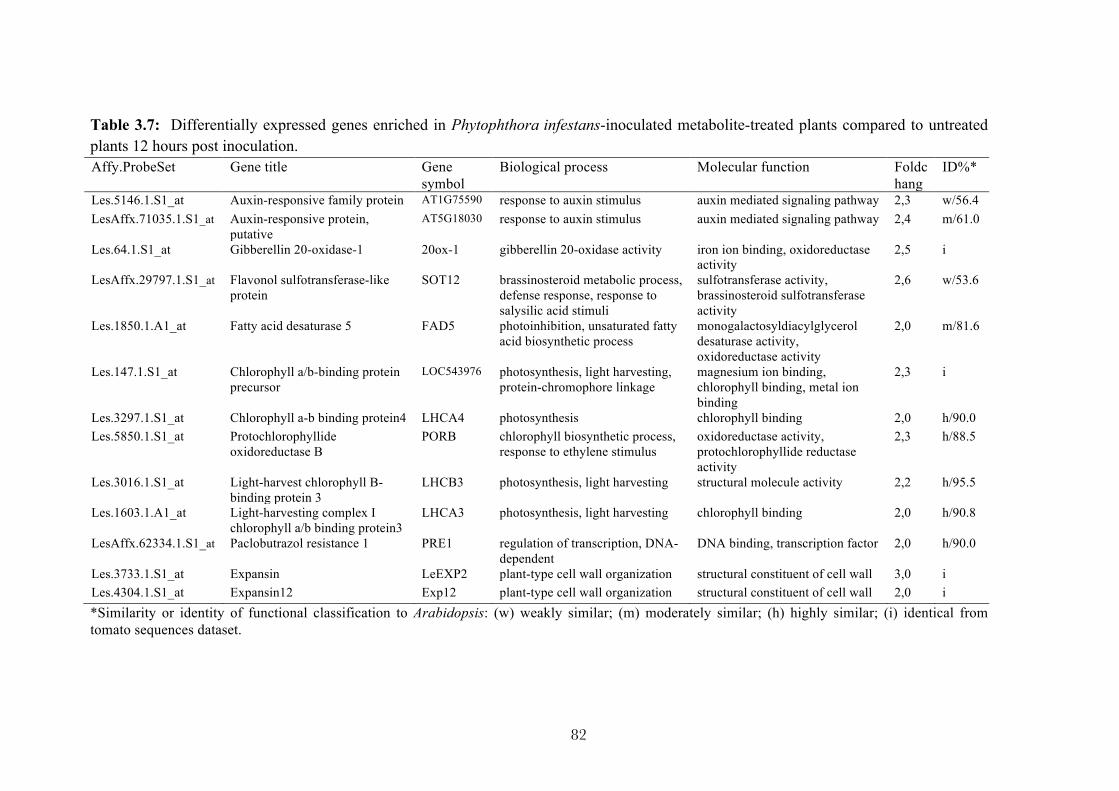
82
Table 3.7: Differentially expressed genes enriched in Phytophthora infestans-inoculated metabolite-treated plants compared to untreated plants 12 hours post inoculation. Affy.ProbeSet Gene title Gene
symbol Biological process Molecular function Foldc
hang ID%*
Les.5146.1.S1_at Auxin-responsive family protein AT1G75590 response to auxin stimulus auxin mediated signaling pathway 2,3 w/56.4 LesAffx.71035.1.S1_at Auxin-responsive protein,
putative AT5G18030 response to auxin stimulus auxin mediated signaling pathway 2,4 m/61.0
Les.64.1.S1_at Gibberellin 20-oxidase-1 20ox-1 gibberellin 20-oxidase activity iron ion binding, oxidoreductase activity
2,5 i
LesAffx.29797.1.S1_at Flavonol sulfotransferase-like protein
SOT12 brassinosteroid metabolic process, defense response, response to salysilic acid stimuli
sulfotransferase activity, brassinosteroid sulfotransferase activity
2,6 w/53.6
Les.1850.1.A1_at Fatty acid desaturase 5 FAD5 photoinhibition, unsaturated fatty acid biosynthetic process
monogalactosyldiacylglycerol desaturase activity, oxidoreductase activity
2,0 m/81.6
Les.147.1.S1_at Chlorophyll a/b-binding protein precursor
LOC543976 photosynthesis, light harvesting, protein-chromophore linkage
magnesium ion binding, chlorophyll binding, metal ion binding
2,3 i
Les.3297.1.S1_at Chlorophyll a-b binding protein4 LHCA4 photosynthesis chlorophyll binding 2,0 h/90.0 Les.5850.1.S1_at Protochlorophyllide
oxidoreductase B PORB chlorophyll biosynthetic process,
response to ethylene stimulus oxidoreductase activity, protochlorophyllide reductase activity
2,3 h/88.5
Les.3016.1.S1_at Light-harvest chlorophyll B-binding protein 3
LHCB3 photosynthesis, light harvesting structural molecule activity 2,2 h/95.5
Les.1603.1.A1_at Light-harvesting complex I chlorophyll a/b binding protein3
LHCA3 photosynthesis, light harvesting chlorophyll binding 2,0 h/90.8
LesAffx.62334.1.S1_at Paclobutrazol resistance 1 PRE1 regulation of transcription, DNA-dependent
DNA binding, transcription factor 2,0 h/90.0
Les.3733.1.S1_at Expansin LeEXP2 plant-type cell wall organization structural constituent of cell wall 3,0 i Les.4304.1.S1_at Expansin12 Exp12 plant-type cell wall organization structural constituent of cell wall 2,0 i *Similarity or identity of functional classification to Arabidopsis: (w) weakly similar; (m) moderately similar; (h) highly similar; (i) identical from tomato sequences dataset.

Results
83
3.6.3 Validation of microarray data using quantitative RT-PCR
A total of 14 genes differentially expressed after infection compared to non-inoculated
plants were selected. Hence, the RT-PCR revealed that all 14 genes followed a similar
trend to microarray results, despite one gene, namely expansin (LeEXP2) showed no
significant difference in RT-PCR analysis when compared to non-inoculated plants
(Tab. 3.8), indicating that both results are fitting to each other.
In other comparisons between metabolite-/cell-treated, either from inoculated or non-
inoculated plants, and the non-inoculated untreated plants, we found that all selected
genes for validation exhibited the same trend like microarray results (Tab. 3.9), but
some genes, namely, LOC543684, XTH3, and ER5 showed no significant difference.
Table 3.8: Validation of 14 differentially expressed genes in infected tomato leaves by Phytophthora infestans 12 hours post inoculation compared to non-inoculated plants using quantitative real-time PCR.
Gene title Gene symbol
Microarray results RT-PCR results
FC P value FC P value
Subtilisin-like protease sbt4a 44.8 0.038 119.5 < 0.001
Alpha-DOX1 LOC543895 26.6 0.021 17 < 0.001
Hexose transporter protein LOC543728 16.7 0.014 18.2 < 0.001
Pti5 LOC544042 16.7 0.013 9.8 < 0.001
Embryo sac development arrest 39
EDA93 9 0.004 6.1 < 0.001
Pathogenesis-related protein P2
PR-P2 7 0.003 7.7 < 0.001
Chitinase LOC544146 6.1 0.002 7.1 < 0.001
Auxin-regulated dual specificity cytosolic kinase
LOC543684 5.5 0.001 2.5 0.015
TSI-1 protein TSI-1 4.5 < 0.001 12 < 0.001
Peroxidase cevi16 4.2 < 0.001 2.8 < 0.001
Lipoxygenase loxD 2.5 < 0.001 1.9 0.048
Expansin EXPA5 -2.3 < 0.001 -1.5 0.037
Hypothetical protein LOC543672 -2.5 < 0.001 -2.5 0.038
Expansin LeEXP2 -3.3 < 0.001 -4 0.057
P value ≤ 0.05 considered as significant, positive and negative values indicate genes changed after infection.

Results
84
Table 3.9: Validation of microarray results between treated inoculated / non-inoculated and non-inoculated untreated plants 12 hours post inoculation with Phytophthora infestans using quantitative real-time PCR Comparisons Gene title Gene
symbol Microarray results
RT-PCR results
FC P value FC P value Inoculated metabolite -treated x non-inoculated untreated
Subtilisin-like protease sbt4a 29.6 < 0.001 139.3 < 0.001 Alpha-DOX1 LOC543895 14.6 < 0.001 16.1 < 0.001 Hexose transporter protein LOC543728 12.8 < 0.001 17.3 < 0.001 Pti5 LOC544042 7.7 < 0.001 5.8 < 0.001 Pathogenesis-related protein P2
PR-P2 6.2 < 0.001 6.6 < 0.002
Chitinase LOC544146 4.3 < 0.001 6.4 < 0.002 TSI-1 protein TSI-1 4.3 < 0.001 13.5 < 0.001 Embryo sac developmen arrest 39
EDA39 4.2 < 0.001 3.5 < 0.001
Peroxidase cevi16 2.6 < 0.001 3.6 < 0.002 Auxin-regulated dual specificity cytosolic kinase
LOC543684 2.2 0.002 1.1 0.674
Xyloglucan endotrans glucosylase-hydrolase
XTH3 -2.2 0.004 -1.1 0.745
Ethylene-responsive late embryogenesis-like protein
ER5 -4 < 0.001 -2.4 0.054
Regulator of gene silencing LOC543942 -6.4 < 0.001 -5.0 < 0.002
Inoculated (cell-treated x non- untreated)
Alpha-DOX1 LOC543895 25.2 < 0.001 14.8 < 0.001 TSI-1 protein TSI-1 2.2 < 0.001 11.0 < 0.001 Pathogenesis-related protein P2
PR-P2 5.9 < 0.001 9.5 < 0.001
Chitinase LOC544146 4.7 < 0.001 6.3 < 0.001 Peroxidase cevi16 4.6 < 0.001 3.3 0.001 Auxin-regulated dual specificity cytosolic kinase
LOC543684 3 < 0.001 1.5 0.324
Ethylene-responsive late embryogenesis-like protein
ER5 -4.2 < 0.001 -0.4 0.028
Xyloglucan endotrans glucosylase-hydrolase
XTH3 -2.3 < 0.001 -0.7 0.454
Non-inoculated (metabolite-treated x untreated)
EF 1-alpha LOC544055 2.2 < 0.005 3.6 < 0.001
Non-inoculated treated (metabolites x cells)
Lipoxygenase loxD 2.8 < 0.001 2.1 0.002
Regulator of gene silencing LOC543942 2.5 < 0.001 2.5 0.003 WRKY33 WRKY33 2.3 < 0.002 2.7 0.004
P value ≤ 0.05 considered as significant, positive and negative values indicate genes changed after infection.
Discussion
85
4 DISCUSSION
Most studies have focused primarily on the degree of disease reduction using Bacillus
subtilis in biological control. Hence, for deeper understanding the mechanisms of
disease suppression, which have not been as investigated extensively, the current study
was carried out using different analyses at microbial, histological, and molecular levels.
The bacteria and their excreted metabolites exhibited biocontrol activity against several
pathogens causing important foliar tomato diseases. Their direct activity and
involvement in enhanced plant defense are attractive properties should be explored
further and in more detail.
Both biological control agents FZB24® and Phytovit® were effective in suppression of
diseases caused by different pathogens demonstrating the broad spectrum of the
biocontrol agents. The presented data was in agreement with results of other workers
who investigated the potential of microorganisms for control of the pathogens (Saikia
and Azad 1999; El-Sheikh et al., 2002; Daayf et al., 2003). In order to take different
modes of action, e.g. curative or protective effects, into account, the antagonists were
applied before or after the pathogens inoculation. Generally, better effects were
obtained when applications were made before inoculation. This observation corresponds
to results found by El-Sheikh et al. (2002), who stated that protective treatments with
antagonistic Bacillus spp. were more effective than curative treatments to control
Phytophthora infestans on potato.
B. subtilis strains FZB24 and Phytovit showed high antagonistic effects on mycelia
growth and spore germination. The effect of both strains on the growth of pathogens
proved to be highest with P. infestans followed by Cladosporium fulvum and Alternaria
solani in descending order. In addition, they showed inhibitory effects against
pathogens development structures at the early stages of infection reducing the pathogen
ability to infect the plant tissues.
Since the highest destructive effect of bacteria revealed against P. infestans growth and
late blight development, further investigations were curried out against this pathogen to
find out the mechanism involved in plant protection. Metabolites produced by B.
subtilis in synthetic growth medium exhibited strong suppression in disease severity of

Discussion
86
late blight more than the bacteria itself. This showed its important role as effective
substances in disease suppression. The metabolites were harvested after 1, 24 and 72
hours of incubation revealing the ability of B. subtilis to start secreting the effective
substances from the first hours of culturing with increase by the time. In addition, the
metabolites showed stability to suppress the disease by heating at 121°C for 20 min.
Such stability in the effectiveness plays important role at the commercial level. In many
cases, metabolites with antimicrobial properties have been reported to play an important
role in the efficacy of microbial antagonists (Filippov and Kuznetsova, 1994; Horvath et
al., 1995). The activity of metabolites secreted by FZB24 strain was more pronounce
than thos produced by Phytovit strain. The results strongly indicate that metabolites
secreted by B. subtilis strain FZB24 are the effective ingredients for controlling P.
infestans.
Therefore, other investigations were carried out using B. subtilis strain FZB24 cells and
metabolites against P. infestans growth and disease development. The applied cells and
metabolites were highly inhibitory to pre-infection stages of P. infestans reducing the
ability of the pathogen to establish itself. That is in consistent with previous results
shown by Marrone (2002) who found that lipopeptides produced by B. subtilis QST 713
stopped spores of plant pathogens from germinating, disrupted germ tube and mycelia
growth and inhibited attachment of the plant pathogen to the leaf surface.
In spite of the strong inhibition of spore germination on glass surface, results showed no
effect on zoospore germination on plant leaf surface, which could related to removing
the unstable zoospores and counting only the germinated encyct. However, both cells
and metabolites have apparent effects on germ tube development and on forming of
appressorium and vesicles. It supposed that host plant stimulated the pathogen to
develop and form appressoria shortly after germination to start adhearing to the plant in
order to infect it as soon as possible and increased frequency of appressorium formation
was supposed to be accompanied by shorter germ tubes (Oyarzún et al., 2004).
Meanwhile, no signal is produced to form appressorium on glass surface, hence, the
pathogen growes slowly and aimless elongating the germ tube to find out its target. B.
subtilis cells and metabolites behaved differentially on different treated-surfaces to
prevent the pathogen growth. Application of B. subtilis cells and metabolites resulted in
reduction of germ tube length on the glass surface as a mechanism to inhibit directly the

Discussion
87
pathogen growth as soon as possible, while, there was an observed increase in its length
on the leaf surface to delay the appressorium formation and, subsequently, delay the
infection. Other workers previously noted that germ tubes were longer on resistant
materials (Lapwood, 1968; Bignell, 1975).
Although no differences were observed in the efficacy between cells and metabolites in
suppression of early development of P. infestans structures, metabolites application
showed less colonization of spongy mesophyll and resulted in more effectiveness in
inhibition of the intercellular growth by the time. That is in agreement with Jeun and
Buchenauer (2001) who showed that in the leaves of tomato plants expressing SAR
most pathogen hyphae remained in the palisade parenchyma layer at 72 h after the
challenge inoculation, whereas mycelium developed in the entire leaves of control
plants at the same incubation time.
Taking in highly consideration, P. infestans following infection engage in an intimate
relation with plant cells and grow intracellularly by forming haustoria, which invaginate
the host membrane, as new host cells are encountered and well establishment of the
biotrophic phase of interaction. Avrova et al. (2008) confirmed that haustoria contain
specific membrane proteins required for pathogenicity and revealed that formation of
biotrophic structures (infection vesicles and haustoria) is essential to successful host
colonization by P. infestans. Haustoria have been implicated as well as a site of effector
production and secretion (Whisson et al., 2007). Hence, haustoria serve dual roles; one
was described as nutrient uptake from the host and in addition the other role in
delivering effectors to the host. Noteworthy, results showed that metabolites inhibited
the haustoria formation. However, it remains unclear whether the protective effect is
due to direct activity or if it also indirectly depends on producing planta metabolites
playing a role in such suppression of pathogen development.
From another point of view, although, the macro- and microscopic observations to
estimate the efficacy of control agents on infection process are providing a fairly
complete phenotypic description of this hemibiotrophic interaction, visual inspection
misses asymptomatic infections. Therefore, monitoring the pathogen colonization in
host tissue provides accurate measurements of the pathogen biomass and that helps in
studying the effects on the disease cycle. That is as well considered in recent studies

Discussion
88
from prior strategies for controlling late blight. Results showed that there was apparent
increase in DNA amount of P. infestans with the concentration, which reveal its
influence on pathogen development and subsequently the importance of inoculum
density in disease epidemic. In current study, pathogen abundance can be reliably
quantified from the very beginning of the infection time course and even in tissues
exhibiting a low degree of infection. Although the first visible symptoms appeared in
plants after the second to the third day of infection, quantification was possible at earlier
times in totally asymptomatic plants (as soon as 3 hours post inoculation).
In the biotrophic phase of infection, the increase of pathogen biomass slowly progressed
and then followed by a great increase in the necrotrophic phase. The results of P.
infestans quantification were compared to assessments of percentage of damaged leaf
area. There were no obvious differences between the two types of assays. The
symptoms progression of the pathogen on a regular basis advanced with more severity
on detached leaves. The DNA content detected in detached leaves was double the
amount in attached leaves. That might be according to some physiological changes in
the single plants or to some stress in the separated detached leaves. The bacterial
suspensions either cells or metabolites were effective in preventing pathogen infection;
they inhibited the pathogen biomass development in the tissue of the tomato leaves and
significantly reduced the expansion of existing late blight lesions.
The accumulation of pathogen DNA was rapid in untreated plants and the pathogen
could invade and colonize the host so fast, which is due to the pathogen’s ability for
quick establishment in plant tissue. Although no differences detected in P. infestans
DNA between treated and untreated plants during the biotrophic phase (from 3 to 48
hpi), from then on, pathogen biomass sharply increased in untreated plants, while,
varied slightly in treated ones. The results showed high reduction in pathogen biomass
by applying B. subtilis cells and metabolites compare to the untreated leaves in favour
of metabolites application. Both cells and metabolites were more effective in inhibition
pathogen growth in attached leaves than on the detached ones. That means there is an
elevation in treatments efficacy to suppress the pathogen development. Such higher
effectiveness in complete plants may be due to active plant defense against pathogen
attack by generating a signal in plant stimulated by treatment applications. It is therefore
Discussion
89
likely that the activity of these antimicrobial substances is mainly based on effects on
the metabolites of the host, similar to induced resistance.
Hence, besides the direct effects of applied bacterial cells and metabolites, it is worth to
investigate their involvement in elevation of host resistance to suppress late blight
disease. As has been shown by Stenzel et al. (1985) who found extracts from B. subtilis
induced resistance in barley and wheat against powdery mildew.
P. infestans sprayed on the lower detached leaf surface (abaxial) resulted in higher
disease severity than when they were sprayed on the upper leaf surface (adaxial). This
might due to the higher number of stomata on the lower leaf surfaces. In addition to the
direct activity of cells and metabolites in reducing the diseases severity when were
applied on the same surface with the pathogen either on the adaxial or the abaxial
surface. Cells and metabolites showed a translaminar activity through leaf tissue layers
when treated leaves were inoculated with pathogens on the leaf surface which was
opposite to the treated surface. When Cells were applied on the lower surface and P.
infestans on the upper side, cells application showed more effectiveness than when they
were applied on the opposite sides causing 40% and 16% reduction, respectively.
However, metabolites were effective providing more than 50% reduction in disease
severity regardless of the application side.
Localized application of cells and metabolites on the lower leaves of tomato plants
resulted in significant reduction of disease severity on the same leaves. However, in
addtion to the translaminar activity of metabolites they showed apical translocated
activity resulted in systemic protection on the upper leaves when the metabolites were
applied on the lower leaves. Therefore, it has been hypothesized that a signal is
generated and mobilized apically in the plants to enhance disease suppression on the
upper leaves. Taking in consideration, the authors emphasized that even when an
antagonist is not present at site of exposure, an antimicrobial substance could be
synthesized by the biocontrol agent and transported through the plant, inhibiting the
pathogen directly. Therefore, it would preffer to distinguish which resistance from other
mechanisms is involved in the systemic protection. Previous results come in parallel
with this study, for example, studies done by Anfoka and Buchenauer (1997) showed
disease suppression in the upper leaves of tomato plants after pre-inoculation of lower

Discussion
90
leaves with the tobacco necrosis virus (TNV) demonstrating SAR against late blight.
The results are in agreement also with Cohen (1994) after pre-treatment with DL-3-
aminobutyric acid (3-ABA). Since, PR1a gene is requently used as marker for systemic
acquired resistance (SAR) in many plant species (Durrant and Dong, 2004; Qiu et al.,
2007), therefore the expression levels of PR1a gene was followed during P. infestans-
tomato compatible interaction in treated lower and induced upper leaves of both
inoculated and non-inoculated plants.
Hardham and Blackman (2010) found that plant cells are able to recognise the presence
of Phytophthora spores on their surface and to detect the force exerted by oomycetes
hyphae attempting to penetrate the plant epidermis, thus triggering some components of
the basal defense response. Two hours post inoculation a substantial and rapid increase
in PR1a gene expression was observed in response to pathogen recognition in both
treated and untreated leaves. It is considered that this induction is as part of basal
resistance that operates in susceptible plants, since the untreated plants respond to P.
infestans inoculation by the same level of gene induction compared to treated plants.
Such high induction in gene expression 2 hpi was followed by a remarkable decrease in
PR1a in both untreated and treated plants 6 hpi. P. infestans after successful penetration
of the epidermal cells and forming the vesicles produces a wide array of effector
proteins facilitating basal resistance suppression and host plants colonization (Dou et
al., 2008 and Bos et al., 2009). P. infestans has apparently evolved mechanisms to
suppress plant defense and to establish the compatibility by releasing these effectors
into the host cytoplasm, where they target host proteins to suppress basal defense and to
redirect host physiology in support of the pathogen (Espinosa, 2004; Chisholm, 2006).
Subsequently, intercellular hyphae grow into the mesophyll cell layers, producing
haustoria as new host cells are encountered and well establishment of the biotrophic
phase of interaction. Analysis showed high stimulation of the PR1a expression in both
upper and lower inoculated leaves of metabolite-treated plants 12 hpi in comparison to
untreated and cell-treated inoculated plants. Consequently, the high induction of PR1a
gene in metabolite-treated plants 12 hpi stimulates SAR resistance targeting the
biotrophic stages of P. infestans infection and leads to control of infection.
Discussion
91
Moreover, high induction in PR1a expression 48 hpi was found in untreated and treated
plants. That may related to the increased number of further attacked cells under
continuous growth of pathogen and subsequently more responding host cells to the
presence of the pathogen. Current results are consistent with Rose et al. (2005) who
found that upon P. infestans infection 72 hpi, PR1a gene is clearly induced in a
susceptible potato cultivar. In spite of no significant difference in PR1a alterations after
infection between treated and untreated plants, the expression in untreated plants was
higher than in treated samples that might be because of suppression of pathogen in
treated plants and no need more for further alteration since the pathogen is previously
restricted. As has been found by Smart (2003) that the kinetics of the response is
consistent with a concept that the induction of PR genes may be more accurately
described as “pathogen response” genes rather than “defense response” genes. A view
has been developed that PR genes are rather related to the severity of symptom
expression than to resistance (Camacho Henriquez and Sänger, 1982; Naderi and
Berger, 1997). They speculated that the induction of PR genes accompanying the
symptom expression could also have a protective role of “last barrier”.
From the point that PRs can be synthesized by plant during development and being PR
genes induced by a wide array of environmental/external factors, there was an increase
in the expression levels of PR1a in non-inoculated plants by the time. That comes in
agreement with findings of Fraser (1981) who was the first to report the formation of a
set of PRs in leaves of non-inoculated tobacco plants as they reached the flowering and
senescing stage, and by Hanfrey et al. (1996) as well for senescing Brassica napus
leaves. In addition, old lower leaves showed slightly higher expression of PR1a than in
upper new leaves, suggesting their involvement in development regulation, as have
been shown by Xie et al. (2011).
Determination of the necessary time for induction of defense responses after cells and
metabolites application was a point of interest. The analysis resulted in significant
induction in PR1a expression after metabolites treatment following a lag period of 30
and 36 hours of metabolites application in the treated lower leaves and in the induced
upper leaves of non-inoculated plants, respectively. These alterations show an elevation
in plant activation over the metabolites existence compared to untreated plants and a

Discussion
92
continuous capability of applied substances to fast the defense responses in the plant
after infection.
Another interesting aspect was the correlation between pathogen colonization,
developmental structures, and the induction of PR1a gene. In terms of pathogen ability
to infect the plant, it clearly seemed that the pathogen in untreated plants had a better
capacity not only to infect the plant sooner but also to spread quicker during the time
course of infection. While the mycelia continued developing in the entire leaves of
control plants, pathogen hyphae remained in the palisade parenchyma layer since it was
inhibited obviously in spongy mesophyll metabolite-treated leaves. In addition, in leaf
cells of control plants haustoria grew extensively whereas haustoria formation in leaf
cells of metabolite-treated plants was restricted. Thus, the systemic protection in
metabolite-treated leaves associated with PR1a induction was correlated positively with
reduction of haustoria formation and mycelia growth in leaf tissue. The restriction of
pathogen development in plants expressing SAR can therefore be explained in part by
the inability of the pathogen to form functional haustoria. Moreover, no inhibition in
pathogen biomass in the biotrophic phase followed by strong inhibition in necrotrophic
phase reflect differences in treatments mechanisms between biotrophic and necrotrophic
phases suggest either a temporal sequence of systemic colonization by the pathogen in
the biotrophic phase or a differential response of the plant defense mechanisms.
Hence the important of understanding the earliest molecular events involved in
infection susceptibility/resistance to develop strategies for disease control, further
analysis was done to analyse the transcriptional response of tomato plants to P.
infestans using Affymetrix tomato genome array at the stage of inter-/intra-cellular
hyphae growth and haustoria formation. The changes in gene expression that occur
during the compatible interaction between tomato and P. infestans would reflect the
interplay between, on one hand, the attempt of the plant to counteract pathogen invasion
and, on the other hand, the activity of pathogen determinants that facilitate the
establishment of disease. The analysis resulted in 682 of 9254 transcripts on the array
differentially expressed when compared with non-inoculated leaf tissue. The majority of
differentially expressed genes were upregulated. That is in consistent with the results
observed by Moy et al., (2004), who found that the large number of differentially
Discussion
93
expressed genes were upregulated during a compatible interaction with P. sojae at this
time point in soybean.
The recognition of extracellular pathogen-associated molecular patterns (PAMPs) by
transmembrane pattern recognition receptors (PRRs) activates basal defense responses
in host plant upon pathogen infection (Nürnberger et al., 2004; Zipfel and Felix, 2005).
These defense responses have a profound effect on plant cellular activities including
production of reactive oxygen species, activation of mitogen-activated protein kinase
cascades, and induction of pathogenesis-related genes (Asai et al., 2002; Nürnberger et
al., 2004; Zipfel et al., 2004, 2006).
Molecular crosstalk between tomato plants and P. infestans showed a multitude of
signal exchange. Previous studies mentioned involvement of inducing many
transcription factors and hormones in defense signaling by pathogen infection (Chen et
al., 2002; Mysore et al., 2002). In the current analyses, results showed activation in a
set of 20 genes involved in calcium signaling and regulation, which play an essential
physiological role in the plant cell response to abiotic and biotic stresses (Dangl et al.,
1996; Sanders et al., 2002; Hetherington & Brownlee, 2004). Ca2+ elevation increases
the amount of Ca2+ bound to calmodulin (CaM). Ca2+/CaM regulates the synthesis of
downstream signaling components (nitric oxide (NO) and hydrogen peroxide (H2O2))
that are essential for the development of the hypersensitive response (HR), which is a
type of programmed cell death (PCD) in plant scarifying a few cells immediately
surrounding the attacked cell, thereby restricting pathogen growth (Vorwerk et al.,
2007; Yuan and Lin, 2008). The increase in Ca2+ elevation also results in the binding of
Ca2+-dependent protein kinase (CDPK), which can activate H2O2 production through
regulation of NADPH oxidase activity. Subsequently, CaM, CDPK, NO and H2O2 play
pivotal roles in activating the expression of pathogen defense genes.
High induction in expression levels of genes involved in jasmonic acid biosynthesis
such as divinyl ether synthase (leDES) was observed as well, however, its upregulation
is not related to resistance in P. infestans-potato pathosystem (Fauconnier et al., 2008).
Different genes involved in hormone metabolism synthesis or degradation of ethylene
were altered. Some are upregulated such as Pti5 (LOC544042), which involved in
transcriptional activation of pathogenesis-related genes (Gu et al., 2002; Balaji et al.,

Discussion
94
2008). While, other genes from ethylene response factors (ERF), such as ERF4, were
down regulated after infection. The increased activity of various signaling pathways and
defense responses is associated with differential expression of many families of
transcription factors during plant pathogenesis (Eulgem, 2006). For example,
upregulation in all genes involved in WRKY family was observed and comes in
consistent with results of Balaji et al. (2008). In addition, other set of genes involved in
MYB transcription family, which described to play a role in the defense response as
well (Kranz et al., 1998), were all down regulated. This data suggests that interplay of a
broad spectrum of transcription factors possibly regulates multiple signaling cascades
during pathogen infection.
Tomato plants exhibited complex defense responses to pathogen infection and results
showed alteration in 57 genes such as peroxidases involved in generating the reactive
oxygen species (ROS), which are important metabolic events in the execution of HR
(Scharte et al., 2005; Essmann et al., 2008). In addition, genes encoding pathogen-
inducible antimicrobial enzymes, such as proteases degrading microbial cell walls, were
upregulated. From those, PR P69B subtilisin-like Ser protease (Sbt4a), which scored the
highest level of upregulation within current dataset, was confirmed recently by
Vartapetian et al. (2011) its involvement in regulation of PCD. Sbt4a was inhibited by
EPI1 and EPI0 the inhibitory molecules produced by Phytophthora, suggesting a novel
type of defense counterdefense mechanism between plants and Phytophthora (Tian et
al., 2004; 2005). In addition, Phytophthora-inhibited-protease 1 (PIP1) gene, which is a
PR protein induced during infection by P. infestans, was upregulated. Previous study
done by Tian et al. (2007) showed that PIP1 gene was inhibited by P. infestans
cystatin-like protease inhibitor (Epic2B) secreted during infection. That suggests the
interplay between host proteases of diverse catalytic families and pathogen inhibitors
during interactions as a general defense-counterdefense process of strategies for
survival (Stahl and Bishop, 2000).
Upregulation in expression levels of several genes related to PCD after P. infestans
infection is matching with the results obtained by Avrova et al. (2004) in P. infestans-
potato pathosystem. Since previous studies done by Freytag et al. (1994) and
Vleeshouwers et al. (2000) indicated that some epidermal cells undergo a HR in the
first 24 hours of compatible interaction of P. infestans with potato cells, hence, the rapid
Discussion
95
hypersensitive response at the initial infection site is considered to be the key features
of active defense. The timing of HR induction and the number of HR responding cells is
suggested to have a correlation between resistance level of potato cultivar and HR
effectiveness. These findings are in corresponding with work done by Stierl et al.
(1999) and Smart et al. (2003). Subsequently, two factors the timing and frequency of
localized accumulation of all features of HR play an essential role in preventions of P.
infestans growth and the interaction coming.
Under the line of pathogen attack, interfering with plant metabolism is another
anticipated activity of oomycete pathogens during the biotrophic interactions. One can
envision that effectors not only act on plant defense pathways, but also interfere with
host metabolic pathways or transporters, redirecting nutrients and changing host
metabolism. Upregulation in several genes involved in amino acid biosynthesis at this
early stage of infection was observed, such as aspartate aminotransferase, cysteine
synthase, and arginine decarboxylase. Grenville-Briggs et al. (2005) found activation in
amino acid biosynthesis genes in P. infestans-potato pathosystem and clear increases in
free amino acid levels in the apoplast and in contrast he found down regulation in genes
involved in amino acid biosynthesis in P. infestans, speculating that the pathogen may
also obtain these amino acids from the host. That might therefore be exploited as
potential fungus or oomycete chemical control targets.
Interestingly, the current tomato-P. infestans pathosystem was carried in dark under
high relative humidity. Hence, several factors play important role in the hypersensitive
response. Montillet et al. (2005) found that the HR can be initiated under dark
conditions but light-generated ROS are required for full lesion development in several
pathosystems (Rustérucci et al., 2001; Mateo et al., 2004; Montillet et al., 2005). In
addition, the stomatal closure, which is a common response to stress that causes a drop
in gas exchange, enhanced photorespiration (Fryer et al., 2003; Mateo et al., 2004). The
environmental factor such as high humidity is available under current pathosystem. The
stall stomatal closures have been shown to slow the HR and inhibit resistance
(Jambunathan et al., 2001; Yoshioka et al., 2001). This suggested that photorespiration
and restriction of HR cell death are functionally linked (Mateo et al., 2004). The current
results highlights down regulation of several genes associated with photosynthesis,
which was found to be down regulated as well in the compatible interaction between
Discussion
96
soybean and P. sojae (Moy et al., 2004). Requirements of pathogen infection to
decrease expression of those genes are proposed as a plant strategy to switch off
photosynthesis and other assimilatory metabolisms in favour of respiration process. A
decrease in the photosynthetic rate may protect the photosynthetic apparatus against
oxidative damage or may be a consequence of oxidative damage (Niyogi 2000;
Blokhina et al., 2003).
The reduction in photosynthetic metabolism in conjunction with increased cellular
demands initiates the transition from source status to sink status in infected tissue. This
transition is accompanied by an increase in expression of extracellular cell wall
invertase gene (Wiv-1), which cleaves sucrose into glucose and fructose. That comes in
consistent with Roitsch et al. (2003) and increase its activity after infection in
susceptible interactions was shown in other studies (Fotopoulos et al., 2003;
Greenshields et al., 2004; Essmann et al., 2008). In addition, there was increase in
expression of hexose transporters genes, which transport these hexoses into the cell to
fulfill the energy and carbon requirements for the resistance response as have been
shown previously by Truernit et al., (1996). Since, pathogens also possess extracellular
sucrolytic enzymes and preferentially utilize hexose rather than sucrose (Voegele et al.,
2001). Therefore, it is not always clear in susceptible interactions whether invertase
activity is of pathogen origin as have been shown by Jobic et al. (2007) or an aspect of
plant defense against the invading pathogen. Especially that the carbohydrate increase is
believed to be a metabolic signal that induces the expression of defense-related genes
and repression of photosynthesis (Ehness et al., 1997; Sinha et al., 2002; Roitsch et al.,
2003; Berger et al. 2004; Kocal et al., 2008).
However, in response to infection, the strong demand to obtain carbon will likely
shuttle amino acids into energy-generating pathways such as the tricarboxylic acid
(TCA) cycle. Study resulted in stimulation in the respiration pathways, which were
stimulated during the resistance response in early study current by Smedegaard-Petersen
and Stolen (1981), the mitochondrial TCA cycle and mitochondrial electron transport
(Fernie et al., 2004). However, the glycolysis pathway was down regulated, which was
metioned by Bolton et al. (2008) that flux through it is an important aspect of the
resistance response.

Discussion
97
If primary metabolism is reconfigured to support the increased demands of the
resistance response, an intriguing question is what responses are the major consumers of
primary metabolism output. Phenylpropanoid pathway products, which most genes
involved in were upregulated, represent a major flow of carbon from primary
metabolism into secondary metabolism (Bolton et al., 2008). The shikimic acid
pathway, often upregulated in response to pathogen infection, is driven by
phosphoenolpyruvate (PEP) from glycolysis and provides chorismate as an end product
and various intermediates involved in plant defense (Weaver and Herrmann 1997).
Noteworthy, a set of 33 genes involved in cell wall modification and degradation
process was down regulated. Such reduction shown by Cantu et al. (2008) to reduce
wall disassembly might be a strategy by the plant to reinforce the cell wall and prevent
further infection by the pathogen. However, a paucity of plant cell-wall degrading
enzymes is may be in line with the biotrophic lifestyle; the enzymes are likely used to
soften or weaken the plant cell walls to facilitate the cell to cell passage of hyphae,
rather to facilitate the utilization of cell-wall derived carbohydrates (Spanu and Kämper,
2010).
The induction of the wide array of described defense mechanisms involves a massive
redistribution of energy toward the defense response and associated with multiple
metabolic processes. However, nutrients available for pathogen metabolism during the
current susceptible interaction may be a consequence of host cell leakage during
colonization or pathogen manipulation of the plant to provide nutrients rather than a
reflection of an active host defense response (Bolton, 2009). It is expected that gene
expression changes occurring at the time of inter- and intracellular hyphe growth and
haustoria formation reflect the establishment of susceptibility, especially that the
activation of basal immunity was proved to be insufficient to limit pathogen growth
because the pathogen caused more than 80% disease severity 6 days after inoculation.
However, application of B. subtilis strain FZB24 cells and metabolites showed high
inhibitory effects on the early stages of P. infestans development with obvious
differences between cells and metabolites efficacies on intracellular and intercellular
progress of pathogen growth in leaf tissue. That consequently resulted in difference in
reduction rate of disease severity by 44% and 70% for cells and metabolites,
Discussion
98
respectively. In additioin, the analysis showed systemic protection in disease severity on
the upper leaves when the lower leaves were treated with metabolites, while no
significant suppression was observed when cells were applied. Further determination of
the changes in gene expression taking place in tomato plants, in absence and presence
of P. infestans by genome array analysis after cells and metabolites applications at the
time of pathogen establishment at 12 hpi was of great significance in understanding
their suppressive effect.
Analysis resulted in a close number of genes differentially changed after inoculation in
both untreated and cell-treated plants compared to non-inoculated untreated ones, 682
and 656 DEGs, respectively. However, after metabolites application the number of
differentially expressed genes was 345 genes, almost 50% less than those altered in
untreated inoculated plants that may reveal the reduction in plant susceptibility towards
invader. Remarkable, the largest number of those genes differentially expressed after
inoculation was altered in the same direction in all three treatments (untreated, cell-
treated, and metabolite-treated) compared to non-inoculated plants. That reflects their
involvement in infection because they changed after infection regardless application of
cells or metabolites.
Interestingly, some other genes exclusively changed after cells and metabolites
applications in inoculated plants compared to untreated inoculated ones, 24 and 79
DEGs, respectively. Most genes changed after cells application, which down regulated,
changed as well after metabolites application. That supports previous results that B.
subtilis could secret metabolites very early but may be in insufficient amount to
suppress the disease systemically. Pronounced functions involved in those down
regulated genes are stress responses and transcription, such as regulator of gene
silencing (LOC543942), zinc finger AN1 domain-containing stress-associated protein
12 (PMZ), and ethylene-responsive late embryogenesis-like protein (ER5). Down
regulation in those functions is an attempt to reduce stress responses in order to survive
the plant and balance conditions to promote plant growth, especially, there is increasing
evidence that plants have a memory of encountered stress situations that allow them to
better adapt to changing conditions.
Discussion
99
In point of systemic protection achieved by metabolites application, the analysis
resulted in some exclusive genes altered only after metabolites application. Results
showed down regulation in protein modification process such as E3 ubiquitin-protein
ligase (PUB23) and plant U-box 29 (PUB29). Plant U-box proteins are implicated in
self-incompatibility (Stone et al., 2003), hormone regulation (Amador et al., 2001), and
abiotic stress (Yan et al., 2003). In addition to down regulation in genes involved in
RNA-regulation of transcription such as Pti5 (LOC544042), which was highly
upregulated in untreated inoculated plants and showed less activation in metabolite-
treated inoculated plants.
In parallel to those down regulated genes after application of metabolites secreted by B.
subtilis, a set of genes involved in hormone metabolism (auxin, gibbrellin) and
photosystem II were upregulated. Previous study showed modulation of some plant
regulatory mechanisms through the production of hormones or other compounds that
influence plant development (Frankenberger and Arshad 1995). Many studies direct
attention to involvement of some hormones such as auxin and gibberellic acid (GA) in
plant defense signaling pathways but their role in plant defense is less well studied.
However, Martínez Noël et al. (2001) supported a putative role of auxins in the potato-
P. infestans pathosystem as natural defense for pathogen spread and disease
development. Gibberellic acid promotes plant growth by regulating the degradation of
growth-repressing DELLA proteins, which control plant immune responses by
modulating SA and JA dependent defense responses (Navarro et al., 2008).
Plant growth and defense are regulated by a network of interconnecting signaling
pathways. The involvement of different plant growth regulators in plant immunity
suggests that the control of plant growth, development and defense is interconnected in
a complex network of cross-communicating hormone signaling pathways. Early work in
tomato (Solanum lycopersicum) and Arabidopsis demonstrated that SA and its
acetylated derivative aspirin are strong antagonists of the JA signaling pathway
(Doherty et al., 1988). Other study showed as well that JA and ET signaling can act
synergistically (Penninckx et al., 1998). However, Koornneef et al. (2008)
demonstrated that timing and sequence of initiation of SA and JA signaling are
important for the outcome of the SA-JA signal interaction. Further interpretation of
such results and suggestions can support the findings out from the current study. From

Discussion
100
one hand, activation in genes involved in jasmonate and ethelyne pathways was
observed in the compatible interaction in untreated plants 12 hours post inoculation, the
expected time for pathogen establishment. However, in metabolite-treated plants, the
analyses resulted in activation of PR1a gene, which is not existence on the tomato
genome array, in induced upper leaves when metabolites were applied on the lower
leaves 12 hpi, besides to activation in other hormone signaling (auxin and gibberellin).
Crosstalk between hormonal signaling pathways provides the plant with such a
powerful regulatory potential and may allow the plant to tailor its defense response to
the invaders encountered (Reymond et al., 1998; Kunkel et al., 2002; Bostock et al.,
2005; Pieterse et al., 2007). The current pathosystem showing regulatory potential of
such a network might reflect the plants ability to quickly adapt to their biotic and as
well as the abiotic environment under metabolite-induced state.
Although, it is still not clear if the enhanced photosynthesis is an reason to the plant’s
attempt to fuel defense responses to limit pathogen growth (Berger et al., 2007), or
fungal manipulation of the plant to co-opt resources for pathogen nutrition. Current
analysis revealed activation in genes involved in photosynthesis in metabolite-induced
plants compared to their down regulation in the compatible interaction tomato-P.
infestans. That comes in agreement with Bolton et al. (2009) who assumed that rates of
photosynthesis could increase to supply the carbon skeletons, energy, and reducing
equivalents required to support the plant defense.
Plant growth and defense are regulated by a network of interconnecting signaling
pathways. The involvement of different regulators in plant immunity suggests that the
control of plant growth, plant development and defense against pathogen is
interconnected in cross-communicating hormone signaling pathways.
The reduction in haustoria formation and the superficial colonization of leaf tissue
layers by P. infestans at the time of pathogen establishment in the biotrophic phase of
the compatible interaction was associated with PR1a gene activation in metabolite-
treated plants. Metabolite application resulted as well in lower susceptibility in plants
towards P. infestans by reducing the plant responses necessary for pathogen
development and induced the resistance by activation in responses involved in hormone
metabolism and photosynthesis function, besides to down regulation in stress responses.

Discussion
101
That revealed the enhancement in the ability of plants treated with metabolites to inhibit
P. infestans development.

Summary
102
5 SUMMARY
Most previous studies of the biological control agents Bacillus subtilis strains FZB24
and Phytovit and their secreted metabolites focused primarily on the degree of disease
reduction. Therefore, further investigations on the mechanisms involved in disease
suppression, such as the elevation in host resistance in addition to their direct effect,
will help to optimize the application strategies to control plant disaeses. B. subtilis cells
and metabolites exhibited inhibitory effects against several pathogens (Alternaria
solani, Oidium neolycopersici, Cladosporium fulvum, and Phytophthora infestans)
causing important foliar tomato diseases. Their direct activity and involvement in
enhanced plant defense are attractive properties explored further and in more detail in
the current study at microbial, histological, and molecular levels.
• Both biocontrol agents FZB24® and Phytovit® were effective in suppression of
diseases caused by A. solani, O. neolycopersici, C. fulvum, and P. infestans;
demonstrating the broad spectrum of the biocontrol agents. The protective
treatments with antagonistic B. subtilis were more effective than curative
treatments to control tomato diseases.
• B. subtilis strains FZB24 and Phytovit showed high antagonistic effects on
mycelia growth and spore germination in addition to the inhibitory effects
against pathogens development structures at the early stages of infection
reducing the pathogen ability to infect the plant tissues.
• B. subtilis start to secret the effective substances from the first hours of
culturing with increase by the time showing stability in the effectiveness to
suppress the disease when the metabolites were heated at 121°C for 20 min
that plays important role at the commercial level and metabolites produced by
B. subtilis later after 72 hours of culturing in synthetic growth medium
exhibited strong suppression in disease severity of late blight more than the
bacteria itself revealing its important role as effective substances in disease
suppression in favor of metabolites produced by FZB24 strain.
• The highest destructive effect of bacteria and secreted metabolites proved to be
against P. infestans growth and late blight development.

Summary
103
• The accumulation of P. infestans DNA, which was determined by quantitative
real-time PCR, was rapid in untreated plants and the pathogen could invade and
colonize the host so fast, which is due to the pathogen’s ability for quick
establishment in plant tissue.
• Application of B. subtilis cells or metabolites showed no inhibition of P.
infestans biomass in the biotrophic phase followed by strong reduction in DNA
content of P. infestans in the necrotrophic phase reflecting involvement of
different mechanisms of disease suppression between biotrophic and
necrotrophic phases.
• Metabolites were more effective in preventing P. infestans biomass
development in leaf tissue of tomato plants than cells application, with higher
effectiveness on attached leaves than on detached ones directing the attention to
an elevation in treatments efficacy in complete plants, which may be due to
active plant defense against P. infestans attack.
• While the mycelium continued developing in the entire leaves of control plants,
P. infestans hyphae remained in the palisade parenchyma layer since it was
inhibited obviously in spongy mesophyll metabolite-treated leaves. In addition,
in leaf cells of control plants haustoria grew extensively whereas haustoria
formation in leaf cells of metabolite-treated plants was restricted that resulted in
less colonization of leaf tissue by the time.
• Localized application of metabolites on the lower leaves of tomato plant resulted
in systemic protection on the upper leaves, providing that a signal is generated
and mobilized apically in the plants to enhance disease suppression on the upper
leaves.
• Systemic protection in metabolite-treated leaves was associated with the
activation in PR1a gene expression, which is a SAR marker, and was correlated
positively with reduction of haustoria formation and mycelia growth in leaf
tissue 12 hours post inoculation. Consequently, metabolites target the biotrophic
stages of P. infestans infection and lead to control of infection.
• The analysis resulted in significant induction in PR1a expression after
metabolites treatment following a lag period of 30 and 36 hours of metabolites
application in the treated lower leaves and in the induced upper leaves of non-
Summary
104
inoculated untreated plants, respectively. These alterations showed an elevation
in plant activation over the metabolites existence compared to untreated plants.
• Analysing the Affymetrix tomato genome array data resulted in changes in the
expression level of a substantial number of 682 genes from over 9200 genes of
the tomato genome after infection when compared to non-inoculated plants.
From these 682 differentially expressed genes, 429 genes were upregulated and
253 genes were reduced after infection.
• Several genes were identified as up-regulated, including genes involved in plant
defense responses (e.g., Pti5, subtilisin-like protease (the most highly induced
gene), Phytophthora-inhibited-protease 1, peroxidase), metabolic pathways
(e.g., transferase family protein), signaling (e.g., calcium-dependent protein
kinase, calmodulin-binding proteins, mevalonate diphosphate decarboxylase),
transcriptional regulators (e.g., WRKY transcription factors), and stress
response (e.g., alpha-DOX1, heat shock protein), among others. Down-regulated
genes were identified with genes involved in photosynthesis and in regulation of
the cell wall modification and degradation process (e.g., expansin and pectate
lyase family protein).
• It is expected that gene expression changes occurring at the time of inter- and
intracellular hyphae growth and haustoria formation reflect the establishment of
susceptibility, especially that the activation of basal immunity was proved to be
insufficient to limit P. infestans growth because the P. infestans caused more
than 80% disease severity 6 days after inoculation.
• More than 70% of genes altered in Bacillus subtilis strain FZB24 cell-treated
infected plants were changed in the same trend and with the same fold change to
those genes changed in untreated infected plants reflecting their involvement in
infection regardless of cells application.
• Metabolites application resulted in reduction by 50% in the number of
differentially expressed genes compared to those altered in untreated infected
plants. This may reveal the reduction in plant susceptibility towards P. infestans.
• Analysis resulted in some other genes changed exclusively after cells and
metabolites applications. The down regulated genes after cells application,
Summary
105
which are involved in stress responses and transcription, were down regulated as
well after metabolites application.
• In point of systemic protection achieved by metabolites application, the analysis
resulted in some exclusive upregulated genes involved in hormone metabolism
(auxin, gibbrellin) and photosystem II.
In conclusion, application of B. subtilis cells and metabolites resulted in a significant
reduction in disease severity of different pathogens. But, bacterial cells applied on the
lower leaves showed on the upper leaves no systemic protection as well as no induction
in PR1a gene expression or other plant defense responses. This demonstrates the
antagonistic effect of bacterial cells and they are not involved in plant resistance.
However, metabolites formed by B. subtilis strongly inhibited the inter- and
intracellular growth of P. infestans especially the formation of haustoria, which are
responsible for infection establishment. Since P. infestans rapidly colonized the entire
leaf tissue horizontally and vertically, metabolites showed no progress of pathogen
development in deeper tissue layers. This can be explained as a superficial horizontal
colonization of P. infestans after metabolite application. Systemic protectin achieved by
metabolites at the time of P. infestans establishment in the biotrophic phase of
interaction was associated with PR1a gene activation. Changes in plant responses after
infection investigated using microarray analysis were reduced by 50% after metabolite
application. Such reduction in the number of differentially expressed genes after
infection in metabolite-treated plants compared to those altered in untreated plants
revealed that plants showed less susceptibility towards P. infestans by inducing higher
resistance. In addition, other changes in plant responses were exclusively upregulated
after metabolite application involved in hormone signaling and photosynthesis function,
besides to suppression in stress responses.
Plants treated with Bacillus subtilis metabolites showed lower susceptibility towards P.
infestans by an induced resistance. This was correlated with changes within the plants
affecting on the ability to form haustoria, which is necessary for development of the
pathogen. That indicates haustoria provide ideal targets for late blight control.

References
6 REFERENCES
Abbott, W. (1925) A method of computing the effectiveness of an insecticide. Journal
of Economic Entomology 18: 265-267.
Agrawala, G. K., Rakwalb, R., Jwac, N-S. & Agrawal, V. P. (2001) Signaling
molecules and blast pathogen attack activates rice OsPR1a and OsPR1b genes-
A model illustrating components participating during defence:stress response.
Plant Physiology Biochem. 39: 1095-1103.
Agrios, G. (1997) Plant diseases caused by fungi. Plant Pathology. San Diego,
California: Academic Press: 245-406.
Agrios, G. (2005). Plant pathology, 5th: New York: Elsevier.
Aimé, S., Cordier, C., Alabouvette, C., & Olivain, C. (2008) Comparative analysis of
PR gene expression in tomato inoculated with virulent Fusarium oxysporum f.
sp. lycopersici and the biocontrol strain F. oxysporum Fo47. Physiological and
Molecular Plant Pathology 73(1-3): 9-15.
Amador, V., Monte, E., Garcı´a-Martı´nez, J. & Prat, S. (2001) Gibberellins Signal
Nuclear Import of PHOR1, a Photoperiod-Responsive Protein with Homology
to Drosophila armadillo. Cell 106(3): 343-354.
Anfoka, G., & Buchenauer, H. (1997) Systemic acquired resistance in tomato against
Phytophthora infestans by pre-inoculation with tobacco necrosis virus.
Physiological and Molecular Plant Pathology 50(2): 85-101.
Asai, T., Tena, G., Plotnikova, J., Willmann, M.R., Chiu, W-L., Gomez-Gomez, Boller,
T., Ausubel, F., & Sheen, J. (2002) MAP kinase signaling cascade in
Arabidopsis innate immunity. Nature 415: 977-983.
References
107
Asaka, O., & Shoda, M. (1996) Biocontrol of Rhizoctonia solani damping-off of tomato
with Bacillus subtilis RB14. Applied and environmental microbiology 62(11):
4081.
Atallah, Z. K., & Stevenson, W.R. (2006) A methodology to detect and quantify five
pathogens causing potato tuber decay using real-time quantitative polymerase
chain reaction. The American Phytopathological Society 96(9): 1037-1045.
Avrova, A. O., Boevink, P.C., Young, V., Grenville Briggs, L.J., Van West, P., Birch,
P.R.J., & Whisson, S.C. (2008) A novel Phytophthora infestans haustorium
specific membrane protein is required for infection of potato. Cellular
microbiology 10(11): 2271-2284.
Avrova, A. O., Stewart, H.E., De Jong, W., Heilbronn, J., Lyon, G.D., & Birch, P.R.
(1999) A Cysteine protease gene is expressed early in resistant potato
interactions with Phytophthora infestans. MPMI 12(12): 1114-1119.
Avrova, A. O., Taleb, N., Rokka, V.M., Heilbronn, J., Campbell, E., Hein, I., Gilroy,
E.M., Cardle, L., Bradshaw, J.E., & Stewart, H.E. (2004) Potato oxysterol
binding protein and cathepsin B are rapidly up-regulated in independent defence
pathways that distinguish R gene-mediated and field resistances to Phytophthora
infestans. molecular Plant Pathology 5(1): 45-56.
Bais, H. P., Fall, R., & Vivanco, J.M. (2004) Biocontrol of Bacillus subtilis against
infection of Arabidopsis roots by Pseudomonas syringae is facilitated by biofilm
formation and surfactin production. Plant physiology 134(1): 307.
Balaji, V., Mayrose, M., Sherf, O., Jacob-Hirsch, J., Eichenlaub, R., Iraki, N., Manulis-
Sasson, S., Rechavi, G., Barash, I., & Sessa, G. (2008) Tomato Transcriptional
Changes in Response to Clavibacter michiganensis subsp. michiganensis Reveal
a Role for Ethylene in Disease Development. Plant physiology 146(4): 1797-
1809.

References
108
Bardin, M., Fargues, J. & Nicot, P. (2008) Compatibility between biopesticides used to
control grey mould, powdery mildew and whitefly on tomato. Biological
Control 46(3): 476-483.
Benjamini, Y. & Hochberg, Y. (1995) Controlling the false discovery rate: a practical
and powerful approach to multiple testing. Journal of the Royal Statistical
Society. Series B (Methodological): 289-300.
Berg, A. (1926) Tomato late blight and its relation to late blight of potato. West
Virginia Agr. Exp. Sta. Bul. 205: 31.
Berger, S., Papadopoulos, M., Schreiber, U., Kaiser, W., & Roitsch, T. (2004) Complex
regulation of gene expression, photosynthesis and sugar levels by pathogen
infection in tomato. Physiologia Plantarum 122(4): 419-428.
Beyer, K., Binder, A., Boller, T., & Collinge, M. (2001) Identification of potato genes
induced during colonization by Phytophthora infestans. Molecular Plant
Pathology 3: 125–134.
Bignell, D. C. (1975). Studies on the prepenetration stage of Phytophthora infestans
(Mont.) de Bary on potato leaves and its relation to general resistance.
University of Western Ontario.
Blokhina, O., Virolainen, E. & Fagerstedt, K. V. (2003) Antioxidants, oxidative damage
and oxygen deprivation stress: a review. Annals of botany 91(2): 179-194.
Bolton, M. D. (2009) Primary metabolism and plant defense-fuel for the fire. Molecular
Plant-Microbe Interactions 22(5): 487-497.
Bolton, M. D., Kolmer, J. A., Xu, W. W. & Garvin, D. F. (2008) Lr34-mediated leaf
rust resistance in wheat: transcript profiling reveals a high energetic demand
supported by transient recruitment of multiple metabolic pathways. Molecular
Plant-Microbe Interactions 21(12): 1515-1527.

References
109
Bonmatin, J. M., Laprevote, O., & Peypoux, F. (2003) Diversity among microbial
cyclic lipopeptides: iturins and surfactins. Activity-structure relationships to
design new bioactive agents. Combinatorial Chemistry 38; High Throughput
Screening 6(6): 541-556.
Bos, J. I. B., Chaparro-Garcia, A., Quesada-Ocampo, L.M., Gardener, B.B.M.S., &
Kamoun, S. (2009) Distinct amino acids of the Phytophthora infestans effector
AVR3a condition activation of R3a hypersensitivity and suppression of cell
death. Molecular Plant-Microbe Interactions 22(3): 269-281.
Bostock, R.M. Signal (2005) crosstalk and induced resistance: straddling the line
between cost and benefit. Annual Review of Phytopathology 43: 545–580.
Bruzzese, E. & Hasan, S. (1983) A whole leaf clearing and staining technique for host
specificity studies of rust fungi. Plant Pathology 32(3): 335-338.
Camacho Henriquez, A., & Sänger, H. L. (1982) Analysis of acid-extraetable tomato
leaf proteins after infection with a viroid, two viruses and a funflus and partial
purification of the "Pathogenesis-Related" protein p14. Archives of Virology 74:
181-196.
Cantu, D., Blanco-Ulate, B., Yang, L., Labavitch, J. M., Bennett, A. B., & Powell, A. L.
T. (2009) Ripening-regulated susceptibility of tomato fruit to Botrytis cinerea
requires NOR but not RIN or ethylene. Plant physiology 150(3): 1434-1449.
Catanzariti, A. M. (2006) Haustorially expressed secreted proteins from flax rust are
highly enriched for avirulence elicitors. The Plant Cell Online 18(1): 243-256.
Chen, W. (2002) Expression profile matrix of Arabidopsis transcription factor genes
suggests their putative functions in response to environmental stresses. The
Plant Cell Online 14(3): 559-574.
References
110
Chisholm, S. T., Coaker, G., Day, B., & Staskawicz, B.J. (2006) Host-microbe
interactions: shaping the evolution of the plant immune response. Cell 124(4):
803-814.
Coffey, M. D. & Wilson, U. E. (1983) An ultrastructural study of the late-blight fungus
Phytophthora infestans and its interaction with the foliage of two potato
cultivars possessing different levels of general (field) resistance. Canadian
Journal of Botany 61(10): 2669-2685.
Cohen, Y. (1994) Local and systemic control of Phytophthora infestans in tomato
plants by DL-3-amino-n-butanoic acids. Phytopathology 84(1): 55-59.
Collinge, M., & Boller, T. (2001) Differential induction of two potato genes, Stprx2 and
StNAC, in response to infection by Phytophthora infestans and to wounding.
Plant Molecular Biology 46: 521-529.
Cook, R. J. & Baker, K. F. (1983) The nature and practice of biological control of plant
pathogens, American Phytopathological Society.
Daayf, F., Adam, L., & Fernando, W.G.D. (2003) Comparative screening of bacteria for
biological control of potato late blight (strain US-8), using in-vitro, detached-
leaves, and whole-plant testing systems. Canadian Journal of Plant Pathology-
Revue Canadienne de Phytopathologie 25: 276-284.
Dangl, J. L., Dietrich, R.A., & Richberg, M.H. (1996) Death don’t have no mercy- cell
death programs in plant-microbe interactions. The Plant Journal 8: 1793-1807.
Deacon, J. W. & Donaldson, S. P. (1993) Molecular recognition in the homing
responses of zoosporic fungi, with special reference to Pythium and
Phytophthora. Mycological Research 97(10): 1153-1171.
References
111
Deahl, K., Inglis, D. & DeMuth, S. (1993) Testing for resistance to metalaxyl in
Phytophthora infestans isolates from northwestern Washington. American
Journal of Potato Research 70(11): 779-795.
Dellagi, A., Heilbronn, J., Avrova, A. O., Montesano, M., Palva, E. T., Stewart, H. E.,
Toth, I. K., Cooke, D. E. L., Lyon, G. D. & Birch, P. R. J. (2000) A potato gene
encoding a WRKY-like transcription factor is induced in interactions with
Erwinia carotovora subsp. atroseptica and Phytophthora infestans and is
coregulated with class I endochitinase expression. Molecular Plant-Microbe
Interactions 13(10): 1092-1101.
Doherty, H.M., Selvendran, R.R. & Bowles, D.J. (1988) The wound response of tomato
plants can be inhibited by aspirin and related hydroxy-benzoic acids.
Physiological and Molecular Plant Pathology 33: 377–384.
Dou, D., Kale, S.D., Wang, X., Chen, Y., Wang, Q., Jiang, R.H.Y., Arredondo, F.D.,
Anderson, R.G., & Thakur, P.B. (2008) Conserved C-terminal motifs required
for avirulence and suppression of cell death by Phytophthora sojae effector
Avr1b. The Plant Cell Online 20(4): 1118.
Durrant, W. E., & Dong, X. (2004) Systemic acquired resistance. Annual Review of
Phytopathology 42: 185-209.
Ehness, R., Ecker, M., Godt, D. E. & Roitsch, T. (1997) Glucose and stress
independently regulate source and sink metabolism and defense mechanisms via
signal transduction pathways involving protein phosphorylation. The Plant Cell
Online 9(10): 1825-1841.
El-Sheikh, M., El-Korany, A. & Shaat, M. (2002) Screening for bacteria antagonistic to
Phytophthora infestans for the organic farming of potato. Alexandria Journal of
Agricultural Research 47: 169-178.

References
112
Emmert, E. A. B., & Handelsman, J. (1999) Biocontrol of plant disease- a (Gram-)
positive perspective. FEMS Microbiology Letters 171: 1-9.
Erwin, D. C. & Ribeiro, O. K. (1996) Phytophthora diseases worldwide, American
Phytopathological Society (APS Press).
Espinosa, A. A., J. R. (2004) Disabling surveillance: bacterial type III secretion system
effectors that suppress innate immunity. Cellular microbiology 6(11): 1027-
1040.
Essmann, J., Schmitz-Thom, I., Schon, H., Sonnewald, S., Weis, E., & Scharte, J.
(2008) RNA interference-mediated repression of cell wall invertase impairs
defense in source leaves of tobacco. Plant physiology 147(3): 1288-1299.
Eulgem, T. (2006) Dissecting the WRKY Web of Plant Defense Regulators. PLoS
Pathogens 2(11): e126.
Expósito-Rodríguez, M., Borges, A.A., Borges-Pérez, A., & Pérez, J.A. (2008)
Selection of internal control genes for quantitative real-time RT-PCR studies
during tomato development process. BMC Plant Biology 8: 131.
Fauconnier, M.-L., Rojas-Beltran, J., Dupuis, B., Delaplace, P., Frettinger, P., Gosset,
V., & du Jardin, P. (2008) Changes in oxylipin synthesis after Phytophthora
infestans infection of potato leaves do not correlate with resistance. Plant
Physiology and Biochemistry 46(8-9): 823-831.
Fei, Z., Joung, J. G., Tang, X., Zheng, Y., Huang, M., Lee, J. M., McQuinn, R., Tieman,
D. M., Alba, R., Klee, H. J., & Giovannoni, J. J. (2011) Tomato Functional
Genomics Database: a comprehensive resource and analysis package for tomato
functional genomics. Nucleic Acids Research 39(Database): D1156-D1163.
References
113
Fernie, A. R., Carrari, F. & Sweetlove, L. J. (2004) Respiratory metabolism: glycolysis,
the TCA cycle and mitochondrial electron transport. Current Opinion in Plant
Biology 7(3): 254-261.
Fiddaman, P. & Rossall, S. (1994) Effect of substrate on the production of antifungal
volatiles from Bacillus subtilis. Journal of applied microbiology 76(4): 395-405.
Filippov, A., & Kuznetsova, M. (1994) Different influence of some biofungicides on
dynamics of potato plant susceptibility to Phytophthora infestans (Mont) de
Bary. Mikologiya I Fitopatologiya (Mycology and Phytopathology) 28: 64-69.
Fotopoulos, V., Gilbert, M. J., Pittman, J. K., Marvier, A. C., Buchanan, A. J., Sauer,
N., Hall, J. L. & Williams, L. E. (2003) The monosaccharide transporter gene,
AtSTP4, and the cell-wall invertase, Atβfruct1, are induced in Arabidopsis
during infection with the fungal biotroph Erysiphe cichoracearum. Plant
physiology 132(2): 821.
Frankenberger, W. T. & Arshad, M. (1995) Phytohormones in soils: microbial
production and function, CRC.
Fraser, R. S. S. (1981) Evidence for the occurrence of the "pathogenesis-related"
proteins in leaves of healthy tobacco plants during flowering. Physiological
Plant Pathology 19(1): 69-76.
Fravel, D. R. (2005) Commercialization and implementation of biocontrol1. Annual
Review of Phytopathology 43(1): 337-359.
Freytag, S., Arabatzis, N., Hahlbrock, K., & Schmelzer, E. (1994) Reversible
cytoplasmic rearrangements precede wall apposition, hypersensitive cell death
and defense-related gene activation in potato: Phytophthora infestans
interactions. Planta 194: 123-135.

References
114
Friedrich, L., Lawton, K., Ruessz, W., Masner, P., Specker, N., Rella, M.G., Meier, B.,
Dincher, S., Staub, T., Uknes, S., Metraux, J.P., Kessmann, H., & Ryals, J.
(1996) A benzothiadiazole derivative induces systemic acquired resistance in
tobacco. The Plant Journal 10(1): 61-70.
Fryer, M. J., Ball, L., Oxborough, K., Karpinski, S., Mullineaux, P. M. & Baker, N. R.
(2003) Control of Ascorbate Peroxidase 2 expression by hydrogen peroxide and
leaf water status during excess light stress reveals a functional organisation of
Arabidopsis leaves. The Plant Journal 33(4): 691-705.
Govers, F. & Latijnhouwers, M. (2004) Late blight. Encyclopedia of Plant and Crop
Science. RM Goodman, ed. Dekker Encyclopedias, New York: 1-5.
Greenshields, D. L., Wang, F., Wei, Y. & Selvaraj, G. (2004) Activity and gene
expression of acid invertases in einkorn wheat (Triticum monococcum) infected
with powdery mildew. Canadian journal of plant pathology 26(4): 506-513.
Grenville-Briggs, L. J., Avrova, A.O., Bruce, C.R., Williams, A., Whisson, S.C., Birch,
P.R.J., & van West, P. (2005) Elevated amino acid biosynthesis in Phytophthora
infestans during appressorium formation and potato infection. Fungal Genetics
and Biology 42(3): 244-256.
Griffith, J. M., Iser, J. R. & Grant, B. R. (1988) Calcium control of differentiation in
Phytophthora palmivora. Archives of microbiology 149(6): 565-571.
Grosch, R., Junge, H., Krebs, B., & Bochow, H. (1999) Use of Bacillus subtilis as a
biocontrol agent. III. Influence of Bacillus subtilis on fungal root diseases and
on yield in soilless culture. Zeitschrift Fur Pflanzenkrankheiten Und
PflanzenschutzJournal of Plant Diseases and Protection 106(6): 568-580.
Gu, Y. Q. (2002) Tomato transcription factors Pti4, Pti5, and Pti6 activate defense
responses when expressed in Arabidopsis. The Plant Cell Online 14(4): 817-
831.

References
115
Hanfrey, C., Fife, M., & Buchanan-Wollaston, V. (1996) Leaf senescence in Brassica
napus: expression of genes encoding pathogenesis-related proteins. Plant
Molecular Biology 30(3): 597-609.
Hardham, A. R., & Blackman, L.M. (2010) Molecular cytology of Phytophthora–plant
interactions. Australasian Plant Pathology 39(1): 29.
Heller, W. E., & Gessler, C. (1986) Induced systemic resistance in tomato plants against
Phytophthora infestans. Journal of phytopathology 116(4): 323-328.
Hetherington, A. M., & Brownlee, C. (2004) The generation of Ca2+ signals in plants.
Annual Review of Plant Biology 55(1): 401-427.
Hill, A. E., Grayson, D. & Deacon, J. (1998) Suppressed germination and early death of
Phytophthora infestans sporangia caused by pectin, inorganic phosphate, ion
chelators and calcium-modulating treatments. European journal of plant
pathology 104(4): 367-376.
Horvath, E. M., Burgel, J.L., & Messner, K. (1995) The production of soluble
antifungal metabolites by the biocontrol fungus Trichoderma harzianum in
connection with the formation of conidiospores. Material und Organismen 29:
1-4.
Hruz, T., Laule, O., Szabo, G., Wessendorp, F., Bleuler, S., Oertle, L., Widmayer, P.,
Gruissem, W., & Zimmermann, P. (2008) Genevestigator V3: A reference
expression database for the meta-analysis of transcriptomes. Advances in
Bioinformatics 2008: 1-5.
Jeun, Y. C., & Buchenauer, H. (2001) Infection structures and localization of the
pathogenesis-related protein AP24 in leaves of tomato plants exhibiting
systemic acquired resistance against Phytophthora infestans after Pre-treatment
with 3-Aminobutyric acid or Tobacco necrosis virus. Journal of phytopathology
149(3-4): 141-153.
References
116
Jobic, C., Boisson, A. M., Gout, E., Rascle, C., Fèvre, M., Cotton, P. & Bligny, R.
(2007) Metabolic processes and carbon nutrient exchanges between host and
pathogen sustain the disease development during sunflower infection by
Sclerotinia sclerotiorum. Planta 226(1): 251-265.
Kamoun, S. (2006) A Catalogue of the Effector Secretome of Plant Pathogenic
Oomycetes. Annual Review of Phytopathology 44: 41-60.
Kilian, M., Steiner, U., B. Krebs, H. J., Schmiedeknecht, G. & Hain, R. (2000) FZB24®
Bacillus subtilis – mode of action of a microbial agent enhancing plant vitality.
Pflanzenschutz-Nachrichten Bayer 1/00, 1: 72-93.
Kloepper, J. W., Ryu, C. M. & Zhang, S. (2004) Induced systemic resistance and
promotion of plant growth by Bacillus spp. Phytopathology 94(11): 1259-1266.
Kunkel, B.N. & Brooks, D.M. (2002) Cross talk between signaling pathways in
pathogen defense. Current Opinion in Plant Biology 5: 325–331
Koornneef, A., Leon-Reyes, A., Ritsema, T., Verhage, A., Den Otter, F.C., Van Loon,
L.C. & Pieterse, M.J.C. (2008) Kinetics of salicylate-mediated suppression of
jasmonate signaling reveal a role for redox modulation. Plant Physiolgy 147:
1358–1368.
Kocal, N., Sonnewald, U. & Sonnewald, S. (2008) Cell wall-bound invertase limits
sucrose export and is involved in symptom development and inhibition of
photosynthesis during compatible interaction between tomato and Xanthomonas
campestris pv vesicatoria. Plant physiology 148(3): 1523-1536.
Koornneef, A., Leon-Reyes, A., Ritsema, T., Verhage, A., Den Otter, F.C., Van Loon,
L.C. & Pieterse, M.J.C. (2008) Kinetics of salicylate-mediated suppression of
jasmonate signaling reveal a role for redox modulation. Plant Physiolgy 147:
1358–1368.
References
117
Koumoutsi, A., Chen, X. H., Henne, A., Liesegang, H., Hitzeroth, G., Franke, P., Vater,
J. & Borriss, R. (2004) Structural and functional characterization of gene
clusters directing nonribosomal synthesis of bioactive cyclic lipopeptides in
Bacillus amyloliquefaciens strain FZB42. Journal of bacteriology 186(4): 1084.
Kranz, H. D., Denekamp, M., Greco, R., Jin, H., Leyva, A., Meissner, R. C., Petroni,
K., Urzainqui, A., Bevan, M., Martin, C., Smeekens, S., Tonelli, C., Paz-Ares, J.
& Weisshaar, B. (1998) Towards functional characterisation of the members of
the R2R3-MYB gene family from Arabidopsis thaliana. The Plant Journal
16(2): 263–276.
Kranz, J. (1974) Comparison of epidemics. Annual Review of Phytopathology 12: 355–
374.
Krebs, B., Ockhardt, A., Hoeding, B., Bendzko, P., Maximov, J. & Etzel, W. (1996)
Cyclic peptides from Bacillus amyloliquefaciens useful antimycotics, antivirals,
fungicides, nematicides etc. DE19641213.
Kunkel, B.N. & Brooks, D.M. (2002) Cross talk between signaling pathways in
pathogen defense. Current Opinion in Plant Biology 5: 325–331.
Lapwood, D. (1968) Observations on the infection of potato leaves by Phytophthora
infestans. Transactions of the British Mycological Society 51(2): 233-240.
Leclere, V., Bechet, M., Adam, A., Guez, J. S., Wathelet, B., Ongena, M., Thonart, P.,
Gancel, F., Chollet-Imbert, M. & Jacques, P. (2005) Mycosubtilin
overproduction by Bacillus subtilis BBG100 enhances the organism's
antagonistic and biocontrol activities. Applied and environmental microbiology
71(8): 4577.
Lin, S. C., Lin, K. G., Lo, C. C. & Lin, Y. M. (1998) Enhanced biosurfactant production
by a Bacillus licheniformis mutant. Enzyme and microbial technology 23(3-4):
267-273.
References
118
Loeffler, W., Kratzer, W., Kremer, S., Kugler, M., Petersen, F., Jung, G., Rapp, C.,
Tschen, J. S. M. (1990) Gegen Pilze wirksame Antibiotika der Bacillus subtilis-
Gruppe. Forum Mikrobiologie 3: 156-163.
Lourenço Júnior, V., Maffia, L., Romeiro, R. & Mizubuti, E. (2006) Biocontrol of
tomato late blight with the combination of epiphytic antagonists and
rhizobacteria. Biological Control 38(3): 331-340.
Maget-Dana, R., Thimon, L., Peypoux, F. & Ptak, M. (1992) Surfactin/iturin A
interactions may explain the synergistic effect of surfactin on the biological
properties of iturin A. Biochimie 74(12): 1047-1051.
Marrone, P. G. (2002) An effective biofungicide with novel modes of action. Pestic.
Outlook 13(5): 193-194.
Martínez Noël, G. M. A., Madrid, E. A., Bottini, R. n. & Lamattina, L. (2001) Indole
acetic acid attenuates disease severity in potato-Phytophthora infestans
interaction and inhibits the pathogen growth in vitro. Plant Physiology and
Biochemistry 39(9): 815-823.
Mateo, A., Mühlenbock, P., Rustérucci, C., Chang, C. C. C., Miszalski, Z., Karpinska,
B., Parker, J. E., Mullineaux, P. M. & Karpinski, S. (2004) LESION
SIMULATING DISEASE 1 is required for acclimation to conditions that
promote excess excitation energy. Plant physiology 136(1): 2818-2830.
Mathur, K. & Shekhawat, K. (1986) Chemical control of early blight in kharif sown
tomato. Indian Journal of Mycology and Plant Pathology 16(2): 235-236.
McDonald, B. A. & Linde, C. (2002) Pathogen population genetics, Evolutionary
potential, and durable resistance. Annual Review of Phytopathology 40(1): 349-
379.

References
119
McKnight, S. E. (1993) Effects of Bacillus subtilis on cotton seedling development,
Nottingham Univ. (United Kingdom).
Messing, J., Crea, R. & Seeburg, P. H. (1981) A system for shotgun DNA sequencing.
Nucleic Acids Research 9(2): 309-321.
Montillet, J. L., Chamnongpol, S., Rustérucci, C., Dat, J., Van De Cotte, B., Agnel, J.
P., Battesti, C., Inzé, D., Van Breusegem, F. & Triantaphylidés, C. (2005) Fatty
acid hydroperoxides and H2O2 in the execution of hypersensitive cell death in
tobacco leaves. Plant physiology 138(3): 1516-1526.
Moy, P., Qutob, D., Chapman, B. P., Atkinson, I. & Gijzen1, M. (2004) Patterns of
gene expression upon infection of soybean plants by Phytophthora sojae. MPMI
17(10): 1051-1062.
Mukherjee, A. K. & Das, K. (2005) Correlation between diverse cyclic lipopeptides
production and regulation of growth and substrate utilization by Bacillus subtilis
strains in a particular habitat. FEMS microbiology ecology 54(3): 479-489.
Murray, M. & Thompson, W. F. (1980) Rapid isolation of high molecular weight plant
DNA. Nucleic Acids Research 8(19): 4321-4326.
Mysore, K. S., Crasta, O. R., Tuori, R. P., Folkerts, O., Swirsky, P. B. & Martin, G. B.
(2002) Comprehensive transcript profiling of Pto- and Prf-mediated host defense
responses to infection by Pseudomonas syringae pv. tomato. The Plant Journal
32:299-315.
Naderi, M. & Berger, P. H. (1997) Pathogenesis-related protein 1a is induced in potato
virus Y-infected plants as well as by coat protein targeted to chloroplasts.
Physiological and Molecular Plant Pathology 51(1): 41-44.
Nair, K. & Ellingboe, A. (1962) A method of controlled inoculations with
conidiospores of Erysiphe graminis var. tritici. Phytopathology 52(4): 714.

References
120
Navarro, L., Bari, R., Achard, P., Liso´n, P., Nemri, A., Harberd, N. P. & Jones, J. D. G.
(2008) DELLAs control plant immune responses by modulating the balance of
jasmonic acid and salicylic acid signaling. Current Biology 18(9): 650-655.
Niederhauser, J. S. (1993) International cooperation in potato research and
development. Annual Review of Phytopathology 31(1): 1-25.
Niyogi, K. K. (2000) Safety valves for photosynthesis. Current Opinion in Plant
Biology 3(6): 455-460.
Nürnberger, T., Brunner, F., Kemmerling, B. & Piater, L. (2004) Innate immunity in
plants and animals- striking similarities and obvious differences. Plant innate
immunity 198: 249–266.
Nybroe, O. & Sørensen, J. (2004) Production of Cyclic Lipopeptides by Fluorescent
Pseudomonads. Pseudomonas. In Pseudomonas, Biosynthesis of
Macromolecules and Molecular Metabolism. Ramos, J.-L. (ed.). New York:
Kluwer Academic/Plenum Publishers, 3: 147-172.
Ongena, M., Jourdan, E., Adam, A., Paquot, M., Brans, A., Joris, B., Arpigny, J.-L. &
Thonart, P. (2007) Surfactin and fengycin lipopeptides of Bacillus subtilis as
elicitors of induced systemic resistance in plants. Environmental microbiology
9(4): 1084-1090.
Ongena, M. & Jacques, P. (2008) Bacillus lipopeptides: versatile weapons for plant
disease biocontrol. Trends in microbiology 16(3): 115-125.
Oyarzún, P. J., Yanez, J. & Forbes, G. (2004) Evidence for host mediation of
preinfection stages of Phytophthora infestans on the leaf surface of Solanum
phureja. Journal of phytopathology 152(11-12): 651-657.
Panthee, D. R. & Chen, F. (2010) Genomics of fungal disease resistance in tomato.
Current genomics 11(1): 30.

References
121
Penninckx, I.A.M.A., Thomma, B.P.H.J., Buchala, A., Métraux, J.-P. & Broekaert,
W.F. (1998) Concomitant activation of jasmonate and ethylene response
pathways is required for induction of a plant defensin gene in Arabidopsis. Plant
Cell 10: 2103–2113.
Pieterse, C.M.J. & Dicke, M. (2007) Plant interactions with microbes and insects: from
molecular mechanisms to ecology. Trends Plant Sci. 12: 564–569.
Qiu, D., Xiao, J., Ding, X., Xiong, M., Cai, M., Cao, Y., Li, X., Xu, C. & Wang, S.
(2007) OsWRKY13 mediates rice disease resistance by regulating defense-
related genes in salicylate- and jasmonate-dependent signaling. MPMI 20(5):
492-499.
Raaijmakers, J. M., de Bruijn, I. & de Kock, M. J. D. (2006) Cyclic lipopeptide
production by plant-associated Pseudomonas spp.: diversity, activity,
biosynthesis, and regulation. Molecular Plant-Microbe Interactions 19(7): 699-
710.
Restrepo, S., Myers, K.L., del Pozo, O., Martin, G.B., Hart, A.L., Buell, C.R., Fry,
W.E., & Smart, C.E. (2005) Gene profiling of a compatible interaction between
Phytophthora infestans and Solanum tuberosum suggests a role for carbonic
anhydrase. MPMI 18(9): 913-922.
Reymond, P. & Farmer, E.E. (1998) Jasmonate and salicylate as global signals for
defense gene expression. Current Opinion in Plant Biology 1: 404–411.
Ribeiro, O. K. (1983) Physiology of asexual sporulation and spore germination in
Phytophthora. Microbial antagonism to Phytophthora: 55-70.
Roitsch, T., Balibrea, M., Hofmann, M., Proels, R. & Sinha, A. (2003) Extracellular
invertase: key metabolic enzyme and PR protein. Journal of Experimental
Botany 54(382): 513-524.

References
122
Romero, D., de Vicente, A., Rakotoaly, R. H., Dufour, S. E., Veening, J. W., Arrebola,
E., Cazorla, F. M., Kuipers, O. P., Paquot, M. & Pérez-García, A. (2007) The
iturin and fengycin families of lipopeptides are key factors in antagonism of
Bacillus subtilis toward Podosphaera fusca. Molecular Plant-Microbe
Interactions 20(4): 430-440.
Rose, B., Thümmler, F. & Wenzel, G. (2005) Comparative analysis of Phytophthora
infestans induced gene expression in potato cultivars with different levels of
resistance. Plant Biology 7(6): 686-693.
Rustérucci, C., Aviv, D. H., Holt III, B. F., Dangl, J. L. & Parker, J. E. (2001) The
disease resistance signaling components EDS1 and PAD4 are essential
regulators of the cell death pathway controlled by LSD1 in Arabidopsis. The
Plant Cell Online 13(10): 2211-2224.
Ryals, J., Uknes, S. & Ward, E. (1994) Systemic Acquired Resistance. Plant physiology
104: 1109-1112.
Saikia, R., & Azad, P. (1999) In vivo effect of some Trichoderma spp. and Dithane M-
45 against late blight of potato. Neo Botanica 7(2): 89–91 7(2): 89-91.
Sanchez, V., E., B. & Shattock, R. (1998) Selection of antagonists for biological control
of Phytophthora infestans in tomato. Manejo Integrado de Plagas 48: 25-34.
Sanders, D., Pellouxa, J., Brownleeb, C. & Harper, J. F. (2002) Calcium at the
crossroads of signaling. The Plant Cell 14(suppl 1): 401-417.
Scharte, J., SCHÖN, H. & Weis, E. (2005) Photosynthesis and carbohydrate
metabolism in tobacco leaves during an incompatible interaction with
Phytophthora nicotianae. Plant, Cell & Environment 28(11): 1421-1435.
Schlegel, H. G. (1976) Allgemeine Histologie. Georg Thieme Verlag, Stuttgart, 4.
Auflage.
References
123
Scholes, J. D., Lee, P. J., Horton, P. & Lewis, D. H. (1994) Invertase-understanding
changes in the photosynthetic and carbohydrate metabolism of barley leaves
infected with powdery mildew. New Phytologist 126: 213-222.
Sinha, A. K., Hofmann, M. G., Römer, U., Köckenberger, W., Elling, L. & Roitsch, T.
(2002) Metabolizable and non-metabolizable sugars activate different signal
transduction pathways in tomato. Plant physiology 128(4): 1480-1489.
Smart, C. D., Mayton, H., Mizubuti, E. S. G., Willmann, M. R. & Fry, W. E. (2000)
Environmental and genetic factors influencing self-fertility in Phytophthora
infestans. Phytopathology 90(9): 987-994.
Smart, C. D., Myers, K. L., Restrepo, S., Martin, G. B. & Fry, W. E. (2003) Partial
resistance of tomato to Phytophthora infestans is not dependent upon ethylene,
jasmonic acid, or salicylic acid signaling pathways. Molecular Plant-Microbe
Interactions 16(2): 141-148.
Smedegaard-Petersen, V., & Stolen, O. (1981) Effect of energy requiring defense
reactions on yield and grain quality in powdery mildew Erysiphe graminis sp.
hordei resistant Hordeum vulgare cultivar Sultan. Phytopathology 71: 396-399.
Smith, P. M., Last, F., Kempton, R. & Gisborne, J. (1969) Tomato leaf mould: its
assessment and effects on yield. Annals of Applied Biology 63(1): 19-26.
Smyth, G. K. (2005) Limma: linear models for microarray data. In: Bioinformatics and
Computational Biology Solutions using R and Bioconductor, R. Gentleman, V.
Carey, S. Dudoit, R. Irizarry, W. Huber (eds.), Springer, New York. 397–420.
Somssich, I. E. & Hahlbrock, K. (1998) Pathogen defence in plants--a paradigm of
biological complexity. Trends in Plant Science 3(3): 86-90.
Spanu, P. & Kamper, J. (2010) Genomics of biotrophy in fungi and oomycetes —
emerging patterns. Plant Biology 13: 409–414.
References
124
Stahl, E. A. & Bishop, J. G. (2000) Plant-pathogen arms races at the molecular level.
Current Opinion in Plant Biology 3(4): 299-304.
Stein, T. (2005) Bacillus subtilis antibiotics: structures, syntheses and specific
functions. Molecular microbiology 56(4): 845-857.
Stenzel, K., Steiner, U. & Schonbeck, F. (1985) Effect of induced resistance on the
efficiency of powdery mildew haustoria in wheat and barley. Physiologial Plant
Pathology 27(3): 357-367.
Stewart Jr, C. N. & Via, L. E. (1993) A rapid CTAB DNA isolation technique useful for
RAPD fingerprinting and other PCR applications. Biotechniques 14(5): 748-
750.
Sticher, L., Mauch-Mani, B. & Me ́traux, J. (1997) Systemic acquired resistance. Annu.
Rev. Phytopathol. 35: 235-270.
Stierl, R. (1999) Vergleichende Untersuchungen zur Wirkungsweise Induzierter
Resistenz. Ph.D. Thesis. Rheinischen Friedrich-Wilhelms-Universität zu Bonn,
Germany
Stone, S. L., Anderson, E. M., Mullen, R. T. & Goring, D. R. (2003) ARC1 is an E3
ubiquitin ligase and promotes the ubiquitination of proteins during the rejection
of self-incompatible Brassica pollen. The Plant Cell Online 15(4): 885-898.
Stromberg, A. & Brishammar, S. (1991) Induction of systemic resistance in potato
(Solanum tuberosum L.) plants to late blight by local treatment with
Phytophthora infestans (Mont.) de Bary, Phytophthora cryptogea Pethyb. &
Laff. or dipotassium phosphate. Potato Research 34: 219-225.
Thimm, O., sing, O. B., Gibon, Y., Nagel, A., Meyer, S., ger, P. K., Selbig, J., ller, L.
A. M., Rhee, S. Y. & Stitt, M. (2004) MAPMAN- a user-driven tool to display

References
125
genomics data sets onto diagrams of metabolic pathways and other biological
processes. The Plant Journal 37: 914-939.
Tian, M. (2004) A Kazal-like extracellular serine protease inhibitor from Phytophthora
infestans targets the tomato pathogenesis-related protease P69B. Journal of
Biological Chemistry 279(25): 26370-26377.
Tian, M. (2005) A Second Kazal-Like protease inhibitor from Phytophthora infestans
inhibits and interacts with the apoplastic pathogenesis-related protease P69B of
tomato. Plant physiology 138(3): 1785-1793.
Tian, M., Win, J., Song, J., van der Hoorn, R., van der Knaap, E. & Kamoun, S. (2007)
A Phytophthora infestans Cystatin-like protein targets a novel tomato Papain-
like apoplastic protease. Plant physiology 143(1): 364-377.
Tian, Z. D., Liu, J., Wang, B. L. & Xie, C. H. (2006) Screening and expression analysis
of Phytophthora infestans induced genes in potato leaves with horizontal
resistance. Plant Cell Reports 25(10): 1094-1103.
Toure, Y., Ongena, M., Jacques, P., Guiro, A. & Thonart, P. (2004) Role of lipopeptides
produced by Bacillus subtilis GA1 in the reduction of grey mould disease
caused by Botrytis cinerea on apple. Journal of applied microbiology 96(5):
1151-1160.
Truernit, E., Schmid, J., Epple, P., Illig, J. & Sauer, N. (1996) The sink-specific and
stress-regulated Arabidopsis STP4 gene: enhanced expression of a gene
encoding a monosaccharide transporter by wounding, elicitors, and pathogen
challenge. The Plant Cell Online 8(12): 2169-2182.
Uknes, S., Mauch-Mani, B., Moyer, M., Potter, S., Williams, S., Dincher, S., Chandler,
D., Slusarenko, A., Ward, E. & Ryals, J. (1992) Acquired Resistance in
Arabidopsis. The Plant Cell 4: 645-656.
References
126
van Loon, L. C. & van Strien, E. A. (1999) The families of pathogenesis-related
proteins, their activities, and comparative analysis of PR-1 type proteins.
Physiological and Molecular Plant Pathology 55: 85-97.
Vardhanabhuti, S., Blakemore, S. J., Clark, S. M., Ghosh, S., Stephens, R. J. &
Rajagopalan, D. (2006) A comparison of statistical tests for detecting
differential expression using Affymetrix oligonucleotide microarrays. OMICS:
A Journal of Integrative Biology 10(4): 555–566.
Vartapetian, A. B., Tuzhikov, A. I., Chichkova, N. V., Taliansky, M. & Wolpert, T. J.
(2011) A plant alternative to animal caspases: subtilisin-like proteases. Cell
Death and Differentiation 18(8): 1289-1297.
Vega-SaÂncheza, M., Erselius, L., Rodriguez, A., Bastidas, O., Hohl, H., Ojiambo, P.,
Mukalazi, J., Vermeulen, T., Fry, W. & Forbes, G. (2000) Host adaptation to
potato and tomato within the US-1 clonal lineage of Phytophthora infestans in
Uganda and Kenya. Plant Pathology 49(5): 531-539.
Vleeshouwers, V. G. A. A., Dooijeweert, W. v., Govers, F., Kamoun, S. & Colon, L. T.
(2000) The hypersensitive response is associated with host and nonhost
resistance to Phytophthora infestans. Planta 210: 853-864.
Voegele, R. T., Struck, C., Hahn, M. & Mendgen, K. (2001) The role of haustoria in
sugar supply during infection of broad bean by the rust fungus Uromyces fabae.
Proceedings of the National Academy of Sciences of the United States of
America 98(14): 8133.
Vorwerk, S., Schiff, C., Santamaria, M., Koh, S., Nishimura, M., Vogel, J., Somerville,
C. & Somerville, S. (2007) EDR2 negatively regulates salicylic acid-based
defenses and cell death during powdery mildew infections of Arabidopsis
thaliana. BMC Plant Biology 7(1): 35.

References
127
Ward, E. R., Uknes, S. J., Williams, S. C., Dincher, S. S., Wiederhold, D. L.,
Alexander, D. C., Ahl-Goy, P., Métraux, J.-P. & Ryals, J. A. (1991) Coordinate
gene activity in response to agents that induce systemic acquired resistance. The
Plant Cell 3: 1085-1094.
Weaver, L. M. & Herrmann, K. M. (1997) Dynamics of the shikimate pathway in
plants. Trends in Plant Science 2(9): 346-351.
Whisson, S. C., Boevink, P. C., Moleleki, L., Avrova, A. O., Morales, J. G., Gilroy, E.
M., Armstrong, M. R., Grouffaud, S., Van West, P. & Chapman, S. (2007) A
translocation signal for delivery of oomycete effector proteins into host plant
cells. Nature 450(7166): 115-118.
Xie, X., Xue, Y., Zhou, J., Zhang, B., Chang, H., Takano, M (2011) Phytochromes
regulate SA and JA signaling pathways in rice and are required for
developmentally controlled resistance to Magnaporthe grisea. Molecular Plant.
4(4): 688-696.
Yan, J., Wang, J., Li, Q., Hwang, J. R., Patterson, C. & Zhang, H. (2003) AtCHIP, a U-
box-containing E3 ubiquitin ligase, plays a critical role in temperature stress
tolerance in Arabidopsis. Plant physiology 132(2): 861-869.
Yan, Z., Reddy, M. S., Ryu, C.-M., McInroy, J. A., Wilson, M., & Kloepper, J. W.
(2002) Induced systemic protection against tomato late blight elicited by plant
growth-promoting rhizobacteria. Phytopathology 92(12): 1329-1333.
Yoshioka, K., Kachroo, P., Tsui, F., Sharma, S. B., Shah, J. & Klessig, D. F. (2001)
Environmentally sensitive, SA-dependent defense responses in the cpr22 mutant
of Arabidopsis. The Plant Journal 26(4): 447-459.
Yuan, S., & Lin, H-H. (2008) Role of salicylic acid in plant abiotic stress. Zeitschrift fur
Naturforschung. C, Journal of Biosciences 63(5-6): 313-320.
References
128
Zhu, B., Chen, T.H.H., & Li, P.H. (1995) Expression of three osmotin-like protein
genes in response to osmotic stress and fungal infection in potato. Plant
Molecular Biology 28: 17-26.
Zipfel, C., & Felix, G. (2005) Plants and animals: a different taste for microbes?
Current Opinion in Plant Biology 8(4): 353-360.
Zipfel, C., Kunze, G., Chinchilla, D., Caniard, A., Jones, J. D.G., Boller, T., & Felix, G.
(2006) Perception of the bacterial PAMP EF-Tu by the receptor EFR restricts
Agrobacterium-mediated transformation. Cell 125(4): 749-760.
Zipfel, C., Robatzek, S., Navarro, L., Oakeley, E.J., Jones J.D.G.,Felix, G., & Boller, T.
(2004) Bacterial disease resistance in Arabidopsis through flagellin perception.
Nature 428: 764-767.
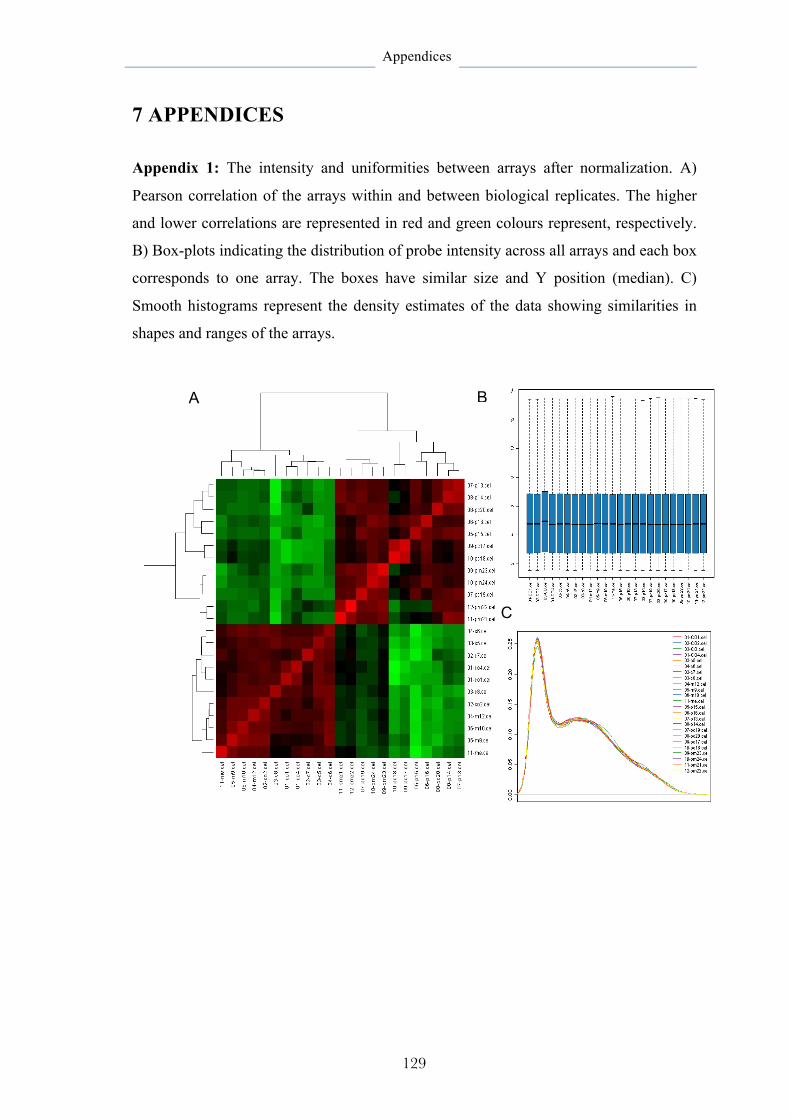
Appendices
129
7 APPENDICES
Appendix 1: The intensity and uniformities between arrays after normalization. A)
Pearson correlation of the arrays within and between biological replicates. The higher
and lower correlations are represented in red and green colours represent, respectively.
B) Box-plots indicating the distribution of probe intensity across all arrays and each box
corresponds to one array. The boxes have similar size and Y position (median). C)
Smooth histograms represent the density estimates of the data showing similarities in
shapes and ranges of the arrays.
A B
C

Appendices
130
Appendix 2: Expression profile of differentially expressed genes in tomato leaves
inoculated with Phytophthora infestans 12 hours post inoculation. Molecular network
analyses to find out the associated pathways have done by Mapman (P value <5%).
ProbeSet ID
Gene Gene Fold change
*Simila-rity
E value title symbol
Signaling signaling.in sugar and nutrient physiology LesAffx.344.3.S1_at photoassimilate-responsive
protein-related AT3G54040 10.3 w 3.00E-44
Les.1175.2.S1_at photoassimilate-responsive protein, putative
AT5G52390 2.9 m 1.00E-12
signaling.receptor kinase LesAffx.59625.1.S1_at 33 kDa secretory protein-
related AT5G48540 4.1 m 1.00E-37
LesAffx.50533.1.S1_at cysteine-rich RLK10 CRK10 2.6 h 8.00E-11 Les.1334.1.A1_at PR5-like receptor kinase PR5K 2.5 m _ LesAffx.70335.1.S1_at protein kinase, putative AT3G57700 2.5 w 1.00E-33 Les.2137.1.S1_at EIX receptor 1 Eix1 2.4 i 7.00E-77 LesAffx.65273.1.S1_at protein kinase family protein AT1G16670 2.4 m 3.00E-62 Les.1297.1.S1_at chitin elicitor receptor kinase 1 CERK1 2.3 h 1.00E-52 LesAffx.46815.2.S1_at leucine-rich repeat family
protein AT3G20820 -2 m 4.00E-93
signaling.calcium LesAffx.69808.1.S1_at calmodulin-binding protein EDA39 9 h 5.00E-120 LesAffx.3635.2.A1_at calmodulin-binding family
protein . 8.2 h 2.00E-16
LesAffx.16164.1.S1_at calcium-binding EF hand family protein
. 5.2 w 6.00E-21
Les.1997.1.S1_at clareticulin 3 CRT3 5.1 h 2.00E-34 Les.1997.3.A1_at clareticulin 3 CRT3 5.1 h 1.00E-10 LesAffx.66814.1.S1_at calmodulin binding AT1G73805 4.6 m 1.00E-12 LesAffx.3635.1.S1_at calmodulin-binding family
protein . 4.4 h 4.00E-98
Les.4651.1.S1_at calnexin-like protein LeCNX61.0 4.2 i-h 4.00E-183 Les.1997.2.S1_at clareticulin 3 CRT3 3.7 m 5.00E-24 LesAffx.70732.1.S1_at calmodulin-related protein,
putative AT3G50770 3.3 w 2.00E-40
Les.3334.1.S1_at calcium-dependent protein kinase 28
CPK28 2.7 m _
LesAffx.15921.1.S1_at lipase class 3 family protein / calmodulin-binding heat-shock protein, putative
AT5G37710 2.6 h 6.00E-46
Les.1360.2.A1_at calcium-dependent protein kinase 1
ATCDPK1 2.6 h 3.00E-17
LesAffx.9367.1.S1_at Ca2+-binding protein 1 ATCP1 2.5 w 7.00E-30 LesAffx.47666.1.S1_at C2 domain-containing protein AT4G34150 2.3 w 9.00E-32 LesAffx.30900.1.S1_at calcium-dependent protein
kinase 19 CPK19 2.3 h 1.00E-53
LesAffx.25303.1.S1_at calmodulin-binding protein AT2G15760 2.3 w 1.00E-10 Les.923.1.S1_at calcium-dependent protein
kinase CDPK1 LOC543689 2.1 i-h 2.00E-214
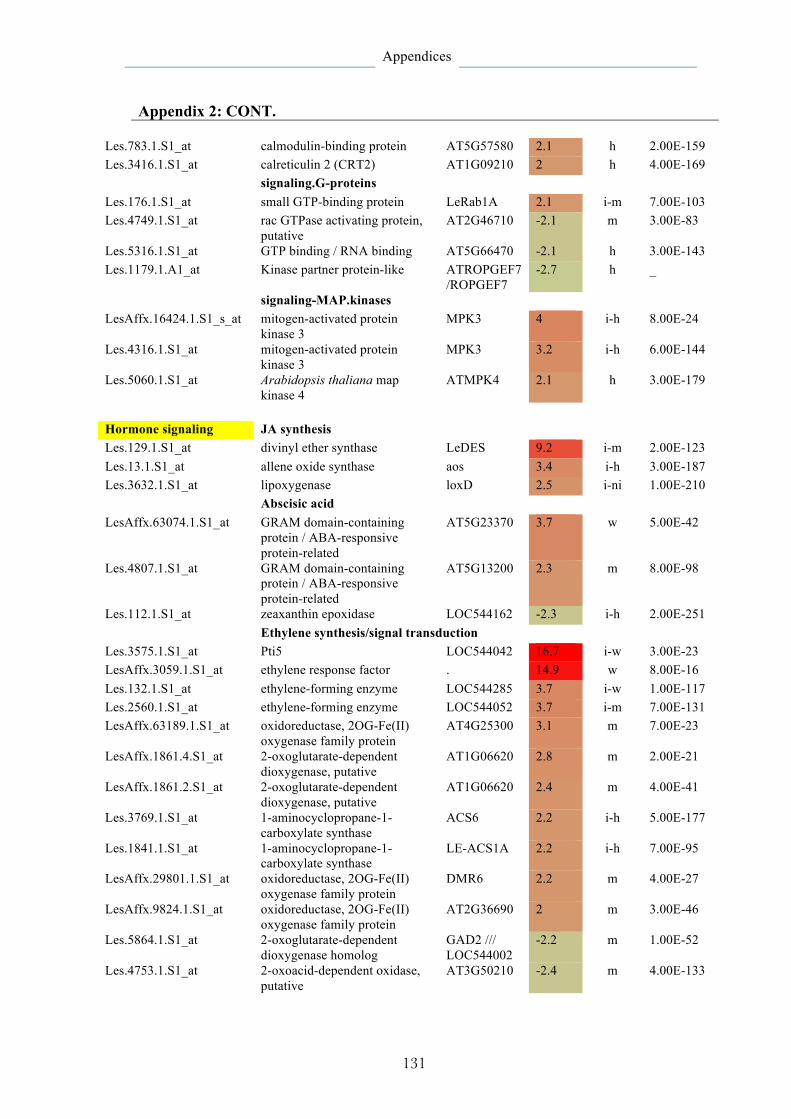
Appendices
131
Appendix 2: CONT.
Les.783.1.S1_at calmodulin-binding protein AT5G57580 2.1 h 2.00E-159 Les.3416.1.S1_at calreticulin 2 (CRT2) AT1G09210 2 h 4.00E-169 signaling.G-proteins Les.176.1.S1_at small GTP-binding protein LeRab1A 2.1 i-m 7.00E-103 Les.4749.1.S1_at rac GTPase activating protein,
putative AT2G46710 -2.1 m 3.00E-83
Les.5316.1.S1_at GTP binding / RNA binding AT5G66470 -2.1 h 3.00E-143 Les.1179.1.A1_at Kinase partner protein-like ATROPGEF7
/ROPGEF7 -2.7 h _
signaling-MAP.kinases LesAffx.16424.1.S1_s_at mitogen-activated protein
kinase 3 MPK3 4 i-h 8.00E-24
Les.4316.1.S1_at mitogen-activated protein kinase 3
MPK3 3.2 i-h 6.00E-144
Les.5060.1.S1_at Arabidopsis thaliana map kinase 4
ATMPK4 2.1 h 3.00E-179
Hormone signaling JA synthesis Les.129.1.S1_at divinyl ether synthase LeDES 9.2 i-m 2.00E-123 Les.13.1.S1_at allene oxide synthase aos 3.4 i-h 3.00E-187 Les.3632.1.S1_at lipoxygenase loxD 2.5 i-ni 1.00E-210 Abscisic acid LesAffx.63074.1.S1_at GRAM domain-containing
protein / ABA-responsive protein-related
AT5G23370 3.7 w 5.00E-42
Les.4807.1.S1_at GRAM domain-containing protein / ABA-responsive protein-related
AT5G13200 2.3 m 8.00E-98
Les.112.1.S1_at zeaxanthin epoxidase LOC544162 -2.3 i-h 2.00E-251 Ethylene synthesis/signal transduction Les.3575.1.S1_at Pti5 LOC544042 16.7 i-w 3.00E-23 LesAffx.3059.1.S1_at ethylene response factor . 14.9 w 8.00E-16 Les.132.1.S1_at ethylene-forming enzyme LOC544285 3.7 i-w 1.00E-117 Les.2560.1.S1_at ethylene-forming enzyme LOC544052 3.7 i-m 7.00E-131 LesAffx.63189.1.S1_at oxidoreductase, 2OG-Fe(II)
oxygenase family protein AT4G25300 3.1 m 7.00E-23
LesAffx.1861.4.S1_at 2-oxoglutarate-dependent dioxygenase, putative
AT1G06620 2.8 m 2.00E-21
LesAffx.1861.2.S1_at 2-oxoglutarate-dependent dioxygenase, putative
AT1G06620 2.4 m 4.00E-41
Les.3769.1.S1_at 1-aminocyclopropane-1-carboxylate synthase
ACS6 2.2 i-h 5.00E-177
Les.1841.1.S1_at 1-aminocyclopropane-1-carboxylate synthase
LE-ACS1A 2.2 i-h 7.00E-95
LesAffx.29801.1.S1_at oxidoreductase, 2OG-Fe(II) oxygenase family protein
DMR6 2.2 m 4.00E-27
LesAffx.9824.1.S1_at oxidoreductase, 2OG-Fe(II) oxygenase family protein
AT2G36690 2 m 3.00E-46
Les.5864.1.S1_at 2-oxoglutarate-dependent dioxygenase homolog
GAD2 /// LOC544002
-2.2 m 1.00E-52
Les.4753.1.S1_at 2-oxoacid-dependent oxidase, putative
AT3G50210 -2.4 m 4.00E-133

Appendices
132
Appendix 2: CONT.
Les.2341.1.A1_at GCN5-related N-acetyltransferase (GNAT) family protein
. -2.5 w _
Les.4139.1.S1_at ethylene response factor 4 ERF4 -2.8 i-w 7.00E-34 Biotic stress.PR-proteins LesAffx.16769.1.S1_at disease resistance-responsive
protein-related AT2G21100 13.8 w 7.00E-21
Les.2137.1.S1_at EIX receptor 1 Eix1 2.4 i-m 7.00E-77 Les.3506.1.S1_at verticillium wilt disease
resistance protein Ve2 Ve2 2.2 i-m 8.00E-103
Secondary metabolism Wax LesAffx.60722.1.S1_at Arabidopsis thaliana sterol O-
acyltransferase 1 AtSAT1 3.2 m 3.00E-27
N misc.alkaloid-like LesAffx.50270.1.S1_at strictosidine synthase family
protein AT3G51441 2.6 m 3.00E-29
LesAffx.50270.2.S1_at strictosidine synthase family protein
AT3G51440 2.2 w 4.00E-26
Phenylpropanoids-lignin biosynthesis LesAffx.62617.1.S1_at transferase family protein AT5G07850 7.1 h 6.00E-67 Les.3741.1.S1_at Eli3 protein Eli3 2.4 i-m 5.00E-97 Les.281.1.S1_at 4-coumarate :COA ligase 1 4CL1 2.4 h 4.00E-81 Les.1097.1.A1_at 4-coumarate :COA ligase 2 4CL2 2.3 w _ Les.281.3.S1_at 4-coumarate :COA ligase 1 4CL1 2.3 h 2.00E-17 LesAffx.47885.1.S1_at OPC-8:0 COA LIGASE1 OPCL1 2.2 h 3.00E-92 Les.4271.2.S1_at PHE ammonialyase 1 PAL1 2.1 ni 2.00E-133 Les.5068.1.S1_at Nicotinamidase 2 NIC2 -2 m 6.00E-74 Isoprenoids.carotenoids Les.72.1.S1_at farnesyl pyrophosphate
synthase FPS1 3.7 i-h 1.00E-155
LesAffx.66096.2.S1_at Mevalonate kinase MK 3.2 m 3.00E-14 Les.4735.1.S1_at 3-hydroxy-3-methylglutaryl
coenzyme A synthase HMGS 3 i-m 1.00E-213
Les.2490.1.S1_at mevalonate disphosphate decarboxylase
MDC 2.8 i-w 2.00E-185
Les.3771.1.S1_at lycopene epsilon-cyclase CrtL-e-1 -2.1 i-h 4.00E-213 Les.1785.1.A1_at amine oxidase family AT1G57770 -2.1 m 8.00E-90 Les.3958.1.S1_at violaxanthin de-epoxidase LOC543696 -2.2 i-h 3.00E-71 Les.3510.1.S1_at 1-D-deoxyxylulose 5-phosphate
synthase dxs -2.6 i-ni 0
Les.3123.1.S1_at geranylgeranyl reductase AT1G74470 -2.8 h 2.00E-70 Flavonoids Les.1664.1.S1_at 2-oxoglutarate dehydrogenase
E1 component, putative AT3G55410 3.8 ni 0
Les.2278.1.S1_at Flavanone 3-hydroxylase F3H 3.7 h 3.00E-167 Les.842.1.S1_at GT72B1 GT72B1 2.5 w 5.00E-25 Les.842.2.S1_a_at GT72B1 GT72B1 2 w 1.00E-12 Les.5864.1.S1_at 2-oxoglutarate-dependent
dioxygenase homolog GAD2 /// LOC544002
-2.2 m 1.00E-52
Les.4753.1.S1_at 2-oxoacid-dependent oxidase AT3G50210 -2.4 m 4.00E-133

Appendices
133
Appendix 2: CONT.
amino acid metabolism Tyrosine synthesis LesAffx.66354.1.S1_at prephenate dehydrogenase
family protein AT1G15710 24.6 m 7.00E-39
Les.5555.1.S1_at prephenate dehydrogenase family protein
AT1G15710 2.5 m 5.00E-121
Chorismate synthesis Les.3039.1.S1_at phospho-2-dehydro-3-
deoxyheptonate aldolase LOC544153 7 i-h 4.00E-236
Les.3672.1.S1_at 5-enolpyruvylshikimate-3-phosphate synthase
LOC543977 4.8 i-h 8.00E-211
Les.53.1.S1_at shikimate kinase precursor LOC544078 2.8 i-m 4.00E-83 Les.5092.1.S1_at Maternal effect embryo arrest
32 MEE32 2.5 m 8.00E-75
Les.5122.1.S1_at shikimate kinase-related AT2G35500 -2.1 m 2.00E-114 Phenylalanine synthesis LesAffx.10955.1.S1_at arogenate dehydratase 6 ADT6 3.6 h 1.00E-42 LesAffx.10955.3.S1_at arogenate dehydratase 6 ADT6 3.5 h 3.00E-30 Sucrose.degradation Les.3460.1.S1_at acid invertase Wiv-1 4.4 i-h 7.00E-151 Les.157.1.S1_at sucrose synthase sus3 2.3 i-h 2.00E-277 LesAffx.53904.1.S1_at hypothetical protein AT5G40510 2.1 m 6.00E-70 Les.1617.2.S1_s_at fructose-1,6-bisphosphatase,
putative AT1G43670 -2.1 h 2.00E-42
Les.4946.1.S1_at fructose-1,6-bisphosphatase, putative
AT1G43670 -2.6 h 2.00E-165
Les.1617.3.A1_s_at fructose-1,6-bisphosphatase, putative
AT1G43670 -2.4 h _
Enzyme family Misc.peroxidase LesAffx.57363.1.S1_at anionic peroxidase, putative AT1G14550 5.8 m 6.00E-44 Les.4999.1.S1_at peroxidase 21 (PER21) (P21)
(PRXR5) AT2G37130 5.5 m 6.00E-110
LesAffx.71606.1.S1_s_at peroxidase 21 (PER21) (P21) (PRXR5)
AT2G37130 5.2 w 2.00E-13
Les.2832.1.S1_at peroxidase cevi16 4.2 i-m 3.00E-108 LesAffx.60831.1.S1_at peroxidase, putative AT4G26010 2 m 3.00E-19 Les.4492.2.S1_at Light harvesting complex PSII
subunit6 LHCB6 -2.3 m 1.00E-112
Les.4492.3.S1_at Light harvesting complex PSII subunit6
LHCB6 -2.3 m 2.00E-28
Misc.cytochrome P450 LesAffx.8720.2.S1_at CYP76C5 CYP76C5 27.7 m 2.00E-37 Les.4880.1.S1_at Transparent testa7 TT7 8.4 m 8.00E-109 LesAffx.9038.3.S1_at cytochrome P450, putative AT1G66540 6.5 m 2.00E-19 LesAffx.22491.2.A1_at cytochrome P450 CYP705A25 5.8 m 1.00E-11 Les.2988.1.S1_at Sucrose transporter LeSUT1 4.8 i-h 2.00E-226 LesAffx.5912.1.A1_at Ferulic acid 5-hydroxylase1 FAH1 4.7 m 4.00E-39 LesAffx.5912.1.S1_at Ferulic acid 5-hydroxylase1 FAH1 3.5 m 4.00E-39 LesAffx.3698.3.S1_at Arabidopsis P450 reductase2 ATR2 3 h 1.00E-128
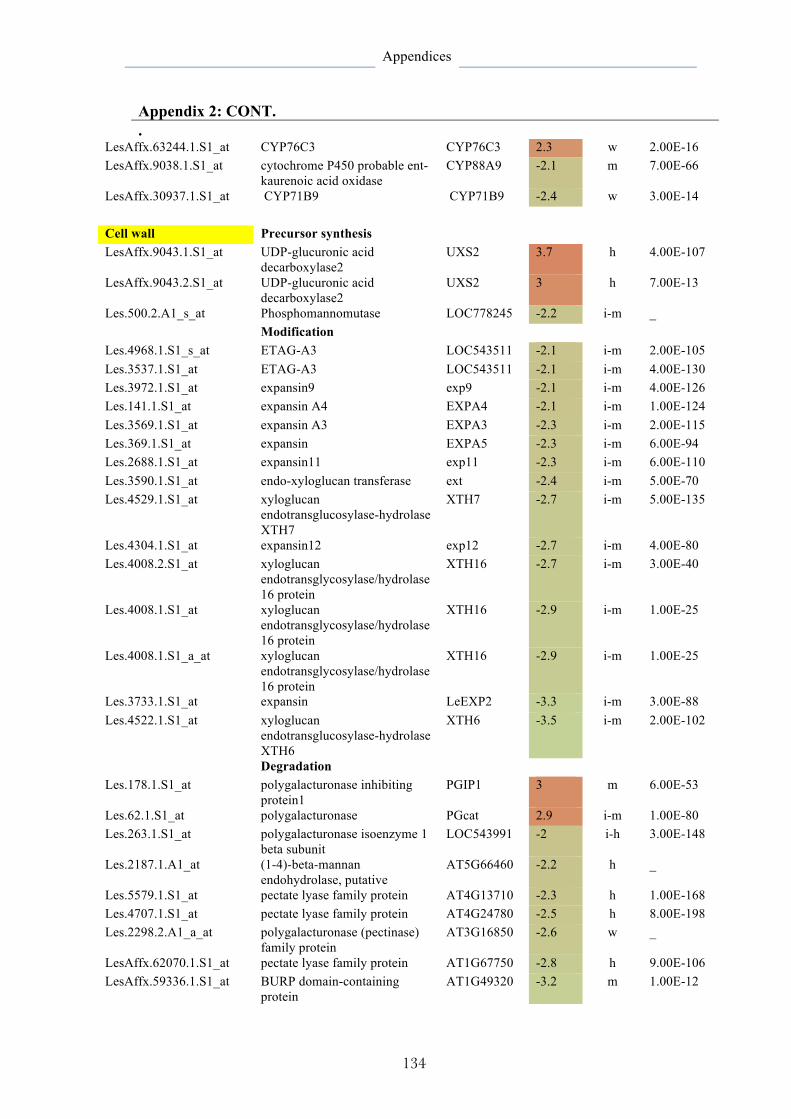
Appendices
134
Appendix 2: CONT. .
LesAffx.63244.1.S1_at CYP76C3 CYP76C3 2.3 w 2.00E-16 LesAffx.9038.1.S1_at cytochrome P450 probable ent-
kaurenoic acid oxidase CYP88A9 -2.1 m 7.00E-66
LesAffx.30937.1.S1_at CYP71B9 CYP71B9 -2.4 w 3.00E-14 Cell wall Precursor synthesis LesAffx.9043.1.S1_at UDP-glucuronic acid
decarboxylase2 UXS2 3.7 h 4.00E-107
LesAffx.9043.2.S1_at UDP-glucuronic acid decarboxylase2
UXS2 3 h 7.00E-13
Les.500.2.A1_s_at Phosphomannomutase LOC778245 -2.2 i-m _ Modification Les.4968.1.S1_s_at ETAG-A3 LOC543511 -2.1 i-m 2.00E-105 Les.3537.1.S1_at ETAG-A3 LOC543511 -2.1 i-m 4.00E-130 Les.3972.1.S1_at expansin9 exp9 -2.1 i-m 4.00E-126 Les.141.1.S1_at expansin A4 EXPA4 -2.1 i-m 1.00E-124 Les.3569.1.S1_at expansin A3 EXPA3 -2.3 i-m 2.00E-115 Les.369.1.S1_at expansin EXPA5 -2.3 i-m 6.00E-94 Les.2688.1.S1_at expansin11 exp11 -2.3 i-m 6.00E-110 Les.3590.1.S1_at endo-xyloglucan transferase ext -2.4 i-m 5.00E-70 Les.4529.1.S1_at xyloglucan
endotransglucosylase-hydrolase XTH7
XTH7 -2.7 i-m 5.00E-135
Les.4304.1.S1_at expansin12 exp12 -2.7 i-m 4.00E-80 Les.4008.2.S1_at xyloglucan
endotransglycosylase/hydrolase 16 protein
XTH16 -2.7 i-m 3.00E-40
Les.4008.1.S1_at xyloglucan endotransglycosylase/hydrolase 16 protein
XTH16 -2.9 i-m 1.00E-25
Les.4008.1.S1_a_at xyloglucan endotransglycosylase/hydrolase 16 protein
XTH16 -2.9 i-m 1.00E-25
Les.3733.1.S1_at expansin LeEXP2 -3.3 i-m 3.00E-88 Les.4522.1.S1_at xyloglucan
endotransglucosylase-hydrolase XTH6
XTH6 -3.5 i-m 2.00E-102
Degradation Les.178.1.S1_at polygalacturonase inhibiting
protein1 PGIP1 3 m 6.00E-53
Les.62.1.S1_at polygalacturonase PGcat 2.9 i-m 1.00E-80 Les.263.1.S1_at polygalacturonase isoenzyme 1
beta subunit LOC543991 -2 i-h 3.00E-148
Les.2187.1.A1_at (1-4)-beta-mannan endohydrolase, putative
AT5G66460 -2.2 h _
Les.5579.1.S1_at pectate lyase family protein AT4G13710 -2.3 h 1.00E-168 Les.4707.1.S1_at pectate lyase family protein AT4G24780 -2.5 h 8.00E-198 Les.2298.2.A1_a_at polygalacturonase (pectinase)
family protein AT3G16850 -2.6 w _
LesAffx.62070.1.S1_at pectate lyase family protein AT1G67750 -2.8 h 9.00E-106 LesAffx.59336.1.S1_at BURP domain-containing
protein AT1G49320 -3.2 m 1.00E-12
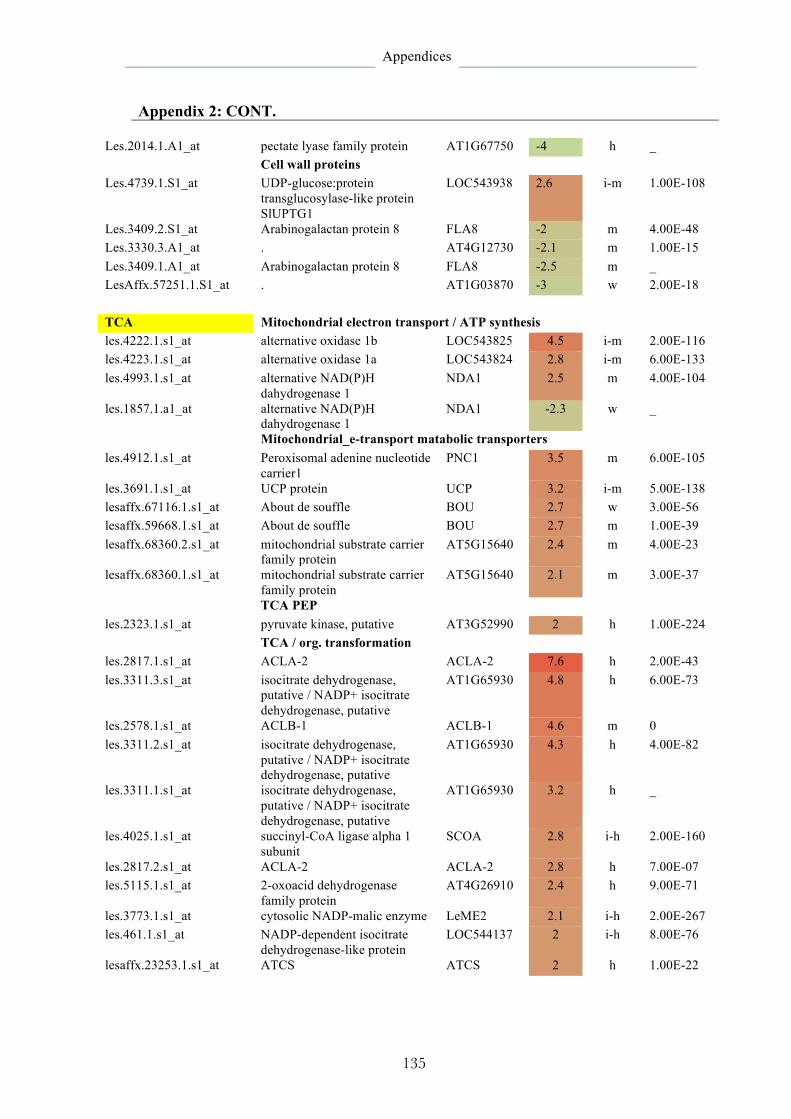
Appendices
135
Appendix 2: CONT.
Les.2014.1.A1_at pectate lyase family protein AT1G67750 -4 h _ Cell wall proteins Les.4739.1.S1_at UDP-glucose:protein
transglucosylase-like protein SlUPTG1
LOC543938 2.6 i-m 1.00E-108
Les.3409.2.S1_at Arabinogalactan protein 8 FLA8 -2 m 4.00E-48 Les.3330.3.A1_at . AT4G12730 -2.1 m 1.00E-15 Les.3409.1.A1_at Arabinogalactan protein 8 FLA8 -2.5 m _ LesAffx.57251.1.S1_at . AT1G03870 -3 w 2.00E-18 TCA Mitochondrial electron transport / ATP synthesis les.4222.1.s1_at alternative oxidase 1b LOC543825 4.5 i-m 2.00E-116 les.4223.1.s1_at alternative oxidase 1a LOC543824 2.8 i-m 6.00E-133 les.4993.1.s1_at alternative NAD(P)H
dahydrogenase 1 NDA1 2.5 m 4.00E-104
les.1857.1.a1_at alternative NAD(P)H dahydrogenase 1
NDA1 -2.3 w _
Mitochondrial_e-transport matabolic transporters les.4912.1.s1_at Peroxisomal adenine nucleotide
carrier1 PNC1 3.5 m 6.00E-105
les.3691.1.s1_at UCP protein UCP 3.2 i-m 5.00E-138 lesaffx.67116.1.s1_at About de souffle BOU 2.7 w 3.00E-56 lesaffx.59668.1.s1_at About de souffle BOU 2.7 m 1.00E-39 lesaffx.68360.2.s1_at mitochondrial substrate carrier
family protein AT5G15640 2.4 m 4.00E-23
lesaffx.68360.1.s1_at mitochondrial substrate carrier family protein
AT5G15640 2.1 m 3.00E-37
TCA PEP les.2323.1.s1_at pyruvate kinase, putative AT3G52990 2 h 1.00E-224 TCA / org. transformation les.2817.1.s1_at ACLA-2 ACLA-2 7.6 h 2.00E-43 les.3311.3.s1_at isocitrate dehydrogenase,
putative / NADP+ isocitrate dehydrogenase, putative
AT1G65930 4.8 h 6.00E-73
les.2578.1.s1_at ACLB-1 ACLB-1 4.6 m 0 les.3311.2.s1_at isocitrate dehydrogenase,
putative / NADP+ isocitrate dehydrogenase, putative
AT1G65930 4.3 h 4.00E-82
les.3311.1.s1_at isocitrate dehydrogenase, putative / NADP+ isocitrate dehydrogenase, putative
AT1G65930 3.2 h _
les.4025.1.s1_at succinyl-CoA ligase alpha 1 subunit
SCOA 2.8 i-h 2.00E-160
les.2817.2.s1_at ACLA-2 ACLA-2 2.8 h 7.00E-07 les.5115.1.s1_at 2-oxoacid dehydrogenase
family protein AT4G26910 2.4 h 9.00E-71
les.3773.1.s1_at cytosolic NADP-malic enzyme LeME2 2.1 i-h 2.00E-267 les.461.1.s1_at NADP-dependent isocitrate
dehydrogenase-like protein LOC544137 2 i-h 8.00E-76
lesaffx.23253.1.s1_at ATCS ATCS 2 h 1.00E-22
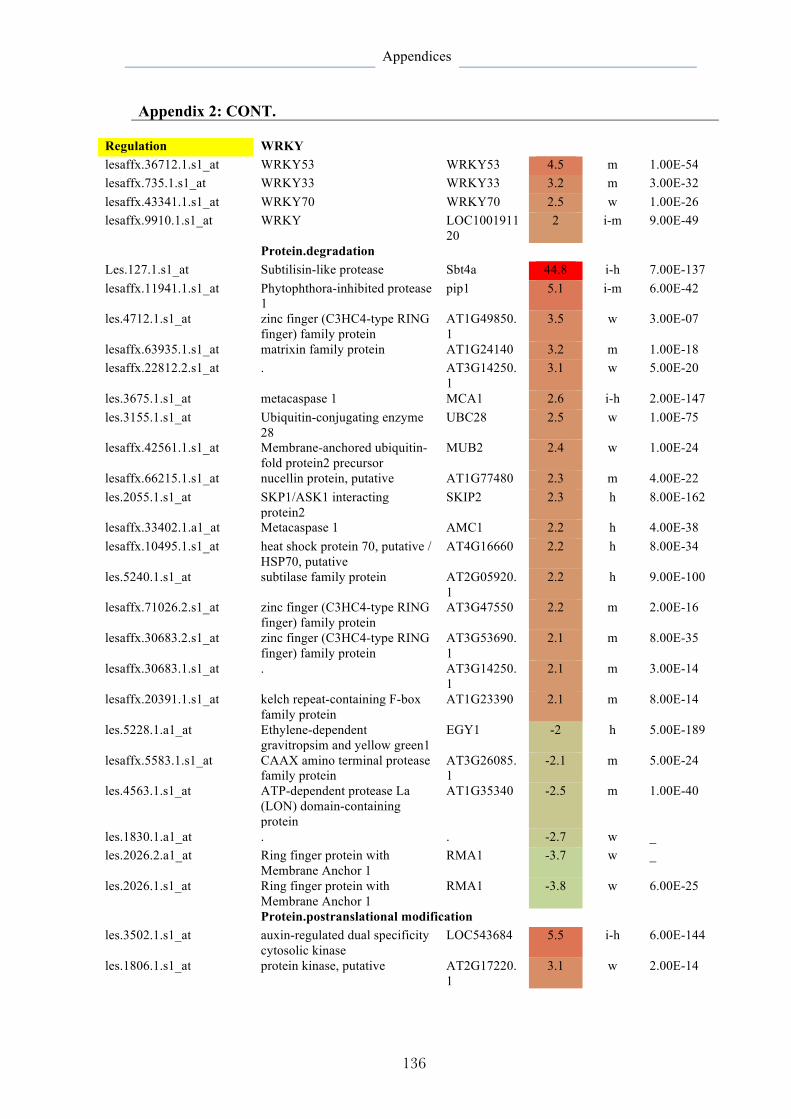
Appendices
136
Appendix 2: CONT.
Regulation WRKY lesaffx.36712.1.s1_at WRKY53 WRKY53 4.5 m 1.00E-54 lesaffx.735.1.s1_at WRKY33 WRKY33 3.2 m 3.00E-32 lesaffx.43341.1.s1_at WRKY70 WRKY70 2.5 w 1.00E-26 lesaffx.9910.1.s1_at WRKY LOC1001911
20 2 i-m 9.00E-49
Protein.degradation Les.127.1.s1_at Subtilisin-like protease Sbt4a 44.8 i-h 7.00E-137 lesaffx.11941.1.s1_at Phytophthora-inhibited protease
1 pip1 5.1 i-m 6.00E-42
les.4712.1.s1_at zinc finger (C3HC4-type RING finger) family protein
AT1G49850.1
3.5 w 3.00E-07
lesaffx.63935.1.s1_at matrixin family protein AT1G24140 3.2 m 1.00E-18 lesaffx.22812.2.s1_at . AT3G14250.
1 3.1 w 5.00E-20
les.3675.1.s1_at metacaspase 1 MCA1 2.6 i-h 2.00E-147 les.3155.1.s1_at Ubiquitin-conjugating enzyme
28 UBC28 2.5 w 1.00E-75
lesaffx.42561.1.s1_at Membrane-anchored ubiquitin-fold protein2 precursor
MUB2 2.4 w 1.00E-24
lesaffx.66215.1.s1_at nucellin protein, putative AT1G77480 2.3 m 4.00E-22 les.2055.1.s1_at SKP1/ASK1 interacting
protein2 SKIP2 2.3 h 8.00E-162
lesaffx.33402.1.a1_at Metacaspase 1 AMC1 2.2 h 4.00E-38 lesaffx.10495.1.s1_at heat shock protein 70, putative /
HSP70, putative AT4G16660 2.2 h 8.00E-34
les.5240.1.s1_at subtilase family protein AT2G05920.1
2.2 h 9.00E-100
lesaffx.71026.2.s1_at zinc finger (C3HC4-type RING finger) family protein
AT3G47550 2.2 m 2.00E-16
lesaffx.30683.2.s1_at zinc finger (C3HC4-type RING finger) family protein
AT3G53690.1
2.1 m 8.00E-35
lesaffx.30683.1.s1_at . AT3G14250.1
2.1 m 3.00E-14
lesaffx.20391.1.s1_at kelch repeat-containing F-box family protein
AT1G23390 2.1 m 8.00E-14
les.5228.1.a1_at Ethylene-dependent gravitropsim and yellow green1
EGY1 -2 h 5.00E-189
lesaffx.5583.1.s1_at CAAX amino terminal protease family protein
AT3G26085.1
-2.1 m 5.00E-24
les.4563.1.s1_at ATP-dependent protease La (LON) domain-containing protein
AT1G35340 -2.5 m 1.00E-40
les.1830.1.a1_at . . -2.7 w _ les.2026.2.a1_at Ring finger protein with
Membrane Anchor 1 RMA1 -3.7 w _
les.2026.1.s1_at Ring finger protein with Membrane Anchor 1
RMA1 -3.8 w 6.00E-25
Protein.postranslational modification les.3502.1.s1_at auxin-regulated dual specificity
cytosolic kinase LOC543684 5.5 i-h 6.00E-144
les.1806.1.s1_at protein kinase, putative AT2G17220.1
3.1 w 2.00E-14
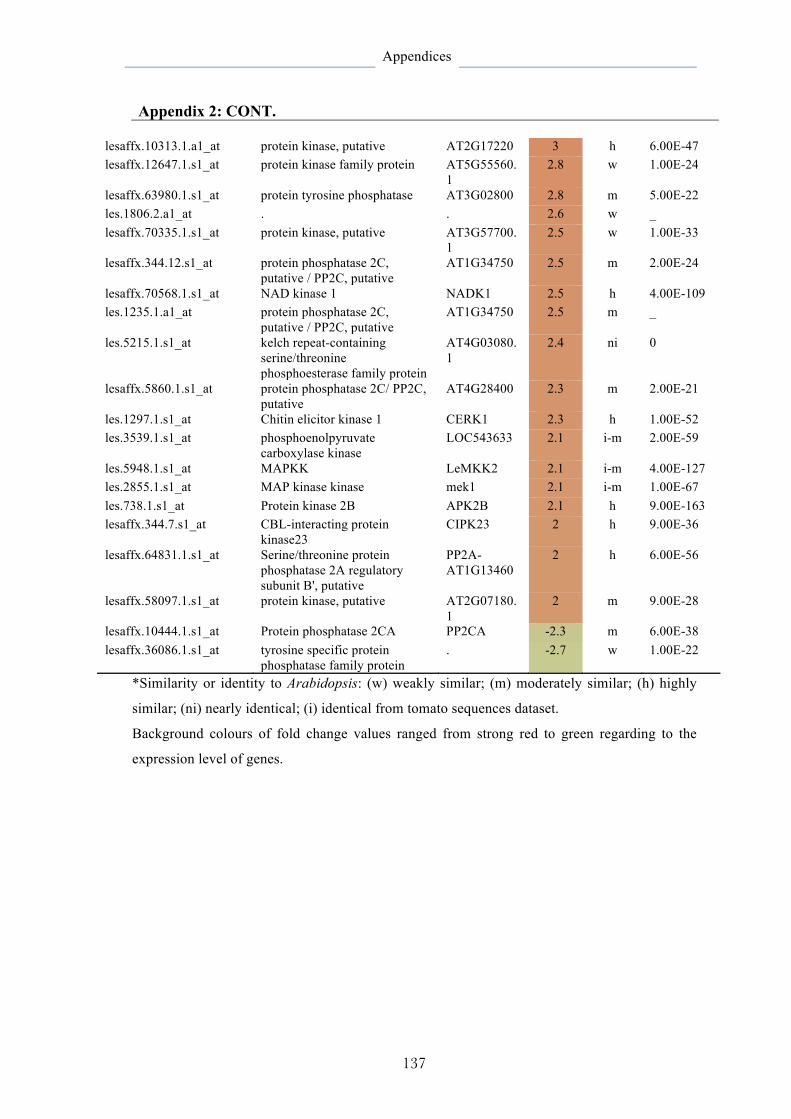
Appendices
137
Appendix 2: CONT.
lesaffx.10313.1.a1_at protein kinase, putative AT2G17220 3 h 6.00E-47 lesaffx.12647.1.s1_at protein kinase family protein AT5G55560.
1 2.8 w 1.00E-24
lesaffx.63980.1.s1_at protein tyrosine phosphatase AT3G02800 2.8 m 5.00E-22 les.1806.2.a1_at . . 2.6 w _ lesaffx.70335.1.s1_at protein kinase, putative AT3G57700.
1 2.5 w 1.00E-33
lesaffx.344.12.s1_at protein phosphatase 2C, putative / PP2C, putative
AT1G34750 2.5 m 2.00E-24
lesaffx.70568.1.s1_at NAD kinase 1 NADK1 2.5 h 4.00E-109 les.1235.1.a1_at protein phosphatase 2C,
putative / PP2C, putative AT1G34750 2.5 m _
les.5215.1.s1_at kelch repeat-containing serine/threonine phosphoesterase family protein
AT4G03080.1
2.4 ni 0
lesaffx.5860.1.s1_at protein phosphatase 2C/ PP2C, putative
AT4G28400 2.3 m 2.00E-21
les.1297.1.s1_at Chitin elicitor kinase 1 CERK1 2.3 h 1.00E-52 les.3539.1.s1_at phosphoenolpyruvate
carboxylase kinase LOC543633 2.1 i-m 2.00E-59
les.5948.1.s1_at MAPKK LeMKK2 2.1 i-m 4.00E-127 les.2855.1.s1_at MAP kinase kinase mek1 2.1 i-m 1.00E-67 les.738.1.s1_at Protein kinase 2B APK2B 2.1 h 9.00E-163 lesaffx.344.7.s1_at CBL-interacting protein
kinase23 CIPK23 2 h 9.00E-36
lesaffx.64831.1.s1_at Serine/threonine protein phosphatase 2A regulatory subunit B', putative
PP2A-AT1G13460
2 h 6.00E-56
lesaffx.58097.1.s1_at protein kinase, putative AT2G07180.1
2 m 9.00E-28
lesaffx.10444.1.s1_at Protein phosphatase 2CA PP2CA -2.3 m 6.00E-38 lesaffx.36086.1.s1_at tyrosine specific protein
phosphatase family protein . -2.7 w 1.00E-22
*Similarity or identity to Arabidopsis: (w) weakly similar; (m) moderately similar; (h) highly
similar; (ni) nearly identical; (i) identical from tomato sequences dataset.
Background colours of fold change values ranged from strong red to green regarding to the
expression level of genes.

Appendices
138
Appendix 3: Expression profile of differentially expressed genes involved in defense
responses in tomato leaves infected by Phytophthora infestans 12 hours post
inoculation. Molecular network analyses have done by Mapman and TFGD (P value
<5%).
Probeset Gene Gene
symbol Fold *ID
(%) E value
ID title change
Les.3575.1.S1_at Pti5 LOC544042
16.7 . 3.00E-23
LesAffx.57572.1.S1_at Patatin-like protein 5 PLP5 13.5 56.4 3.00E-59 LesAffx.62349.1.S1_at NADPH:quinone oxidoreductase NQR 11.6 68.7 7.00E-30 Les.3652.1.S1_at glucan endo-1,3-beta-D-
glucosidase tomQ`b 11.5 . 2.00E-94
Les.3583.1.A1_at TSI-1 protein TSI-1 10 . 6.00E-99 Les.129.1.S1_at divinyl ether synthase LeDES 9.2 . 2.00E-123 Les.37.1.S1_at chitinase LOC54414
6 6.1 . 5.00E-61
LesAffx.1959.1.S1_at Glutathione S-transferase PHI 8 ATGSTF8 6 64.1 1.00E-71 Les.3493.1.S1_at phospholipase PLDb1 PLDb1 5.8 . 0 LesAffx.69659.1.S1_at ATEP3 ATEP 5.6 72.3 1.00E-102 Les.2747.2.S1_at Peroxisomal 3-ketoacyl-COA
thiolase3 PKT3 5.5 83.5 5.00E-48
Les.4999.1.S1_at peroxidase 21 (PER21) (P21) (PRXR5)
AT2G37130
5.5 74.3 6.00E-110
LesAffx.3002.1.S1_at Glutathione S-transferase TAU 8 ATGSTU8 5.4 52.8 6.00E-19 Les.2747.1.S1_at Peroxisomal 3-ketoacyl-COA
thiolase3 PKT3 5.3 83.5 3.00E-11
Les.4924.1.S1_at Peptide transporter 3 PTR3 5.3 73.5 4.00E-223 LesAffx.36712.1.S1_at WRKY53 WRKY53 4.5 52.8 1.00E-54 Les.4496.1.S1_at TSI-1 protein TSI-1 4.5 . 6.00E-06 Les.2832.1.S1_at peroxidase cevi16 4.2 . 3.00E-108 LesAffx.71065.1.S1_at pathogenesis-related family
protein AT1G78780
4.1 53.4 7.00E-22
LesAffx.16424.1.S1_s_at
mitogen-activated protein kinase3
MPK3 4 . 8.00E-24
Les.5077.1.S1_at necrotic spotted lesions 1 NSL1 3.9 63.9 3.00E-213 Les.3140.3.S1_at Peroxisomal 3-ketoacyl-COA
thiolase3 PKT3 3.6 83.5 2.00E-36
Les.3140.2.S1_at Peroxisomal 3-ketoacyl-COA thiolase3
PKT3 3.4 83.5 3.00E-27
Les.131.1.S1_at hypothetical LOC543813 LOC543813
3.4 . 6.00E-63
Les.13.1.S1_at allene oxide synthase aos 3.4 . 3.00E-187 LesAffx.735.1.S1_at WRKY33 WRKY33 3.2 61.8 3.00E-32 Les.4316.1.S1_at mitogen-activated protein
kinase3 MPK3 3.2 . 6.00E-144
Les.178.1.S1_at Polygalacturonase inhibiting protein1
PGIP1 3 67.6 6.00E-53
Les.321.1.S1_at molecular chaperone Hsp90-1 LeHsp90-1 3 . 0 LesAffx.42534.1.S1_at Lipid phosphate phsphatase 3s LPP3 2.9 66.7 2.00E-23 Les.3673.1.S1_at beta-1,3-glucanase LOC54398
6 2.7 . 8.00E-64

Appendices
139
Appendix 3: CONT.
LesAffx.43341.1.S1_at WRKY70 WRKY70 2.5 55.5 1.00E-26 LesAffx.3554.1.A1_at Patatin-like protein4 PLP4 2.5 . 2.00E-43 Les.3632.1.S1_at Lipoxygenase loxD 2.5 . 1.00E-210 Les.122.1.S1_at Chitinase LOC54414
9 2.5 . 4.00E-46
Les.2137.1.S1_at EIX receptor1 Eix1 2.4 . 7.00E-77 Les.123.1.S1_at hypothetical LOC543814 LOC54381
4 2.3 . 3.00E-57
Les.3506.1.S1_at verticillium wilt disease resistance protein Ve2
Ve2 2.2 . 8.00E-103
LesAffx.1959.3.S1_at GSTF7 GSTF7 2.2 64.1 2.00E-10 Les.3769.1.S1_at 1-aminocyclopropane-1-
carboxylate synthase ACS6 2.2 . 5.00E-177
Les.2874.2.S1_a_at signal recognition particle receptor alpha subunit family protein
AT4G30600
2.1 79.5 1.00E-47
LesAffx.50082.1.A1_at Peptide transporter1 PTR1 2.1 74.9 2.00E-81 Les.5948.1.S1_at MAPKK LeMKK2 2.1 . 4.00E-127 Les.2855.1.S1_at MAP kinase kinase mek1 2.1 . 1.00E-67 Les.5060.1.S1_at MAP Kinase4 ATMPK4 2.1 83.1 3.00E-179 LesAffx.9910.1.S1_at WRKY LOC10019
1120 2 . 9.00E-49
LesAffx.69997.2.S1_at . AT2G16230
2 76.2 1.00E-23
LesAffx.46815.2.S1_at DNA-damage repair/toleration100
DRT100 -2 63 4.00E-93
LesAffx.69215.1.S1_at leucine-rich repeat family protein AT3G20820
-2.2 70.6 2.00E-74
Les.5864.1.S1_at 2-oxoglutarate-dependent dioxygenase homolog /// hypothetical LOC544002
GAD2 /// LOC544002
-2.2 . 1.00E-52
LesAffx.14776.1.S1_at MLP-like protein 28 MLP28 -2.2 51.3 4.00E-36 Les.4255.2.S1_at hypothetical protein AT4G2389
0 -2.2 69.5 _
LesAffx.30937.1.S1_at CYP71B9 CYP71B9 -2.4 . 3.00E-14 LesAffx.1959.2.S1_at myb family transcription factor AT1G1900
0 -2.4 63.9 7.00E-29
Les.4139.1.S1_at ethylene response factor 4 ERF4 -2.8 . 7.00E-34 LesAffx.6688.1.S1_at Indole-3-acetate beta-D-
glucosyltransferase IAGLU -3.2 58 6.00E-71
Les.417.1.S1_at gibberellin-regulated family protein
AT5G59845
-3.6 65.2 1E-26
* Similarity or identity to Arabidopsis thaliana given as percentage
Background colours of fold change values ranged from strong red to green regarding to
the expression level of genes.

ACKNOWLEDGEMENTS
First and foremost, great thanks to “Allah” the most merciful and most gracious who
gave me the strength and will to complete this thesis
It is of great honor to acknowledge those who made this accomplishment possible.
I would like to express my sincere appreciation and gratitude to Professor Dr. W.-H.
Dehne. Under his guidance and support making available all facilities for carrying out
this work, I successfully have been able to surpass the many obstacles and different
difficulties and learned a lot about science and techniques. Professor Dr. W.-H. Dehne
thank you for your patience and many thanks for giving me the chance to be one of your
Ph.D students and your help in any problems related to finance affairs will not be
forgotten.
I am very grateful to Prof. Dr. K. Schellander director of the Animal Breeding and
Husbandry group (Institute of Animal Science, University of Bonn), who has been my
second supervisor, and who provides me a unique opportunity to work in his Labs.
I would like to express my deepest gratitude to PD. Dr. U. Steiner for her careful
scientific advice, guidance, and for her daily assistance during the whole period of my
research in Germany. She was always there to listen and to give advice. She shaped my
scientific thinking and writing.
I am extremely grateful to PD. Dr. E.-C. Oerke for his careful scientific advice and the
constructive comments. I am grateful to Dr. Abdelnaser Elashry for his enormous
contribution during analyzing the microarray data. My special thanks go to Dr. Hindorf
for his very early help before my coming to germany and as well to Mrs. I. Sikora, PD.
Dr. J. Hamacher, PD. Dr. A. Schouten and to all colleagues at the Institute of Plant
diseases for their help in one way or another to successfully accomplish this task:
Kerstin, Stefan, Gisela, Inge, Carlos, Constanze, Jürgen, Ellen, Sandra, Katharina,
Alireza, Dr. X. Han, Dr. M. Moradi Ghahderijani, Dr. J. M. Wagacha, Dr. I. Stenzel,
Dr. A. Görtz, Dr. E. Leiritz, and Dr. N. Schlang for their friendship and encouragement.
I appreciate the assistance and help I received from PD. Dr. T. Dawit. Sincere thanks go

to Dr. Dessie S. Wondim for his deep help to achieve one of most difficult assays
during my study. It is my great pleasure to express my special thanks to Dr. A. Y. Gad
for his technical helps in various aspects and for his valuable scientific comments.
Thank to Mr. P. Müller for his useful help in computer assistance and to Dr. N. Ghanem
and Dr. U. M. Cinar for their help and other members of institute of animal breeding
and husbandry group, where I did a part of my research.
With a deep sense of gratitude, I would like to thank all members of my family in Bonn
and in Syria, without their perpetual support and love for me, I would never have
achieved my current position.
Thanks mother for your unflagging love and support throughout my life.
Thanks my husband Yusser for your constant source of encouragement, close guidance,
sustainable advice, and unlimited support during my research work.
Thanks my beloved cute daughter JUDY, you provided an additional and joyful
dimension to my life mission and with her clear love and patience I could do it.
My gratitude goes also to my Syrian scholarship sponsor from the ministry of high
education for financing my study.
Should I forget someone who contributed directly or indirectly to my study and who
supported, helped and encouraged my work that I failed to mention here, I ask for their
excuse and my thanks go to them?

CURRICULUM VITAE
1. Personal information
2. Education
1997 – 2002: Bachelor of Agriculture. Department of Plant Protection, Faculty of
Agriculture, Damascus University, Syria.
2002 – 2003: Diploma of Agriculture. Department of Plants Protection, Faculty of
Agriculture, Damascus University, Syria.
2006 – 2012: Ph.D student. Institute of Crop Science and Resource Conservation.
INRES-Phytomedicine. University of Bonn, Germany.
3. Work experience
2003 – 2004: Work at the General Corporation for Scientific and Agricultural
Researches (GCSAR)-Plants protection section- field researcher.
Meanwhile, I participated in two researches (restricting Nematode of
beans in the middles coastal areas and Fighting Nematode with
Tricoderma Fungi)
Feb – present 2012: Scientific assistant, Agricultural Faculty, INRES-Phytomedicine,
University of Bonn, Germany
4. Training courses
1th October 2004 – 28th May 2005: German course (ZD, B1) at Goethe institute,
Damascus, Syria
April – September 2006: German course (DSH, B2) University of Bonn, Germany.
17th – 20th April 2007: Data analyzing by SPSS software at Hochschulrechenzentrum,
University of Bonn, Germany
3rd December 2008: Diploma of English. Wall Street Institute, Bonn, Germany
4th – 6th December 2009: Learning Intercultural Competence in Windeck-Rosbach by
the Bonn Interdisciplinary Graduate school for Development Research
(BiGS-DR) of ZEF (Center for Development Research, University of
Bonn) funded by DAAD (German Academic Exchange Service).
1th – 4th March 2011: (40 Hours) Active ingredients and plants: uptake, translocation,
and biological responses (BIGS-TB-32) at Theodor Brinkmann Graduate
School, University of Bonn, Germany
28th March – 1th April 2011: “In silico experimentation” (BIGS-TB-45) at Theodor
Brinkmann Graduate School, Agricultural Faculty, University of Bonn,
Germany
5. Abstracts / poster or oral presentation
Muna Sultan, Heinz-Wilhelm Dehne, Ulrike Steiner. "Investigations on the efficacy of
Bacillus spp. strains on suppression of tomato diseases (Untersuchungen
zur Wirksamkeit von Bacillus-Arten gegen Krankheitserreger an
Tomatenpflanzen)." In: 56. Deutsche Pflanzenschutztagung
"Pflanzenproduktion im Wandel - Wandel im Pflanzenschutz?" Kiel,
Germany, 22-25 September, 2008 (Poster).
Muna Sultan, Heinz-Wilhelm Dehne, Ulrike Steiner. The Efficacy of Bacillus
amyloliquefaciens on Late Blight Development and Biomass of
Phytophthora infestans in Tomato Leaf Tissue. In: "Biophysical and
Socio-economic Frame Conditions for the Sustainable Management of
144
Natural Resources" Tropentag, Hamburg, Germany, 6 - 8 October, 2009
(Poster). Journal of Plant Diseases and Protection (2010). 117(2): 80-87.
Muna Sultan, Karl Schellander, Heinz-Wilhelm Dehne, Ulrike Steiner. "Effect of
Bacillus amyloliquefaciens on differential expression of PR1a-mRNA in
tomato leaf tissue infected with Phytophthora infestans." In: 57.
Deutsche Pflanzenschutztagung "Gesunde Pflanze - gesunder Mensch",
Berlin, Germany, 6-9 September 2010 (Poster).
Muna Sultan, Heinz-Wilhelm Dehne, Ulrike Steiner. Histological Studies on the
Efficacy of Bacillus amyloliquefaciens on Early Developmental Stages
of Phytophthora infestans on Tomato Leaves. In: "World Food System -
A Contribution from Europe" Tropentag, Zurich, Germany, 14-16
September, 2010 (Poster).
Muna Sultan, Dessie Salilew Wondim, Dawit Tesfaye, Karl Schellander, Abd El Naser
El Ashry, Florian M. W. Grundler, Heinz-Wilhelm Dehne, Ulrike
Steiner. "Microarray Analysis of Gene Expression Induced by Bacillus
subtilis in Tomato Leaves infected with Phytophthora infestans." In:
"Development on the margin" Tropentag, Bonn, Germany, 5 - 7
October, 2011 (Oral).
Muna Sultan, Abd El Naser El Ashry, Heinz-Wilhelm Dehne, Ulrike Steiner. "Gene
Expression Profile of Tomato Leaves Induced by Phytophthora
infestans" In: Tagung der DPG-Arbeitskreise Mykologie und Wirt-
Parasit-Beziehungen, Stuttgart-Hohenheim, Germany, 22 - 23 March,
2012 (Oral).
6. Conference attendance
25th – 26th March 2010: Tagung der DPG-Arbeitskreise Mycologie und Wirt-Parasit
Beziehungen, Konstanz, Germany
3rd – 5th November 2010: Next Generation Sequencing Symposium, Max Planck
Institute for Plant Breeding Research, Cologne, Germany
24th May 2011: 63rd International Symposium on Crop Protection, Ghent, Belgium


