Environmental Research
of the Federal Ministry for the Environment,
Nature Conservation and Nuclear Safety
UBA Projekt: „Empfindlichkeitsvergleich der
Daphnien- und Fischtoxizität - wann kann auf einen
chronischen Fischtest verzichtet werden?“
Project No. 27448
Comparison of species
sensitivity of Daphnia and fish
in acute and chronic testing
by
Dr. Martin May and Dr. Stefan Hahn
Fraunhofer-Institut für Toxikologie
und Experimentelle Medizin (Fraunhofer ITEM),
Bereich Chemikalienbewertung, Datenbanken und
Expertensysteme,
30625 Hannover
ON BEHALF OF THE
FEDERAL ENVIRONMENT AGENCY
Hannover, 7th May 2014
Comparison of species sensitivity in acute and chronic testing
2
Report Cover Sheet
Report No. UBA-FB 27448
Report Title Comparison of species sensitivity of Daphnia and fish in acute and chronic testing
Author(s)
(Family Name, First Name)
Dr. Martin May
Dr. Stefan Hahn
Performing Organisation
(Name, Address)
Fraunhofer-Institut für Toxikologie und Experimentelle Medizin (FHG-ITEM),
30625 Hannover
Funding Agency
Umweltbundesamt
Postfach 14 06
06813 Dessau-Roßlau
Report Date (Year) 2014
Project No. (FKZ) 27448
No. of Pages 47
Supplementary Notes
Keywords Aquatic toxicity, environmental risk assessment, acute to chronic extrapolation,
species sensitivity
Comparison of species sensitivity in acute and chronic testing
3
Berichtskennblatt
Berichtsnummer UBA-FB 00
Titel des Berichts Vergleich der Sensitivität von Daphnia und Fischen in akuten and chronischen
Studien
Autor(en)
(Name, Vorname)
Dr. Martin May
Dr. Stefan Hahn
Durchführende Institution
(Name, Anschrift)
Fraunhofer-Institut für Toxikologie und Experimentelle Medizin (FHG-ITEM),
30625 Hannover
Fördernde Institution
Umweltbundesamt
Postfach 14 06
06813 Dessau-Roßlau
Abschlussjahr 2014
Forschungskennzahl (FKZ) 27448
Seitenzahl des Berichts 47
Zusätzliche Angaben
Schlagwörter Aquatische Toxizität, Umweltrisikobewertung, “acute to chronic extrapolation”,
Speziessensitivität
Comparison of species sensitivity in acute and chronic testing
4
Abstract
Based on the animal welfare concept (Art. 13, Art. 25), the REACh Regulation (EC 1907/2006)
provides several options to avoid the long term fish toxicity test. About 240 substances from the
ECHA and ICS database including 73 pesticides are analysed for species sensitivity differences
and acute to chronic ratios to evaluate whether and when chronic fish toxicity tests can be
avoided without underestimating environmental risk. Only studies that have been conducted in
line with guidelines recommended in the EU guidance documents are used for this study.
Sensitivity comparison of fish and Daphnia toxicity indicates that none of both trophic levels is
generally more sensitive in acute or long term testing. Based on the finding that the sensitivity
in chronic testing is associated with sensitivity in acute testing a classification scheme for acute
sensitivity comparison was proposed to contribute the integrated testing strategy. The
categorization system can be applied independently of the physicochemical properties water
solubility and octanol-water partitioning. Based on the data evaluation the chronic fish test is
required for about 13 % of the substances. For substances being 5x more sensitive to one
trophic level long term testing of the respective trophic level should be conducted.
Additionally, the results show that an assessment factor of 100 for acute to chronic
extrapolation, as implied by the European guidance documents, is protective for >90 % of the
industrial chemicals. Moreover, a relation between Kow and increased ACR values and species
sensitivity can not be confirmed suggesting that the Kow does not represent a determinant
indicating the requirement of chronic fish testing. Identification of chemical structures that are
associated with significantly increased potential for a high ACR or fish sensitivity in chronic
testing leads to the derivation of structural alerts.
Kurzbeschreibung
Auf der Grundlage des Tierschutzgedankens (Art. 13, Art.25) bietet die REACh-Verordnung (EG
1907/2006) verschiedene Optionen, um auf den chronischen Fischtest für die Umweltrisiko-
bewertung zu verzichten. Über 240 Stoffe aus der ECHA und ICS-Datenbank, darunter 73
Pflanzenschutzmittel, werden in dieser Studie auf die Speziesempfindlichkeit und das
Verhältnis zwischen akuten zu chronischen Effektwerten ausgewertet, um zu untersuchen
unter welchen Bedingungen auf den chronischen Fischtest verzichtet werden kann. Für die
Studie werden ausschließlich Studien verwendet, die entsprechend den Leitlinien der EU
empfohlen werden. Der Empfindlichkeitsvergleich von Fischen und Daphnia zeigt, dass keine
der beiden trophischen Ebenen in akuten oder langfristigen Tests systematischer empfindlicher
ist als die andere. Die Ergebnisse deuten darauf hin, dass die Empfindlichkeit einer
Trophieebene in chronischen Tests mit der Empfindlichkeit in den akuten Tests verknüpft ist.
Für die integrierte Teststrategie wird daher ein Klassifikationsschema für den
Empfindlichkeitsvergleich akuter Daten vorgeschlagen, welches unabhängig von den
physikalisch-chemischen Eigenschaften Wasserlöslichkeit und Oktanol-Wasser Verteilung
angewendet werden kann. Basierend auf den Daten dieser Studie ist der chronische Fischtest in
etwa 13 % der Fälle notwendig und in erster Linie angezeigt für Substanzen, die im akuten Test
>5x toxische gegenüber dem Fish als Daphnien sind. Weiterhin kann gezeigt werden, dass ein
Extrapolationsfaktor von 100, wie er in der Europäischen Union für die Extrapolation der
chronischen Toxizität aus Daten von Kurzzeitstudien verwendet wird, für >95 % der
Chemikalien hinreichend protektiv ist. Darüber hinaus kann kein Zusammenhang zwischen
dem Kow Wert als Determinate und einem erhöhten ACR-Wert sowie einer bestimmten
Speziessensitivität bestätigt werden. Die Identifikation von chemischen Strukturen mit deutlich
erhöhtem Potenzial für einen hohen ACR oder einer stark ausgeprägten Sensitivität von
Fischen resultiert in der Ableitung von „structural alerts“.
Comparison of species sensitivity in acute and chronic testing
5
Table of Content
List of Figures ........................................................................................................................................... 7
List of Tables ............................................................................................................................................ 8
List of Abbreviations ............................................................................................................................... 9
Summary ................................................................................................................................................10
Zusammenfassung ................................................................................................................................12
2 Introduction ...................................................................................................................................14
3 Objectives .......................................................................................................................................16
4 Materials and Methods .................................................................................................................17
5 Results and Discussion ..................................................................................................................19
5.1 Correlation of acute and chronic effect values within one trophic level .......................19
5.2 Acute to chronic ratios (ACR) ...............................................................................................20
5.3 Sensitivity between Daphnia and fish .................................................................................21
5.3.1 Evaluation of the Sensitivity between Daphnia and fish .............................................21
5.3.2 Acute sensitivity classification (ASC) ..............................................................................23
5.3.3 Considerations for the categorization limits ................................................................28
5.4 Evaluation of the applicability of the categorisation system for pesticides ...................31
5.5 Octanol-water partitioning coefficient ................................................................................34
5.5.1 Relationship between species sensitivity and Kow ......................................................34
5.5.2 Correlation of ACR and octanol-water partitioning coefficient .................................39
5.6 Poor water solubility .............................................................................................................42
5.6.1 Relationship between species sensitivity and poor water solubility ..........................42
5.6.2 Correlation of ACR and poor water solubility ..............................................................42
5.7 Quality criteria of fish chronic testing ................................................................................43
5.8 Relationship between acute toxicity and ACR ...................................................................47
5.9 Relationship of effect levels between trophic levels in chronic testing..........................48
5.10 Toxicity levels of chemicals and pesticides ........................................................................49
5.11 Structural alerts ......................................................................................................................50
5.12 Risk estimation for exemplarily substances .......................................................................53
6 Conclusion .....................................................................................................................................55
6.1 ACR evaluation ......................................................................................................................55
6.2 Sensitivity comparison ..........................................................................................................56
6.3 Refinement of assessment factors based on acute sensitivity comparison ....................57
6.4 Adaptation of sensitivity distinction as applied in the REACh guidance 7b .................59
6.5 Physicochemical properties as determinants for the testing strategy ............................60
Comparison of species sensitivity in acute and chronic testing
6
6.6 Structural alerts and QSAR modeling .................................................................................61
6.7 Data quality of fish tests .......................................................................................................62
6.8 Outlook ...................................................................................................................................63
7 References ......................................................................................................................................64
Comparison of species sensitivity in acute and chronic testing
7
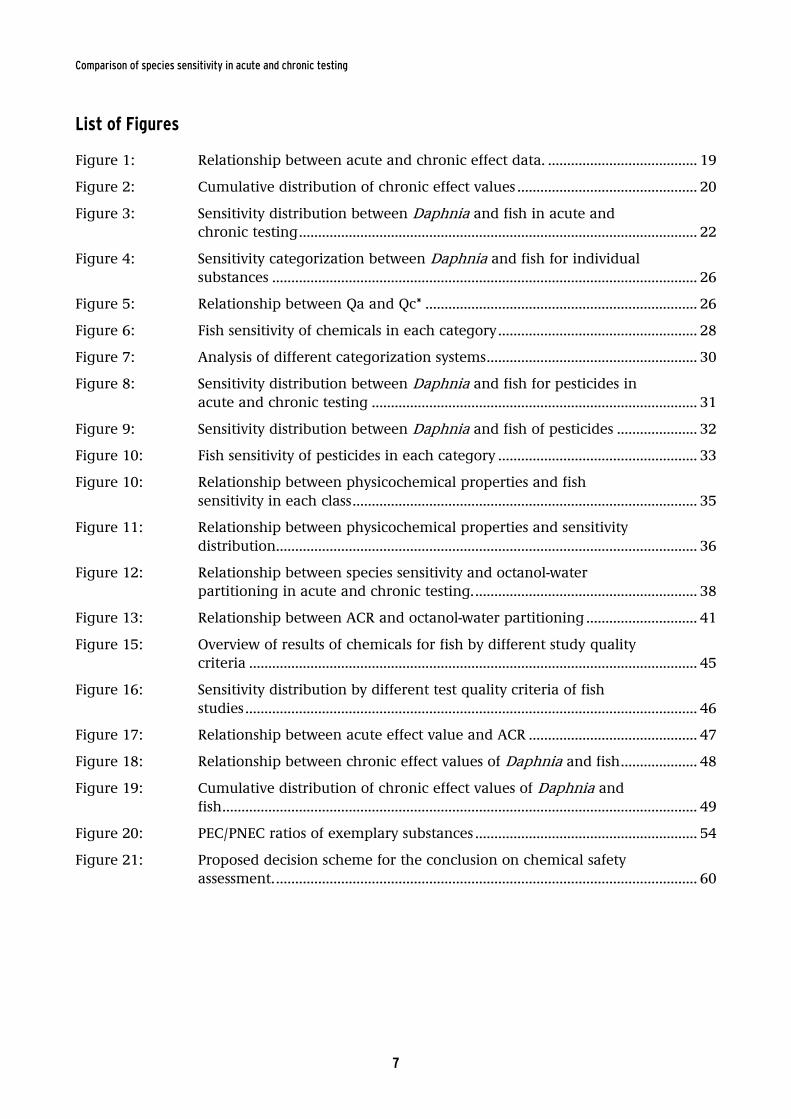
List of Figures
Figure 1: Relationship between acute and chronic effect data. ....................................... 19
Figure 2: Cumulative distribution of chronic effect values ............................................... 20
Figure 3: Sensitivity distribution between Daphnia and fish in acute and
chronic testing ........................................................................................................ 22
Figure 4: Sensitivity categorization between Daphnia and fish for individual
substances ............................................................................................................... 26
Figure 5: Relationship between Qa and Qc* ....................................................................... 26
Figure 6: Fish sensitivity of chemicals in each category .................................................... 28
Figure 7: Analysis of different categorization systems ....................................................... 30
Figure 8: Sensitivity distribution between Daphnia and fish for pesticides in
acute and chronic testing ..................................................................................... 31
Figure 9: Sensitivity distribution between Daphnia and fish of pesticides ..................... 32
Figure 10: Fish sensitivity of pesticides in each category .................................................... 33
Figure 10: Relationship between physicochemical properties and fish
sensitivity in each class .......................................................................................... 35
Figure 11: Relationship between physicochemical properties and sensitivity
distribution.............................................................................................................. 36
Figure 12: Relationship between species sensitivity and octanol-water
partitioning in acute and chronic testing. .......................................................... 38
Figure 13: Relationship between ACR and octanol-water partitioning ............................. 41
Figure 15: Overview of results of chemicals for fish by different study quality
criteria ..................................................................................................................... 45
Figure 16: Sensitivity distribution by different test quality criteria of fish
studies ...................................................................................................................... 46
Figure 17: Relationship between acute effect value and ACR ............................................ 47
Figure 18: Relationship between chronic effect values of Daphnia and fish .................... 48
Figure 19: Cumulative distribution of chronic effect values of Daphnia and
fish ............................................................................................................................ 49
Figure 20: PEC/PNEC ratios of exemplary substances .......................................................... 54
Figure 21: Proposed decision scheme for the conclusion on chemical safety
assessment. .............................................................................................................. 60
Comparison of species sensitivity in acute and chronic testing
8
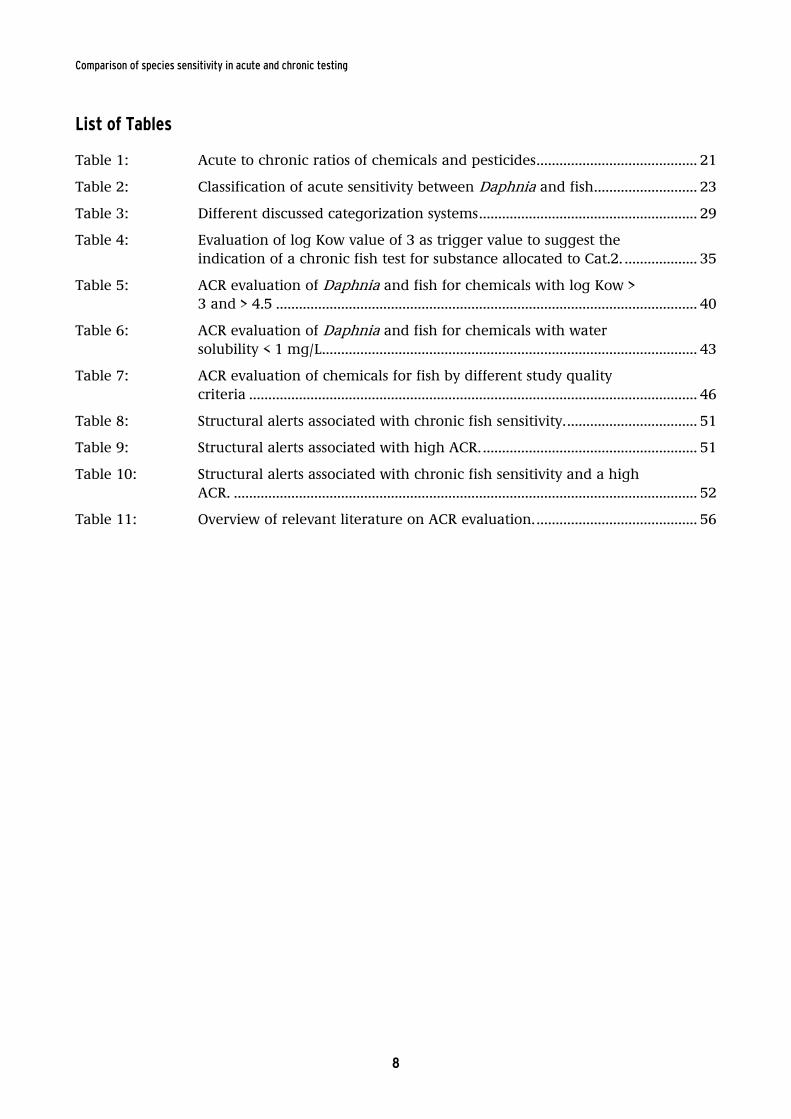
List of Tables
Table 1: Acute to chronic ratios of chemicals and pesticides .......................................... 21
Table 2: Classification of acute sensitivity between Daphnia and fish ........................... 23
Table 3: Different discussed categorization systems ......................................................... 29
Table 4: Evaluation of log Kow value of 3 as trigger value to suggest the
indication of a chronic fish test for substance allocated to Cat.2. ................... 35
Table 5: ACR evaluation of Daphnia and fish for chemicals with log Kow >
3 and > 4.5 .............................................................................................................. 40
Table 6: ACR evaluation of Daphnia and fish for chemicals with water
solubility < 1 mg/L .................................................................................................. 43
Table 7: ACR evaluation of chemicals for fish by different study quality
criteria ..................................................................................................................... 46
Table 8: Structural alerts associated with chronic fish sensitivity. .................................. 51
Table 9: Structural alerts associated with high ACR. ........................................................ 51
Table 10: Structural alerts associated with chronic fish sensitivity and a high
ACR. ......................................................................................................................... 52
Table 11: Overview of relevant literature on ACR evaluation. .......................................... 56
Comparison of species sensitivity in acute and chronic testing
9
List of Abbreviations
ACR = Acute to Chronic Ratio
AF = Assessment Factor
CESAR = Canada's Existing Substances Assessment Repository
EC = Effect Concentration
ECHA = European Chemicals Agency
EU = European Union
FELS = fish early life stage
ICS = Information System Chemical Safety database
Kow= partition coefficient (1-octanol/water)
LC = Lethal Concentration
MoA = Mode of action
NOEC = No Observed Effect Concentration
OECD = Organisation for Economic Co-operation and Development
PEC = Predicted Environmental Concentration
PNEC = Predicted No Effect Concentration
Qa = LC50 (fish, acute) / EC50 (Daphnia, acute)
Qc = NOEC (fish, chronic) / NOEC (Daphnia, chronic)
Qc* = 5 x NOEC (fish, chronic) / NOEC (Daphnia, chronic)
QSAR = Quantitative structure–activity relationship
REACh = Registration, Evaluation, Authorisation and Restriction of Chemicals (European Union
Regulation)
SIDS = Screening Information Data Set
TTC = Threshold of Toxicological Concern
US EPA = US Environmental Protection Agency
Comparison of species sensitivity in acute and chronic testing
10
Summary
Based on the animal welfare concept and to avoid animal experiments (Art. 13, Art. 25), the
REACh Regulation (EC 1907/2006) provides several options for waiving the chronic fish toxicity
test. The present study addresses the question whether the integrated testing strategy (ITS)
approach is adequate and applicable for environmental risk assessment regarding the need of
long term vertebrate testing. In particular, it is evaluated whether and when chronic fish
toxicity can be extrapolated from acute data or from other trophic levels.
The dataset is based on data from the OECD eChemPortal and from the Information System
Chemical Safety database (ICS) of the German Federal Environmental Agency. In total about
240 compounds are considered including 169 industrial chemicals and 73 pesticides. The
majority represents organic substances that are underlaid by an FELS test. Animal testing can
be avoided for the majority of chemical substances since chronic Daphnia and fish toxicity
levels are related to each other, and fish toxicity can be estimated to a certain degree from
chronic Daphnia test results. Based on this data evaluation the chronic fish toxicity test is
required for about 13 % of the substances for risk estimation and can not be estimated from
chronic Daphnia data in a protective manner in these cases.
The statistical findings of the sensitivity comparison of Daphnia and fish shows in average a
rather similar sensitivity between fish and invertebrate toxicity in acute and chronic testing
with Daphnia being slightly more sensitive than fish. The study further shows that the more
sensitive trophic level in chronic testing is associated with its sensitivity in acute testing. Thus,
chronic species sensitivity could be estimated from acute testing. To estimate chronic test
requirements the study proposes a classification system for an acute sensitivity ratio to support
the ITS. The result suggests that the classification system can be applied independent of
physicochemical properties. Since chronic testing strategies are usually based on an initial
evaluation of acute data the here presented classification scheme may contribute to a
scientifically justified testing strategy. For substances being 5x more sensitive to one trophic
level in acute testing long term testing of the respective trophic level is required. A chronic fish
toxicity test should usually not be requested unless fish are 2x more sensitive than Daphnia in
acute testing. The presented categorization scheme differs from the current guidance
documents which consider a threshold of 10 for sensitivity distinction between trophic levels
(ECHA, 2012). Only 10 % of the evaluated substances were 10x more sensitive towards one
trophic level. Quantitative sensitivity analysis of chronic testing further shows that the chronic
Daphnia test is considered sufficiently protective for more than 85 % of the analysed
substances. Fish toxicity can be adequately evaluated from chronic Daphnia test for substances
that are comparable or more toxic to Daphnia in acute testing. By contrast, the chronic fish test
is already required for substances being 5x more sensitive to fish than to Daphnia. In this case,
extrapolation from chronic invertebrate data is not adequate and a threshold of 10 might
underestimate chronic fish sensitivity. Thus, adaption of the current ITS is suggested by this
data analysis proposing a reduction of the sensitivity factor from 10 to 5.
Analysis of acute to chronic ratios is an important tool to derive acceptable No-Effect levels and
to re-evaluate and support current risk assessment approaches. This analysis evaluates ACRs
from different trophic levels of a comprehensive data set in the context of an individual
substance. The evaluation of existing data on Daphnia and fish toxicity testing shows that acute
to chronic extrapolation represents a sound approach for environmental risk estimation. For
chemicals median ACRs of 12.2 for fish and 8.8 for Daphnia as well as 90 percentiles of 68.0
and 50.2 were determined. The ACR for the most sensitive aquatic species (ACRaqu) is derived
by comparing the lowest acute and chronic effect value. The median was determined to 9.9
Comparison of species sensitivity in acute and chronic testing
11
and the 90 %-percentile was 58.5. Based on these data an ACR of 100 as implied by the
European guidance documents is protective for more than 90 % of the substance regarding
Daphnia and fish toxicity of industrial chemicals. In addition an AF of 1000 applied on the
lowest acute effect level of three trophic levels was not exceeded in any case. Subsequently,
chronic data usually improves or knowledge on toxicity levels and contributes to a refinement
of the PNEC. In contrast the current extrapolation approach is not protective for pesticides
since pesticides exhibit median ACRs of 17.2 for fish and 11.1 for Daphnia and 90 percentiles of
154.2 and 109.4, respectively.
The physicochemical properties water solubility and the octanol-water partitioning are
mentioned in the REACh Regulation and the corresponding guidance documents as
determinants that indicate the need of chronic data or the requirement of a chronic fish
toxicity test for risk assessment. The results of this study indicated that a predictive value on the
need for chronic test can not be proven for both properties since the chronic fish toxicity test is
only required for <20% of the substances with a log Kow > 3 and for <10% of the substances
with a poor water solubility. The results rather show that both acute to chronic extrapolation
and species sensitivity of a substance can be assessed independently of the water solubility and
Kow. The results suggest that both the chronic toxicity level as well as species sensitivity can be
adequately derived from the effect values of acute toxicity testing. A differentiated analysis for
substances only shows that a high Kow may be a trigger for a chronic fish toxicity test if fish
were 2x to 5x more sensitive than Daphnia in the acute tests. Thus, the physicochemical
properties water solubility and the octanol-water partitioning have a supporting character if
certain conditions are met, but do not seem to be good indicators for the requirement of long
term or vertebrate tests as implemented in the REACh Regulation and the corresponding
guidance documents.
For a number of substances that exhibit an increased sensitivity to fish in chronic testing a
structural relationship is determined. For example, para-substituted phenols represent a group
of substances that is identified with an increased probability of a pronounced toxic effect to fish
in the chronic test. Thus, analysis of structural alerts in the context of the ITS could provide an
opportunity to evaluate the need of chronic fish toxicity tests and to determine exceptions from
the applied approach. However, it has to be taken into account that the ratio of false positive
results by structural alert analysis can be quite high and that a majority of identified "structural
alert" already show an increased sensitivity towards fish in acute testing.
Comparison of species sensitivity in acute and chronic testing
12
Zusammenfassung
Auf der Grundlage des Tierschutzgedankens (Art. 13, Art.25) bietet die REACh-Verordnung (EG
1907/2006), verschiedene Optionen, um auf den chronischen Fischtest zu verzichten. Die
vorliegende Studie befasst sich mit der Frage, ob die ITS zutreffend und ausreichend für die
Umweltrisikobewertung in Bezug auf die Notwendigkeit von chronischen Wirbeltierversuchen
ist. Für die Analyse wird ein Datensatz von 240 chemischen Substanzen der sowohl
Industriechemikalien als auch Pflanzenschutzmittel umfasst, in Bezug auf die
Speziesempfindlichkeit und das Verhältnis zwischen akuten zu chronischen Effektwerten
ausgewertet, um zu untersuchen unter welchen Bedingungen auf den chronischen Fischtest
verzichtet werden kann. Der Datensatz basiert auf Daten des OECD eChemPortal
Informationssystems und des Informationssystems Chemikaliensicherheit (ICS) des
Umweltbundesamtes und umfasst in zum Grossteil Datensätze von organischen Substanzen bei
denen die chronische Fischtoxizität mittels des FELS test untersucht wurde. Die Ergebnisse
zeigen, dass Tierversuche für die meisten chemischen Substanzen vermieden werden können,
da die chronische Daphnia- und Fischtoxizität in Beziehung zu einander stehen. Somit kann die
Fischtoxizität bis zu einem gewissen Grad anhand des chronischen Daphnien-Testergebnisse
abgeschätzt bzw mittels eines angemessenen Sicherheitsfaktors abgedeckt werden. Basierend
auf den Daten dieser Studie und unter Einbezeihung eines AF von 50 auf den chronischen
Daphnientest ist ein chronischer Fischtest für etwa 13% der analysierten Substanz für die
Risikoabschätzung erforderlich. Dies gilt insbesondere für Substanzen die bereits im akuten
Test eine hohe Sensitivität für Fische zeigen.
Die statistische Auswertung des Empfindlichkeitsvergleich von Fischen und Daphnia zeigt, dass
im Durschnitt keine der beiden trophischen Ebenen in akuten oder langfristigen Tests
empfindlicher ist als die andere. Die Studie zeigt weiterhin, dass die Speziessensitivität in
chronischen Tests mit der Sensitivität in akuten Tests verbunden ist und die Empfindlichkeit
einer Art im chronischen Test aus den Ergebnissen der akuten Tests abgeschätzt werden kann.
Im Rahmen des Projekts wird ein Klassifizierungssystem für den Vergleich der akuten
Empfindlichkeit von Fischen und Daphnien vorgestellt, um die Testanforderungen an
chronischen Studien abzuschätzen. Das Klassifikationssystem kann unabhängig von
physikalisch-chemischen Eigenschaften und außerdem für Stoffe, die einen spezifischen
Wirkungsmechanismus durch die Interaktion mit bestimmten Rezeptormolekülen (MoA4)
aufweisen, angewendet werden. Da die Teststrategie in der Regel auf einer Auswertung der
akuten Daten basiert, bietet das hier vorgestellte Klassifikationsschema einen empirisch
begründeten Ansatz für die integrierte Teststrategie und die Abschätzung der Notwendigkeit
von chronischen Fischtests für die Risikobewertung. Die quantitative Sensitivitätsanalyse der
chronischen Tests zeigt weiterhin, dass der chronische Daphnia Test unter Einbezeihung eines
AF von 50 als ausreichend protektive für mehr als 85% der untersuchten Substanzen angesehen
werden kann. Entsprechend der statistischen Ergebnisse sollte ein chronischer Fischtest in der
Regel nicht gefordert werden, insofern Fische im akuten Test nicht 2-fach empfindlicher sind
als Daphnien. Im Gegensatz dazu ist der chronische Fischtest schon für Substanzen erforderlich,
die 5-fach empfindlicher gegenüber Fischen als Daphnien sind. In diesem Fall ist der
Extrapolation von Daten aus chronischen Invertebraten-Tests nicht ausreichend protektiv. Das
vorgeschlagene Klassifizierungsschema unterscheidet sich von den aktuellen Europäischen
Leitlinien, die eine Schwelle von 10 für die Empfindlichkeit zwischen trophischen Ebenen
(ECHA, 2012) berücksichtigen. Auf Basis diese Datenanalyse wird gezeigt, dass bereits bei einem
Sensitivitätsunterschied von >5x die Testung des sensitiveren trophischen Levels notwendig ist.
Daher wird eine Überprüfung des aktuellen Schwellenwerts für den Empfindlichkeitsvergleich
vorgeschlagen und eine Verringerung des Faktors von 10 auf 5 empfohlen.
Comparison of species sensitivity in acute and chronic testing
13
Die Analyse des „acute to chronic ratios“ (ACR) ist ein wichtiges Instrument, um No-Effect
Konzentrationen (NOEC) abzuleiten. Diese Studie untersucht ACR von verschiedenen
trophischen Ebenen und für die jeweils sensitivsten Arten in akuten und chronischen Test
(ACRaqu). Die Auswertung der vorhandenen Toxizitätsdaten für Daphnien und Fische zeigt,
dass die Ableitung der chronischen Toxizität durch Extrapolation des akuten Effektwerts einen
robusten Ansatz für die Umweltrisikoabschätzung darstellt. Für Industriechemikalien wird ein
Median des „acute to chronic ratio“ (ACR) von 12,2 für Fische und 8,8 für Daphnia sowie eine
90. Perzentile von 68,0 und 50,2 ermittelt. Der ACR für die empfindlichsten aquatischen Arten
(ACRaqu) wird durch den Vergleich des niedrigsten akuten und chronischen Effektwerts
abgeleitet. Der Median ACRaqu ergibt einen Wert von 9,9 und eine 90. Perzentile von 58,5.
Somit ist ein Extrapolationsfaktor von 100, wie er in der Europäischen Union verwendet wird,
für mehr als 90 % der Chemikalien für Daphnia und Fische hinreichend protektiv. Außerdem
wird ein Extrapolationsfaktor von 1000 der auf den niedrigsten akuten Effektwert aller drei
trophischen Ebenen angewendet wird in keinem Fall für den ACRaqu überschritten. Hingegen
kann der gegenwärtige Extrapolationsansatz als nicht hinreichend protektive für die
Bewertung von Pflanzenschutzmittel angesehen werden, die einen Median ACR von 17,2 für
Fische und 11,1 für Daphnia und eine 90. Perzentile von 154,2 und 109,4 aufweisen.
Die physikalisch-chemischen Eigenschaft Wasserlöslichkeit und der Oktanol-Wasser-
Verteilungskoeffizienten werden in der REACh Verordnung und den entsprechend Leitfäden
mehrmals als Determinanten genannt, die auf die Erfordernis von chronischen Daten oder die
Notwendigkeit eines chronischen Fischtest für die Risikobewertung hinweisen. Die Ergebnisse
dieser Studie zeigen, dass ein Einfluss beider Eigenschaften auf die Vorhersage der
Notwendigkeit von chronischen Fischtests nicht vorhanden ist, da ein chronischer Fischtest nur
in <20 % der Substanzen mit einem Kow >3 und in <10 % der schlecht wasserlöslichen
Substanzen notwendig ist. Weiterhin zeigen die Daten, dass auch die Höhe des ACR
unabhängig von der Wasserlöslichkeit und des Oktanol-Wasser-Verteilungskoeffizienten einer
Substanz ist und somit bei hohen log Kow oder geringer Wasserlöslichkeit die
Wahrscheinlichkeit für einen relevant erhöhten ACR nicht gegeben ist. Eine differenzierte
Analyse für Stoffe, die 2 bis 5x sensitiver gegenüber dem Fisch verglichen zur Daphnien
sind,zeigt lediglich, dass ein hoher Kow ein Indikator für eine Notwendigkeit eines chronischen
Fischtoxizitätstests darstellen kann, insofern Fische bereits in akuten Tests Fische 2x bis 5x
empfindlicher als Daphnia waren. Daher spielen die physikalisch-chemischen Eigenschaft
Wasserlöslichkeit und der Oktanol-Wasser-Verteilungskoeffizienten eher eine untergeordnete
Rolle bei der Abschätzung von chronischen Testanforderungen und sollten nicht, wie im
Moment in den „Guidance documents“ der EU verankert, als generelle Determinanten
verwendet werden, die allgemeingültig und unabhängig die Notwendigkeit chronischer Tests
anzeigen. Für eine Reihe von Substanzen die eine erhöhte Sensitivität von Fischen im
chronischen Test aufweisen, kann eine strukturelle Ähnlichkeit gezeigt werden. So stellen
beispielsweise para-substituierte Phenole eine Stoffgruppe dar, die eine erhöhte
Wahrscheinlichkeit für eine ausgeprägte toxische Wirkung im chronischen Fischtest zeigen.
Somit könnte die Analyse von „structural alerts“ im Rahmen der integrierten Teststrategie eine
Möglichkeit bieten, um die Notwendigkeit von chronischen Fischtests abzuschätzen und um
Ausnahmen von der angewandten Methode zu erkennen. Allerdings bleibt zu berücksichtigen,
dass der Anteil an falsch positiven Ergebnissen recht hoch sein kann und, dass die Mehrzahl
der identifizierten „structural alerts“ bereits im akuten Test eine erhöhte Sensitivität gegenüber
Fischen zeigt.
Comparison of species sensitivity in acute and chronic testing
14
2 Introduction
With the registration of chemicals under the REACh Regulation (EC 1907/2006) manufacturers,
importers and downstream users take responsibility for the safe use of their chemicals. The
information required for registration depends on the produced or imported quantity of the
chemical. Depending on the tonnage column 1 of Annexes VII to X of the REACh Regulation
defines each of the experimental data requirements (physico-chemical, toxicological and
ecotoxicological studies) that must be supplied by the registrant. Column 2 of the respective
Annexes states the options for possible deviations from the standard testing regime (EU, 2006).
The basic idea to allow those deviations is the intention of the REACh Regulation, to avoid
animal/ vertebrate testing as far as possible and to use non-animal test methods. In Article 25
the study of vertebrates is only considered as a last resort in the data collection and Article 13
suggests other methods such as QSAR and read across approaches. The applicability of the
deviations that are intended to reduce the number of (animal) tests is carefully examined on
the basis of the criteria set out in Annex XI. Data waiving or a selected alternative study needs
to be fully/explicitly and transparently justified (EU, 2006).
For the decision on the need of ecotoxicological tests on animals ECHA guideline R7b and R10
are applied (ECHA, 2008; ECHA, 2012). In particular guideline R7b provides guidance for the
assessment of ecotoxicological endpoints and includes an integrated testing strategy (ITS).
Initially, aquatic short term studies on three different trophic levels (algae, invertebrates and
fish) are the basis for the ecotoxicological evaluation of a chemical. Depending on the tonnage,
as well as substance properties and effect data, further studies may be necessary to refine the
risk assessment. These additional studies may comprise long term/chronic studies on
invertebrates or fish. On the basis of the animal welfare concept and to avoid animal
experiments (Art. 13, Art. 25), the ITS provides several options for waiving the chronic fish
toxicity test. According to the usual procedure conducted by the ECHA a chronic fish toxicity
test is basically required for substances with a tonnage >100 t/a, or if fish is likely to be at least
a factor of about 10 less sensitive than other trophic levels or if a risk is identified by using the
PEC / PNEC ratio based on the result of the chronic Daphnia test (ECHA, 2012). Additionally,
QSAR, read across and other studies should be taken into account for decision making.
An environmental risk assessment of chemical substances (industrial chemicals, biocides,
pesticides, pharmaceuticals) is based on the comparison of the Predicted No effect
Concentration (PNEC) and the predicted environmental concentration (PEC). The PNEC
represents a concentration below which unacceptable effects are not expected and is usually
derived from laboratory effect studies by applying an assessment factor on the lowest
determined effect concentration or the No Observed Effect Concentration. The size of an
assessment factor should cover several uncertainties such as intra- and interspecies variations,
short- to long-term toxicity extrapolation and intra- and inter-laboratory variation. Moreover,
some chemicals may show different modes of action (MOAs) under short- and long-term
conditions. According to European guidance documents an assessment factor of 1000 is applied
on the lowest effect value for acute testing from the three trophic levels of algae, invertebrates
and fish if only data from acute testing is available. This factor can be refined to 100, 50, or 10
if the values of No Observed Effect Concentrations (NOEC) are available from long-term tests
covering one, two, or three trophic levels, respectively (ref)(EC, 1996; ECHA, 2008). Although
not explicitly mentioned the procedure implies an acute to chronic extrapolation factor of 100
based on the difference of the assessment factor from acute and chronic testing of three
trophic levels. This approach includes first extrapolation from the EC50 to the NOEC and
Comparison of species sensitivity in acute and chronic testing
15
second extrapolation from short term to long term exposure (EC, 1996; ECHA, 2008; ECHA,
2012).
Extrapolation from acute effect values to chronic toxicity on the basis of publicly available data
has already been analysed previously by several studies (Ahlers et al., 2006; ECETOC, 2003;
Heger et al., 1995; Lange et al., 1998; Mayer et al., 1994; Raimondo et al., 2007; Roex et al.,
2000). However, previous studies usually derived ACR for single trophic level, but chemical
substances have not been evaluated in the context of existing data from all relevant trophic
levels as demanded by the current risk assessment approaches in the EU and the US.
Furthermore, the data basis compiling experimental data for ACR extrapolation was limited in
these publications and the reliability of some literature data could not be tracked. Moreover, a
lot of data refer to chemicals with a high toxicity or a specific mode of action such as pesticides
and metals, and usually ACRs of different trophic levels for the same substance were not
compared. Especially, experimental data on chronic fish toxicity is still limited and an
increased variability in ACR is expected as fish studies cover different species, exposure times
and endpoints. For invertebrates in particular Daphnia magna is established as standard test
organism and meanwhile exposure time and endpoints are standardized for acute and chronic
testing in the official test guidelines. An ACR for algae represents the difference between the
EC50 and the chronic effect value, either the NOEC or the EC10 from the same study.
Therefore, the lowest ACR compared to the other trophic levels is usually found for algae
(Ahlers et al., 2006). The most recent studies on ACRs determined average ACR values of about
10 for fish and 8 for Daphnia (Ahlers et al., 2006; Raimondo et al., 2007) being in general
agreement with the current extrapolation approaches in the EU and the US (ECHA, 2008;
Zeemann, 1995).
Comparison of species sensitivity in acute and chronic testing
16
3 Objectives
With regard to the limited data of chronic fish toxicity tests and the waiving options for
chronic fish toxicity testing; conclusions on aquatic risk estimation need to be evaluated and
the question arises whether the chronic toxicity of fish can be adequately derived from acute
data or from other trophic levels to avoid animal testing. In particular species specific
mechanisms of long term toxicity such as effects on developmental stages of fish cannot be
covered by acute tests on fish or by chronic studies on invertebrate or algae. The aim of this
study was to investigate the ACR of Daphnia and fish studies for each compound and to analyse
the currently proposed hazard evaluation according to the ITS on the basis of already existing
toxicity tests. Based on species sensitivity comparison the results of the data analysis provide
information on whether and when chronic fish toxicity tests can be avoided without
underestimating environmental hazards. Furthermore, the physicochemical properties
solubility in water and octanol-water partitioning and their predictive value for the risk
assessment for the aquatic environment are analysed.
Comparison of species sensitivity in acute and chronic testing
17
4 Materials and Methods
Data sources and data collection
Data were obtained by using the OECD eChemPortal and the Information System Chemical
Safety database (ICS) of the German Federal Environmental Agency. The OECD eChemPortal
database accesses a multitude of participating data sources, such as the ECHA data base of
registered substances, EPA data sets or Canada’s Existing Substances Assessment Repository
(CESAR), as well as the OECD SIDS. The OECD eChemPortal further allows a variety of search
options by which the aim of this study could be purposefully processed. Database analysis was
conducted in July 2013. The dataset was retrieved by the OECD eChemPortal and throughout
based on the ECHA database. Data entries in the ECHA database were generated for the
chemical registration under REACh by the registrant. Data from the ECHA database is provided
by the registrants is confidential and thus the primary data source could not be evaluated.
Additionally, data was extracted from the ICS database comprising dataset of pesticide and new
registered chemicals. Data of the ICS database were peer reviewed by the German authority.
Only substance entries with acute and chronic studies on both Daphnia and fish were
considered. Selection of data is based on studies that were conducted according to the
recommended guidelines in the EU, and thus met comparable test conditions. Selection criteria
for comparison were conformity in species, endpoints investigated and test duration as well as
a documentation of the concentrations.
Specification of fish data
Short term fish toxicity was ascertained from the 96 h LC50 of tests performed according to
OECD 203 or comparable design (OECD, 1992a). For long term tests on fish the Fish early-life
stage test (FELS) according or equivalent to OECD 210 was considered (OECD, 1992b).
Equivalent studies comprise tests conducted according to the EPA guideline OPPTS 850.1400
and EPA OPP 72-4. In addition, OECD 212 (Fish toxicity test on embryo and sac-fry stages as well
as OECD 215 (Fish juvenile growth test were considered to evaluate the chronic toxicity (OECD,
1998b; OECD, 2000). Non-guideline studies were considered only if a well-documented study
comprised early life stage, juvenile growth or embryo or sac fry stages. Furthermore, substance
concentrations should have been verified or at least in one test it should be documented that
the measured concentration corresponds to the nominal concentration and that the substance
is stable under the test condition. Read across and studies on adult fish according to OECD 204
were not considered (OECD, 1984). If more than one study was documented for an endpoint
the lowest effect concentration was considered, in general, as this is usually relevant for risk
assessment. Fish studies were primarily conducted on the recommended freshwater species
Pimephales promelas, Danio rerio, Oncorhynchus mykiss and Oryzias latipes and in particular
case on others such as Jordanella floridae or Cyprinus carpio.
Specification of Daphnia data
For short term test on invertebrates studies conducted according or equivalent to the OECD
Guideline 202 (Daphnia acute test) using the 48 h EC50 value were considered (OECD, 2004).
Chronic Daphnia tests according or equivalent to OECD 211 (Daphnia chronic test) were
considered using the 21 d NOEC (OECD, 1998a). Studies on invertebrates were mostly
conducted on D. magna and in particular special cases on D .pulex. Other invertebrate species
were not considered.
Specification of the data set
Comparison of species sensitivity in acute and chronic testing
18
The intersection search comprising both acute and chronic guideline studies on aquatic
invertebrates and fish resulted in about 167 industrial chemicals and 73 pesticides entities.
Within the data set 27 poorly water-soluble substances and 34 substances with a log Kow > 4.5
were identified. Organic chemicals exhibit the most comprehensive group including
hydrocarbons, aromatic hydrocarbons, halogenated compounds, polycyclic dyes, amino and
nitro compounds, alkyl sulfate and sulfonyl derivatives as wells as phenol derivatives. ACR
could be derived from 133 organic chemicals and 71 pesticides that were considered within the
scope of this study.
Data analysis
To calculate acute to chronic ratios ACR the lowest EC50 or LC50 from acute tests for Daphnia
and fish were divided by the respective chronic studies, where the NOEC is determined from
the most sensitive endpoint of hatchability, survival, growth, or reproduction, for example.
Open ended toxicity values (> 100 mg/L or <1 mg/L, for example) were not included in the data
analysis to determine acute to chronic ratios. Separate analyses of trophic levels (invertebrates
and fish) were conducted. ACR for the aquatic compartment (ACRaqu) were derived using the
most sensitive species in acute and the most sensitive trophic level in chronic testing,
respectively. The resulting ACR distribution deviated from normal distribution and was
analysed by non-parametric test using Statistica.
Visual inspection of the chemical structures was used to identify structural alerts in terms of
sub-structural features that are associated with the occurrence of high ACRs. A comparative
analysis of structural moieties further resulted in the identification of potential structural alerts
for an increased probability of high ACR for fish. As described previously by Ahlers et al. (2006),
an ACR of 30 was used to separate between low and high ACR for structural alert analysis
(Ahlers et al., 2006).
For sensitivity comparison in acute and chronic testing the following quotients were generated:
Quotientacute (Qa) = LC50 (fish, acute) / EC50 (Daphnia, acute)
Quotientchronic (Qc) = NOEC (fish, chronic) / NOEC (Daphnia, chronic)
Quotientchronic* (Qc*) = 5 x NOEC (fish, chronic) / NOEC (Daphnia, chronic)
Statistical data analysis was determined by non-parametric test using Statistica. The statistical
result was characterized by the median and 90%-ile value as well as by their minimum and
maximum values. For interpreting of regression data it was assumed that a regression
coefficient R² of >0.6 corresponds to a moderate correlation whereas a value of about 0.8 and
more corresponds to a reliable prediction.
Comparison of species sensitivity in acute and chronic testing
19
5 Results and Discussion
5.1 Correlation of acute and chronic effect values within one trophic level
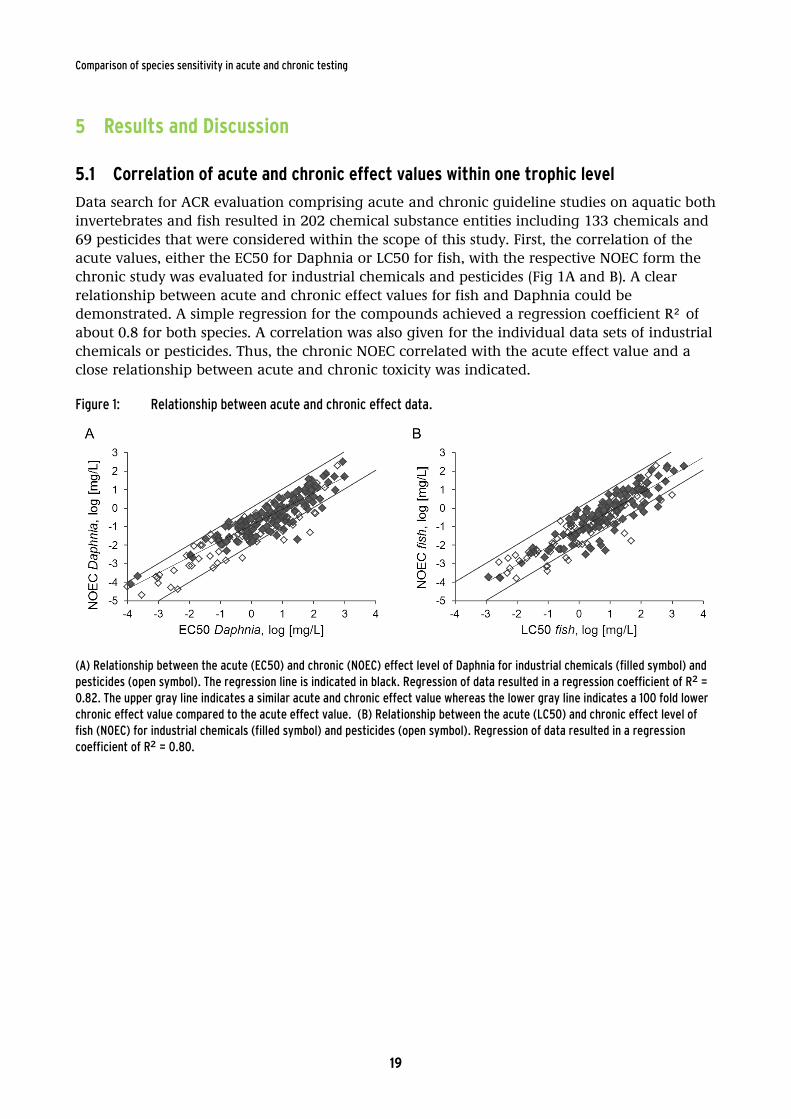
Data search for ACR evaluation comprising acute and chronic guideline studies on aquatic both
invertebrates and fish resulted in 202 chemical substance entities including 133 chemicals and
69 pesticides that were considered within the scope of this study. First, the correlation of the
acute values, either the EC50 for Daphnia or LC50 for fish, with the respective NOEC form the
chronic study was evaluated for industrial chemicals and pesticides (Fig 1A and B). A clear
relationship between acute and chronic effect values for fish and Daphnia could be
demonstrated. A simple regression for the compounds achieved a regression coefficient R² of
about 0.8 for both species. A correlation was also given for the individual data sets of industrial
chemicals or pesticides. Thus, the chronic NOEC correlated with the acute effect value and a
close relationship between acute and chronic toxicity was indicated.
Figure 1: Relationship between acute and chronic effect data.
(A) Relationship between the acute (EC50) and chronic (NOEC) effect level of Daphnia for industrial chemicals (filled symbol) and
pesticides (open symbol). The regression line is indicated in black. Regression of data resulted in a regression coefficient of R² =
0.82. The upper gray line indicates a similar acute and chronic effect value whereas the lower gray line indicates a 100 fold lower
chronic effect value compared to the acute effect value. (B) Relationship between the acute (LC50) and chronic effect level of
fish (NOEC) for industrial chemicals (filled symbol) and pesticides (open symbol). Regression of data resulted in a regression
coefficient of R² = 0.80.
Comparison of species sensitivity in acute and chronic testing
20
5.2 Acute to chronic ratios (ACR)
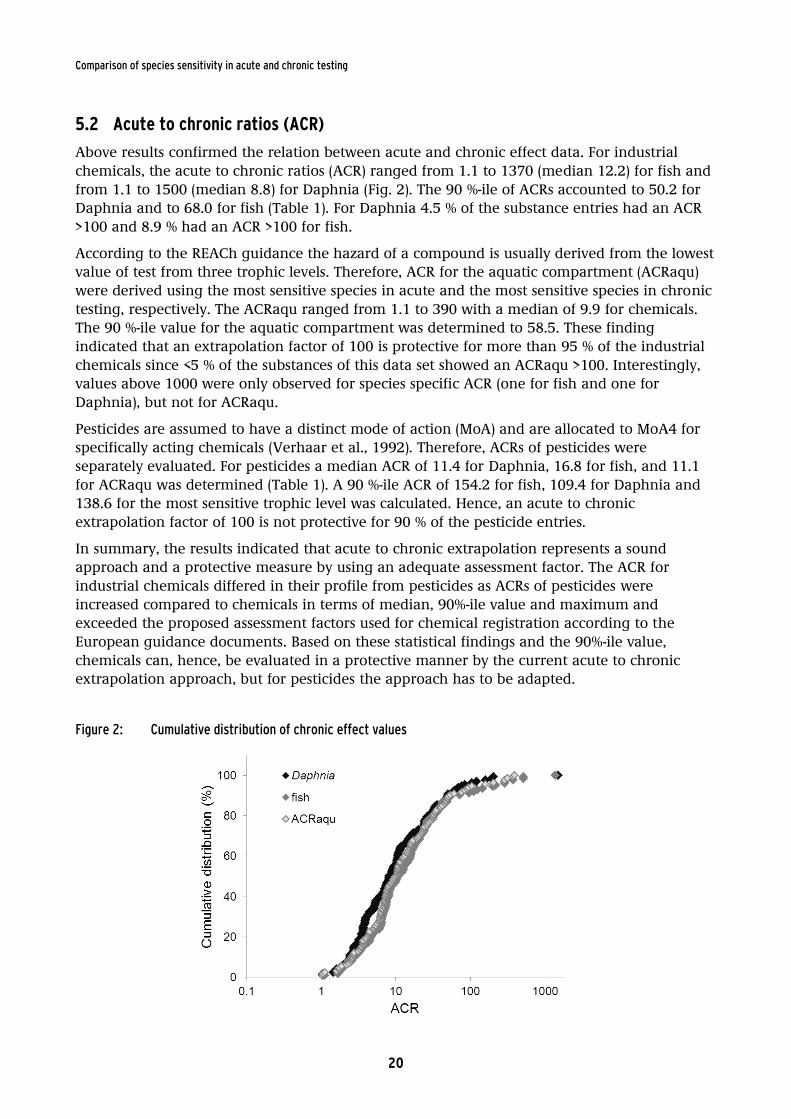
Above results confirmed the relation between acute and chronic effect data. For industrial
chemicals, the acute to chronic ratios (ACR) ranged from 1.1 to 1370 (median 12.2) for fish and
from 1.1 to 1500 (median 8.8) for Daphnia (Fig. 2). The 90 %-ile of ACRs accounted to 50.2 for
Daphnia and to 68.0 for fish (Table 1). For Daphnia 4.5 % of the substance entries had an ACR
>100 and 8.9 % had an ACR >100 for fish.
According to the REACh guidance the hazard of a compound is usually derived from the lowest
value of test from three trophic levels. Therefore, ACR for the aquatic compartment (ACRaqu)
were derived using the most sensitive species in acute and the most sensitive species in chronic
testing, respectively. The ACRaqu ranged from 1.1 to 390 with a median of 9.9 for chemicals.
The 90 %-ile value for the aquatic compartment was determined to 58.5. These finding
indicated that an extrapolation factor of 100 is protective for more than 95 % of the industrial
chemicals since <5 % of the substances of this data set showed an ACRaqu >100. Interestingly,
values above 1000 were only observed for species specific ACR (one for fish and one for
Daphnia), but not for ACRaqu.
Pesticides are assumed to have a distinct mode of action (MoA) and are allocated to MoA4 for
specifically acting chemicals (Verhaar et al., 1992). Therefore, ACRs of pesticides were
separately evaluated. For pesticides a median ACR of 11.4 for Daphnia, 16.8 for fish, and 11.1
for ACRaqu was determined (Table 1). A 90 %-ile ACR of 154.2 for fish, 109.4 for Daphnia and
138.6 for the most sensitive trophic level was calculated. Hence, an acute to chronic
extrapolation factor of 100 is not protective for 90 % of the pesticide entries.
In summary, the results indicated that acute to chronic extrapolation represents a sound
approach and a protective measure by using an adequate assessment factor. The ACR for
industrial chemicals differed in their profile from pesticides as ACRs of pesticides were
increased compared to chemicals in terms of median, 90%-ile value and maximum and
exceeded the proposed assessment factors used for chemical registration according to the
European guidance documents. Based on these statistical findings and the 90%-ile value,
chemicals can, hence, be evaluated in a protective manner by the current acute to chronic
extrapolation approach, but for pesticides the approach has to be adapted.
Figure 2: Cumulative distribution of chronic effect values
Comparison of species sensitivity in acute and chronic testing
21
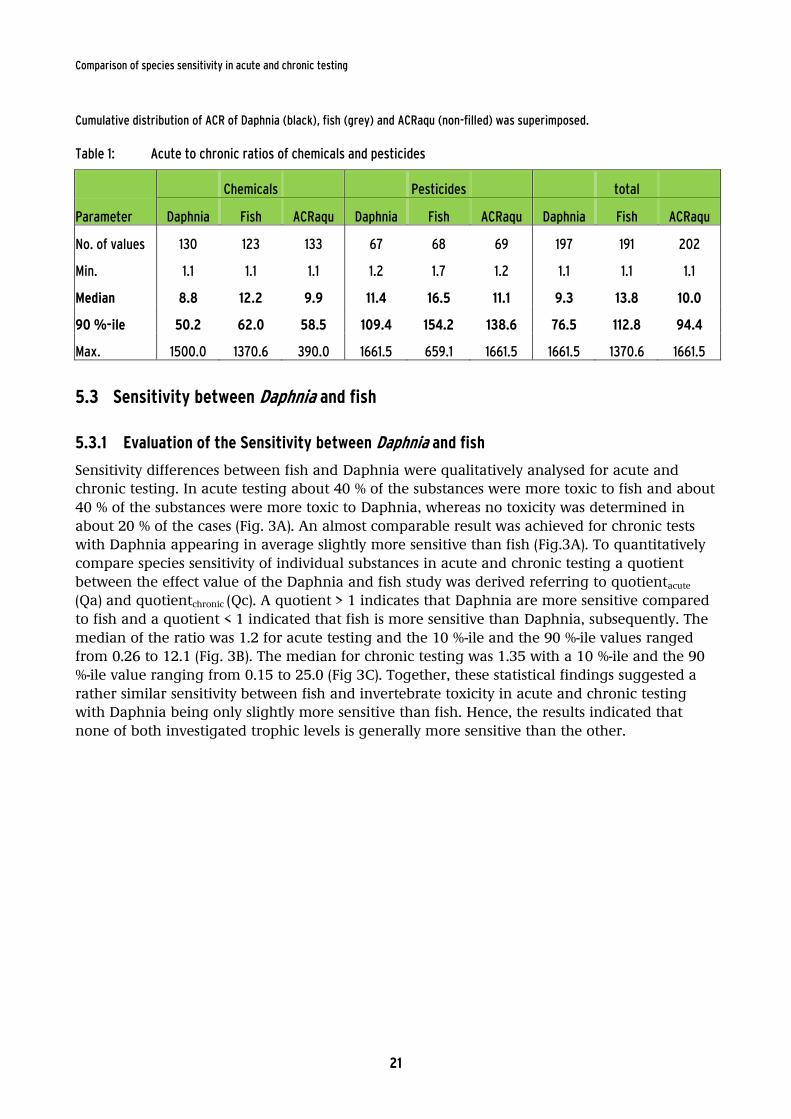
Cumulative distribution of ACR of Daphnia (black), fish (grey) and ACRaqu (non-filled) was superimposed.
Table 1: Acute to chronic ratios of chemicals and pesticides
Chemicals Pesticides total
Parameter Daphnia Fish ACRaqu Daphnia Fish ACRaqu Daphnia Fish ACRaqu
No. of values 130 123 133 67 68 69 197 191 202
Min. 1.1 1.1 1.1 1.2 1.7 1.2 1.1 1.1 1.1
Median 8.8 12.2 9.9 11.4 16.5 11.1 9.3 13.8 10.0
90 %-ile 50.2 62.0 58.5 109.4 154.2 138.6 76.5 112.8 94.4
Max. 1500.0 1370.6 390.0 1661.5 659.1 1661.5 1661.5 1370.6 1661.5
5.3 Sensitivity between Daphnia and fish
5.3.1 Evaluation of the Sensitivity between Daphnia and fish
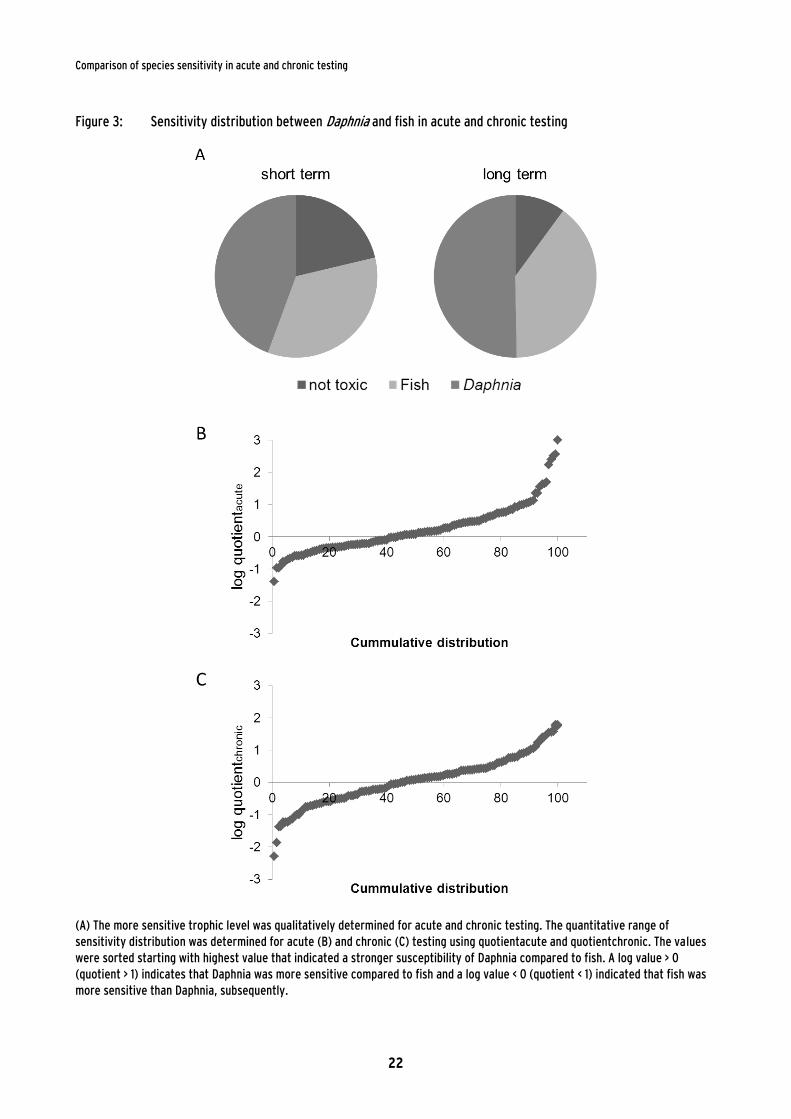
Sensitivity differences between fish and Daphnia were qualitatively analysed for acute and
chronic testing. In acute testing about 40 % of the substances were more toxic to fish and about
40 % of the substances were more toxic to Daphnia, whereas no toxicity was determined in
about 20 % of the cases (Fig. 3A). An almost comparable result was achieved for chronic tests
with Daphnia appearing in average slightly more sensitive than fish (Fig.3A). To quantitatively
compare species sensitivity of individual substances in acute and chronic testing a quotient
between the effect value of the Daphnia and fish study was derived referring to quotientacute
(Qa) and quotientchronic (Qc). A quotient > 1 indicates that Daphnia are more sensitive compared
to fish and a quotient < 1 indicated that fish is more sensitive than Daphnia, subsequently. The
median of the ratio was 1.2 for acute testing and the 10 %-ile and the 90 %-ile values ranged
from 0.26 to 12.1 (Fig. 3B). The median for chronic testing was 1.35 with a 10 %-ile and the 90
%-ile value ranging from 0.15 to 25.0 (Fig 3C). Together, these statistical findings suggested a
rather similar sensitivity between fish and invertebrate toxicity in acute and chronic testing
with Daphnia being only slightly more sensitive than fish. Hence, the results indicated that
none of both investigated trophic levels is generally more sensitive than the other.
Comparison of species sensitivity in acute and chronic testing
22
Figure 3: Sensitivity distribution between Daphnia and fish in acute and chronic testing
(A) The more sensitive trophic level was qualitatively determined for acute and chronic testing. The quantitative range of
sensitivity distribution was determined for acute (B) and chronic (C) testing using quotientacute and quotientchronic. The values
were sorted starting with highest value that indicated a stronger susceptibility of Daphnia compared to fish. A log value > 0
(quotient > 1) indicates that Daphnia was more sensitive compared to fish and a log value < 0 (quotient < 1) indicated that fish was
more sensitive than Daphnia, subsequently.
Comparison of species sensitivity in acute and chronic testing
23
5.3.2 Acute sensitivity classification (ASC)
To classify acute sensitivity distribution the quotientacute was grouped in four categories that
were considered relevant for regulatory purposes and testing strategies to estimate chronic
toxicity for further testing requirements. Initially, Cat 1: < 0.1; Cat 2: 0.1 – 0.2; Cat 3: 0.2 – 10;
Cat 4: >10 was suggested in the kick-off meeting by the UBA. However, the analysis of the
results suggested an adaptation of the boundaries due to three mayor shortcoming:
1) More than 80 % of the substance entries were initially assigned to Cat.3. Therefore, a
differentiated evaluation of the dataset appeared to be not feasible. Furthermore, the
initial consideration of the system envisaged that a chronic fish test should not be
indicated for substances in Cat.3 and Cat.4 and may be only considered in exceptions.
However this would result in an underestimation of fish toxicity in several cases.
2) An outer value of 0.1 and 10 for Cat.1 and Cat.4 appeared to be rather high and not
protective. Only four substances were >10x more sensitive to fish. 17 substances were
>10x more sensitive towards Daphnia. Therefore, these values were adapted to 0.2 and
5.
3) Cat.2: 0.1 – 0.2 appeared to be rather small with only eight substance entries.
Furthermore the lower boundary of 0.2 for Cat.2 appeared to be not protective for fish
since several substances being 5x more sensitive towards fish than Daphnia in chronic
testing were determined at lower quotients.
The four categories as applied in this study were based on discussion by the project partners
and were classified as follows: Cat 1: < 0.2; Cat 2: 0.2 – 0.5; Cat 3: 0.5 – 5; Cat 4: >5 (Table1).
Cat 3 was based on the sensitivity with fish being up to 2x more sensitive than Daphnia or
Daphnia are up to 5x more sensitive than fish. Cat 4 represents datasets where Daphnia
appeared to be > 5x more sensitive than fish and Cat 1 comprises datasets with sensitivity
differences of fish being > 5x more sensitive than Daphnia. The range of the quotient for
Cat 3 was, hence, defined as 0.5 – 2. Cat 2 referred to sensitivity ratio where fish are
between 2 to 5x more sensitive than Daphnia. The classification system was compiled to be
conservative regarding fish toxicity and to avoid animal testing since two categories were
established for substances being more sensitive to fish in acute testing. A value of 0.5
between Cat 2 and Cat.3 was chosen assuming that a range 0.5 to 2 represents equal
sensitivity so that Cat.1 and Cat.2 includes all data were fish is more sensitive than Daphnia
in acute testing. A value of 0.2 and 5 was chosen to define Cat.1 and Cat.4 where one
trophic level is significant (in terms of 5x) more toxic than the other since a limit of 10 as
implicated in the guidance R7b for sensitivity distinction appeared to be rather high as
discussed below.
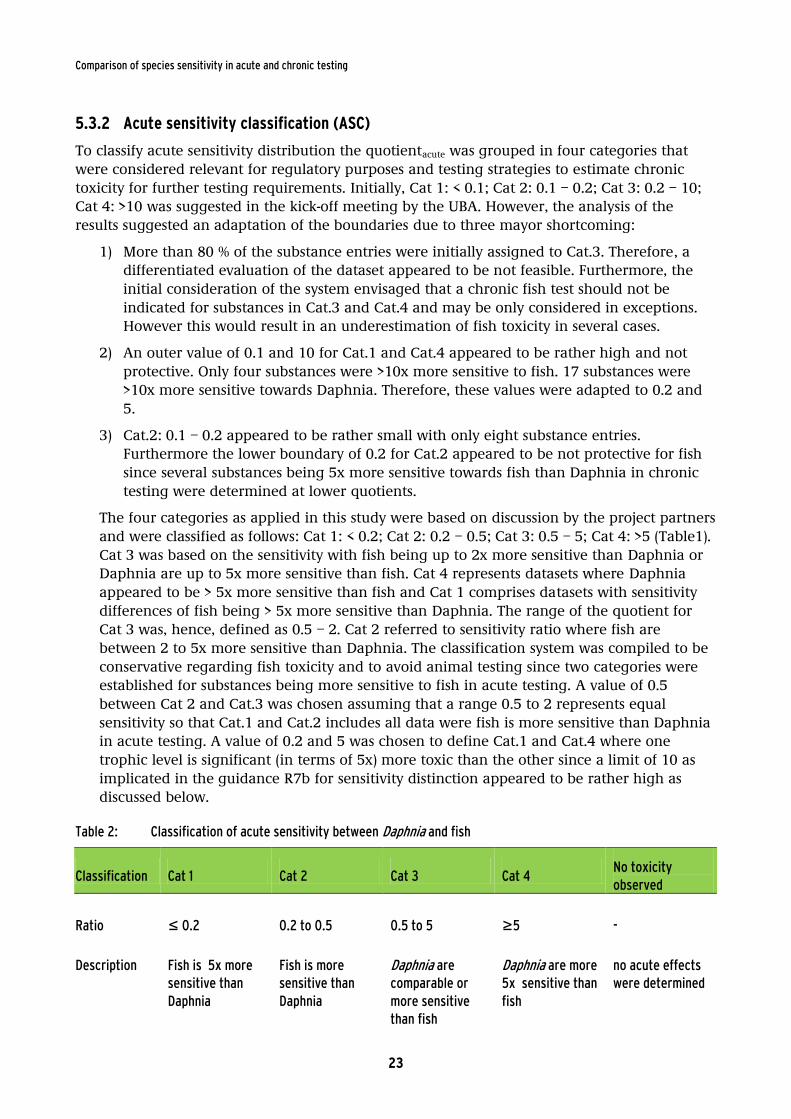
Table 2: Classification of acute sensitivity between Daphnia and fish
Classification Cat 1 Cat 2 Cat 3 Cat 4 No toxicity
observed
Ratio ≤ 0.2 0.2 to 0.5 0.5 to 5 ≥5 -
Description Fish is 5x more
sensitive than
Daphnia
Fish is more
sensitive than
Daphnia
Daphnia are
comparable or
more sensitive
than fish
Daphnia are more
5x sensitive than
fish
no acute effects
were determined
Comparison of species sensitivity in acute and chronic testing
24
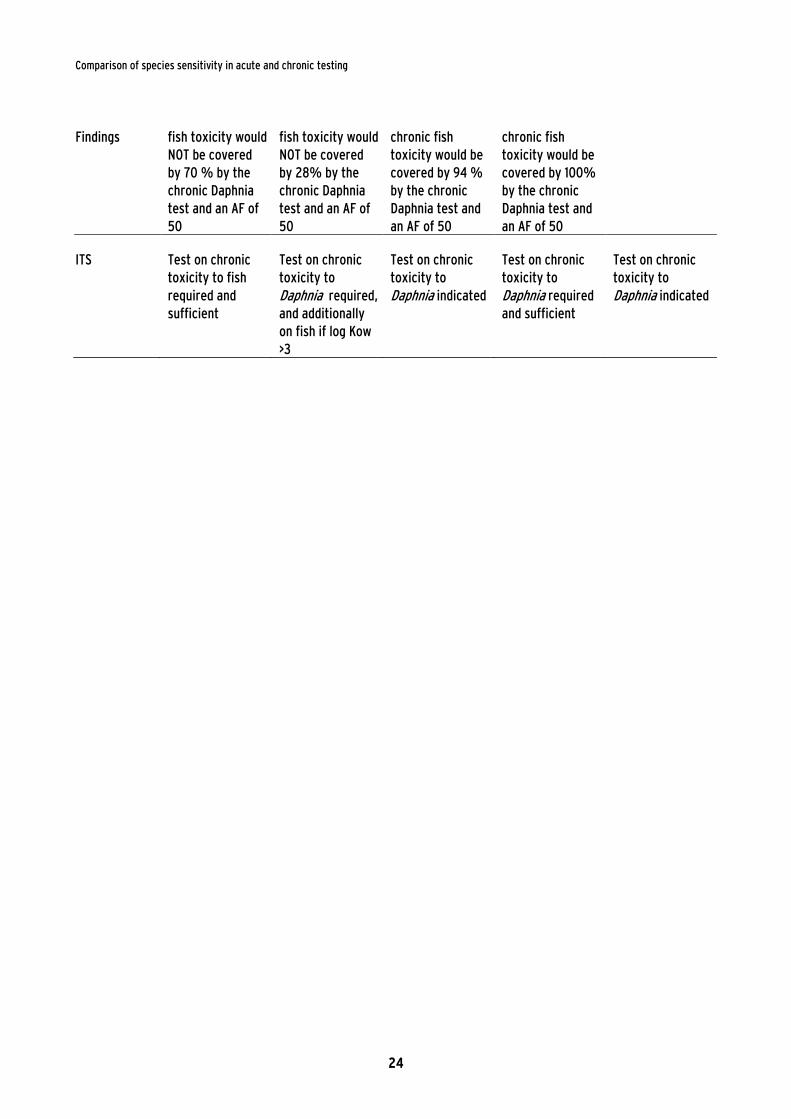
Findings fish toxicity would
NOT be covered
by 70 % by the
chronic Daphnia
test and an AF of
50
fish toxicity would
NOT be covered
by 28% by the
chronic Daphnia
test and an AF of
50
chronic fish
toxicity would be
covered by 94 %
by the chronic
Daphnia test and
an AF of 50
chronic fish
toxicity would be
covered by 100%
by the chronic
Daphnia test and
an AF of 50
ITS Test on chronic
toxicity to fish
required and
sufficient
Test on chronic
toxicity to
Daphnia required,
and additionally
on fish if log Kow
>3
Test on chronic
toxicity to
Daphnia indicated
Test on chronic
toxicity to
Daphnia required
and sufficient
Test on chronic
toxicity to
Daphnia indicated
Comparison of species sensitivity in acute and chronic testing
25
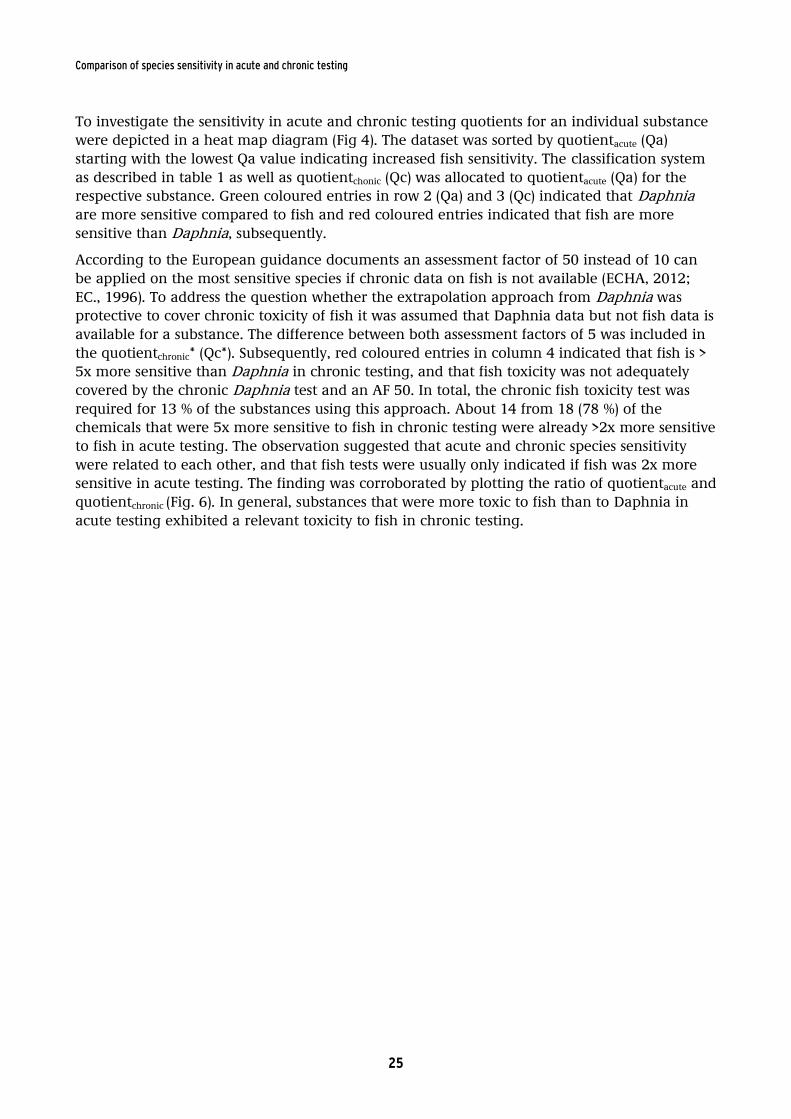
To investigate the sensitivity in acute and chronic testing quotients for an individual substance
were depicted in a heat map diagram (Fig 4). The dataset was sorted by quotientacute (Qa)
starting with the lowest Qa value indicating increased fish sensitivity. The classification system
as described in table 1 as well as quotientchonic (Qc) was allocated to quotientacute (Qa) for the
respective substance. Green coloured entries in row 2 (Qa) and 3 (Qc) indicated that Daphnia
are more sensitive compared to fish and red coloured entries indicated that fish are more
sensitive than Daphnia, subsequently.
According to the European guidance documents an assessment factor of 50 instead of 10 can
be applied on the most sensitive species if chronic data on fish is not available (ECHA, 2012;
EC., 1996). To address the question whether the extrapolation approach from Daphnia was
protective to cover chronic toxicity of fish it was assumed that Daphnia data but not fish data is
available for a substance. The difference between both assessment factors of 5 was included in
the quotientchronic* (Qc*). Subsequently, red coloured entries in column 4 indicated that fish is >
5x more sensitive than Daphnia in chronic testing, and that fish toxicity was not adequately
covered by the chronic Daphnia test and an AF 50. In total, the chronic fish toxicity test was
required for 13 % of the substances using this approach. About 14 from 18 (78 %) of the
chemicals that were 5x more sensitive to fish in chronic testing were already >2x more sensitive
to fish in acute testing. The observation suggested that acute and chronic species sensitivity
were related to each other, and that fish tests were usually only indicated if fish was 2x more
sensitive in acute testing. The finding was corroborated by plotting the ratio of quotientacute and
quotientchronic (Fig. 6). In general, substances that were more toxic to fish than to Daphnia in
acute testing exhibited a relevant toxicity to fish in chronic testing.
Comparison of species sensitivity in acute and chronic testing
26
Figure 4: Sensitivity categorization between Daphnia and fish for individual substances
Cat: Quotientacute was allocated to the classification system as described in Table 2.
Qa: To compare the species sensitivity in acute testing a quotient between the effect value of the Daphnia and fish
study was derived referring to quotientacute (Qa). A quotient >1 (green) indicates that Daphnia are more sensitive
compared to fish and a quotient < 1 (red) indicated that fish are more sensitive than Daphnia, subsequently. The
dataset was sorted starting with the highest quotientacute value.
Qc: To compare the species sensitivity in chronic testing a quotient between the effect value of the Daphnia and fish
study was derived referring to quotientchronic (Qc). A quotient >1 (green) indicates that Daphnia are more sensitive
compared to fish and a quotient < 1 (red) indicated that fish are more sensitive than Daphnia, subsequently.
Qc*: Quotientchronic was multiplied by 5. Substance entries that were subsequently >5x more sensitive to fish in chronic
testing were coloured red.
Sensitivity distribution between Daphnia and fish was elucidated for individual substances by a heat map diagram. The
dataset was obtained from the ECHA database and the ICS database. Each column represents a single chemical entry
(n=167). Sensitivity differences were calculated by quotientacute and by quotientchronic, and substance entries
sorted by quotientacute starting with the lowest value. Species sensitivity was coloured green for Daphnia and red for
fish being more sensitive to a chemical in acute and chronic testing, respectively. Substance entries exhibiting no
toxicity in the respective test setting were listed on the right (not coloured). Quotientacute was allocated to the
classification system described in table 1. Substance entries were allocated to the classification system that is based
on quotientacute and described in table 1. The percentage of substances being more toxic to fish in chronic testing and
exhibiting a quotientchronic <1 was evaluated for each classification class (black) for chemicals.
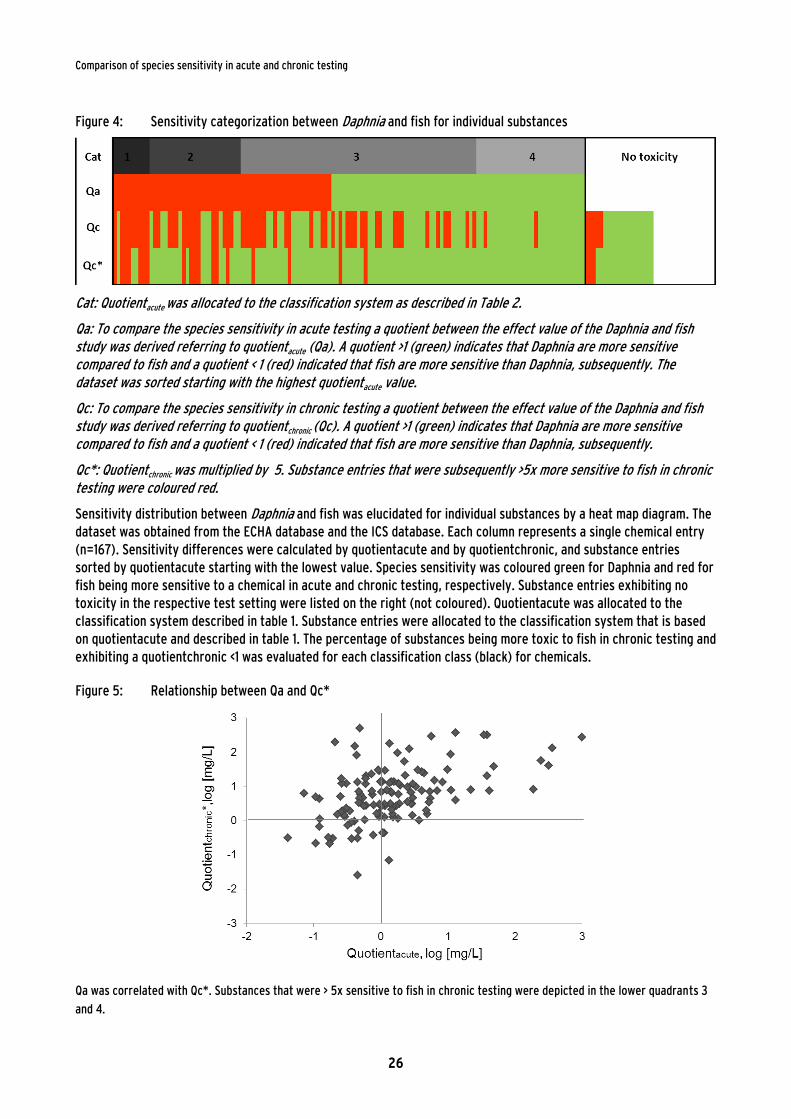
Figure 5: Relationship between Qa and Qc*
Qa was correlated with Qc*. Substances that were > 5x sensitive to fish in chronic testing were depicted in the lower quadrants 3
and 4.
Comparison of species sensitivity in acute and chronic testing
27
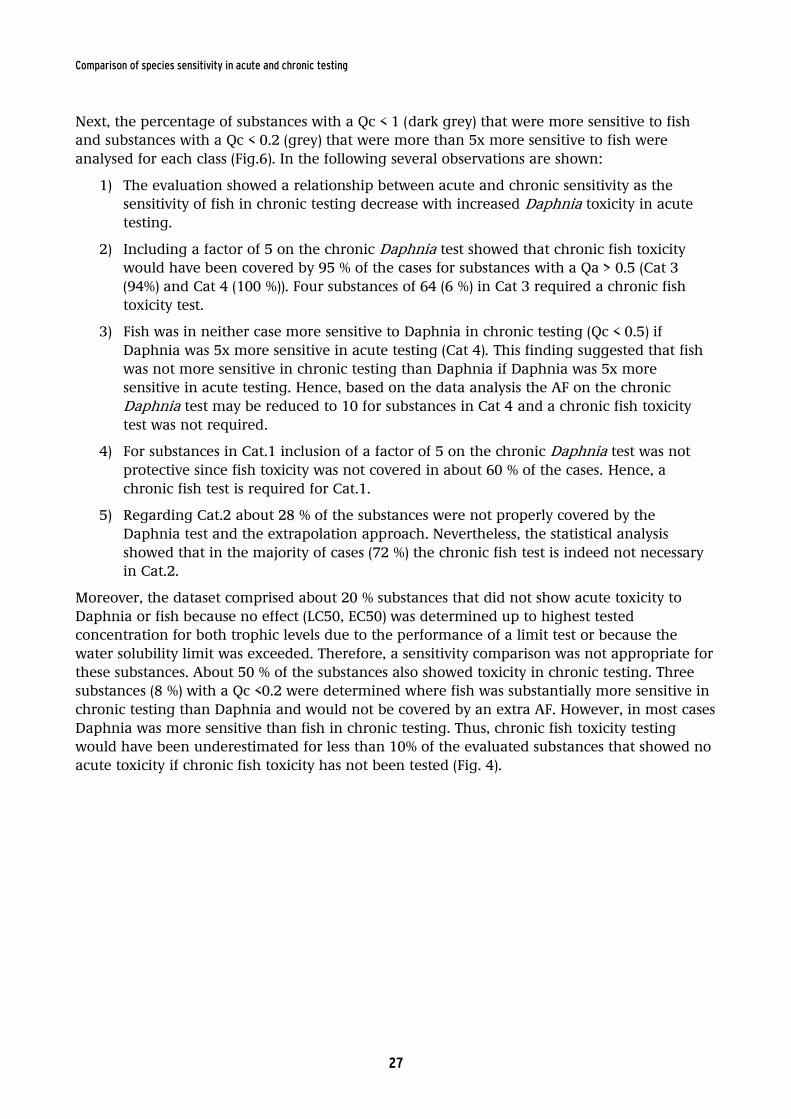
Next, the percentage of substances with a Qc < 1 (dark grey) that were more sensitive to fish
and substances with a Qc < 0.2 (grey) that were more than 5x more sensitive to fish were
analysed for each class (Fig.6). In the following several observations are shown:
1) The evaluation showed a relationship between acute and chronic sensitivity as the
sensitivity of fish in chronic testing decrease with increased Daphnia toxicity in acute
testing.
2) Including a factor of 5 on the chronic Daphnia test showed that chronic fish toxicity
would have been covered by 95 % of the cases for substances with a Qa > 0.5 (Cat 3
(94%) and Cat 4 (100 %)). Four substances of 64 (6 %) in Cat 3 required a chronic fish
toxicity test.
3) Fish was in neither case more sensitive to Daphnia in chronic testing (Qc < 0.5) if
Daphnia was 5x more sensitive in acute testing (Cat 4). This finding suggested that fish
was not more sensitive in chronic testing than Daphnia if Daphnia was 5x more
sensitive in acute testing. Hence, based on the data analysis the AF on the chronic
Daphnia test may be reduced to 10 for substances in Cat 4 and a chronic fish toxicity
test was not required.
4) For substances in Cat.1 inclusion of a factor of 5 on the chronic Daphnia test was not
protective since fish toxicity was not covered in about 60 % of the cases. Hence, a
chronic fish test is required for Cat.1.
5) Regarding Cat.2 about 28 % of the substances were not properly covered by the
Daphnia test and the extrapolation approach. Nevertheless, the statistical analysis
showed that in the majority of cases (72 %) the chronic fish test is indeed not necessary
in Cat.2.
Moreover, the dataset comprised about 20 % substances that did not show acute toxicity to
Daphnia or fish because no effect (LC50, EC50) was determined up to highest tested
concentration for both trophic levels due to the performance of a limit test or because the
water solubility limit was exceeded. Therefore, a sensitivity comparison was not appropriate for
these substances. About 50 % of the substances also showed toxicity in chronic testing. Three
substances (8 %) with a Qc <0.2 were determined where fish was substantially more sensitive in
chronic testing than Daphnia and would not be covered by an extra AF. However, in most cases
Daphnia was more sensitive than fish in chronic testing. Thus, chronic fish toxicity testing
would have been underestimated for less than 10% of the evaluated substances that showed no
acute toxicity if chronic fish toxicity has not been tested (Fig. 4).
Comparison of species sensitivity in acute and chronic testing
28
Figure 6: Fish sensitivity of chemicals in each category
Substance entries of chemicals were allocated to the classification system. The percentage of substances being more toxic to fish
in chronic testing and exhibiting a quotientchronic <1 was evaluated for each class (black), and the percentage of substances that
were >5x more sensitive to fish in chronic testing and exhibited a quotientchronic <0.2 were evaluated for each class (grey).
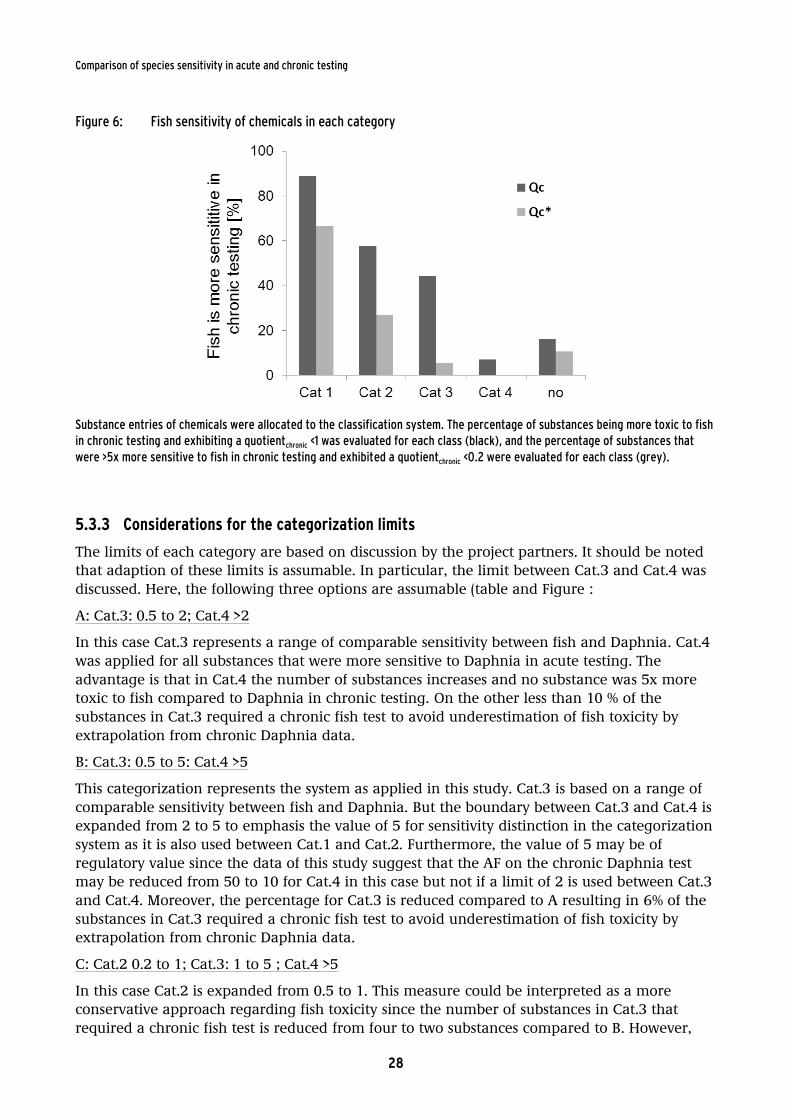
5.3.3 Considerations for the categorization limits
The limits of each category are based on discussion by the project partners. It should be noted
that adaption of these limits is assumable. In particular, the limit between Cat.3 and Cat.4 was
discussed. Here, the following three options are assumable (table and Figure :
A: Cat.3: 0.5 to 2; Cat.4 >2
In this case Cat.3 represents a range of comparable sensitivity between fish and Daphnia. Cat.4
was applied for all substances that were more sensitive to Daphnia in acute testing. The
advantage is that in Cat.4 the number of substances increases and no substance was 5x more
toxic to fish compared to Daphnia in chronic testing. On the other less than 10 % of the
substances in Cat.3 required a chronic fish test to avoid underestimation of fish toxicity by
extrapolation from chronic Daphnia data.
B: Cat.3: 0.5 to 5: Cat.4 >5
This categorization represents the system as applied in this study. Cat.3 is based on a range of
comparable sensitivity between fish and Daphnia. But the boundary between Cat.3 and Cat.4 is
expanded from 2 to 5 to emphasis the value of 5 for sensitivity distinction in the categorization
system as it is also used between Cat.1 and Cat.2. Furthermore, the value of 5 may be of
regulatory value since the data of this study suggest that the AF on the chronic Daphnia test
may be reduced from 50 to 10 for Cat.4 in this case but not if a limit of 2 is used between Cat.3
and Cat.4. Moreover, the percentage for Cat.3 is reduced compared to A resulting in 6% of the
substances in Cat.3 required a chronic fish test to avoid underestimation of fish toxicity by
extrapolation from chronic Daphnia data.
C: Cat.2 0.2 to 1; Cat.3: 1 to 5 ; Cat.4 >5
In this case Cat.2 is expanded from 0.5 to 1. This measure could be interpreted as a more
conservative approach regarding fish toxicity since the number of substances in Cat.3 that
required a chronic fish test is reduced from four to two substances compared to B. However,
Comparison of species sensitivity in acute and chronic testing
29
the adaptation to a more conservative evaluation regarding chronic fish toxicity may be
considered as marginal since Qc was statistically reduced from 49.2 to 43.9 and Qp from 6.2 to
4.9. On the other hand the number of substances in Cat.2 is almost doubled from 25 to 49.
Thus, the adaptation of the limit from 0.5 to 1 between Cat2 and Cat.3 may be considered as
inefficient since the number of substances in Cat.2 and, hence, the number of possible fish test
strongly increase whereas the statistical increase of safety in terms of an conservative hazard
assessment remains almost unchanged.
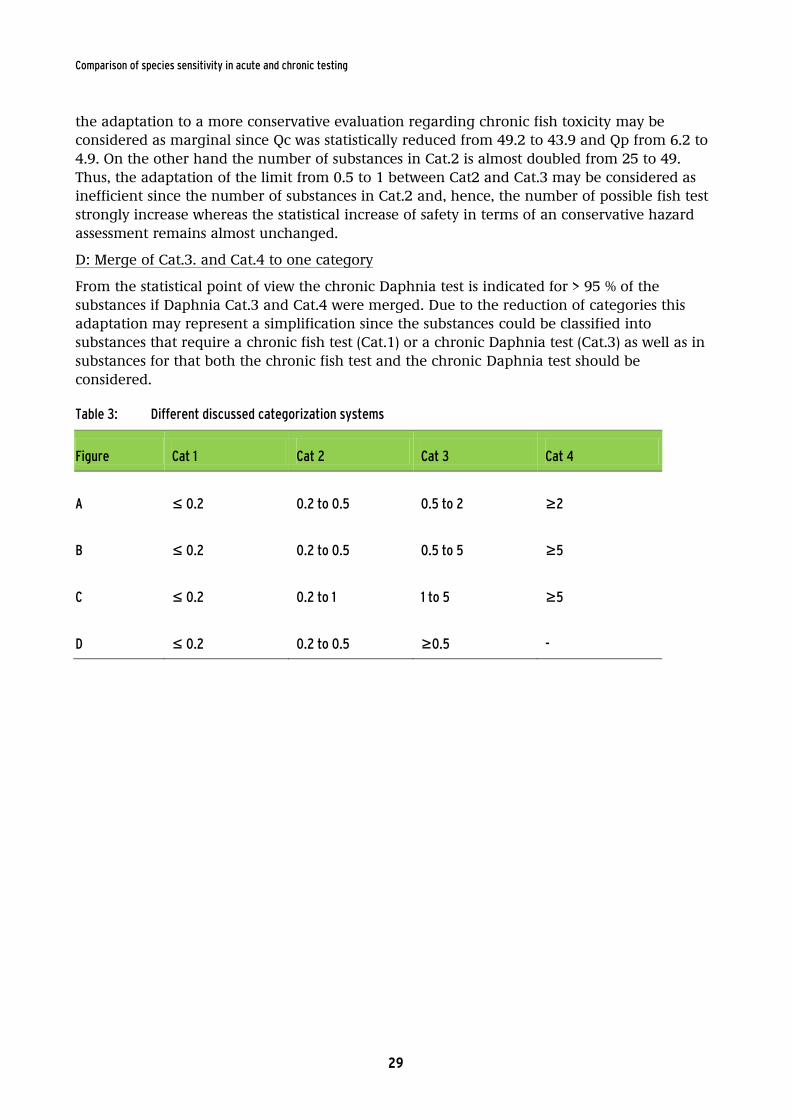
D: Merge of Cat.3. and Cat.4 to one category
From the statistical point of view the chronic Daphnia test is indicated for > 95 % of the
substances if Daphnia Cat.3 and Cat.4 were merged. Due to the reduction of categories this
adaptation may represent a simplification since the substances could be classified into
substances that require a chronic fish test (Cat.1) or a chronic Daphnia test (Cat.3) as well as in
substances for that both the chronic fish test and the chronic Daphnia test should be
considered.
Table 3: Different discussed categorization systems
Figure Cat 1 Cat 2 Cat 3 Cat 4
A ≤ 0.2 0.2 to 0.5 0.5 to 2 ≥2
B ≤ 0.2 0.2 to 0.5 0.5 to 5 ≥5
C ≤ 0.2 0.2 to 1 1 to 5 ≥5
D ≤ 0.2 0.2 to 0.5 ≥0.5 -
Comparison of species sensitivity in acute and chronic testing
30
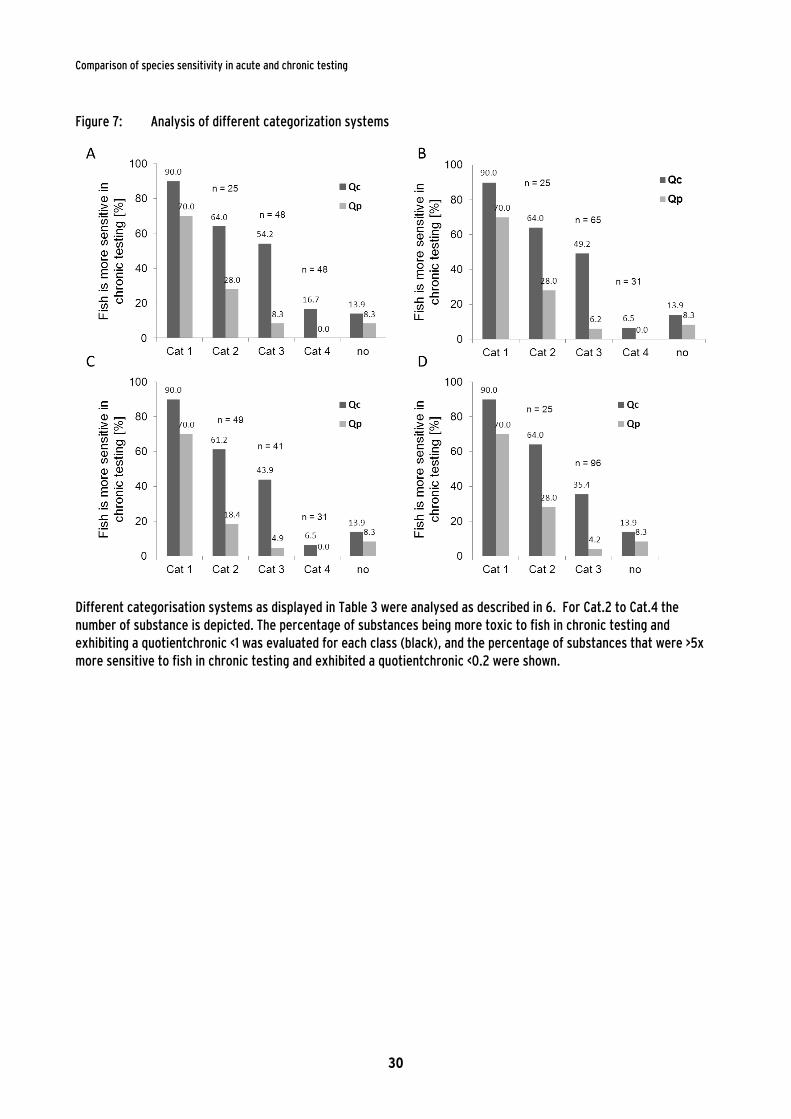
Figure 7: Analysis of different categorization systems
Different categorisation systems as displayed in Table 3 were analysed as described in 6. For Cat.2 to Cat.4 the
number of substance is depicted. The percentage of substances being more toxic to fish in chronic testing and
exhibiting a quotientchronic <1 was evaluated for each class (black), and the percentage of substances that were >5x
more sensitive to fish in chronic testing and exhibited a quotientchronic <0.2 were shown.
Comparison of species sensitivity in acute and chronic testing
31
5.4 Evaluation of the applicability of the categorisation system for pesticides
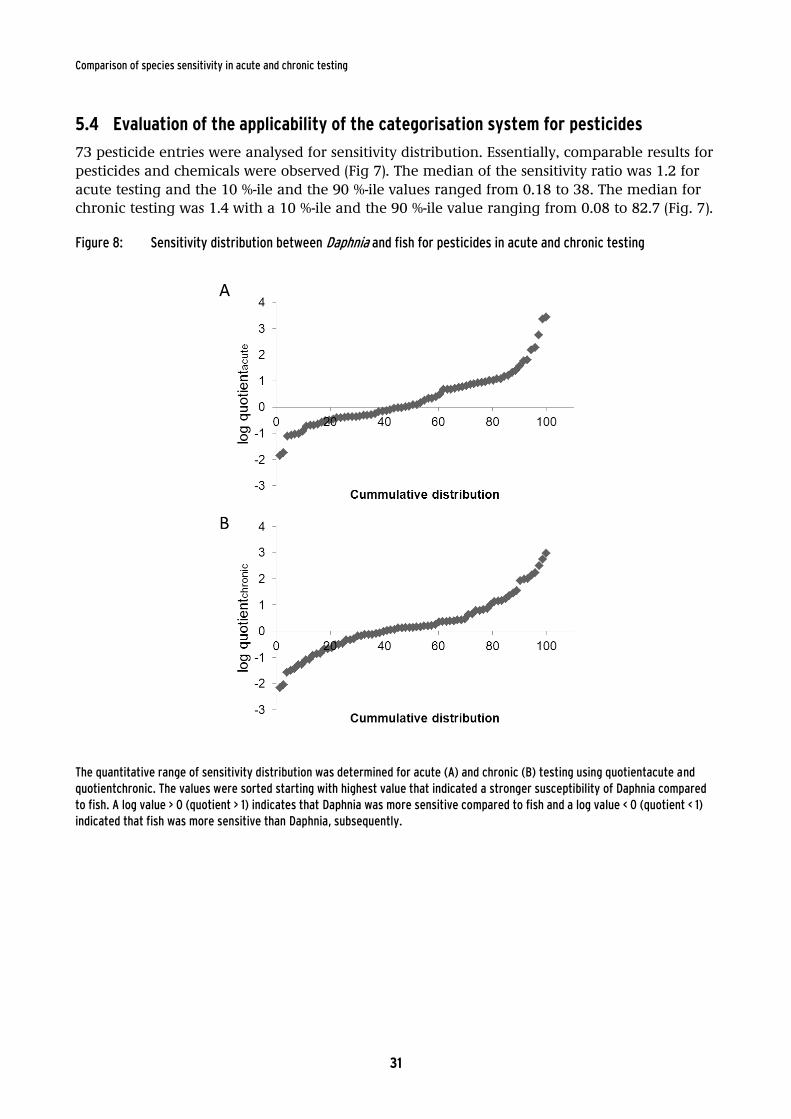
73 pesticide entries were analysed for sensitivity distribution. Essentially, comparable results for
pesticides and chemicals were observed (Fig 7). The median of the sensitivity ratio was 1.2 for
acute testing and the 10 %-ile and the 90 %-ile values ranged from 0.18 to 38. The median for
chronic testing was 1.4 with a 10 %-ile and the 90 %-ile value ranging from 0.08 to 82.7 (Fig. 7).
Figure 8: Sensitivity distribution between Daphnia and fish for pesticides in acute and chronic testing
The quantitative range of sensitivity distribution was determined for acute (A) and chronic (B) testing using quotientacute and
quotientchronic. The values were sorted starting with highest value that indicated a stronger susceptibility of Daphnia compared
to fish. A log value > 0 (quotient > 1) indicates that Daphnia was more sensitive compared to fish and a log value < 0 (quotient < 1)
indicated that fish was more sensitive than Daphnia, subsequently.
Comparison of species sensitivity in acute and chronic testing
32
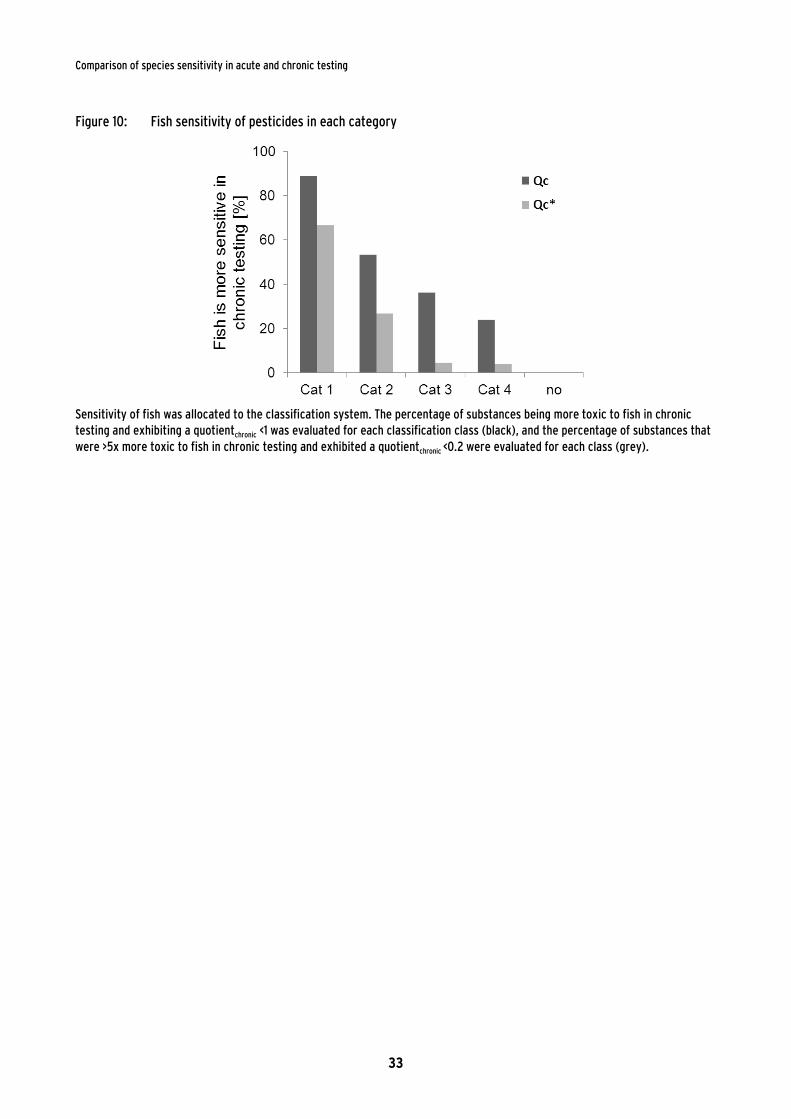
Furthermore, sensitivity of one trophic level in acute testing was associated with a comparable sensitivity in chronic testing towards the same trophic level for pesticides. More than 90 % of the pesticides being more sensitive to fish in chronic testing were already >2x more sensitive to fish in acute testing (Fig. 8). Pesticides in Cat 1 and Cat 2 were in about 90 % and 50 % of the cases
more toxic to fish. Upon application of a factor of 5 on the chronic Daphnia test, substances in Cat 1 were in about 70 % of the cases also more toxic to fish and substances in Cat 2 were in about 30 % of the cases more toxic to fish in chronic testing (Fig 9). Substances in Cat 3 and Cat 4 were in > 90 % of the cases more toxic to Daphnia in chronic testing upon inclusion of a factor of 5 on the chronic Daphnia test. Hence, the chronic Daphnia test was considered as protective for pesticides that were classified to Cat 3 and Cat 4. In total about 11% of the evaluated pesticides compared to 13 % of the evaluated chemicals were 5x more toxic to fish in chronic testing and would have required a chronic fish toxicity test. Together, the findings showed that sensitivity distribution of chronic toxicity was comparable between chemicals and pesticides and that the sensitivity classification approach may also be applicable for pesticides.
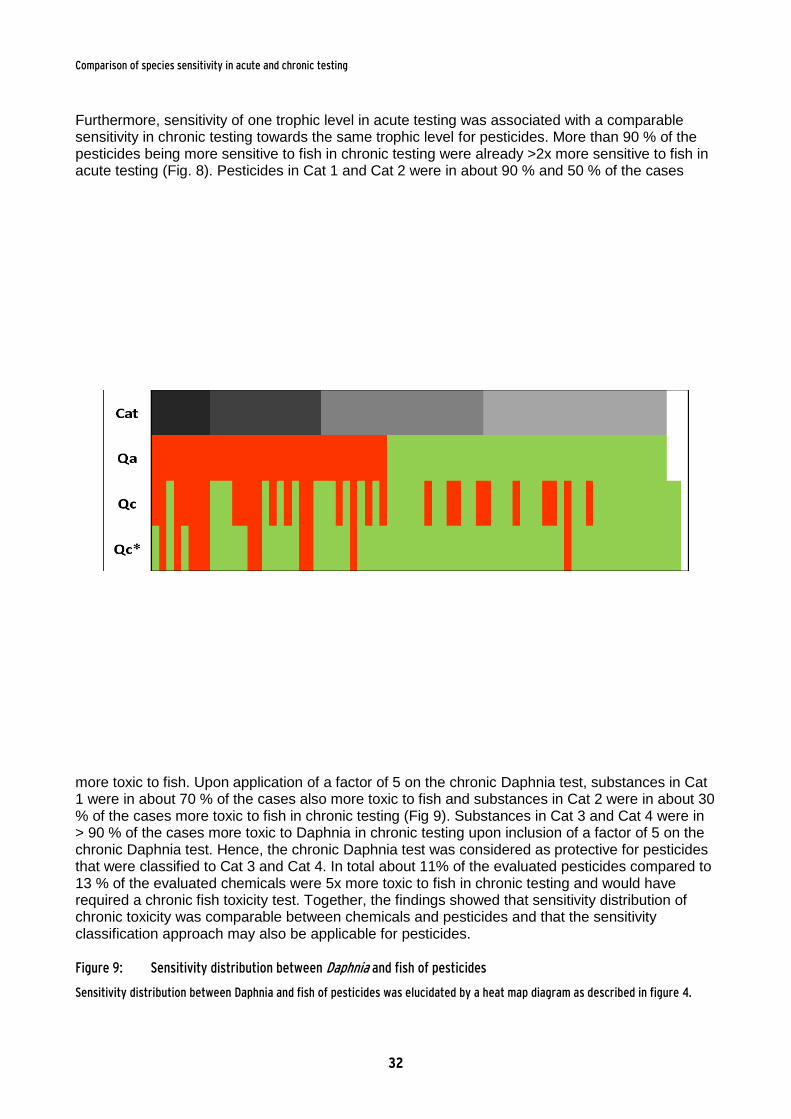
Figure 9: Sensitivity distribution between Daphnia and fish of pesticides
Sensitivity distribution between Daphnia and fish of pesticides was elucidated by a heat map diagram as described in figure 4.
Comparison of species sensitivity in acute and chronic testing
33
Figure 10: Fish sensitivity of pesticides in each category
Sensitivity of fish was allocated to the classification system. The percentage of substances being more toxic to fish in chronic
testing and exhibiting a quotientchronic <1 was evaluated for each classification class (black), and the percentage of substances that
were >5x more toxic to fish in chronic testing and exhibited a quotientchronic <0.2 were evaluated for each class (grey).
Comparison of species sensitivity in acute and chronic testing
34
5.5 Octanol-water partitioning coefficient
5.5.1 Relationship between species sensitivity and Kow
The octanol-water partitioning coefficient of a substance may be relevant for chronic fish
toxicity as a high Kow is considered to be related with the potential of bioaccumulation (EC,
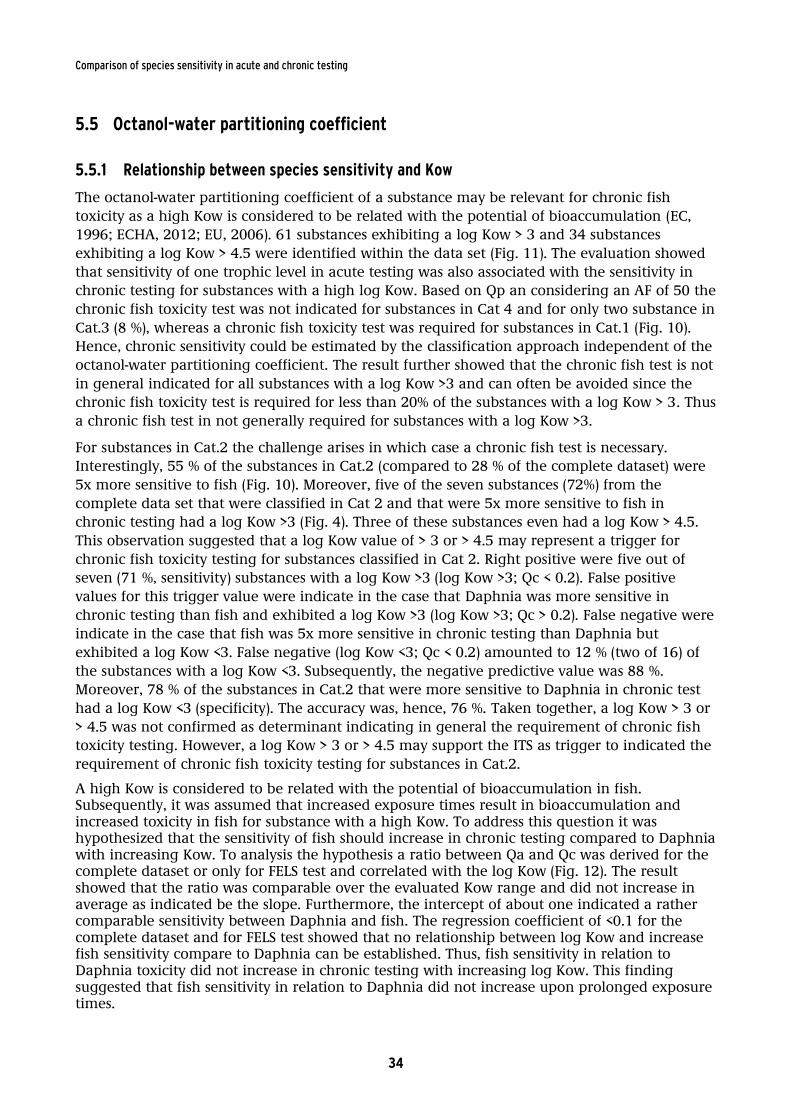
1996; ECHA, 2012; EU, 2006). 61 substances exhibiting a log Kow > 3 and 34 substances
exhibiting a log Kow > 4.5 were identified within the data set (Fig. 11). The evaluation showed
that sensitivity of one trophic level in acute testing was also associated with the sensitivity in
chronic testing for substances with a high log Kow. Based on Qp an considering an AF of 50 the
chronic fish toxicity test was not indicated for substances in Cat 4 and for only two substance in
Cat.3 (8 %), whereas a chronic fish toxicity test was required for substances in Cat.1 (Fig. 10).
Hence, chronic sensitivity could be estimated by the classification approach independent of the
octanol-water partitioning coefficient. The result further showed that the chronic fish test is not
in general indicated for all substances with a log Kow >3 and can often be avoided since the
chronic fish toxicity test is required for less than 20% of the substances with a log Kow > 3. Thus
a chronic fish test in not generally required for substances with a log Kow >3.
For substances in Cat.2 the challenge arises in which case a chronic fish test is necessary.
Interestingly, 55 % of the substances in Cat.2 (compared to 28 % of the complete dataset) were
5x more sensitive to fish (Fig. 10). Moreover, five of the seven substances (72%) from the
complete data set that were classified in Cat 2 and that were 5x more sensitive to fish in
chronic testing had a log Kow >3 (Fig. 4). Three of these substances even had a log Kow > 4.5.
This observation suggested that a log Kow value of > 3 or > 4.5 may represent a trigger for
chronic fish toxicity testing for substances classified in Cat 2. Right positive were five out of
seven (71 %, sensitivity) substances with a log Kow >3 (log Kow >3; Qc < 0.2). False positive
values for this trigger value were indicate in the case that Daphnia was more sensitive in
chronic testing than fish and exhibited a log Kow >3 (log Kow >3; Qc > 0.2). False negative were
indicate in the case that fish was 5x more sensitive in chronic testing than Daphnia but
exhibited a log Kow <3. False negative (log Kow <3; Qc < 0.2) amounted to 12 % (two of 16) of
the substances with a log Kow <3. Subsequently, the negative predictive value was 88 %.
Moreover, 78 % of the substances in Cat.2 that were more sensitive to Daphnia in chronic test
had a log Kow <3 (specificity). The accuracy was, hence, 76 %. Taken together, a log Kow > 3 or
> 4.5 was not confirmed as determinant indicating in general the requirement of chronic fish
toxicity testing. However, a log Kow > 3 or > 4.5 may support the ITS as trigger to indicated the
requirement of chronic fish toxicity testing for substances in Cat.2.
A high Kow is considered to be related with the potential of bioaccumulation in fish. Subsequently, it was assumed that increased exposure times result in bioaccumulation and increased toxicity in fish for substance with a high Kow. To address this question it was hypothesized that the sensitivity of fish should increase in chronic testing compared to Daphnia with increasing Kow. To analysis the hypothesis a ratio between Qa and Qc was derived for the complete dataset or only for FELS test and correlated with the log Kow (Fig. 12). The result showed that the ratio was comparable over the evaluated Kow range and did not increase in average as indicated be the slope. Furthermore, the intercept of about one indicated a rather comparable sensitivity between Daphnia and fish. The regression coefficient of <0.1 for the complete dataset and for FELS test showed that no relationship between log Kow and increase fish sensitivity compare to Daphnia can be established. Thus, fish sensitivity in relation to Daphnia toxicity did not increase in chronic testing with increasing log Kow. This finding suggested that fish sensitivity in relation to Daphnia did not increase upon prolonged exposure times.
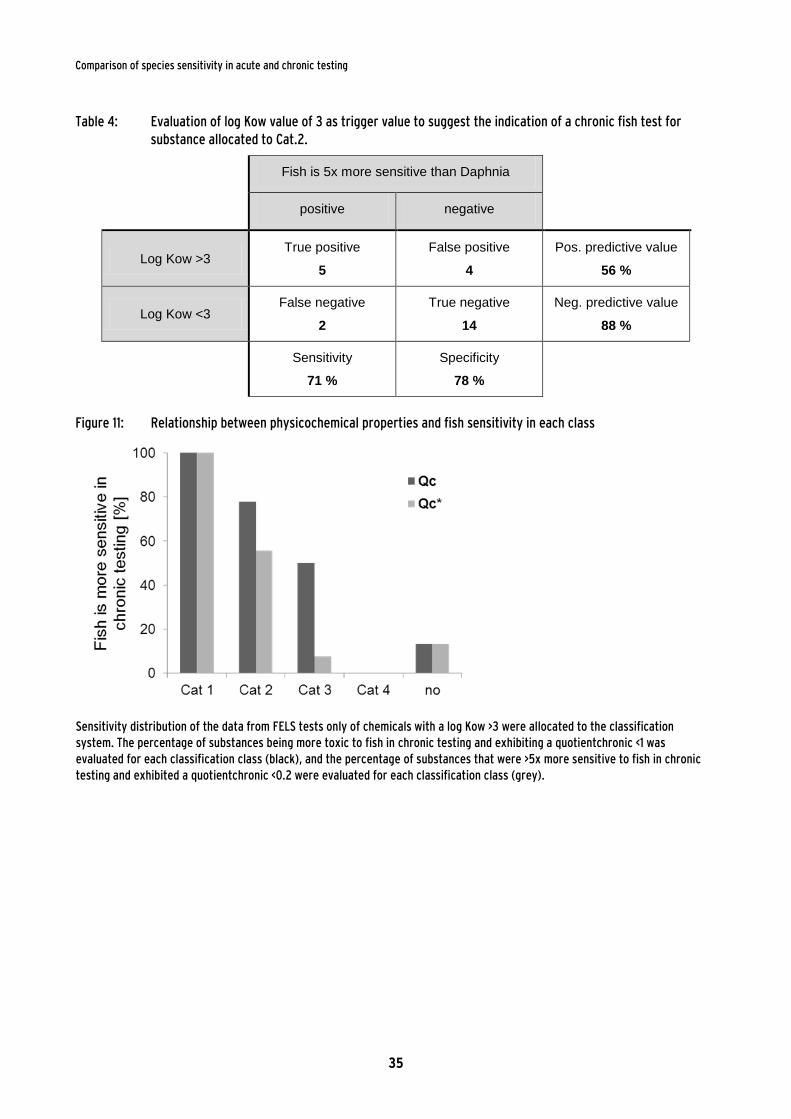
Comparison of species sensitivity in acute and chronic testing
35
Table 4: Evaluation of log Kow value of 3 as trigger value to suggest the indication of a chronic fish test for
substance allocated to Cat.2.
Fish is 5x more sensitive than Daphnia
positive negative
Log Kow >3 True positive
5
False positive
4
Pos. predictive value
56 %
Log Kow <3 False negative
2
True negative
14
Neg. predictive value
88 %
Sensitivity
71 %
Specificity
78 %
Figure 11: Relationship between physicochemical properties and fish sensitivity in each class
Sensitivity distribution of the data from FELS tests only of chemicals with a log Kow >3 were allocated to the classification
system. The percentage of substances being more toxic to fish in chronic testing and exhibiting a quotientchronic <1 was
evaluated for each classification class (black), and the percentage of substances that were >5x more sensitive to fish in chronic
testing and exhibited a quotientchronic <0.2 were evaluated for each classification class (grey).
Comparison of species sensitivity in acute and chronic testing
36
Figure 12: Relationship between physicochemical properties and sensitivity distribution
A
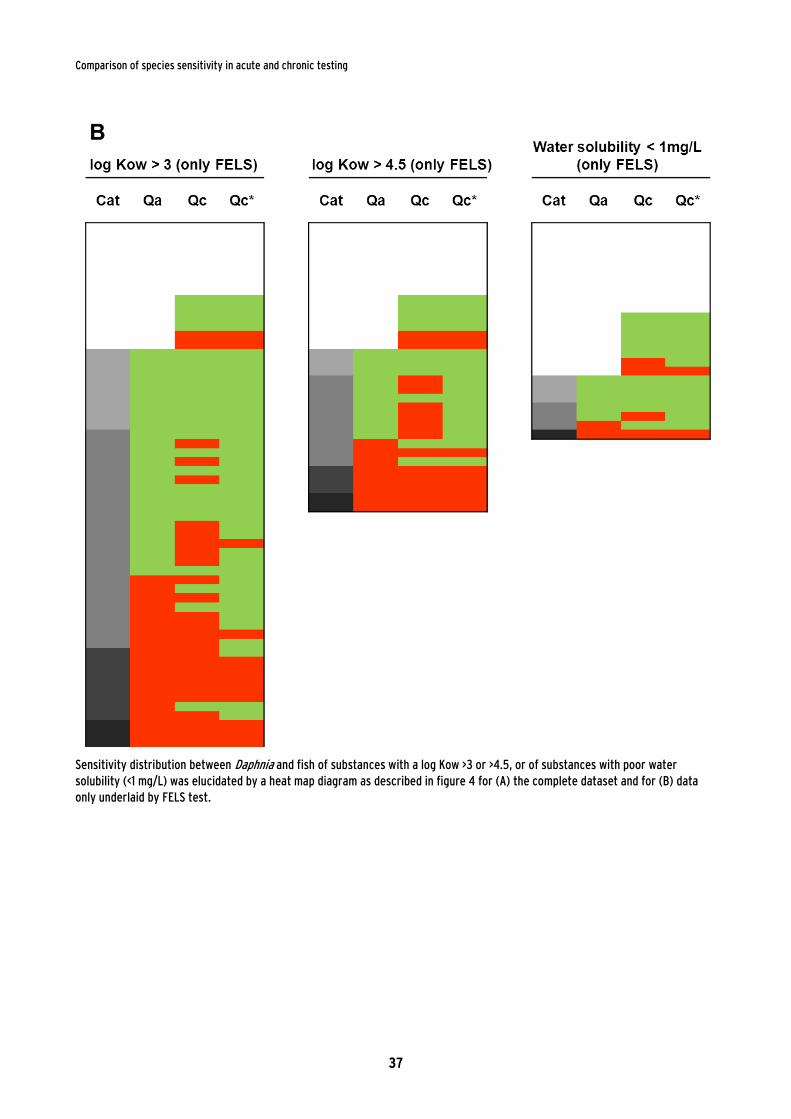
Comparison of species sensitivity in acute and chronic testing
37
Sensitivity distribution between Daphnia and fish of substances with a log Kow >3 or >4.5, or of substances with poor water
solubility (<1 mg/L) was elucidated by a heat map diagram as described in figure 4 for (A) the complete dataset and for (B) data
only underlaid by FELS test.
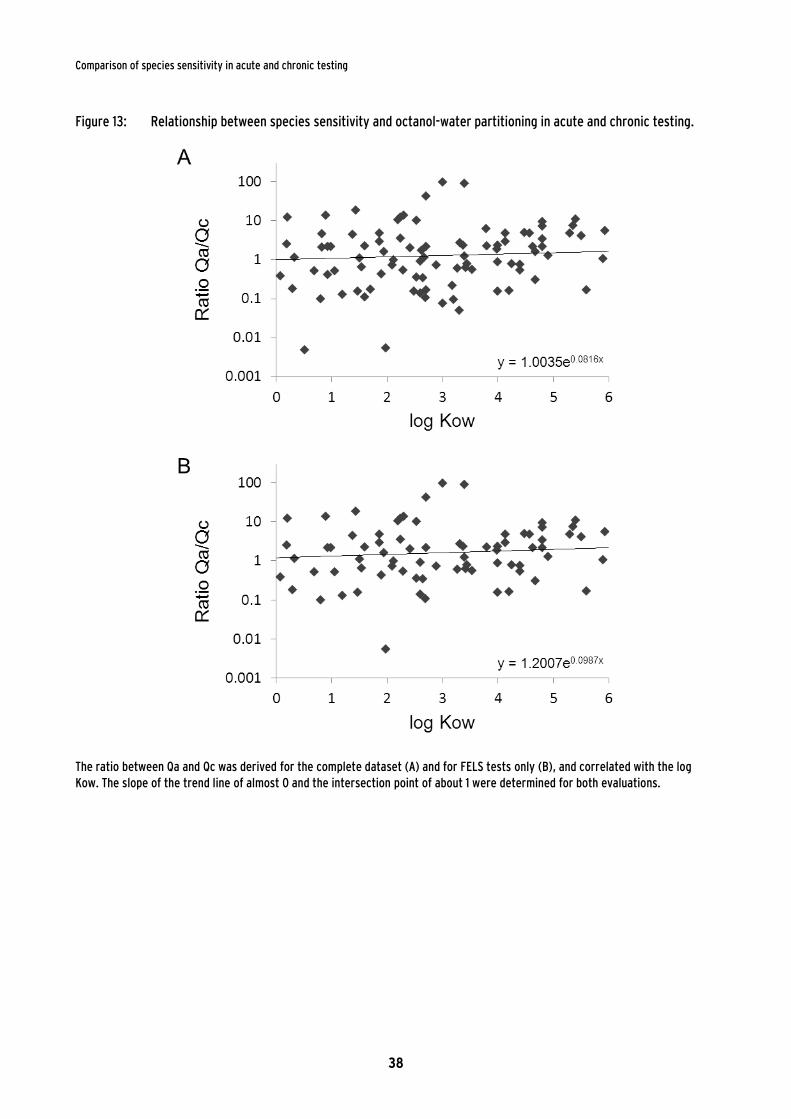
Comparison of species sensitivity in acute and chronic testing
38
Figure 13: Relationship between species sensitivity and octanol-water partitioning in acute and chronic testing.
The ratio between Qa and Qc was derived for the complete dataset (A) and for FELS tests only (B), and correlated with the log
Kow. The slope of the trend line of almost 0 and the intersection point of about 1 were determined for both evaluations.
Comparison of species sensitivity in acute and chronic testing
39
5.5.2 Correlation of ACR and octanol-water partitioning coefficient
A high octanol-water partitioning coefficient log Kow >3 and a log Kow > 4.5 is considered to
be associated with the potential of bioaccumulation or bioconcentration, respectively.
Therefore, it has been suggested that low concentrations of a substance with high Kow may
accumulate in the organism and may result in toxic effects when reaching a steady state upon
long term exposure (ECHA, 2012). The median ACR for both trophic levels was allocated to the
indicated log Kow classes each representing one Kow magnitude (Fig. 13). Although slightly
increased ACR for fish and were determined at log Kow <1 and log Kow >4 compared to the
log Kow from 1 to 4 no significant differences could be determined for a log Kow class as the
p-values of each class compared to the remaining dataset were determined to be >0.05 by the
Mann-Whitney U-test using Statistica. Thus, the result in figure 13A showed that the median
ACR for fish and Daphnia was almost comparable for all classes. Furthermore, correlation of
single data points in figure 13 B and C showed that a relationship for the data set could not be
established since the slope of the regression line almost equaled 0.
Statistical evaluation of substances exhibiting a log Kow > 4.5 resulted in a median of 4.2 and a
90%-ile value of 24.6 for Daphnia. This result indicated that the hazard assessment applying an
ACR of 100 is protective in any case and that an ACR of 100 may overestimate chronic Daphnia
toxicity. For fish the median ACR of 16.0 was increased by a factor of about 1.5 compared to
the complete dataset. Compared to the remaining dataset the increase of the median ACR was
not significant and a p-value of >0.05 was determined compared to the remaining dataset by
the Mann-Whitney U-test using Statistica. Furthermore, the 90%-ile value of 42.6 was decreased
and did not exceed 100 in any case (Table 3). Again the result suggested that the hazard
assessment for fish and substances exhibiting a log Kow > 4.5 is protective in any case by using
an ACR of 100.
For substances exhibiting a log Kow > 3 the ACR evaluation resulted in a median of 6.3 and a
90%-ile value of 47.1 for Daphnia as well as in a median of 10.5 and a 90%-ile value of 67 for
fish. Compared to the complete dataset the median value and the 90%-ile value for fish were
almost comparable and no significant differences were determined by the Mann-Whitney U-test
using Statistica. Taken together, no relationship between Kow and ACR could be established.
This observation is in line with results reported by Ahlers et al. (2006). Since the EU guidance
documents use and ACR of 100 as safety factor the 90%-ile value can be considered as relevant
statistical threshold. The ACR at high Kow appeared to be reduced compared to the ACR of the
complete dataset (Table 3). The results further suggested that the hazard assessment for fish
and substances exhibiting a log Kow > 4.5 is protective in any case and that an ACR of 100
may, hence, overestimate chronic toxicity in this case.
According to the guidance documents, it has been suggested that with a potential to
bioaccumulate (log Kow > 3), the need for long-term testing is more compelling (TNG, page
180) and that long-term toxicity testing shall be considered […] for substances in quantities > 10
t with log Kow >3 (R7B, page 53)(EC, 1996; ECHA, 2012). This evaluation showed that increased
ACR were probably not associated with high Kow values. Thus, it is indicated that long term
testing is not generally required for substances with a log Kow >3.
Increased ACRs (ACR > 100) were preferentially observed for a log Kow range of 2 to 3.5 and
for log Kow values <1. Substances with medium log Kow may exhibit specific distribution
properties as these substances partition in the water phase, but also in the lipophilic
membrane. In contrast, substances with either high or low log Kow accumulate in the
respective compartment (lipophilic or water). Lipophilic substances may exert toxic effects
already in short-term testing due to narcosis and subsequently increased chronic toxicity is not
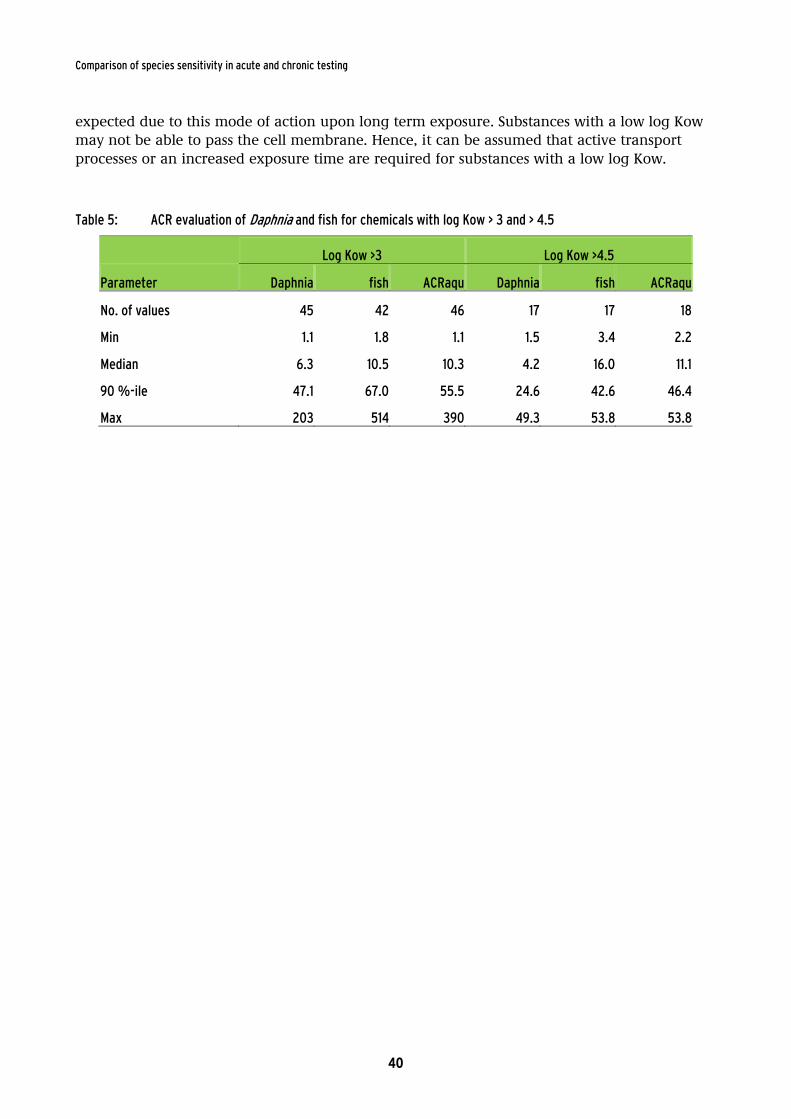
Comparison of species sensitivity in acute and chronic testing
40
expected due to this mode of action upon long term exposure. Substances with a low log Kow
may not be able to pass the cell membrane. Hence, it can be assumed that active transport
processes or an increased exposure time are required for substances with a low log Kow.
Table 5: ACR evaluation of Daphnia and fish for chemicals with log Kow > 3 and > 4.5
Log Kow >3 Log Kow >4.5
Parameter Daphnia fish ACRaqu Daphnia fish ACRaqu
No. of values 45 42 46 17 17 18
Min 1.1 1.8 1.1 1.5 3.4 2.2
Median 6.3 10.5 10.3 4.2 16.0 11.1
90 %-ile 47.1 67.0 55.5 24.6 42.6 46.4
Max 203 514 390 49.3 53.8 53.8
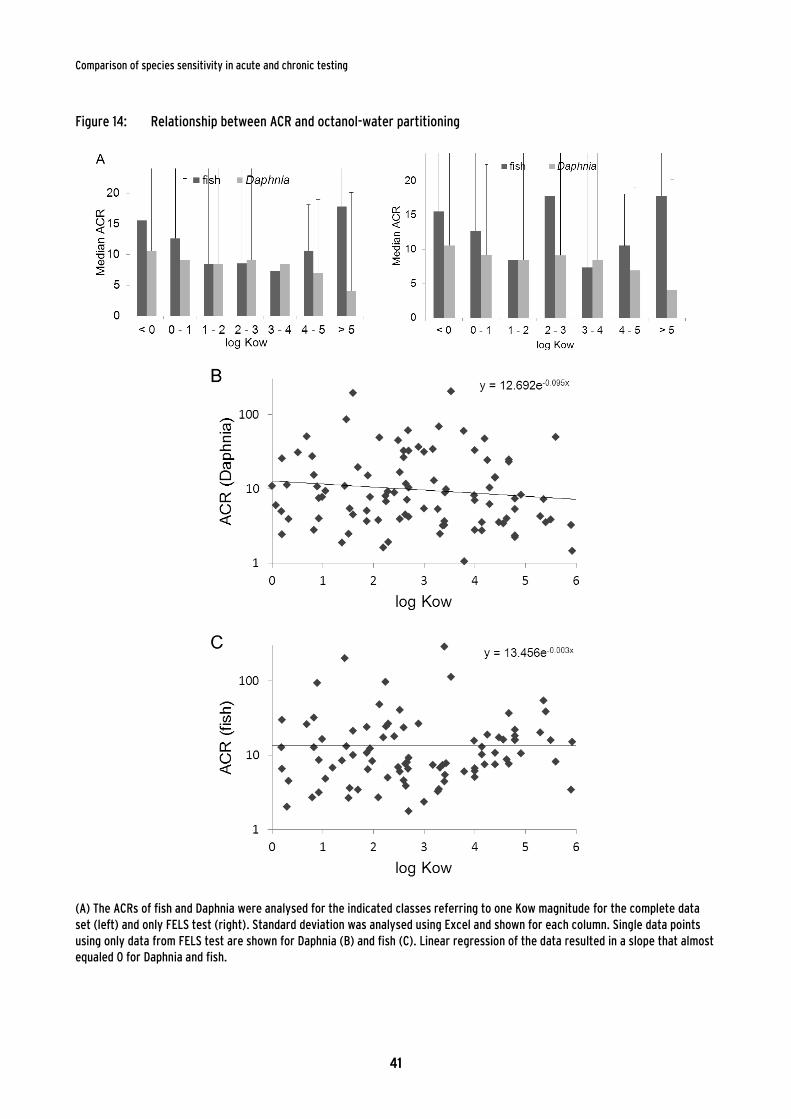
Comparison of species sensitivity in acute and chronic testing
41
Figure 14: Relationship between ACR and octanol-water partitioning
(A) The ACRs of fish and Daphnia were analysed for the indicated classes referring to one Kow magnitude for the complete data
set (left) and only FELS test (right). Standard deviation was analysed using Excel and shown for each column. Single data points
using only data from FELS test are shown for Daphnia (B) and fish (C). Linear regression of the data resulted in a slope that almost
equaled 0 for Daphnia and fish.
Comparison of species sensitivity in acute and chronic testing
42
5.6 Poor water solubility
5.6.1 Relationship between species sensitivity and poor water solubility
The data set included 27 substances exhibiting poor water solubility (< 1 mg/L) (Fig. 10). It is
important to note that poor water solubility was often associated with a Kow >3 (80 %
coincidence). The majority of substances showed no toxic effect in acute testing but 50 % of
these substances exhibited a toxic effect in chronic testing (Fig. 10). This result confirmed that
chronic testing should be considered for substances that show no acute toxicity up to the
solubility limit and if a relevant exposure with a PEC > 1/100th of the water solubility is
expected (ECHA, 2008). Second, it was confirmed that a test on invertebrate is protective and
should normally be conducted according to the guidance (ECHA, 2008) since only in one case
(< 5%) a chronic fish toxicity would have been underestimated if a chronic fish test was not
conducted.
Nine of the poor water soluble substances showed acute toxicity (Fig. 11). The evaluation
represented a limited data set and conclusions should be handled with care until further data
will be available. However, the results supposed that the categorization system is applicable
since chronic fish toxicity test is indicated for Cat 1 substances, but likely not required for
substances in Cat 3 and 4. In total, the chronic fish test was indicated for 3 from 27 substances.
Thus, poor water solubility was in general not confirmed as determinant indicating the
requirement of chronic fish toxicity testing since chronic testing of fish was only indicated in
about 11 % of the cases.
5.6.2 Correlation of ACR and poor water solubility
Acute and chronic toxicity was determined for 9 substances for Daphnia and for 6 substances
for fish (Table 4). The acute to chronic ratio for low water soluble substances ranged from 1.5 to
68.8 (median 5.1) for Daphnia and from 1.9 to 26.0 (median 3.5) for fish. Using the most
sensitive trophic level the ACRaqu ranged from 1.6 to 30.0 (median 6.2). 90 %-ile ACRs were
determined to 24.6 for Daphnia, 8.7 for fish and 7.6 for the most sensitive trophic level (Table
4). Thus, poor water solubility was not associated with increased ACRs. Indeed, the ACR were
markedly reduced compared to the average ACR of the complete dataset. In neither case an AF
of 100 was exceeded and would have covered the NOEC from the chronic study. This finding
supposed that an acute to chronic extrapolation is protective for poor water soluble substances
if acute toxicity was determined.
Taken together, the evaluation represents a limited data set. Nevertheless, poor water solubility
was in general not confirmed as determinant indicating the requirement of chronic fish
toxicity testing since chronic fish toxicity testing was indicated in less than 10 % of the cases
and species sensitivity as well as ACR could be adequately evaluated.
Comparison of species sensitivity in acute and chronic testing
43
Table 6: ACR evaluation of Daphnia and fish for chemicals with water solubility < 1 mg/L
low water solubility (<1 mg/L)
Parameter Daphnia fish ACRaqu
No. of values 9 6 9
Min 1.5 1.9 1.6
Median 4.3 6.1 6.2
90 %-ile n.a. n.a. n.a.
Max 68.8 26.0 30.0
5.7 Quality criteria of fish chronic testing
The data for fish toxicity represented a heterogeneous dataset with a variety of species and
chronic study types. Therefore, quality criteria were defined and tests were subdivided into
FELS studies (n=129) and other chronic study types representing the non-FELS studies (n=40)
within the dataset. FELS studies represent the vast majority in the data set and thereby
dominate the overall results. The result showed that the type of chronic test affected the
average sensitivity distribution. While sensitivity of Daphnia and fish was now comparable if
only FELS tests were considered for fish, substance entries underlaid with non-FELS tests
exhibited in average an increased sensitivity to Daphnia in chronic testing (Fig. 14 and Fig.15).
This result suggested that the type of chronic test effected the average sensitivity distribution.
However, the result shown in figure 14 B was almost comparable to the result of the complete
dataset in figure 6. The applicability of the categorization system was also confirmed if only
FELS tests were considered since the chronic Daphnia test was still indicated for Cat.3 and Cat.4
whereas the fish test was required for Cat.1 to avoid underestimation of fish toxicity by
extrapolation from chronic Daphnia data. Again a chronic fish test was not indicated for Cat.4
and in 7% of the cases for Cat.3. In total, a confidence interval of 95 % was determined for
substance with a Qa >0.5 in Cat.3 and Cat.4 since the chronic fish test was indicated for 5 % of
the substances. Moreover, the fish test was required in Cat.2 for about 28 % for the substances
of the complete dataset compare to about 33 % of the substances for Cat.2 if only FELS test
were considered.
For ACR evaluation different quality criteria were defined corresponding to the methodology
applied previously (Ahlers et al., 2006). The first (ACR1) included all data across all fish species
and test types (Table 5. The second (ACR2) included all test types but was confined to data with
acute and chronic results from the same species whereas the third (ACR3) was confined to data
from different species. The fourth (ACR4) was restricted to chronic toxicity testing conducted
according or equivalent to OECD 210 and the fifth (ACR5) included all chronic studies that
were not conducted according or equivalent to OECD 210 representing the non-FELS studies
within the dataset. ACR6 only included FELS test on the same species in acute and chronic
testing. ACR7 and ACR8 included FELS tests from organic chemicals only.
ACR1, ARC2 and ACR3 showed comparable median values indicating that statistical ACR
medians did not differ between evaluations using the same species and evaluations with
species differentiation. The 90%-ile value of ACR2 species specific ACRs was reduced compared
to ARC1 and ACR3 whereas ACR3 was increased compared to ARC1 and ACR2. Furthermore, a
10%-ile value was 3.4 for the ACR2 whereas a value of 2.7 was determined for inter-species
ACRs (data not shown). Thus, the inter-species ACRs showed a 41 fold range between the 10%-
Comparison of species sensitivity in acute and chronic testing
44
ile and the 90%-ile value whereas species specific ACRs showed a 19 fold range. This
observation suggested that the variance in data distribution is increased using evaluations of
different species.
The study type of chronic testing appeared to have an effect on the ACR, as well. FELS based
studies showed a median ACR4 of 13.0 and a 90%-ile value of 81.8 (Table 5). The median ACR5
of 7.2 and the 90%-ile value of 36.6 of non-FELS studies were reduced compared to the FELS
based studies. Hence, ACR of FELS studies was in average about 1.8 fold larger than ACR of
non-FELS studies. Thus, FELS based studies appeared to be more sensitive to determine chronic
toxicity compared to other studies types and may be considered as more conservative.
However, the result on non-FELS studies is based on a limited dataset (n= 23) and interpretation
should be handled with care and on a case by case evaluation since different tests types were
not compared for the same substance.
ACR6 and ARC8 were considered as data with the highest statistical data quality since only FELS
test that were confined to data with acute and chronic results from the same species were
included. The median was determined to 12.2 and the 90%-ile was calculated to 63.5 for ACR6.
ACR8 only included FELS tests from organic chemicals. The median was determined to 10.4 and
the 90%-ile was calculated to 63.5. 5% of the substance had an ACR >100.
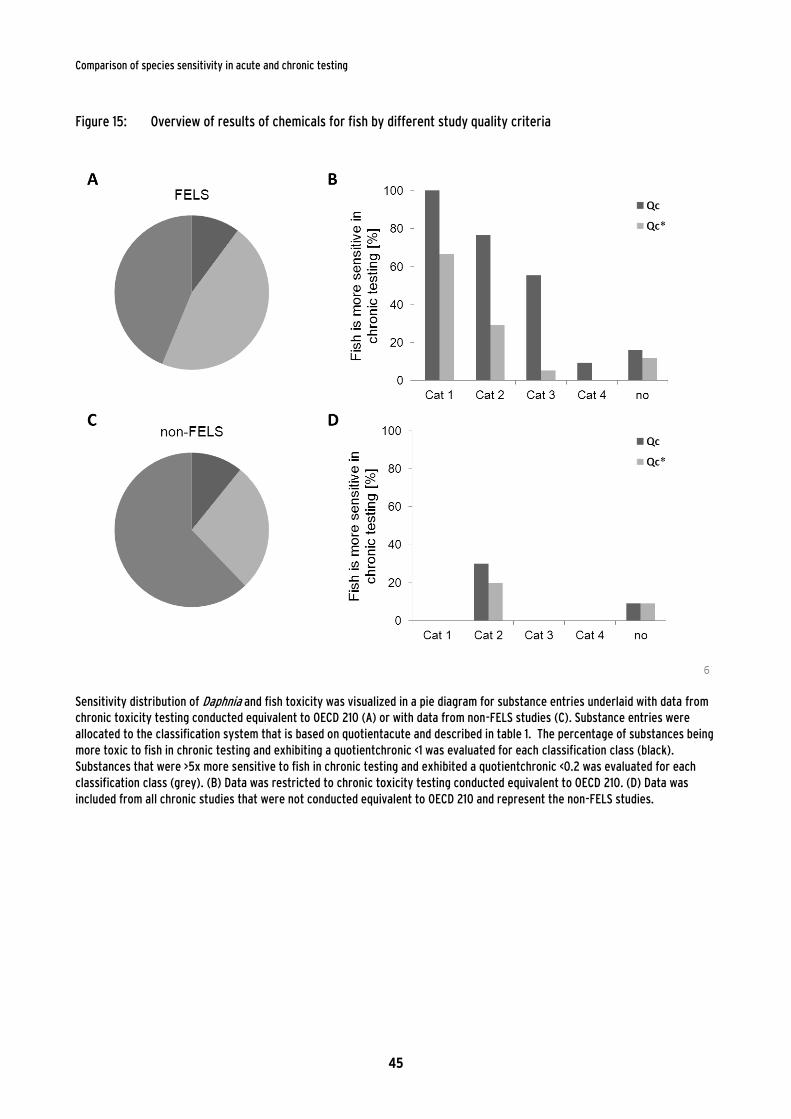
Comparison of species sensitivity in acute and chronic testing
45
Figure 15: Overview of results of chemicals for fish by different study quality criteria
Sensitivity distribution of Daphnia and fish toxicity was visualized in a pie diagram for substance entries underlaid with data from
chronic toxicity testing conducted equivalent to OECD 210 (A) or with data from non-FELS studies (C). Substance entries were
allocated to the classification system that is based on quotientacute and described in table 1. The percentage of substances being
more toxic to fish in chronic testing and exhibiting a quotientchronic <1 was evaluated for each classification class (black).
Substances that were >5x more sensitive to fish in chronic testing and exhibited a quotientchronic <0.2 was evaluated for each
classification class (grey). (B) Data was restricted to chronic toxicity testing conducted equivalent to OECD 210. (D) Data was
included from all chronic studies that were not conducted equivalent to OECD 210 and represent the non-FELS studies.
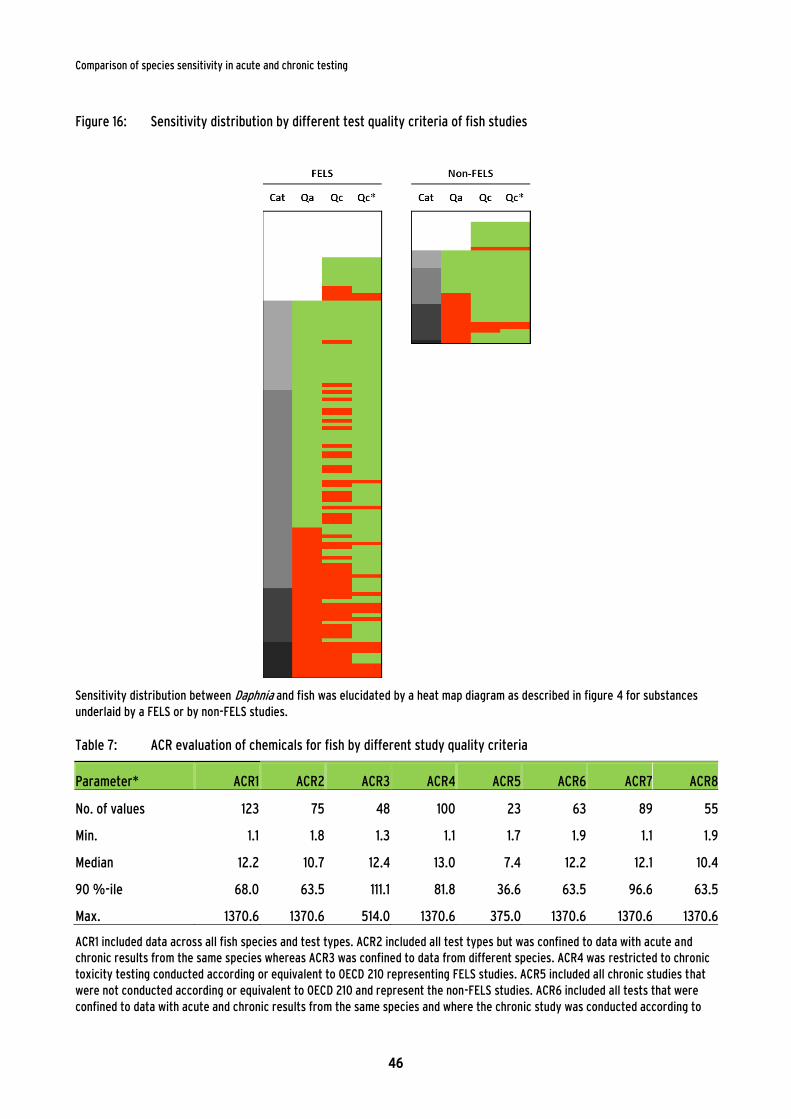
Comparison of species sensitivity in acute and chronic testing
46
Figure 16: Sensitivity distribution by different test quality criteria of fish studies
Sensitivity distribution between Daphnia and fish was elucidated by a heat map diagram as described in figure 4 for substances
underlaid by a FELS or by non-FELS studies.
Table 7: ACR evaluation of chemicals for fish by different study quality criteria
Parameter* ACR1 ACR2 ACR3 ACR4 ACR5 ACR6 ACR7 ACR8
No. of values 123 75 48 100 23 63 89 55
Min. 1.1 1.8 1.3 1.1 1.7 1.9 1.1 1.9
Median 12.2 10.7 12.4 13.0 7.4 12.2 12.1 10.4
90 %-ile 68.0 63.5 111.1 81.8 36.6 63.5 96.6 63.5
Max. 1370.6 1370.6 514.0 1370.6 375.0 1370.6 1370.6 1370.6
ACR1 included data across all fish species and test types. ACR2 included all test types but was confined to data with acute and
chronic results from the same species whereas ACR3 was confined to data from different species. ACR4 was restricted to chronic
toxicity testing conducted according or equivalent to OECD 210 representing FELS studies. ACR5 included all chronic studies that
were not conducted according or equivalent to OECD 210 and represent the non-FELS studies. ACR6 included all tests that were
confined to data with acute and chronic results from the same species and where the chronic study was conducted according to
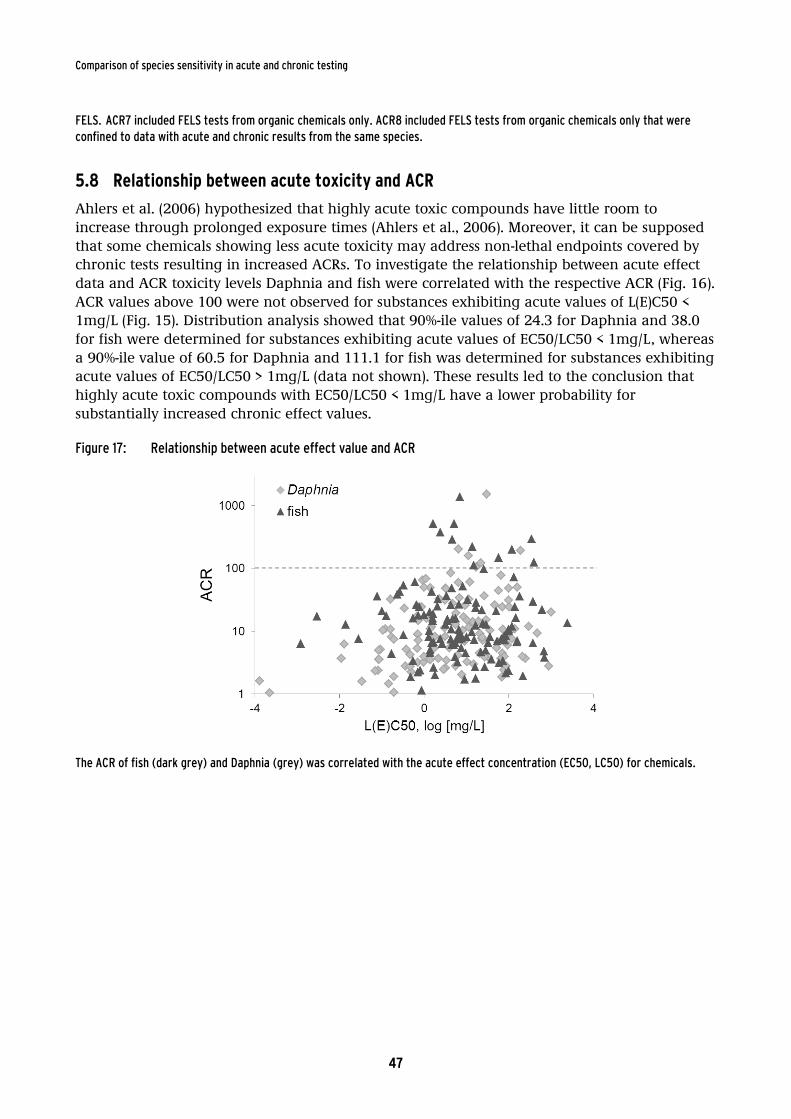
Comparison of species sensitivity in acute and chronic testing
47
FELS. ACR7 included FELS tests from organic chemicals only. ACR8 included FELS tests from organic chemicals only that were
confined to data with acute and chronic results from the same species.
5.8 Relationship between acute toxicity and ACR
Ahlers et al. (2006) hypothesized that highly acute toxic compounds have little room to
increase through prolonged exposure times (Ahlers et al., 2006). Moreover, it can be supposed
that some chemicals showing less acute toxicity may address non-lethal endpoints covered by
chronic tests resulting in increased ACRs. To investigate the relationship between acute effect
data and ACR toxicity levels Daphnia and fish were correlated with the respective ACR (Fig. 16).
ACR values above 100 were not observed for substances exhibiting acute values of L(E)C50 <
1mg/L (Fig. 15). Distribution analysis showed that 90%-ile values of 24.3 for Daphnia and 38.0
for fish were determined for substances exhibiting acute values of EC50/LC50 < 1mg/L, whereas
a 90%-ile value of 60.5 for Daphnia and 111.1 for fish was determined for substances exhibiting
acute values of EC50/LC50 > 1mg/L (data not shown). These results led to the conclusion that
highly acute toxic compounds with EC50/LC50 < 1mg/L have a lower probability for
substantially increased chronic effect values.
Figure 17: Relationship between acute effect value and ACR
The ACR of fish (dark grey) and Daphnia (grey) was correlated with the acute effect concentration (EC50, LC50) for chemicals.
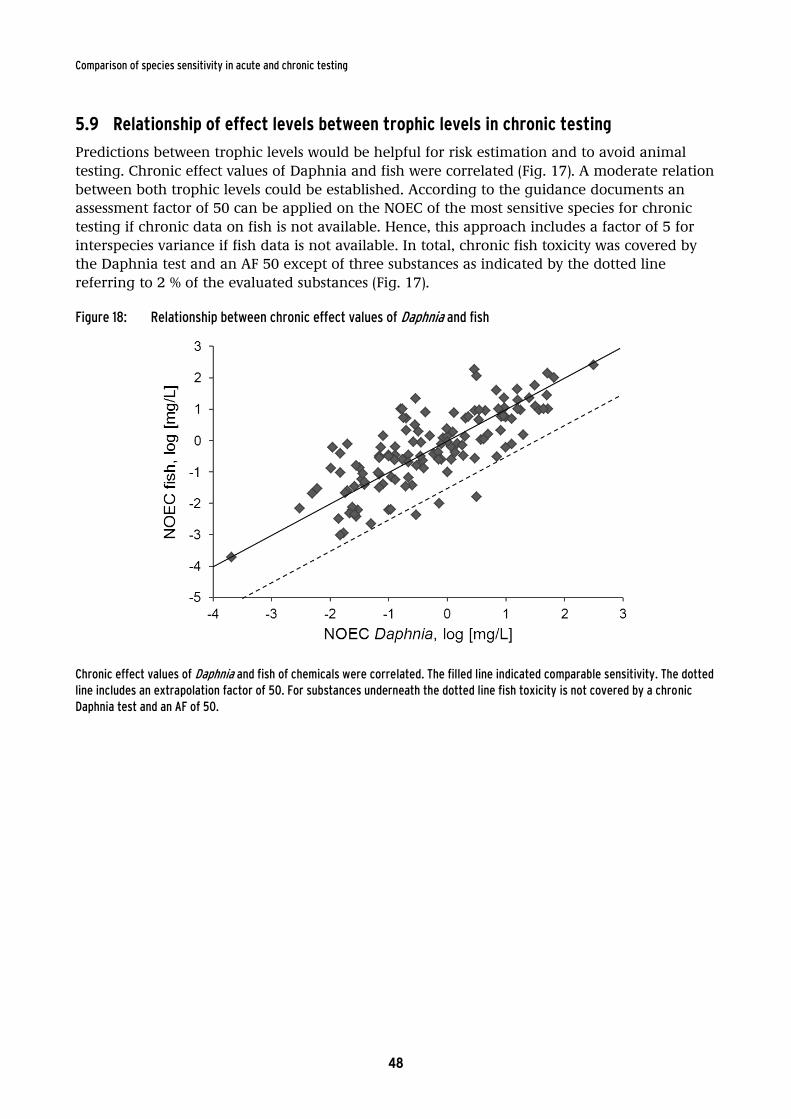
Comparison of species sensitivity in acute and chronic testing
48
5.9 Relationship of effect levels between trophic levels in chronic testing
Predictions between trophic levels would be helpful for risk estimation and to avoid animal
testing. Chronic effect values of Daphnia and fish were correlated (Fig. 17). A moderate relation
between both trophic levels could be established. According to the guidance documents an
assessment factor of 50 can be applied on the NOEC of the most sensitive species for chronic
testing if chronic data on fish is not available. Hence, this approach includes a factor of 5 for
interspecies variance if fish data is not available. In total, chronic fish toxicity was covered by
the Daphnia test and an AF 50 except of three substances as indicated by the dotted line
referring to 2 % of the evaluated substances (Fig. 17).
Figure 18: Relationship between chronic effect values of Daphnia and fish
Chronic effect values of Daphnia and fish of chemicals were correlated. The filled line indicated comparable sensitivity. The dotted
line includes an extrapolation factor of 50. For substances underneath the dotted line fish toxicity is not covered by a chronic
Daphnia test and an AF of 50.
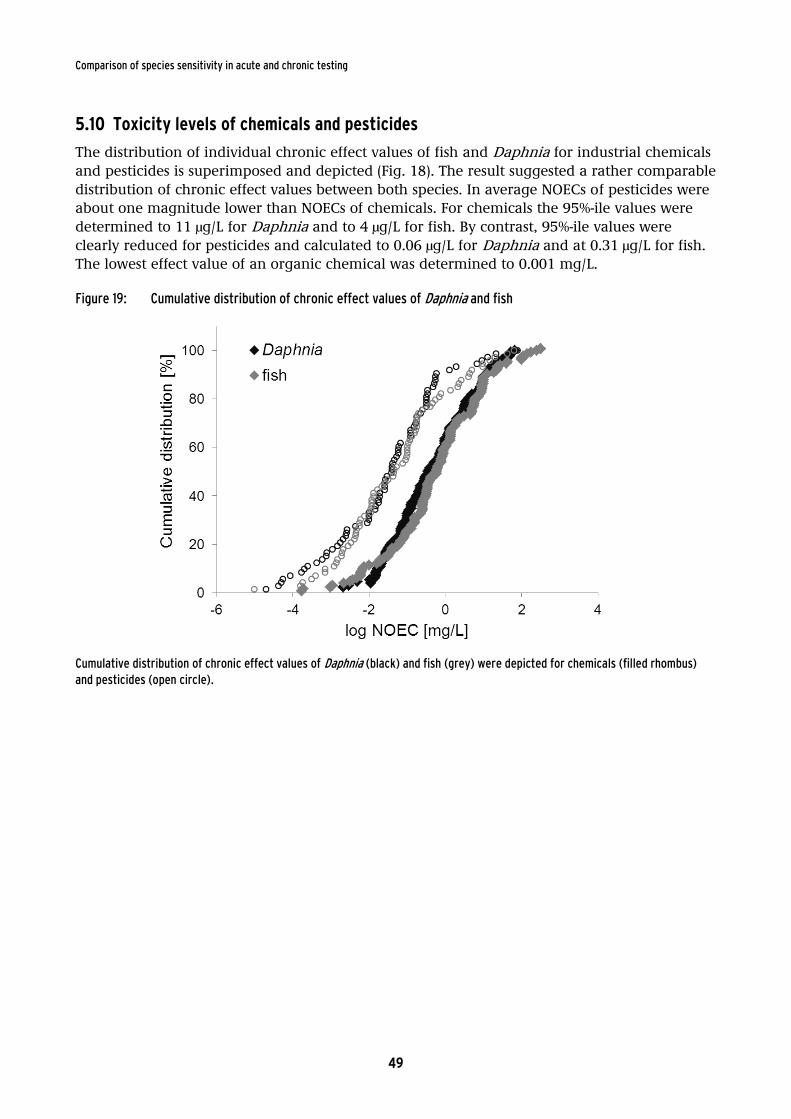
Comparison of species sensitivity in acute and chronic testing
49
5.10 Toxicity levels of chemicals and pesticides
The distribution of individual chronic effect values of fish and Daphnia for industrial chemicals
and pesticides is superimposed and depicted (Fig. 18). The result suggested a rather comparable
distribution of chronic effect values between both species. In average NOECs of pesticides were
about one magnitude lower than NOECs of chemicals. For chemicals the 95%-ile values were
determined to 11 µg/L for Daphnia and to 4 µg/L for fish. By contrast, 95%-ile values were
clearly reduced for pesticides and calculated to 0.06 µg/L for Daphnia and at 0.31 µg/L for fish.
The lowest effect value of an organic chemical was determined to 0.001 mg/L.
Figure 19: Cumulative distribution of chronic effect values of Daphnia and fish
Cumulative distribution of chronic effect values of Daphnia (black) and fish (grey) were depicted for chemicals (filled rhombus)
and pesticides (open circle).
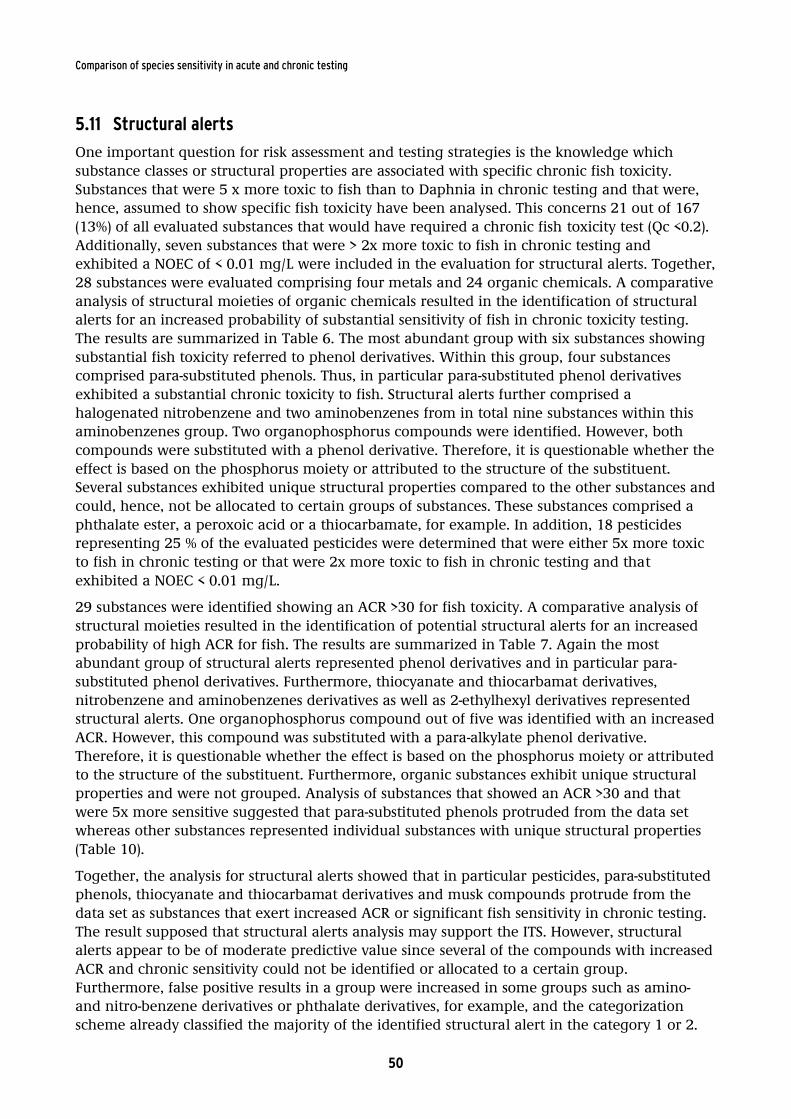
Comparison of species sensitivity in acute and chronic testing
50
5.11 Structural alerts
One important question for risk assessment and testing strategies is the knowledge which
substance classes or structural properties are associated with specific chronic fish toxicity.
Substances that were 5 x more toxic to fish than to Daphnia in chronic testing and that were,
hence, assumed to show specific fish toxicity have been analysed. This concerns 21 out of 167
(13%) of all evaluated substances that would have required a chronic fish toxicity test (Qc <0.2).
Additionally, seven substances that were > 2x more toxic to fish in chronic testing and
exhibited a NOEC of < 0.01 mg/L were included in the evaluation for structural alerts. Together,
28 substances were evaluated comprising four metals and 24 organic chemicals. A comparative
analysis of structural moieties of organic chemicals resulted in the identification of structural
alerts for an increased probability of substantial sensitivity of fish in chronic toxicity testing.
The results are summarized in Table 6. The most abundant group with six substances showing
substantial fish toxicity referred to phenol derivatives. Within this group, four substances
comprised para-substituted phenols. Thus, in particular para-substituted phenol derivatives
exhibited a substantial chronic toxicity to fish. Structural alerts further comprised a
halogenated nitrobenzene and two aminobenzenes from in total nine substances within this
aminobenzenes group. Two organophosphorus compounds were identified. However, both
compounds were substituted with a phenol derivative. Therefore, it is questionable whether the
effect is based on the phosphorus moiety or attributed to the structure of the substituent.
Several substances exhibited unique structural properties compared to the other substances and
could, hence, not be allocated to certain groups of substances. These substances comprised a
phthalate ester, a peroxoic acid or a thiocarbamate, for example. In addition, 18 pesticides
representing 25 % of the evaluated pesticides were determined that were either 5x more toxic
to fish in chronic testing or that were 2x more toxic to fish in chronic testing and that
exhibited a NOEC < 0.01 mg/L.
29 substances were identified showing an ACR >30 for fish toxicity. A comparative analysis of
structural moieties resulted in the identification of potential structural alerts for an increased
probability of high ACR for fish. The results are summarized in Table 7. Again the most
abundant group of structural alerts represented phenol derivatives and in particular para-
substituted phenol derivatives. Furthermore, thiocyanate and thiocarbamat derivatives,
nitrobenzene and aminobenzenes derivatives as well as 2-ethylhexyl derivatives represented
structural alerts. One organophosphorus compound out of five was identified with an increased
ACR. However, this compound was substituted with a para-alkylate phenol derivative.
Therefore, it is questionable whether the effect is based on the phosphorus moiety or attributed
to the structure of the substituent. Furthermore, organic substances exhibit unique structural
properties and were not grouped. Analysis of substances that showed an ACR >30 and that
were 5x more sensitive suggested that para-substituted phenols protruded from the data set
whereas other substances represented individual substances with unique structural properties
(Table 10).
Together, the analysis for structural alerts showed that in particular pesticides, para-substituted
phenols, thiocyanate and thiocarbamat derivatives and musk compounds protrude from the
data set as substances that exert increased ACR or significant fish sensitivity in chronic testing.
The result supposed that structural alerts analysis may support the ITS. However, structural
alerts appear to be of moderate predictive value since several of the compounds with increased
ACR and chronic sensitivity could not be identified or allocated to a certain group.
Furthermore, false positive results in a group were increased in some groups such as amino-
and nitro-benzene derivatives or phthalate derivatives, for example, and the categorization
scheme already classified the majority of the identified structural alert in the category 1 or 2.
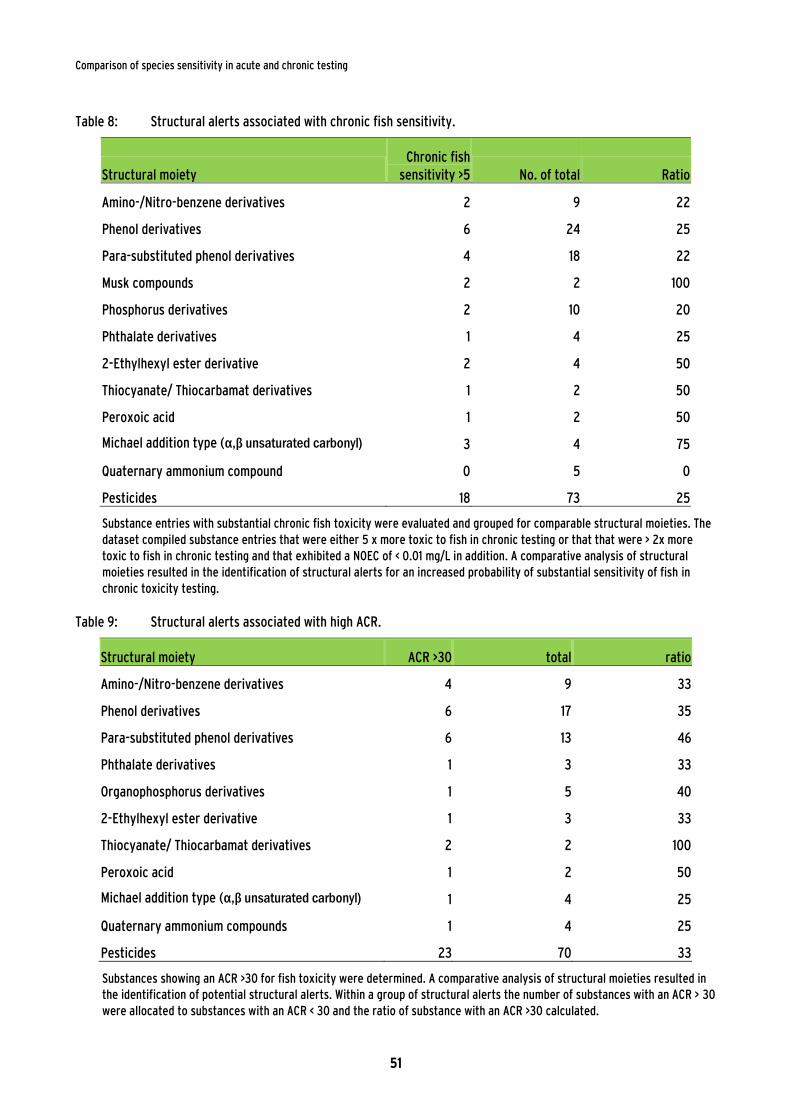
Comparison of species sensitivity in acute and chronic testing
51
Table 8: Structural alerts associated with chronic fish sensitivity.
Structural moiety
Chronic fish
sensitivity >5 No. of total Ratio
Amino-/Nitro-benzene derivatives 2 9 22
Phenol derivatives 6 24 25
Para-substituted phenol derivatives 4 18 22
Musk compounds 2 2 100
Phosphorus derivatives 2 10 20
Phthalate derivatives 1 4 25
2-Ethylhexyl ester derivative 2 4 50
Thiocyanate/ Thiocarbamat derivatives 1 2 50
Peroxoic acid 1 2 50
Michael addition type (α,β unsaturated carbonyl) 3 4 75
Quaternary ammonium compound 0 5 0
Pesticides 18 73 25
Substance entries with substantial chronic fish toxicity were evaluated and grouped for comparable structural moieties. The
dataset compiled substance entries that were either 5 x more toxic to fish in chronic testing or that that were > 2x more
toxic to fish in chronic testing and that exhibited a NOEC of < 0.01 mg/L in addition. A comparative analysis of structural
moieties resulted in the identification of structural alerts for an increased probability of substantial sensitivity of fish in
chronic toxicity testing.
Table 9: Structural alerts associated with high ACR.
Structural moiety ACR >30 total ratio
Amino-/Nitro-benzene derivatives 4 9 33
Phenol derivatives 6 17 35
Para-substituted phenol derivatives 6 13 46
Phthalate derivatives 1 3 33
Organophosphorus derivatives 1 5 40
2-Ethylhexyl ester derivative 1 3 33
Thiocyanate/ Thiocarbamat derivatives 2 2 100
Peroxoic acid 1 2 50
Michael addition type (α,β unsaturated carbonyl) 1 4 25
Quaternary ammonium compounds 1 4 25
Pesticides 23 70 33
Substances showing an ACR >30 for fish toxicity were determined. A comparative analysis of structural moieties resulted in
the identification of potential structural alerts. Within a group of structural alerts the number of substances with an ACR > 30
were allocated to substances with an ACR < 30 and the ratio of substance with an ACR >30 calculated.
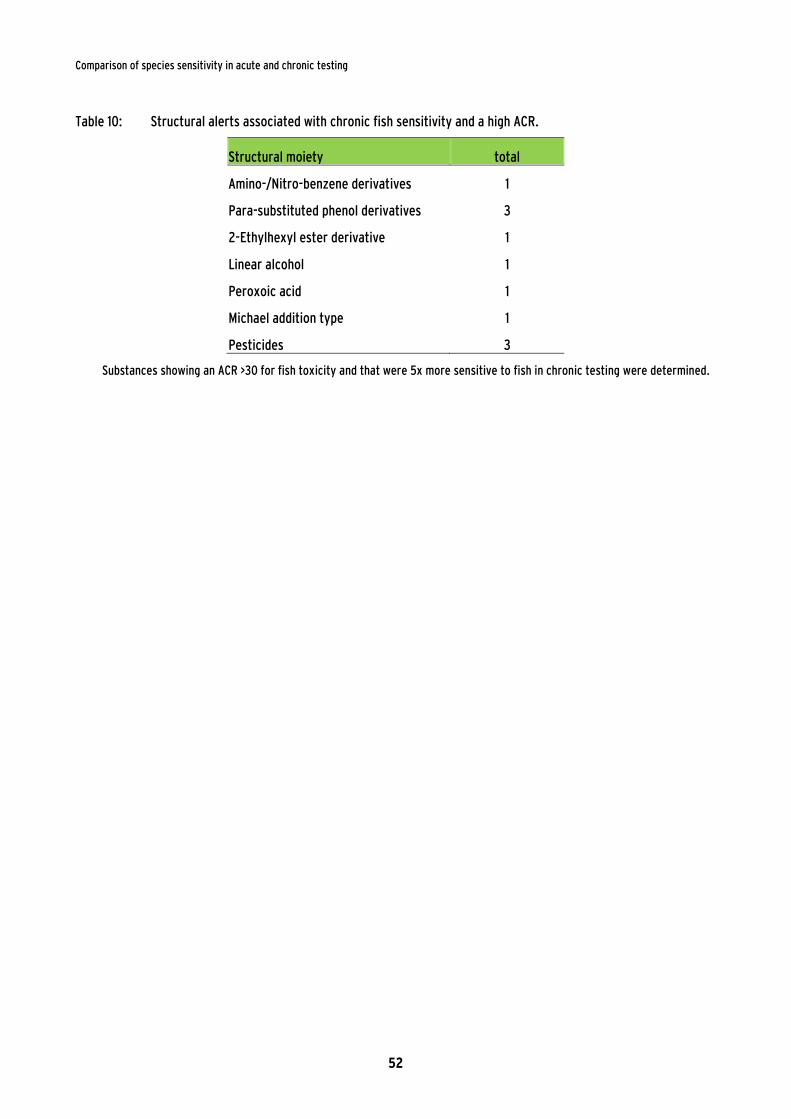
Comparison of species sensitivity in acute and chronic testing
52
Table 10: Structural alerts associated with chronic fish sensitivity and a high ACR.
Structural moiety total
Amino-/Nitro-benzene derivatives 1
Para-substituted phenol derivatives 3
2-Ethylhexyl ester derivative 1
Linear alcohol 1
Peroxoic acid 1
Michael addition type 1
Pesticides 3
Substances showing an ACR >30 for fish toxicity and that were 5x more sensitive to fish in chronic testing were determined.
Comparison of species sensitivity in acute and chronic testing
53
5.12 Risk estimation for exemplarily substances
Exemplarily, a PEC/ PNEC comparison was conducted for 29 substances considering a PNEC
derived from acute data and an AF1000 (PEC/PNECacute), a PNEC derived from chronic
Daphnia data and an AF50 (PEC/PNECcD) and the PNEC derived from chronic data of the most
sensitive trophic level and an AF10 (PEC/PNEC). Cumulative distribution of the PEC/PNEC ratio
is depicted in figure 18A. The variance within the three ratios for one substance is shown in
figure 18B. The PEC/PNEC ratio of 27 substances was <1 representing 92 % of the evaluated
data set. Two substances showed a PEC/PNECacute >1. In both case chronic testing contributed
to PNEC refinement. For one substance the PEC/PNEC ratio dropped from 7.5 to 0.6
(PEC/PNECcD) and 0.1 (PEC/PNEC). In the other case, the PEC/PNEC ratio dropped from 11.6 to
0.72 (PEC/PNECcD) and 1 (PEC/PNEC). As discussed above fish toxicity may be underestimated
by the PEC/PNECcD if fish is >5x more sensitive than Daphnia or by the PEC/PNECacute in the
case that the ACRaqu is >100. However, an increase of the PNEC due to chronic testing of all
three trophic levels was only observed in four cases. Thereby the increase was moderate and
did not exceed a factor of 3. Thus, the result suggested that chronic data usually contributed to
PNEC refinement. Furthermore, an early inclusion of the risk assessment may represent a
helpful approach to estimate chronic testing requirements since the variance between both
PEC/PNEC ratios derived from chronic data compared to the PNEC derived from acute data
appeared to be low for the evaluated cases (Fig. 18B).
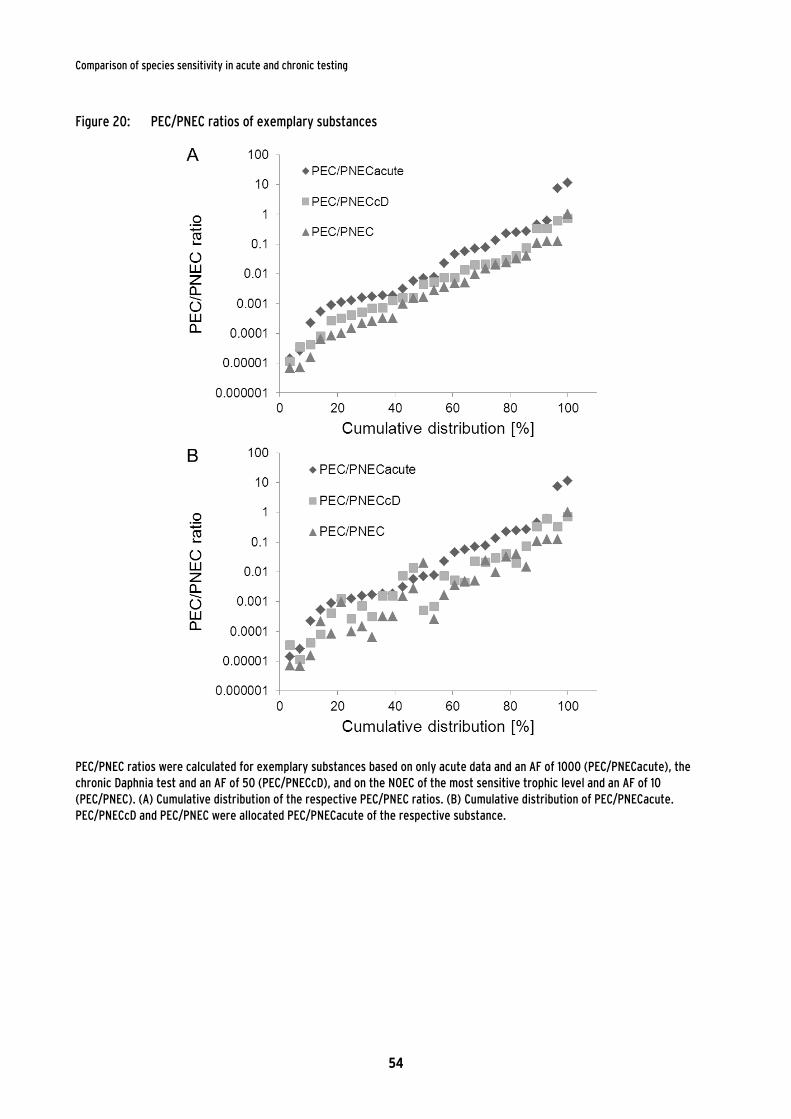
Comparison of species sensitivity in acute and chronic testing
54
Figure 20: PEC/PNEC ratios of exemplary substances
PEC/PNEC ratios were calculated for exemplary substances based on only acute data and an AF of 1000 (PEC/PNECacute), the
chronic Daphnia test and an AF of 50 (PEC/PNECcD), and on the NOEC of the most sensitive trophic level and an AF of 10
(PEC/PNEC). (A) Cumulative distribution of the respective PEC/PNEC ratios. (B) Cumulative distribution of PEC/PNECacute.
PEC/PNECcD and PEC/PNEC were allocated PEC/PNECacute of the respective substance.
Comparison of species sensitivity in acute and chronic testing
55
6 Conclusion
The study is the first data analysis of a comprehensive dataset on long term guideline studies
on fish that compares sensitivity differences of Daphnia and fish for individual substance in
acute and chronic testing. 240 entities from the ECHA and ICS database including 73 pesticides
have been analysed within this study.
The dataset primarily comprises chemical substance entries of substances that are registered at
≥ 1.000 t/a under the REACh regulation or that are considered as substances of concern with
regard to environmental toxicity. Due to the explicit coverage of substance of concern with
regard to environmental toxicity within the database some substance classes may be
overrepresented within this dataset. Indeed, chemical groups like para-substituted phenols, for
example represented about 15% of the total chemicals whereas substances of low
ecotoxicological concern may be underrepresented in this dataset as waiving of the chronic fish
toxicity test is expected for these substances.
An uncertainty may arise by the fact that the data from the ECHA database is provided by the
registrants and, thus, the primary data source could not be evaluated. For quality control only
studies with a reliability of Klimisch score 1 (reliable without restriction) or Klimisch 2 (reliable
with restriction) are considered. Re-evaluation of these studies by the ECHA or national
authorities may still result in some changes. Data of the ICS database is validated by the
German authority.
An uncertainty of the results and conclusions may further arise from selection of the data set.
While often only one chronic study is available several studies are reported for acute testing. In
this study the key study or the study with the lowest effect value was chosen since it is
considered that these studies are relevant for hazard and risk assessment. Furthermore, the
same species as in the chronic study was preferentially chosen in acute testing for fish to avoid
a bias due to interspecies comparison. This approach corresponds to the approach conducted
by Ahlers et al. (2006). However, different data evaluation approaches may be used and may
affect the outcome. For example, the median of the toxicity levels can be used for data
evaluation if three or more studies with high data quality are reported for one substance and
one endpoint (ECETOC, 2003).
Although some uncertainties are associated with the data evaluation approach used in this
study the comprehensive dataset is considered to provide a sound statistical basis.
6.1 ACR evaluation
The dataset which is confined to standardized tests that includes acute and chronic data on
both fish and Daphnia for each substance entry allows the evaluation of ecotoxicological risk
estimation within the context of the integrated testing strategy of the European Union
chemical registration coincidently considering different trophic levels. Previous studies resulted
to some extent in very high ACRs that were calculated up to values of > 10,000 (ECETOC, 2003;
Raimondo et al., 2007). However, these ACRs exhibit isolated values and were usually not
related to additional ecotoxicological data of the respective substance. Therefore, these values
do not consider whether the reported ACR of a species is relevant for environmental risk
assessment or whether other trophic levels or species are more sensitive. The ACRaqu approach
derives a value using the most sensitive species in acute and the most sensitive species chronic
testing and can be considered as relevant for risk assessment.
Comparison of species sensitivity in acute and chronic testing
56
Our results on species specific are basically comparable with previous reports, but
interpretations differ in some points. Länge et al. (1998) and ECETOC (2003) both included
organic chemical, metals and pesticides in their evaluation. Both datasets were based on the
database EAT. ECETOC calculated median ACRs of 6.8 for Daphnia magna on the basis of 37
compounds including 7 pesticides and 3 metals. Median ACRs of 8.8 were reported for fish on
the basis of 69 compounds including 19 pesticides and 11 metals. Länge et al. calculated
median ACRs of 6.1 for invertebrates on the basis of 27 compounds including 9 pesticides and
9 metals. Median ACRs of 9.5 were reported for fish on the basis of 62 compounds including 24
pesticides and 8 metals. Based on a LC50 to LOEC evaluation of fish data Roex et al. (2000)
determined a median ACR of 6.03 for chemicals. For specific acting chemicals a median ACR of
17.3 and a median ARC of 15.3 was reported for metals. Raimondo et al. (2007) investigated
the variability of species specific ACRs including chemicals, pesticides and metals. Median ACR
of 7.5 for invertebrates (n=195) and a median ACR of 9.3 for fish (n=261) as well as 90%-ile
values of 68.3 for Daphnia and 90.0 for fish were reported (Raimondo et al., 2007). Ahlers et al.
(2006) only included organic chemicals within the dataset and calculated median ACRs of 7.0
for invertebrates (102 substances), 10.5 for fish (32 substances) and 10.75 for ACRaqu (32
substances). In line with this study the 90th-percentile was determined to 41.5 for Daphnia,
whereas a 90th-percentile values of 198.0 for fish and of 105.2 for ACRaqu were increased
compared to this study. However, the ACR for fish and the ACRaqu calculated by Ahlers et al.
(2006) are based on only 32 compounds. The differences between this and previous studies are
probably related to the different number of evaluated compounds and the statistical data
quality. Taken together, different approaches have been used for data evaluation, but mostly
resulted in comparable results with median values ranging from 9.0 to 12.6 for fish and
median ACRs ranging from 6.1 to 8.8 for invertebrates. Compared to previous studies the
median ACRs of this evaluation were slightly increased for chemicals. However, the
comprehensive data basis suggests that an ACR of 100 as implemented in the European risk
assessment approach is protective for more than 90 % of the chemicals.
Table 11: Overview of relevant literature on ACR evaluation.
Year Chemicals Pesticides Metals total ACR Remark
Länge et al. 1998 30 24 8 62 9.5 EAT
Roex et al. 2000 “scarcity of ACRs for fish”
ECETOC 2003 44 19 11 74 8.8 EAT
Ahlers et al. 2006 32 - - 32 10.5
Raimondo et al. 2007 < 261 9.3
6.2 Sensitivity comparison
The evaluation of the dataset shows that the more sensitive trophic level in chronic testing can
be predicted to a certain degree from the more sensitive species in acute testing. Thus, chronic
species sensitivity could be estimated from acute testing. To estimate chronic test requirements
the study proposes a classification system for an acute sensitivity ratio to support the ITS. The
final arrangement of the applied categories of the categorization system was based on the
initial concept of the kick-off meeting by the UBA, empiric results of the study and discussion
by the project partners. For Cat.1 and Cat.4 it is suggested that the respective chronic test of the
5x more sensitive species in acute testing is required since omitting the chronic test of the
more sensitive species by using another trophic level may result in an underestimation of the
Comparison of species sensitivity in acute and chronic testing
57
environmental hazard. Although a test of the 5x more sensitive species is required to do not
underestimate environmental hazard the term does not exclude that tests of other trophic
levels or species may be considered for hazard assessment. For Cat.3 the results show that fish
toxicity is covered by the chronic Daphnia test and an AF of 50 in more than 90 % of the cases.
The result reveals that four substances in this category required the chronic fish test to avoid
underestimation of the environmental hazard. This refers to 6% of the substances for the
complete dataset or 8 % of the substances if only FELS studies are considered. A confidence
interval of 90 % may be considered to give an adequate basis to suggest that the chronic
Daphnia test is indicated for environmental hazard assessment whereas the chronic fish test
can be avoided in general. Nevertheless, exceptions that require a chronic fish test to avoid
underestimation of fish toxicity by extrapolation from chronic Daphnia data are possible if a
comparable sensitivity is determined in acute testing.
While fish testing is indicated for substance in Cat.1 and Daphnia testing is indicated for
substances in Cat.3 and Cat.4 substances Cat.2 appears to be associated with an uncertainty in
predicting chronic testing requirements. Therefore, testing of both Daphnia and fish should be
considered since no clear recommendation can be given based on the statistical result of this
study. In the majority of cases (72 %) the chronic fish test is not necessary whereas 28 % of the
substances are not properly covered by the chronic Daphnia test. Therefore, the chronic fish
test should be considered unless substantial chronic fish toxicity can be excluded. However, a
general indication to perform a chronic fish test for substances in Cat.2 results in a high
number of animal tests that are retrospectively not necessary. Subsequently, the challenge
arises in which case a chronic fish test is necessary and in which case the chronic fish test can
be avoided. Interestingly, the Kow value appears to support decision making. It is proposed by
the findings of this study that a high Kow can be applied as trigger to indicate chronic fish
testing whereas the results suggest that a chronic fish test is not indicated for Cat.2 if the Kow
is <3 and no structural alert is determined. However, this conclusion should be handled with
care since no causal relationship exists between both determinants (classification and Kow) and
due to a limited data set of substance in Cat2.
Finally, it is important to note that the classification is based on the empiric results of this study
and refer to a statistical probability whether the chronic fish toxicity is covered by the chronic
Daphnia test and an adequate assessment factor. The acute sensitivity comparison approach is
designed to offer a method to avoid animal testing if possible and statistical reasonable. If a
“no risk” approach should be followed and underestimation of fish toxicity should be excluded
in any case chronic fish testing will be required for Cat.1, Cat.2 and Cat.3. Such an approach
will result in animal testing for more than 60 % of the substances, subsequently, and it remains
to be discussed whether this is compatible with the intention to avoid animal test.
6.3 Refinement of assessment factors based on acute sensitivity comparison
The results of this study suggest that Daphnia testing is indicated for substances in Cat.3 and
Cat.4. The chronic fish test can be avoided in general in these categories. However, exceptions
from a methodology can not be excluded and are already determined within this data set for
substances that exhibit no or a low acute toxicity to fish in acute testing, but fish toxicity in
chronic testing. Therefore, shortcomings of the methodology are assumed for substances that
exert a mode of action in chronic fish toxicity testing which may not be derived from short
term testing. In total, exceptions in Cat 3 and 4 that are not predicted to be more sensitive to
fish in chronic testing by this method account to <5 % representing a confidence interval of >
95 % for this approach, subsequently. Therefore, a chronic fish toxicity test should generally not
be requested unless fish are 2x more sensitive than Daphnia in acute testing. However, four
Comparison of species sensitivity in acute and chronic testing
58
exceptions being more sensitive to fish in chronic testing were determined in the Qa range
from 0.5 to 2 be referring to <10% of the total substances within this range. Physicochemical
properties like water solubility and the octanol-water partitioning coefficient do not represent
determinants to predict exceptions from the sensitivity classification methodology since the
four substances in Cat 3 that were more toxic to fish showed a water solubility of > 1 mg/L and
two have a log Kow <3. As discussed below application of structural relationship analysis as
concomitant approach may be useful to verify the result of the sensitivity comparison. Indeed,
two of the four exceptions represent para-substituted phenols and one a halogenated
nitrobenzene. Furthermore, it should be noted that the remaining four substances exhibits
NOEC > 1 mg/L. A PEC/PNEC comparison was conducted for this substance in section 5.11
resulting in a RCR of <0.001. Although a comprehensive risk assessment can not be conducted
within the scope of this project this limited evaluation suggests that this substance is of less
ecotoxicological concern and a chronic fish test is not necessarily required in this case.
Comparison of species sensitivity in acute and chronic testing
59
6.4 Adaptation of sensitivity distinction as applied in the REACh guidance 7b
According to the European guidance document R7B, page 54, no further requirements for fish
toxicity testing is indicated if there is compelling evidence to suggest that the fish value is likely
to be at least a factor of about 10 less sensitive than invertebrates or algae (ECHA, 2012). The
here presented classification system of acute sensitivity comparison differs from the current
guidance documents which indicate a threshold of 10x sensitivity difference between trophic
levels. First, the current approach initially results in an amount of about 95 % of the evaluated
substances that may require a chronic fish toxicity test. Distribution analysis of quantitative
sensitivity in chronic testing, however, shows that the chronic Daphnia test should be
considered as sufficiently protective for more than 85 % of the analysed substances. Second,
Daphnia was in neither case more 5x sensitive in chronic testing if fish was 5x more sensitive in
acute testing. In this case Daphnia toxicity testing is not required. Third, fish was in neither
case more sensitive in chronic testing if Daphnia was 5x more sensitive in acute testing. In this
case fish toxicity testing is not required. In summary, the results of this study indicate that a
threshold of 10x as used for sensitivity distinction in the current guidance documents should be
reduced to 5x. Thus, adaption of the current ITS is suggested by this data analysis proposing a
reduction of the sensitivity factor from 10 to 5. In the case that the value of Daphnia /fish is
likely to be at least a factor of about 5 less sensitive than the other trophic levels, there are no
further requirements for Daphnia /fish testing. For substances being 5x more sensitive to
Daphnia in acute testing (Cat.4) 91 % of these substances are also more sensitive to Daphnia in
chronic testing. Only three substances are slightly more sensitive to fish in chronic testing.
However, in these cases the ratio Qc was >0.5. Thus, the substances can be considered to be
comparable sensitive to Daphnia and fish in chronic testing since a range of data variance
between 0.5 and 2 is assumed as comparable sensitive. Therefore, it is proposed that a fish
toxicity test is not required and application of an AF of 10 on the chronic Daphnia is suggested
to be protective for substances classified in Cat4. The same applies for substances being 5x
more sensitive to fish. 90 % of the substances in Cat.1 are more sensitive to fish in chronic
testing. Only one substance is slightly more sensitive to Daphnia with a quotient of 3.2.Hence,
toxicity of invertebrates is expected to be covered by the chronic fish test, and application of an
AF of 10 on the chronic fish test is suggested to be usually protective for substances in Cat.1
while a chronic Daphnia test is not necessarily required. Taken together, the findings suggested
that for substances being 5x more sensitive to one trophic level chronic testing is required for
the respective trophic level. Chronic testing of the less sensitive trophic level from acute data is
usually not indicated in this case. Application of an AF of 10 on the sensitive trophic level is
further expected to be sufficient protective and thus may be applied for PNEC refinement for
Cat.1 and Cat.4. For Cat.2 and Cat.3 an AF of 50 is still indicated and a reduction to 10 not
applicable.
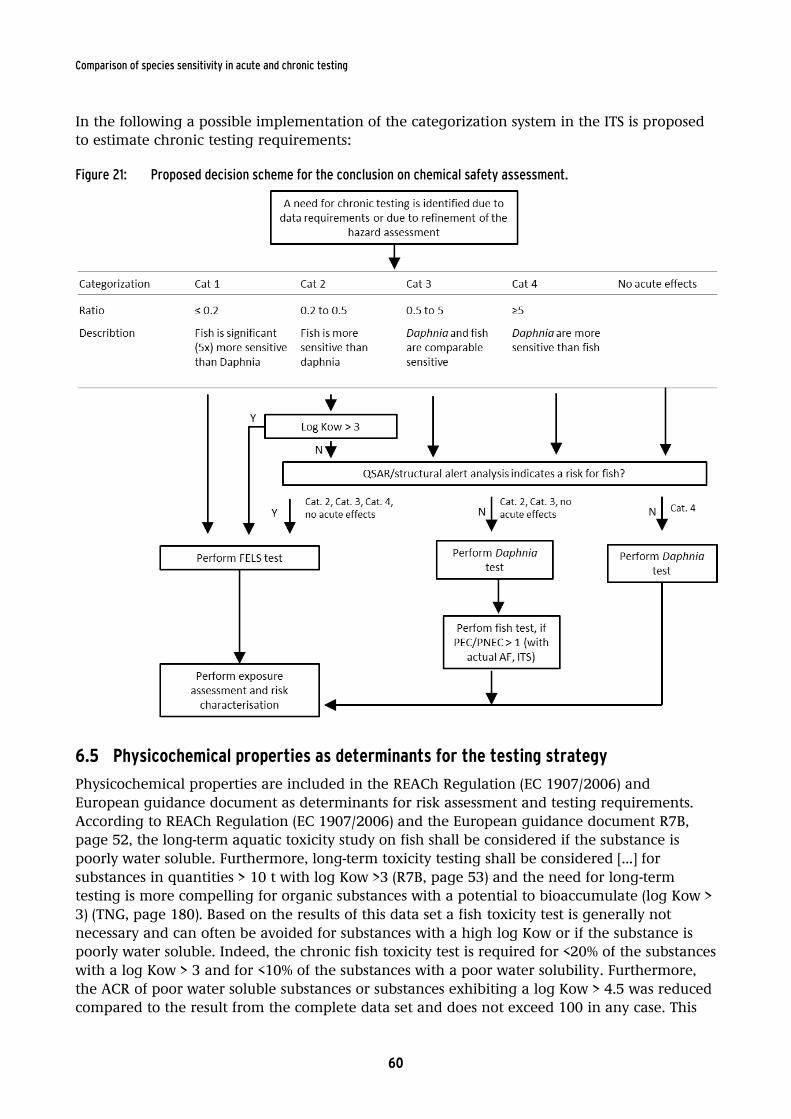
Comparison of species sensitivity in acute and chronic testing
60
In the following a possible implementation of the categorization system in the ITS is proposed
to estimate chronic testing requirements:
Figure 21: Proposed decision scheme for the conclusion on chemical safety assessment.
6.5 Physicochemical properties as determinants for the testing strategy
Physicochemical properties are included in the REACh Regulation (EC 1907/2006) and
European guidance document as determinants for risk assessment and testing requirements.
According to REACh Regulation (EC 1907/2006) and the European guidance document R7B,
page 52, the long-term aquatic toxicity study on fish shall be considered if the substance is
poorly water soluble. Furthermore, long-term toxicity testing shall be considered […] for
substances in quantities > 10 t with log Kow >3 (R7B, page 53) and the need for long-term
testing is more compelling for organic substances with a potential to bioaccumulate (log Kow >
3) (TNG, page 180). Based on the results of this data set a fish toxicity test is generally not
necessary and can often be avoided for substances with a high log Kow or if the substance is
poorly water soluble. Indeed, the chronic fish toxicity test is required for <20% of the substances
with a log Kow > 3 and for <10% of the substances with a poor water solubility. Furthermore,
the ACR of poor water soluble substances or substances exhibiting a log Kow > 4.5 was reduced
compared to the result from the complete data set and does not exceed 100 in any case. This
Comparison of species sensitivity in acute and chronic testing
61
suggests that an substantially increased toxicity is not expected in chronic tests compared the
result from acute testing.
50 % of the poor water soluble substances exhibited a toxic effect in chronic testing although
no toxicity was determined in acute testing up to the water solubility level. Therefore, chronic
testing is required for low water soluble substances […] that show no acute toxicity up to the
solubility limit and if the PEC is > 1/100th of the water solubility as stated in the guidance
(ECHA, 2008). Based on this results and in line with the guidance documents the chronic
Daphnia test is initially the study of choice and required to determine a No observed effect
concentration. Even in the case of poor water soluble substances the log Kow does not
generally represent a determinant that indicates the requirement of fish toxicity testing since
more than 80 % of the evaluated poor water soluble substance exhibit a log Kow >3.
In summary, acute sensitivity classification can be applied independent of the physicochemical
properties water solubility and the octanol-water partitioning. Poor water solubility or a high
Kow do not appear as predictors for species sensitivity upon long term exposure of Daphnia or
fish. Both properties do not in general indicate the requirement of chronic toxicity testing or
even the requirement of a chronic fish test. Furthermore, the physicochemical properties
octanol-water partitioning and water solubility have a low predictive value regarding increased
acute to chronic ratios. Therefore, it is proposed to adapt the guidance documents in this point
as both physicochemical properties are not confirmed to be predictive for chronic testing
requirements.
6.6 Structural alerts and QSAR modeling
Structural alerts and QSAR modeling will represent a valuable tool for risk estimation and to
support testing strategies due to two reasons. First, the classification system was derived to
provide a scientifically justified and reasonable approach for chronic effects estimation and
further testing strategies. In general, exceptions from a methodology cannot be excluded and
were already determined within this dataset for substances that exhibited no or a low acute
toxicity to fish in acute testing, but fish toxicity in chronic testing. Therefore, shortcomings of
the methodology are assumed for substances that exert a mode of action in chronic testing
which may not be derived from short term testing. Physicochemical properties like water
solubility and the octanol-water partitioning coefficient have been discussed in the literature
and guidance documents to pose an additional hazard upon long term exposure. Both could
not be confirmed as determinants by this study indicating the requirement of chronic fish
toxicity testing. Furthermore, physicochemical properties do not represent determinants to
predict exceptions from the methodology since the four exception in Cat 2 showed a good
water solubility and a log Kow <3. The analysis suggested that the most critical substances
regarding fish toxicity are related to distinct structural properties like para-substituted phenols,
thiocarbamates or musk compounds, for example. Therefore, it is proposed that exceptions can
mostly be identified by structural alert or structural relationship analysis. Second, the data
analysis shows that substances in Cat 2 that are more sensitive to fish in acute testing are in 72
% of the cases also more toxic to fish in chronic testing. In about 28 % of the cases chronic fish
toxicity was considered to be not properly covered by the Daphnia test and the extrapolation
approach. Hence, it is suggested that a chronic fish toxicity test should be considered and may
be required for a protective approach unless substantial chronic fish toxicity could not be
excluded. Nevertheless, the statistical analysis shows that in the majority of cases (72%) the
chronic fish toxicity test is indeed not required and a general indication to perform a chronic
fish toxicity test for substances in Cat 2 would result in an undesirable high number of animal
Comparison of species sensitivity in acute and chronic testing
62
tests that are retrospectively not required. QSAR modeling, read across and structural alert
prediction may provide an approach to support a testing strategy at this step.
General applied QSAR models like OECD QSAR Toolbox, are not validated or applicable for
chronic data. Moreover, the guidance R10b Table 10-16 gives examples for structural alerts
associated with enhanced toxicity in fish (and rat) and for Daphnia (ECHA, 2008). It is
important to note that the structural alerts stated in the guidance document were identified as
outliers form baseline toxicity QSAR of acute testing. In several cases these results are based on
non-guideline studies. The applicability of the table to indicated structural alerts for fish
sensitivity in acute testing needs to be evaluated, and the applicability of these structures for
chronic predictions is questionable. The results of this study suppose that some possible
structural alerts for chronic fish toxicity like para-substituted phenols are not included in this
list whereas other structures included in the list do not appear as alerts for chronic fish testing
within this study. Therefore, an uncertainty on the applicability of both current methods for
chronic data (QSAR and structural alert) is envisaged and further research is required to
investigate whether these structural alerts and QSAR models are suitable for chronic data and
to predict species sensitivity. The predictive value for the here identified structural alerts refer
mostly to less than 30% compare to the aim which is the identification of exceptions in Cat.3
and Cat.4 that represent 4% of the respective data set or 2% of the complete data set.
Therefore, QSAR and structural alert analysis should be used very carefully to support decision
making.
6.7 Data quality of fish tests
The results on data quality of chronic fish test suggest that the type of chronic test effects the
average sensitivity distribution and has an effect on the ACR. The statistical finding supposes
that fish toxicity might be underestimated by non-FELS studies compared to FELS studies.
However, the result on non-FELS studies is based on a limited dataset (n= 22) and interpretation
should be handled with care and on a case by case evaluation since different tests types were
not compared for the same substance. Therefore, this evaluation is not applicable to confirmed
whether the FELS test is more conservative than other test. Furthermore, it is important to note
that the acute to chronic extrapolation approach is considered to be protective if only FELS
tests are considered for data evaluation.
The median ACR for the different evaluated ACR in Table 5 ranged between 10.6 to 13.0 and
the 90-% values between 63.5 and 111.1 (except of ACR5 that included only non-FELS studies
and showed decreased values). Interestingly, data variance and increased ACR >100 are
preferentially observed if acute and chronic data is based on different species (ACR3, 90 %-ile
value of 111.1) whereas reduced 90%-ile values were observed if only the same species is
compared (ACR2, 6, 8). This statistical finding supposed that the tested fish species in acute and
chronic testing affects the result.
Comparison of species sensitivity in acute and chronic testing
63
6.8 Outlook
To re-evaluate the current results the data set should be complemented with additional
data that is expected to be submitted to the ECHA database within the time schedule of
the REACh regulation. Additional data may clarify how exceptions of the method can be
identified and at which conditions a fish toxicity test may be requested for substances in
Cat 2. Therefore, re-evaluation is suggested with the REACh deadline in 2018.
The predictability of current QSAR model should be checked for the current data set in
terms of effect levels, species sensitivity estimation and identification of structural alerts.
In this line, the dataset may be used to evaluate whether chronic QSAR modeling is
possible since no validated chronic QSAR models are available at the moment.
Analysis of the mode of action (MoA) of the chemicals may contribute to a refinement of
conclusions for different subgroups of chemicals.
The dataset does not compile algae data since the ACR is expected to be lower for algae
(Ahlers et al., 2006), and because it is expected that a chronic algae test is usually
provided if chronic testing is required. However, to evaluate testing requirements the
algae test should be considered assuming that in some cases algae represent the most
sensitive species. Subsequently, the requirement of fish toxicity test may be further
reduced by including algae data.
Comparison of species sensitivity in acute and chronic testing
64
7 References
Ahlers, J., C. Riedhammer, M. Vogliano, R.U. Ebert, R. Kuhne, and G. Schuurmann. 2006. Acute to chronic ratios in aquatic toxicity - Variation across trophic levels and relationship with chemical structure. Environmental Toxicology and Chemistry. 25:2937-2945.
EC. 1996. Technical guidance document in support of Commission directive 93/67/EEC on risk assessment for new notified substances and Commission regulation (EC) no 1488/94 on risk assessment for existing substances. Joint Research Center, Ispra, Italy, Luxembourg.
ECETOC. 2003. Aquatic Hazard Assessment II. Technical Report 91.Brussels, Belgium.
ECHA. 2008. Guidance on information requirements and chemical safety assessment Chapter R.10: Characterisation of dose [concentration]-response for environment. Vol. Helsinki, Finland.
ECHA. 2012. Guidance on information requirements and chemical safety assessment Chapter R.7b: Endpoint specific guidance. Helsinki, Finland.
EU. 2006. Regulation (EC) No 1907/2006 of the European Parliament and the council of 18 December 2006. Official Journal of the European Union.
Heger, W., S.J. Jung, S. Martin, and H. Peter. 1995. Acute and Prolonged Toxicity to Aquatic Organisms of New and Existing Chemicals and Pesticides. Chemosphere. 31:2707-2726.
Lange, R., T.H. Hutchinson, N. Scholz, and J. Solbe. 1998. Analysis of the ECETOC aquatic toxicity (EAT) database - II - Comparison of acute to chronic ratios for various aquatic organisms and chemical substances. Chemosphere. 36:115-127.
Mayer, F.L., G.F. Krause, D.R. Buckler, M.R. Ellersieck, and G.H. Lee. 1994. Predicting Chronic Lethality of Chemicals to Fishes from Acute Toxicity Test Data - Concepts and Linear-Regression Analysis. Environmental Toxicology and Chemistry. 13:671-678.
OECD. 1984. Test No. 204: Fish, Prolonged Toxicity Test: 14-Day Study. OECD Publishing, Paris, France.
OECD. 1992a. Test No. 203: Fish, Acute Toxicity Test. OECD Publishing, Paris, France.
OECD. 1992b. Test No. 210: Fish, Early-Life Stage Toxicity Test. OECD Publishing.
OECD. 1998a. Test No. 211: Daphnia magna Reproduction Test. OECD Publishing, Paris, France.
OECD. 1998b. Test No. 212: Fish, Short-term Toxicity Test on Embryo and Sac-Fry Stages. OECD Publishing, Paris, France.
OECD. 2000. Test No. 215: Fish, Juvenile Growth Test. OECD Publishing, Paris, France.
OECD. 2004. Test No. 202: Daphnia sp. Acute Immobilisation Test. OECD Publishing, Paris, France.
Raimondo, S., B.J. Montague, and M.G. Barron. 2007. Determinants of variability in acute to chronic toxicity ratios for aquatic invertebrates and fish. Environmental Toxicology and Chemistry. 26:2019-2023.
Roex, E.W.M., C.A. Van Gestel, A.P. Van Wezel, and N.M. Van Straalen. 2000. Ratios between acute aquatic toxicity and effects on population growth rates in relation to toxicant mode of action. Environmental Toxicology and Chemistry. 19:685-693.
Verhaar, H.J.M., C.J. Vanleeuwen, and J.L.M. Hermens. 1992. Classifying Environmental-Pollutants .1. Structure-Activity-Relationships for Prediction of Aquatic Toxicity. Chemosphere. 25:471-491.

Comparison of species sensitivity in acute and chronic testing
65
Zeemann. 1995. Ecotoxicity testing and estimation methods developed under Section 5 of the Toxic Substances Control Act (TSCA). In Fundamentals of Aquatic Toxicology, 2nd ed. . R. GM, editor, Philadelphia, PA, USA. 703–716.


