Sizing and Siting STATCOM Devices in the Portuguese
Transmission System for Improving System Security
P.N. Pereira Barbeiro*1, C.L. Moreira*2, H. Keko*3, H. Teixeira*4,Nuno Rosado †5, João Moreira†6, Reis Rodrigues†7
[email protected], [email protected], [email protected], [email protected], [email protected], [email protected],7 [email protected]
*INESC TEC - INESC Technology and Science (formerly INESC Porto), Rua Dr. Roberto Frias, 378, Porto 4200-465,
Portugal †REN, Redes Energéticas Nacionais, S.A., Av. dos Estados Unidos da América, 55, Lisboa 1749-061, Portugal
Abstract - This paper presents a methodology for siting and sizing STATCOM devices in the Portuguese
transmission system in order to improve system security following severe grid faults. Security issues arise
since the Portuguese transmission system incorporates significant levels of wind generation without fault ride
through and reactive current injection capabilities during grid faults. Being the Transmission System Operator
(TSO) responsible for assuring system security, the goal of the study is to take advantage of the proved
STATCOM ability for injecting reactive current in order to mitigate the disconnection of large amounts of
wind farms in case of severe grid faults. The proposed methodology was developed and tested in coordination
with the Portuguese TSO and it is based on the formulation of an optimization problem in order to minimize
the installed STATCOM power while ensuring its compliance with the current grid code requirements,
namely in what concerns to the system stability and security. Given the discrete and complex nature of the
problem, a hybrid approach, combining both a heuristic method and an Evolutionary Particle Swarm
Optimization (EPSO) algorithm was developed. Results show the effectiveness of the proposed methodology
as well as its robustness regarding the validity of the obtained solutions while facing the most severe
operational scenarios.
Index Terms-- EPSO, Fault Ride Through, Grid Code, STATCOM, System Security, Transient Stability,
reactive current injection
1. INTRODUCTION
Over the last decade, different factors such as environmental concerns, political
incentives and technological developments have contributed to a steady increase of the
worldwide wind generation installed capacity. According to statistics of the Global Wind
Energy Council, worldwide installed wind power increased from 17.4 GW at the end of the
year 2000 to 318.1 GW by the end of 2013 [1]. Regarding the specific case of the
Portuguese electric power system, the wind power installed capacity by the end of 2013
was around 4648 MW (excluding Madeira and Azores islands). This installed power
accounted for about 24% of total electric energy consumption in that year [2]. According to
the Portuguese TSO predictions for the next years, wind capacity will continue to rise,
reaching more than 4700 MW until the end of 2014.
The massive presence of wind generation in electric power systems naturally displaces
conventional units, thus increasing the risk of system security. Therefore system operators
have been defining very restrict rules and conditions for allowing increasing wind power
integration, which are generally referred as grid codes. Grid codes usually require that
Wind Farms (WF) withstand several disturbances and have the capability to support
network operation by providing some types of services. Recalling for international grid
code requirements for wind power integration, Fault Ride-Through (FRT) capability and
reactive current injection during voltage dips are usually mandatory requirements [3, 4].
In Portugal, the grid code entered into force only in 2010 [5]. Although WF with FRT are
currently being widely adopted, a substantial percentage of WF were constructed and
commissioned prior to the definition of the grid code. Despite the ongoing efforts for
adapting the old WF to meet the new requirements, the amount of non-FRT compliant WF
may lead to significant amounts of generation tripping in case of grid faults, which can
compromise system security.
Continuous adaptation of non-FRT compliant WF is thus a key objective defined in the
Portuguese grid code in order to improve overall system security. Also, it is from the
responsibility of the WF promoter to take the necessary measures in order to comply with
the grid code requirements. In order to achieve this goal, there are generally two strategies
that can be exploited. The first strategy may involve refurbishment of existing WF, which
can be very expensive in the case of the oldest ones. The second strategy includes the
installation of external solutions at the WF or at individual turbine level. In this case,
studies for the proper sizing of the solution are oriented to improve the dynamic behaviour
of a single WF through the use of FACTS devices based on series or parallel compensation
(such as Dynamic Voltage Restorers – DVR and STATCOM or SVC, respectively) [6-8].
In this case, studies just consider the local impact of FACTS installation and do not analyse
the system-level impact of the FACTS siting and sizing. Therefore, advanced
methodologies for dealing with the problem of FACTS sizing and location are not required.
Nevertheless, technical solutions for the adaptation of existing WF (WF existing at the
time of grid code publication) in order to be compliant with new requirements defined in
the grid code may not be adopted by WF promoters in Portugal if the promoters are able to
demonstrate that it is not economically feasible to do the necessary adaptions [9].
Therefore, the Transmission System Operator (TSO), as the entity liable for assuring global
system security, has to identify appropriate mechanisms to mitigate the resulting effects
from generation tripping following grid faults. This is a critical condition in the
transmission system and is presented within the framework of the current Portuguese grid
code, which specifies that the system should be transiently stable and in case of severe
disturbances should not experiment simultaneous generation tripping larger than 2000 MW
in the Portuguese control area [5]. At the TSO level, one possible complementary solution
to mitigate this problem could rely on the location and sizing of FACTS devices to provide
additional voltage support during grid faults and avoid large amounts of undervoltage WF
tripping. Regarding this specific issue, STATCOM devices clearly stand out regarding
voltage support during voltage dips when compared to other FACTS technologies [7].
While following this conceptualisation for identifying a proper solution, in [10] the
authors proposed a trial and error approach that illustrates the possibility of improving the
security of the Portuguese transmission system through the use of STATCOM based
solutions. However, the authors do not consider multiple scenarios and multiple fault
conditions. In a recent study [11], several operational conditions of the Portuguese
transmission system were taken in consideration for a preliminary assessment of possible
STATCOM based solutions regarding the aforementioned objectives. Nevertheless, a
systematic methodology and full scale validation of the solutions are not addressed.
The use of methodologies based on meta-heuristic for finding the optimal placement and
the size of FACTS devices have been addressed with different goals: improve transient
stability margin [12-14], improvement of voltage profiles and reduce losses [15, 16] or
increase total transfer capability [17-19]. However, neither the solutions were oriented to
the improvement of system security due to the loss of large amounts of wind generation,
nor were designed over real transmission systems. Furthermore, the optimized solutions are
requested to respond to long term related problems (steady-state operation), not addressing
the dynamic response of the electrical system.
In this sense, this paper presents the development of an innovative methodology
regarding the need of the Portuguese TSO for sizing and locating STATCOM devices in the
Portuguese transmission system through the assessment of the system global transient
stability and post-fault system conditions. Within this current framework, the TSO will be
the owner and the sole responsible for the operation, control and maintenance of the new
devices that will be installed on the grid. The proposed methodology was developed and
validated in close coordination with the Portuguese TSO – REN (Redes Energéticas
Nacionais). Such process required the quantification of the expected simultaneous
generation tripping according to grid code requirements, while considering robustness
issues through the consideration of several operational scenarios. The problem was tackled
by the use of a hybrid optimization algorithm, which combines an enhanced Evolutionary
Particle Swarm Optimization algorithm (EPSO) and a heuristic procedure for finding the
optimal locations of the devices and achieves their minimal nominal capacity. Several
possible operational scenarios, FRT capability level scenarios, and also a large set of severe
faults were evaluated under dynamic studies, being the results computed under different
perspectives in order to demonstrate the effectiveness of the proposed approach.
2. CHARACTERIZATION OF THE PORTUGUESE TRANSMISSION NETWORK
In this section, a brief presentation of the Portuguese transmission network is given,
together with the characterization of the operational scenarios that were considered within
the scope of this study. Those scenarios were later considered to validate the proposed
methodology.
2.1. ELECTRICAL NETWORK
The Portuguese transmission system comprises the 400 kV, 220 kV and 150 kV voltage
levels. The link between the transmission and the distribution grid is done at Substations
(SS) with the 63 kV voltage level. In these type of substations, the 63 kV busbars and
related equipment also belong to the TSO (the distribution operator is only responsible for
the 63 kV feeders connected to these king of substations). Regarding WF installed in the
Portuguese electric power system, it is important to mention that some of them are
connected to the highest voltage levels of the system, but a significant percentage are
connected to the distribution grid in substations belonging to the distribution system
operator. However, regardless the connection point (distribution or transmission system),
all of them should comply with the grid code requirements.
The Portuguese electric power system has a strong mix between (conventional) thermal
and hydro power plants, while comprising also strong interconnections with Spain. For that
reason, it is a usual practice to consider the complete Iberian transmission system model in
several types of studies, as it is the case of the work presented in this paper. French and
Moroccan transmission systems, also connected to the Iberian system, were represented
through their equivalent models at the correspondent interconnection points. The Iberian
system have been modelled in the PSS/E simulation package (version 32), using several
user-defined models as well as PSS/E library models.
2.2. GRID OPERATIONAL SCENARIOS
Taking into account the TSO point of view, a set of operational scenarios was defined as
the most representative ones. Scenarios selection has in consideration peak and valley
power load levels, the relevance of the hydro power production (through the consideration
of wet and dry scenarios) and the power import/export levels with the Spanish system.
Given the Portuguese grid code requirements, scenarios with a high share of wind power
integration have also very high relevance. Consequently, the following set of scenarios
were defined by the TSO and fully modelled in PSS/E: Wet Winter Peak Load (WWPL),
Dry Winter Peak Load (DWPL), Wet Summer Peak Load (WSPL), Dry Summer Peak
Load (DSPL), Dry Summer Valley Load (DSVL), Dry Summer Valley Load with low wind
power (DSVL_W30%) and Dry Winter Valley Load with low wind power
(DWVL_W30%). All peak load scenarios as well as the DSVL scenario are characterized
by a high wind power injection, corresponding to approximately 80% of the installed wind
capacity. The others two valley load scenarios are characterized by having a relative low
wind power injection, representing approximately 30% of the total installed wind capacity
in Portugal and zero power exchange with the Spanish system. A general characterization
of the Portuguese transmission system generation, including the interchanges with the
Spanish system in the referred scenarios is depicted in Table I (conventional generation
includes thermal and hydro units as well as mini-hydros and co-generation units).
Generation units connected the distribution grid are represented by the TSO as equivalent
generators in the 63 kV busbar of the SS connected to the transmission grid.
Table I - General Characterization of Operational Scenarios under Study in the Portuguese Transmission
System
Grid Scenarios
WWPL DWPL WSPL DSPL DSVL DSVL_W30 DWVL_W30
Total Load
(MW) 10340 10340 8666 8666 6134 6134 6362
Conventional Generation
(MW) 2581 8738 2053 7048 1813 4318 4477
Wind Generation
(MW) 5136 5136 5136 5136 5136 1926 1926
Total Generation
(Portuguese Network) 7717 13873 7189 12183 6948 6243 6403
Exported (+) or Imported
(-) Power (MW) 2900 (-) 3250 (+) 1700 (-) 3250 (+) 600 (+) 0 0
Regarding WF installed in Portugal, it was also provided by the TSO a detailed
characterization of the FRT compliance per WF (in the studied scenarios only about 50 %
of the total WF installed capacity are compliant with the current Portuguese grid code
requirements). WF not FRT compliant are set to instantaneous undervoltage tripping at
0.85 p.u.. Regarding the Spanish transmission system, it is assumed that all WF are fully
compliant with current Spanish grid codes in terms of FRT capability and reactive current
injection during voltage sags in all the studied scenarios [20].
2.3. WIND GENERATION AND STATCOM MODELLING
Special attention was given to the modelling of wind generation in the Portuguese
transmission grid, since FRT capability is crucial for the evaluation of system security in
case of severe faults. For recently build WF simulation models provided by the
manufacturers were used. For the other ones, a general user defined WF model was used
[21], whose main characteristic is the ability to easily model reactive current injection
capability and of the voltage versus time curve associated to the FRT requirements [5].
Regarding the reactive current injection capability of the WF following a fault, typical
time-delays were considered to represent the behaviour of the different WF. These time
delays were provided by the TSO and are correspond to two values: 80 ms and 120 ms.
With respect to Spanish wind generation, PSS/E model “WT4” was adopted. An
undervoltage tripping relay (PSS/E built-in model “VTGTPA”) was also added to each
Spanish WF and parameterized accordingly to the Spanish grid code regarding FRT
requirements [20].
The STATCOM devices were modelled using the “CSTCNT” model available in PSS/E
libraries [22], which is capable of accurately representing the dynamic behaviour of this
kind of device.
2.4. TRANSMISSION GRID SECURITY CRITERIA
From a security point of view, the Portuguese grid code specifies that the transmission
system should be transiently stable for different types of faults when cleared either by the
main protection (first operating level) or backup protections (breaker failure or a tele-
protection system failure – second operating level). Additionally, the grid code specifies, in
its planning criteria, that in case of severe disturbances the Portuguese system cannot admit
the simultaneous tripping of more than 2000 MW.
3. METHODOLOGY FOR SITING AND SIZING STATCOM DEVICES IN THE TRANSMISSION
GRID
The developed methodology for siting and sizing STATCOM devices at the transmission
network comprises the resolution of an optimization problem, whose main goal is the
identification of the less costly and the most robust solution regarding the number of worst
case scenarios and possible fault locations for which it should be validated. Following this
principle, Fig. 1 presents a flowchart depicting the main steps of the developed
methodology. As can be seen, TSO assumes some crucial functions in the context of such a
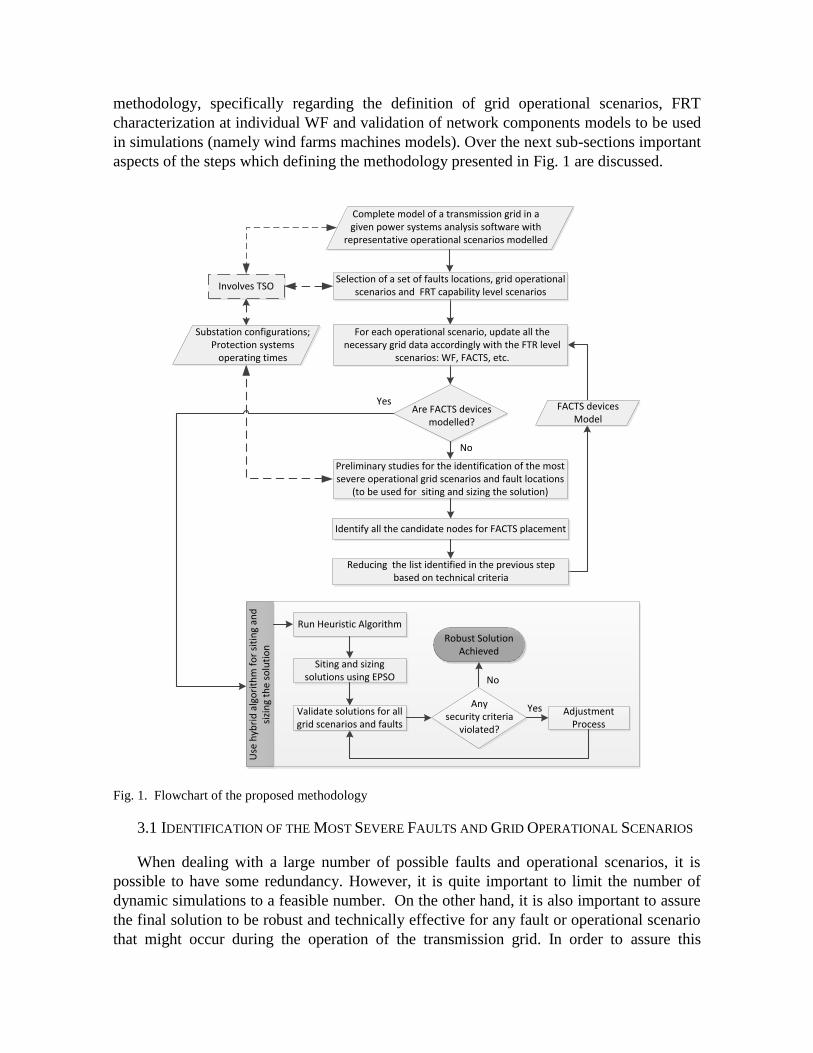
methodology, specifically regarding the definition of grid operational scenarios, FRT
characterization at individual WF and validation of network components models to be used
in simulations (namely wind farms machines models). Over the next sub-sections important
aspects of the steps which defining the methodology presented in Fig. 1 are discussed.
Fig. 1. Flowchart of the proposed methodology
3.1 IDENTIFICATION OF THE MOST SEVERE FAULTS AND GRID OPERATIONAL SCENARIOS
When dealing with a large number of possible faults and operational scenarios, it is
possible to have some redundancy. However, it is quite important to limit the number of
dynamic simulations to a feasible number. On the other hand, it is also important to assure
the final solution to be robust and technically effective for any fault or operational scenario
that might occur during the operation of the transmission grid. In order to assure this
Identify all the candidate nodes for FACTS placement
Run Heuristic Algorithm
Involves TSO
Yes
No
Adjustment Process
Robust Solution Achieved
No
Yes
Use
hyb
rid
alg
ori
thm
fo
r si
tin
g an
d
sizi
ng
the
solu
tio
n
Complete model of a transmission grid in a given power systems analysis software with
representative operational scenarios modelled
Selection of a set of faults locations, grid operational scenarios and FRT capability level scenarios
FACTS devices Model
Substation configurations; Protection systems
operating times
Are FACTS devices modelled?
Preliminary studies for the identification of the most severe operational grid scenarios and fault locations
(to be used for siting and sizing the solution)
Reducing the list identified in the previous step based on technical criteria
Siting and sizing solutions using EPSO
Validate solutions for all grid scenarios and faults
For each operational scenario, update all the necessary grid data accordingly with the FTR level
scenarios: WF, FACTS, etc.
Anysecurity criteria
violated?
situation, a worst case scenario approach is followed.
In this sense, one of the first steps of the proposed methodology involves a meticulous
identification and selection of a set of the most representative fault locations and grid
operational scenarios among the available candidates. This process was developed in close
collaboration with the TSO. Based on TSO information, a set of the most critical faults
location were identified. Subsequently it was followed by the detailed characterization of
the circuits in which those faults may occur, as well as the associated SS configuration and
protection systems clearing times, considering both normal protection operation and
protection failure. Over the Portuguese transmission system, a total of 22 faults locations (9
at 220 kV level and 13 at 400 kV), were considered by Portuguese TSO as the most severe
ones. The identification of fault locations has in consideration the relevance of the SS,
given by its short-circuit power, as well as the electric proximity to WF.
The next step consists on the simulation, for the complete list of the previously
identified fault locations and for all grid operational scenarios, three-phase short-circuits in
each SS circuit. Simulated faults consisted on the simulation of a barker failure and a tele-
protection system failure, since these are the most severe fault conditions regarding system
transient stability.
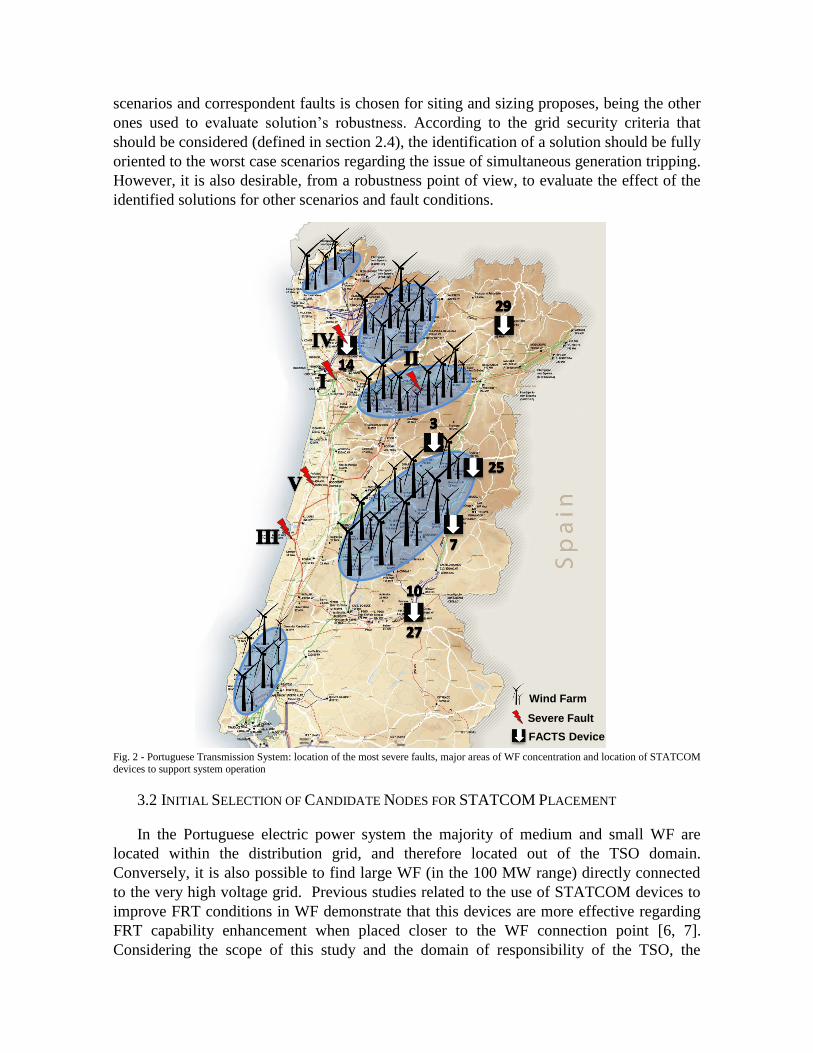
In Fig. 2 it is possible to have an overview about the geographical location of the most
severe faults as well as the most significant areas in terms of WF concentration. In the
selection of the most severe faults a worst case approach was followed by taking into
consideration the transmission grid stability conditions previously defined (see section 2.4).
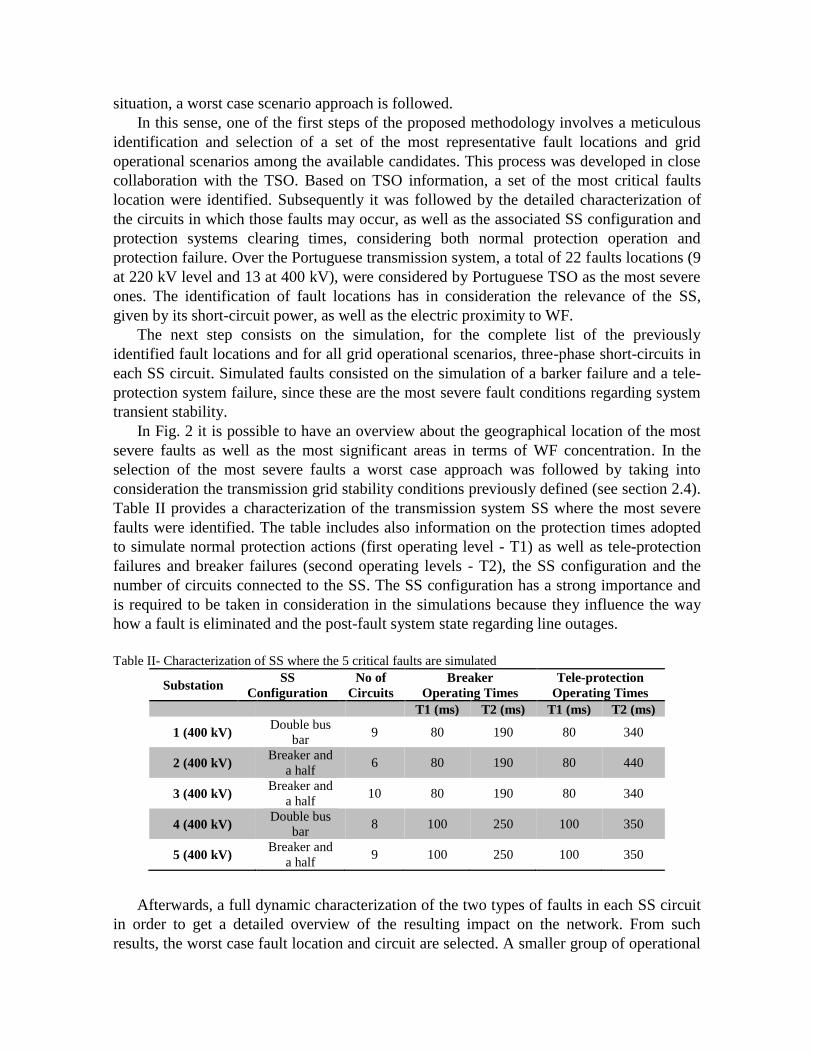
Table II provides a characterization of the transmission system SS where the most severe
faults were identified. The table includes also information on the protection times adopted
to simulate normal protection actions (first operating level - T1) as well as tele-protection
failures and breaker failures (second operating levels - T2), the SS configuration and the
number of circuits connected to the SS. The SS configuration has a strong importance and
is required to be taken in consideration in the simulations because they influence the way
how a fault is eliminated and the post-fault system state regarding line outages.
Table II- Characterization of SS where the 5 critical faults are simulated
Substation SS
Configuration
No of
Circuits
Breaker
Operating Times
Tele-protection
Operating Times
T1 (ms) T2 (ms) T1 (ms) T2 (ms)
1 (400 kV) Double bus
bar 9 80 190 80 340
2 (400 kV) Breaker and
a half 6 80 190 80 440
3 (400 kV) Breaker and
a half 10 80 190 80 340
4 (400 kV) Double bus
bar 8 100 250 100 350
5 (400 kV) Breaker and
a half 9 100 250 100 350
Afterwards, a full dynamic characterization of the two types of faults in each SS circuit
in order to get a detailed overview of the resulting impact on the network. From such
results, the worst case fault location and circuit are selected. A smaller group of operational
scenarios and correspondent faults is chosen for siting and sizing proposes, being the other
ones used to evaluate solution’s robustness. According to the grid security criteria that
should be considered (defined in section 2.4), the identification of a solution should be fully
oriented to the worst case scenarios regarding the issue of simultaneous generation tripping.
However, it is also desirable, from a robustness point of view, to evaluate the effect of the
identified solutions for other scenarios and fault conditions.
Fig. 2 - Portuguese Transmission System: location of the most severe faults, major areas of WF concentration and location of STATCOM
devices to support system operation
3.2 INITIAL SELECTION OF CANDIDATE NODES FOR STATCOM PLACEMENT
In the Portuguese electric power system the majority of medium and small WF are
located within the distribution grid, and therefore located out of the TSO domain.
Conversely, it is also possible to find large WF (in the 100 MW range) directly connected
to the very high voltage grid. Previous studies related to the use of STATCOM devices to
improve FRT conditions in WF demonstrate that this devices are more effective regarding
FRT capability enhancement when placed closer to the WF connection point [6, 7].
Considering the scope of this study and the domain of responsibility of the TSO, the
Wind Farm
Severe Fault
FACTS Device
following technical considerations can be defined regarding the initial definition of
candidate nodes for installing STATCOM devices:
From an economical view point it will not be effective to consider the
installation of STATCOM devices in SS where the total WF installed power is
below a certain limit. In this study the most appropriated limit was considered
to be 20 MW.
Regarding the WF installed in the distribution grid level, STATCOM devices
must be connected as closer as possible to the WF (in this case, the limit is the
63 kV busbar of the transmission SS providing interface to the distribution grid).
Relevant information regarding voltage sag profiles at WF without FRT
capability can be extracted from the dynamic simulations related to faults that
were previously identified. At this stage, some candidate nodes for STATCOM
installation can be excluded if the minimum voltage value observed at their
connection point stays below a certain limit during the fault. In this study the
value of 0.6 p.u. was considered. The general idea associated to such selection is
related to the fact that a STATCOM is not able to sustain the terminal voltage of
a WF without FRT above 0.85 p.u. (undervoltage tripping limit) if it is prone to
suffer very severe voltage dips during a fault.
3.3 OPTIMIZATION PROBLEM DEFINITION
In general terms, the optimization problem to be addressed deals with minimizing the
total cost of installed STATCOM devices, while assuring that the transmission system
complies with the security conditions defined in section 2.4. From a technical point of
view, the cost is directly related to the total installed STATCOM capacity, being neglected
installation and operation costs. In this sense, the optimization procedure is carried out
individually for each i-th operational scenario and simultaneously to a set of faults h over
that scenario according to:
1
* minimize
N
j
ij
Sij
uif (1)
subject to
1 ;0i
ju (2)
max,min,
i
jS
i
jS
i
jS (3)
MWi
hSGT 2000 (4)
i
hSyGT
i
hWGT
i
hSGT (5)
where fi is the objective function that characterizes the total STATCOM installed power for
the operational scenario i, Sij is the installed power of a STATCOM device located at node j
in the operational scenario i, uij is a binary decision variable reflecting the decision of
installing a STATCOM in node j, N is the total number of possible node locations for
STATCOM devices, SGThi is the simultaneous generation tripping (MW), WGTh
i is the
wind power generation tripping (MW) and WGThi is the conventional generation tripping
due to loss of synchronism (MW), respectively for the operational scenario i and fault
condition h. Due to the problem complexity, the optimization procedure is selected to run
for each operational scenario individually, being later established a procedure to harmonize
the solutions and guarantee its robustness among several operational scenarios.
3.4 FINDING THE SOLUTION THROUGH A META-HEURISTIC ALGORITHM
To handle the optimization problem formulated above, a hybrid approach, combining a
meta-heuristic algorithm and a heuristic procedure was used. The meta-heuristic
optimization algorithm is the base method for solving the siting and sizing problem, while
the heuristic procedure is aimed to enhance the optimization process efficiency by
providing inputs to the meta-heuristic. The heuristic method is explained in the following
section.
The Evolutionary Particle Swarm Optimization (EPSO) [23] is used as the meta-
heuristic algorithm. This tool has been used with success in several scientific studies related
to power systems [24-26]. The EPSO fitness function relies on the output of transmission
system dynamic simulations to evaluate the feasibility of a given solution.
The device siting problem is discrete which makes the problem challenging, mainly
since it leads to a mixed-integer formulation and binary variables. In order to overcome this
situation, the discrete nature of the problem was modelled as follows: when the algorithm
sites a STATCOM device with nominal capacity below a specified value (e.g. less than 10
MVAr), then this STATCOM device is not considered as a feasible solution in a dynamic
simulation.
3.5 THE NEED FOR INTEGRATING AN HEURISTIC PROCEDURE
Typically, the EPSO algorithm initiates the optimal solution search by randomly
generating a population of solutions as a set of randomly chosen points within an n-
dimensional space where (n is the number of variables composing the EPSO solution). In
this case, problem dimension corresponds to binary decision variables weather to install or
not a STATCOM device in a particular location and continuous sizing decision variables
related to the device nominal power. However, reducing the dimensionality of EPSO search
space is beneficial in terms of computational efficiency. In order to make this procedure
effective in this specific case, it is necessary to provide an initial delimitation of the search
space, thus requiring the definition of potentially good candidate locations for the
STATCOM devices, as well as limits regarding the device nominal power. In order to
achieve these goals, a specific procedure was implemented, as explained next.
For a given WF without FRT, the capacity of avoiding undervoltage tripping during a
short circuit will result mainly from the additional voltage support provided by the
STATCOM devices located closer to that WF. Having in mind this fact, a heuristic
procedure based on engineering criteria was developed. The main feature of this process is
that it allows the individual characterization and evaluation of the STATCOM based
solutions with the highest potential to prevent the tripping of WF located nearby. This
makes possible to reduce the number of solutions to be found by the meta-heuristic as well
as defining nominal power ranges for each FACTS device individually (speeding up the
optimization process).
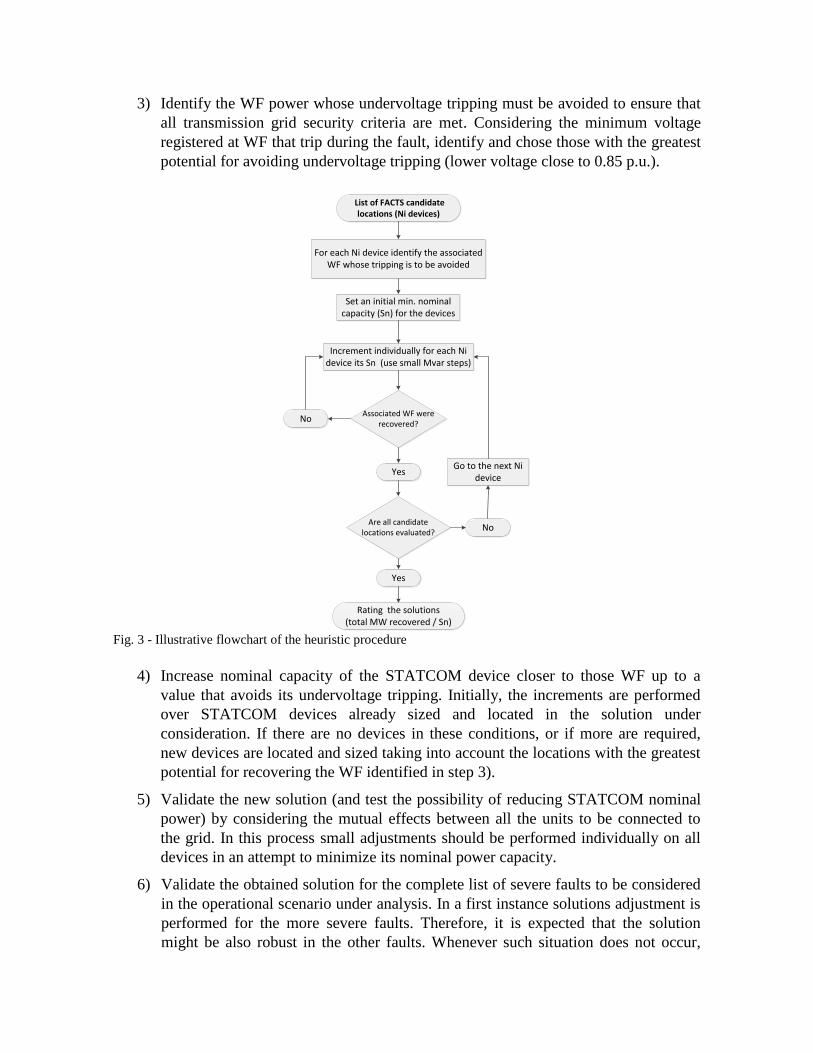
From a practical point of view, the method consists on an iterative process that assumes
a certain operational scenario i and a critical fault condition h, being developed as follows
(see Fig. 3):
1) Assume the installation of a STATCOM device in a candidate node j (according to
the conditions defined in section 3.2);
2) Start an iterative procedure consisting on the step increase of the nominal power of
the STATCOM device in order to define the associated power that avoids the
undervoltage tripping of the WF connected to the same node;
3) Evaluate the quality of this initial sizing of the STATCOM device by a ratio factor
given by the quotient between the WF power in node j whose undervoltage tripping
is avoided (PiWF,j) and the nominal power of the STATCOM device that assures
these condition (Si,jh): i,j
h=PiWF,j/Si,j
h;
4) Proceed to the next candidate node and return to step 2);
5) After evaluating all candidate nodes for each fault condition, order of the initial
sizing of the solutions according to the best ratio i,jh.
This procedure is extremely effective at this stage, since the mutual effects of several
STATCOM devices connected in the grid are initially neglected. Nevertheless, these
mutual effects are taken into account in the subsequent phase through the refinement of the
optimization process based on the use of a meta-heuristic (EPSO algorithm). As a result,
the order in which the candidate nodes are evaluated in this procedure is not as matter of
concern, since a final ordering is produced afterwards. At the end of this process, the best
candidates to be considered within the meta-heuristic procedure are selected from the
ordered lists of candidates that were organized for each critical fault condition.
3.6 SOLUTION ADJUSTMENT PROCESS TOWARDS ROBUSTNESS
The solution adjustment process is a procedure to run after achieving optimum solutions
for each operational scenario initially selected for siting and sizing purposes and is intended
to assure robustness for all the operational scenarios. This process is of utmost importance
since solutions are initially sized for a single operational scenario at a time and may be not
effective for another operational scenario. In this case, the proposed adjustment process
consists on a sequence of steps detailed below:
1) Run a dynamic simulation for specific faults over an operational scenario and for a
certain solution (not initially sized for that scenario).
2) Evaluate the minimum voltage profile recorded at WF without FRT that are
associated with grid nodes identified as candidates for the installation of
STATCOM devices.
3) Identify the WF power whose undervoltage tripping must be avoided to ensure that
all transmission grid security criteria are met. Considering the minimum voltage
registered at WF that trip during the fault, identify and chose those with the greatest
potential for avoiding undervoltage tripping (lower voltage close to 0.85 p.u.).
Fig. 3 - Illustrative flowchart of the heuristic procedure
4) Increase nominal capacity of the STATCOM device closer to those WF up to a
value that avoids its undervoltage tripping. Initially, the increments are performed
over STATCOM devices already sized and located in the solution under
consideration. If there are no devices in these conditions, or if more are required,
new devices are located and sized taking into account the locations with the greatest
potential for recovering the WF identified in step 3).
5) Validate the new solution (and test the possibility of reducing STATCOM nominal
power) by considering the mutual effects between all the units to be connected to
the grid. In this process small adjustments should be performed individually on all
devices in an attempt to minimize its nominal power capacity.
6) Validate the obtained solution for the complete list of severe faults to be considered
in the operational scenario under analysis. In a first instance solutions adjustment is
performed for the more severe faults. Therefore, it is expected that the solution
might be also robust in the other faults. Whenever such situation does not occur,
For each Ni device identify the associated WF whose tripping is to be avoided
Set an initial min. nominal capacity (Sn) for the devices
Increment individually for each Ni device its Sn (use small Mvar steps)
Associated WF were recovered?
List of FACTS candidate locations (Ni devices)
No
Go to the next Ni device
Yes
No
Yes
Are all candidate locations evaluated?
Rating the solutions (total MW recovered / Sn)
repeat steps 1) to 5) for faults that have led to violations of the established criteria.
4. RESULTS AND ANALYSIS
Following the presentation and discussion of the proposed methodology for sizing and
siting the STATCOM devices in the Portuguese transmission system, this section shows the
most important results that were attained. For a better understanding, results were divided
in three groups: characterization of the simulated situation, siting and sizing the solutions
and sensitivity studies.
4.1. CHARACTERIZATION OF THE SIMULATED SITUATION
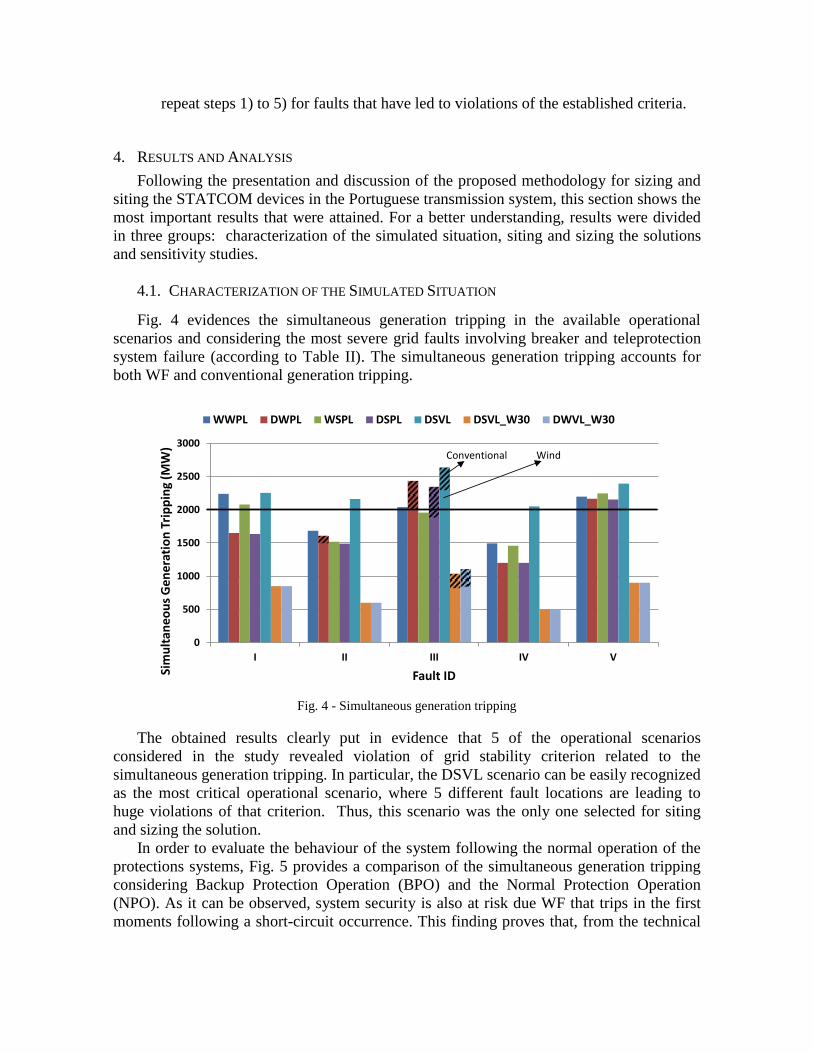
Fig. 4 evidences the simultaneous generation tripping in the available operational
scenarios and considering the most severe grid faults involving breaker and teleprotection
system failure (according to Table II). The simultaneous generation tripping accounts for
both WF and conventional generation tripping.
Fig. 4 - Simultaneous generation tripping
The obtained results clearly put in evidence that 5 of the operational scenarios
considered in the study revealed violation of grid stability criterion related to the
simultaneous generation tripping. In particular, the DSVL scenario can be easily recognized
as the most critical operational scenario, where 5 different fault locations are leading to
huge violations of that criterion. Thus, this scenario was the only one selected for siting
and sizing the solution.
In order to evaluate the behaviour of the system following the normal operation of the
protections systems, Fig. 5 provides a comparison of the simultaneous generation tripping
considering Backup Protection Operation (BPO) and the Normal Protection Operation
(NPO). As it can be observed, system security is also at risk due WF that trips in the first
moments following a short-circuit occurrence. This finding proves that, from the technical
0
500
1000
1500
2000
2500
3000
I II III IV V
Sim
ult
ane
ou
s G
en
era
tio
n T
rip
pin
g (M
W)
Fault ID
WWPL DWPL WSPL DSPL DSVL DSVL_W30 DWVL_W30
Conventional Wind
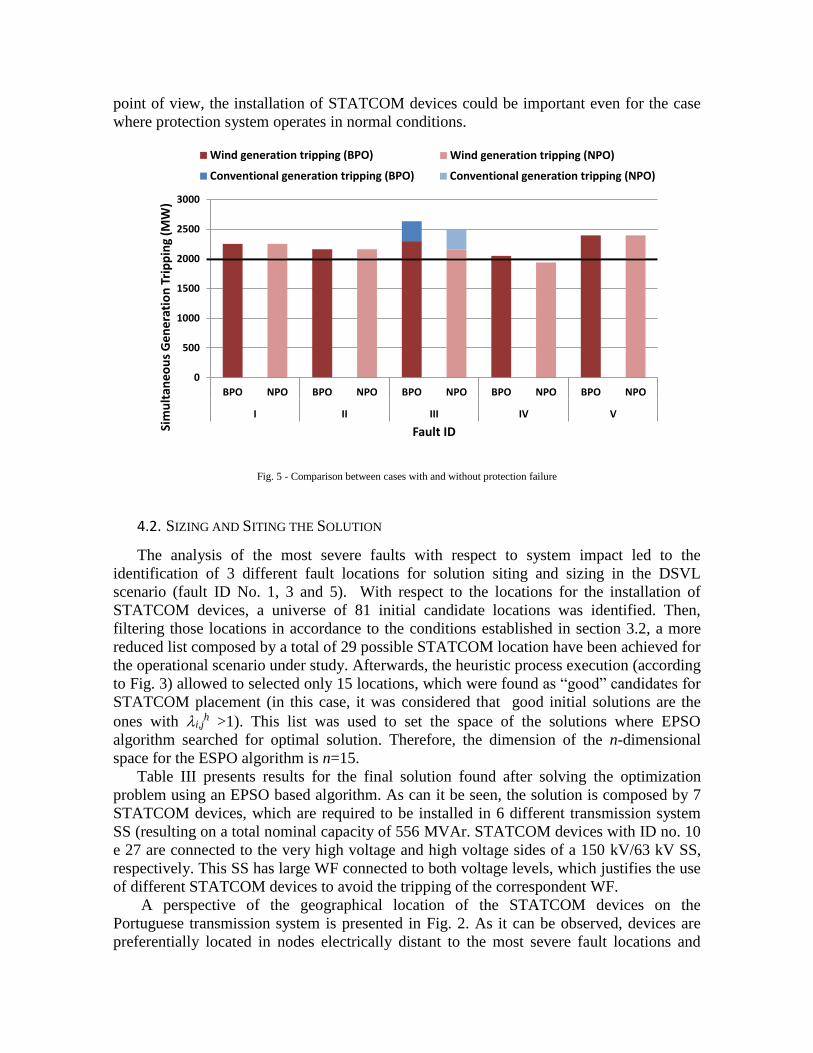
point of view, the installation of STATCOM devices could be important even for the case
where protection system operates in normal conditions.
Fig. 5 - Comparison between cases with and without protection failure
4.2. SIZING AND SITING THE SOLUTION
The analysis of the most severe faults with respect to system impact led to the
identification of 3 different fault locations for solution siting and sizing in the DSVL
scenario (fault ID No. 1, 3 and 5). With respect to the locations for the installation of
STATCOM devices, a universe of 81 initial candidate locations was identified. Then,
filtering those locations in accordance to the conditions established in section 3.2, a more
reduced list composed by a total of 29 possible STATCOM location have been achieved for
the operational scenario under study. Afterwards, the heuristic process execution (according
to Fig. 3) allowed to selected only 15 locations, which were found as “good” candidates for
STATCOM placement (in this case, it was considered that good initial solutions are the
ones with i,jh >1). This list was used to set the space of the solutions where EPSO
algorithm searched for optimal solution. Therefore, the dimension of the n-dimensional
space for the ESPO algorithm is n=15.
Table III presents results for the final solution found after solving the optimization
problem using an EPSO based algorithm. As can it be seen, the solution is composed by 7
STATCOM devices, which are required to be installed in 6 different transmission system
SS (resulting on a total nominal capacity of 556 MVAr. STATCOM devices with ID no. 10
e 27 are connected to the very high voltage and high voltage sides of a 150 kV/63 kV SS,
respectively. This SS has large WF connected to both voltage levels, which justifies the use
of different STATCOM devices to avoid the tripping of the correspondent WF.
A perspective of the geographical location of the STATCOM devices on the
Portuguese transmission system is presented in Fig. 2. As it can be observed, devices are
preferentially located in nodes electrically distant to the most severe fault locations and
0
500
1000
1500
2000
2500
3000
BPO NPO BPO NPO BPO NPO BPO NPO BPO NPO
I II III IV V
Sim
ult
aneo
us
Gen
erat
ion
Tri
pp
ing
(MW
)
Fault ID
Wind generation tripping (BPO) Conventional generation tripping (BPO)
0
500
1000
1500
2000
2500
3000
BPO NPO BPO NPO BPO NPO BPO NPO BPO NPO
I II III IV V
Sim
ult
ane
ou
s G
en
era
tio
n T
rip
pin
g (M
W)
Fault ID
Wind generation tripping (BPO) Conventional generation tripping (BPO)
0
500
1000
1500
2000
2500
3000
BPO NPO BPO NPO BPO NPO BPO NPO BPO NPO
I II III IV V
Sim
ult
ane
ou
s G
en
era
tio
n T
rip
pin
g (M
W)
Fault ID
Wind generation tripping (BPO) Conventional generation tripping (BPO)
0
500
1000
1500
2000
2500
3000
BPO NPO BPO NPO BPO NPO BPO NPO BPO NPO
I II III IV VSi
mu
ltan
eou
s G
ener
atio
n T
rip
pin
g (M
W)
Fault ID
Wind generation tripping (NPO) Conventional generation tripping (NPO)
0
500
1000
1500
2000
2500
3000
BPO NPO BPO NPO BPO NPO BPO NPO BPO NPO
I II III IV V
Sim
ult
ane
ou
s G
en
era
tio
n T
rip
pin
g (M
W)
Fault ID
Wind generation tripping (NPO) Conventional generation tripping (NPO)
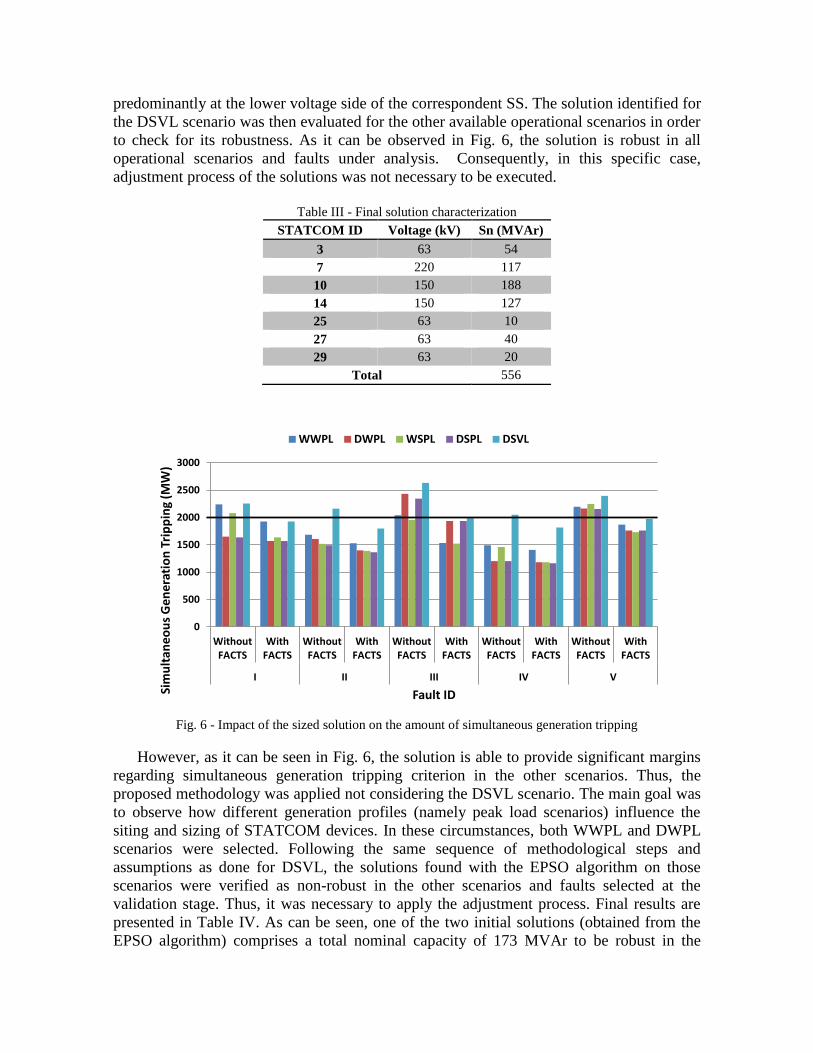
predominantly at the lower voltage side of the correspondent SS. The solution identified for
the DSVL scenario was then evaluated for the other available operational scenarios in order
to check for its robustness. As it can be observed in Fig. 6, the solution is robust in all
operational scenarios and faults under analysis. Consequently, in this specific case,
adjustment process of the solutions was not necessary to be executed.
Table III - Final solution characterization
STATCOM ID Voltage (kV) Sn (MVAr)
3 63 54
7 220 117
10 150 188
14 150 127
25 63 10
27 63 40
29 63 20
Total 556
Fig. 6 - Impact of the sized solution on the amount of simultaneous generation tripping
However, as it can be seen in Fig. 6, the solution is able to provide significant margins
regarding simultaneous generation tripping criterion in the other scenarios. Thus, the
proposed methodology was applied not considering the DSVL scenario. The main goal was
to observe how different generation profiles (namely peak load scenarios) influence the
siting and sizing of STATCOM devices. In these circumstances, both WWPL and DWPL
scenarios were selected. Following the same sequence of methodological steps and
assumptions as done for DSVL, the solutions found with the EPSO algorithm on those
scenarios were verified as non-robust in the other scenarios and faults selected at the
validation stage. Thus, it was necessary to apply the adjustment process. Final results are
presented in Table IV. As can be seen, one of the two initial solutions (obtained from the
EPSO algorithm) comprises a total nominal capacity of 173 MVAr to be robust in the
0
500
1000
1500
2000
2500
3000
WithoutFACTS
WithFACTS
WithoutFACTS
WithFACTS
WithoutFACTS
WithFACTS
WithoutFACTS
WithFACTS
WithoutFACTS
WithFACTS
I II III IV V
Sim
ult
aneo
us
Gen
erat
ion
Tri
pp
ing
(MW
)
Fault ID
WWPL DWPL WSPL DSPL DSVL
WWPL scenario and the other a total of 191 MVAr to be robust in the DWPL scenario. A
robust solution for those two scenarios requires a total nominal capacity of 304 MVAr.
After running the adjustment process, the final solution requires a total of 319 MVAr to be
valid for all the faults and operational scenarios (a value far below of the one obtained
when the severe scenario DSVL is considered).
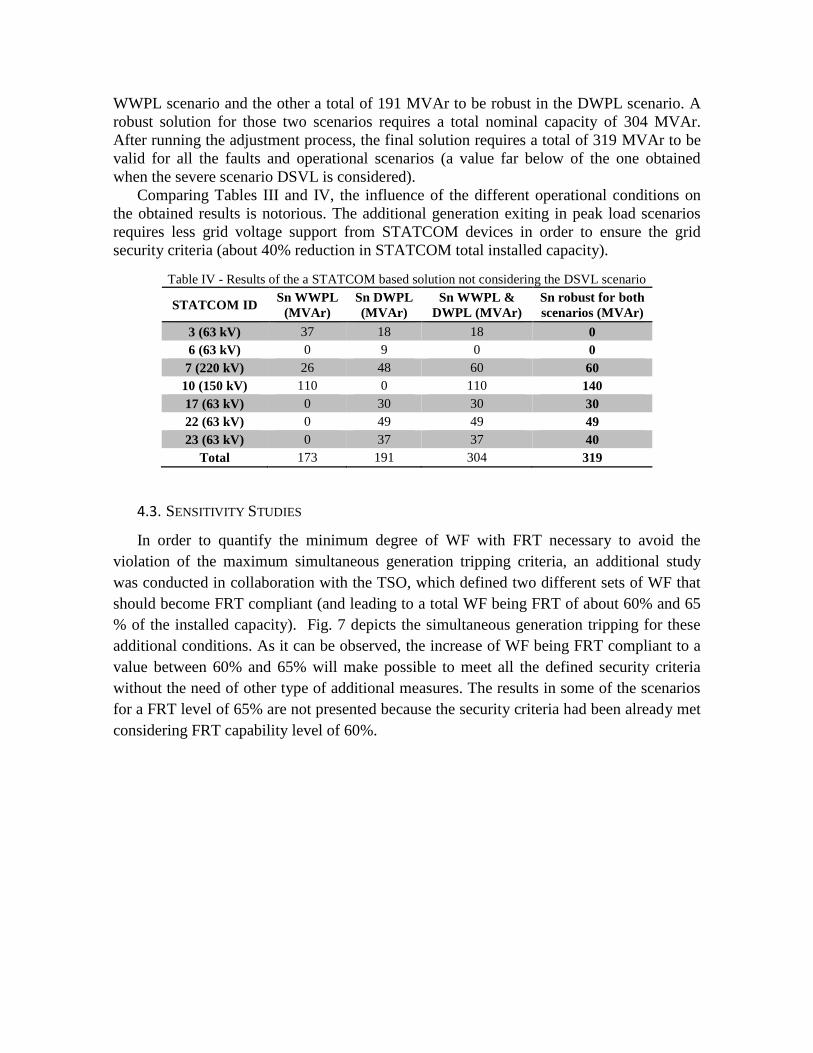
Comparing Tables III and IV, the influence of the different operational conditions on
the obtained results is notorious. The additional generation exiting in peak load scenarios
requires less grid voltage support from STATCOM devices in order to ensure the grid
security criteria (about 40% reduction in STATCOM total installed capacity).
Table IV - Results of the a STATCOM based solution not considering the DSVL scenario
STATCOM ID Sn WWPL
(MVAr)
Sn DWPL
(MVAr)
Sn WWPL &
DWPL (MVAr)
Sn robust for both
scenarios (MVAr)
3 (63 kV) 37 18 18 0
6 (63 kV) 0 9 0 0
7 (220 kV) 26 48 60 60
10 (150 kV) 110 0 110 140
17 (63 kV) 0 30 30 30
22 (63 kV) 0 49 49 49
23 (63 kV) 0 37 37 40
Total 173 191 304 319
4.3. SENSITIVITY STUDIES
In order to quantify the minimum degree of WF with FRT necessary to avoid the
violation of the maximum simultaneous generation tripping criteria, an additional study
was conducted in collaboration with the TSO, which defined two different sets of WF that
should become FRT compliant (and leading to a total WF being FRT of about 60% and 65
% of the installed capacity). Fig. 7 depicts the simultaneous generation tripping for these
additional conditions. As it can be observed, the increase of WF being FRT compliant to a
value between 60% and 65% will make possible to meet all the defined security criteria
without the need of other type of additional measures. The results in some of the scenarios
for a FRT level of 65% are not presented because the security criteria had been already met
considering FRT capability level of 60%.
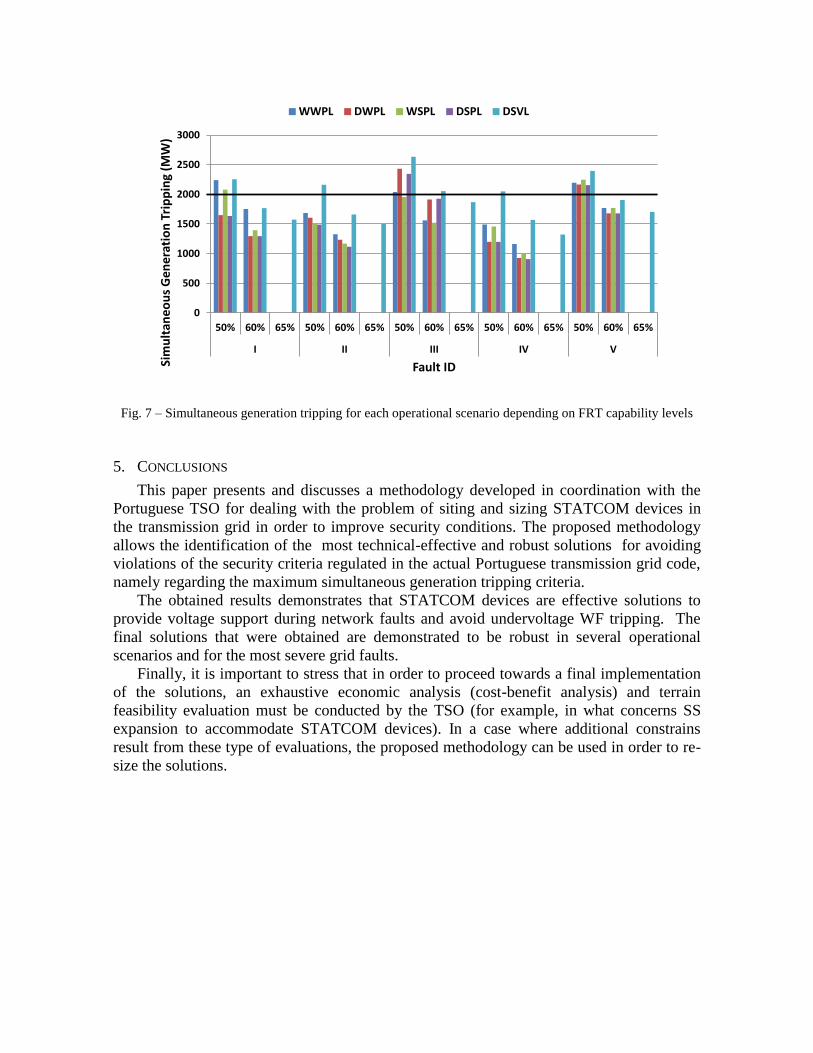
Fig. 7 – Simultaneous generation tripping for each operational scenario depending on FRT capability levels
5. CONCLUSIONS
This paper presents and discusses a methodology developed in coordination with the
Portuguese TSO for dealing with the problem of siting and sizing STATCOM devices in
the transmission grid in order to improve security conditions. The proposed methodology
allows the identification of the most technical-effective and robust solutions for avoiding
violations of the security criteria regulated in the actual Portuguese transmission grid code,
namely regarding the maximum simultaneous generation tripping criteria.
The obtained results demonstrates that STATCOM devices are effective solutions to
provide voltage support during network faults and avoid undervoltage WF tripping. The
final solutions that were obtained are demonstrated to be robust in several operational
scenarios and for the most severe grid faults.
Finally, it is important to stress that in order to proceed towards a final implementation
of the solutions, an exhaustive economic analysis (cost-benefit analysis) and terrain
feasibility evaluation must be conducted by the TSO (for example, in what concerns SS
expansion to accommodate STATCOM devices). In a case where additional constrains
result from these type of evaluations, the proposed methodology can be used in order to re-
size the solutions.
0
500
1000
1500
2000
2500
3000
50% 60% 65% 50% 60% 65% 50% 60% 65% 50% 60% 65% 50% 60% 65%
I II III IV V
Sim
ult
aneo
us
Gen
erat
ion
Tri
pp
ing
(MW
)
Fault ID
WWPL DWPL WSPL DSPL DSVL
6. REFERENCES
[1] Global Wind Energy Council, 'Global Wind Statistics 2013', February 2014
[2] 'REN - Redes Energéticas Nacionais', http://www.ren.pt, accessed April 2014.
[3] Bessa, R. J., Moreira, C., Silva, B.A., Matos, M.: 'Handling renewable energy variability and uncertainty
in power systems operation', Wiley Interdisciplinary Reviews: Energy and Environment, 2014, 3, (2), pp.
156‒178
[4] Tsili, M., Papathanassiou, S.: 'A review of grid code technical requirements for wind farms', IET
Renewable Power Generation, 3, (3), pp. 308‒332
[5] Ministry of Economy, Inovation and Development: 'Grid code for transmission and distribution
systems', Decree no. 596/2010, July 2010 (in Portuguese)
[6] Gaztanaga, H., Etxeberria-Otadui, I., Ocnasu, D., Bacha, S.: 'Real-time analysis of the transient response
improvement of fixed-speed wind farms by using a reduced-scale STATCOM prototype', IEEE Trans. Power
Syst., 2007, 22, (2), pp. 658‒666
[7] Molinas, M., Suul, J.A., Undeland, T.: 'Low voltage ride through of wind farms with cage generators:
STATCOM versus SVC', IEEE Trans. Power Electron., 2008, 23, (3), pp. 1104‒1117
[8] Ramirez, D., Martinez, S., Platero, C.A., Blazquez, F., de Castro, R.M.: 'Low-voltage ride-through
capability for wind generators based on dynamic voltage restorers', IEEE Trans. Energy Convers., 2011, 26,
(1), pp. 195‒203
[9] Carvalhosa, J., Barros, J., Leite, H., Barbosa, A., Pereira, P., Alves, P.: 'Technical and economic impacts
of the 2010's grid code requirements for wind energy in Portugal'. Proc. 2011 11th International Conference
on Electrical Power Quality and Utilisation (EPQU), Lisbon, Portugal, October 2011
[10] Marques, P.J.F., Lopes, J.A.P.: 'Impact of the use of FACTS to increase robustness of operation in
grids with large scale wind generation'. Proc. Nordic Wind Power Conference (NWPC’2006 ), Espoo, Filand ,
May 2006
[11] Barbeiro, P.N.P., Moreira, C.L., Lopes, J.A.P., Rodrigues, A.R., Moreira, J., Rosado, N.: 'Application
of FACTS devices to improve system security'. Proc. 11th Wind Integration Workshop, Lisbon, Portugal,
November 2012
[12] Chatterjee, D., Ghosh, A.: 'Transient stability assessment of power systems containing series and shunt
compensators', IEEE Transactions Power Syst., 2007, 22, (3), pp. 1210‒1220
[13] Panda, S., Padhy, N.P.: 'Optimal location and controller design of STATCOM for power system
stability improvement using PSO', Journal of the Franklin Institute, 2008, 345, (2), pp. 166‒181
[14] Zamora-Cárdenas, A., Fuerte-Esquivel, C.R.: 'Multi-parameter trajectory sensitivity approach for
location of series-connected controllers to enhance power system transient stability', Electric Power Systems
Research, 2010, 80, (9), pp. 1096‒1103
[15] Kazemi, A., Parizad, A., Baghaee, H.R.: 'On the use of harmony search algorithm in optimal placement
of FACTS devices to improve power system security', Proc. IEEE EUROCON 2009, Saint-Petersburg,
Russia, May 2009, pp. 570‒576
[16] Ravi, K., Rajaram, M.: 'Optimal location of FACTS devices using enhanced particle swarm
optimization'. Proc. 2012 IEEE International Conference on Advanced Communication Control and
Computing Technologies (ICACCCT), Ramanathapuram, Tamil Nadu, India, August 2012, pp. 414‒419
[17] Ying, X., Song, Y.H., Chen-Ching, L., Sun, Y.Z.: 'Available Transfer Capability Enhancement Using
FACTS Devices', IEEE Trans. Power Syst., 2003, 18, (1), pp. 305‒312
[18] Ongsakul, W., Jirapong, P.: 'Optimal allocation of FACTS devices to enhance total transfer capability
using evolutionary programming'. Proc. IEEE International Symposium on Circuits and Systems (ISCAS)
2005, Japan, May 2005
[19] Ghahremani, E., Kamwa, I.: 'Optimal placement of multiple-type FACTS devices to maximize power
system loadability using a generic graphical user interface', IEEE Trans. Power Syst., 2013, 28, (2), pp. 764‒
778
[20] Secretaría General de Energía: 'Procedimiento de operación 12.3 Requisitos de respuesta frente a huecos
de tensíon de las instalaciones eólicas', Decree no. 254, 24th October 2006 (in Spanish)
[21] Rodríguez-Bobada, F., Ledesma, P., Martínez, S., Coronado, L., Prieto, E.: 'Simplified wind generator
model for transmission system operator planning studies'. Proc. 7th International Workshop on Large Scale
Integration of Wind Power and on Transmission Networks for Offshore Wind Farms, Madrid, Spain, May
2008
[22] Siemens, 'PSS/E Model Library', June 2009
[23] Miranda, V., Keko, H., Jaramillo, A.:'EPSO: evolutionary particle swarms', in Jain, L., Palade, V.,
Srinivasan, D. (Ed.): 'Advances in Evolutionary Computing for System Design' (Springer Berlin Heidelberg,
2007), pp. 139–167
[24] Miranda, V., Fonseca, N.: 'EPSO - Evolutionary particle swarm optimization, a new algorithm with
applications in power systems'. Proc. IEEE/PES Transmission and Distribution Conference and Exhibition
2002, Yokohama, Japan, October 2002, pp.745–750
[25] Miranda, V., Fonseca, N.: 'EPSO - best-of-two-worlds meta-heuristic applied to power system
problems'. Proc. 2002 Congress on Evolutionary Computation (CEC’02), Honolulu, Hawaii, U.S.A., May
2002, pp. 1080–1085
[26] Madureira, A.G., Peças Lopes, J.A.: 'Coordinated voltage support in distribution networks with
distributed generation and microgrids', IET Renewable Power Generation, 2009, 3, (4), pp. 439–454


