
Sugars in early and late polyketide biosynthesis:
Functional studies of rifL , rifK and rifM in rifamycin biosynthesis
Towards the characterisation of a PKS gene cluster from
Streptomyces sp. GW2/5831, encoding the biosynthesis of the
polycyclic xanthone IB-00208
Dissertation
zur
Erlangung des Doktorgrades (Dr. rer. nat.)
der
Mathematisch-Naturwissenschaftlichen Fakultät
der
Rheinischen Friedrich-Wilhelms-Universität Bonn
vorgelegt von
Silke Engels aus
Euskirchen
Bonn 2009


Angefertigt mit Genehmigung der Mathematisch-Naturwissenschaftlichen Fakultät der Rheinischen Friedrich-Wilhelms-Universität Bonn.
1. Gutachter: Prof. Dr. Jörn Piel 2. Gutachter: Prof. Dr. Gabriele König
Tag der Promotion: _._.2009


für meine Eltern und für Meikel


„Überall geht ein früheres Ahnen dem späteren Wissen voraus.“ Alexander von Humboldt (1769-1859)


Table of contents
I
Table of contents
List of abbreviations.............................................................................................................. V
1 Summary ........................................................................................................................... 1
2 Introduction ...................................................................................................................... 3
2.1 Streptomycetes as polyketide factories ...................................................................... 3
2.2 Biosynthesis of polyketides........................................................................................ 7
2.2.1 Polyketide synthases .............................................................................................. 7
2.2.2 Post-PKS tailoring................................................................................................ 11
2.2.3 Engineered biosynthesis of “unnatural natural products” .................................... 12
2.3 Sugar moieties in early and late polyketide biosynthesis......................................... 13
2.3.1 Rifamycins ........................................................................................................... 13
2.3.2 Functional studies of rifL, rifK and rifM in early rifamycin biosynthesis............ 14
2.3.3 Pentangular aromatic polyketides ........................................................................ 16
2.3.4 IB-00208 and post-PKS tailoring in late polyketide biosynthesis ....................... 16
3 Goals of the present study ............................................................................................. 19
4 Results and discussion.................................................................................................... 22
4.1 Investigating the initial steps in rifamycin biosynthesis .......................................... 22
4.1.1 The RifL-oxidoreductase assay............................................................................ 23
4.1.2 Impact of different nitrogen sources on the RifL assay ....................................... 27
4.1.3 Application of different hydride acceptors in the RifL assay .............................. 29
4.1.4 Purification of cell-free extracts from Streptomyces lividans pHGF7604 ........... 30
4.1.5 Size determination of proteins from Streptomyces lividans pHGF7604.............. 32
4.1.6 Detection of kanosamine...................................................................................... 33
4.1.7 1H-NMR experiments of RifL-incubation samples.............................................. 35
4.1.8 RT-PCR of cDNA from Streptomyces lividans pHGF7604 ................................ 37
4.1.9 Studies of a putative functional interaction between RifL, RifK and RifM ........ 38
4.1.10 The steps catalysed by RifK and RifM ................................................................ 41
4.2 Isolation of a polyketide gene cluster from Streptomyces sp. GW2/5831 ............... 43
4.2.1 Isolation of genomic DNA from Streptomyces sp. GW2/5831............................ 43
4.2.2 Amplification, cloning and sequencing of a gene fragment encoding a ketosynthase in genomic DNA of Streptomyces sp. GW2/5831.......................... 43
4.2.3 Design of specific primers.................................................................................... 46
4.2.4 Production of a genomic library from Streptomyces sp. GW2/5831 ................... 47
4.2.5 Library screening for polyketide synthase gene fragments.................................. 49
4.2.6 Restriction mapping and spot-sequencing of the positive cosmid clones............ 50

Table of contents
II
4.2.7 Heterologous expression of the positive cosmid sequences................................. 55
4.2.8 Subcloning and sequencing of selected cosmid clones........................................ 59
5 Materials and methods (experimental procedures) .................................................... 73
5.1 Chemicals, laboratory equipment and other materials ............................................. 73
5.1.1 Chemicals ............................................................................................................. 73
5.1.2 Molecular biological kits, enzymes and molecular weight markers .................... 75
5.1.3 Laboratory equipment and other materials........................................................... 76
5.1.4 Sterilisation of solutions and equipment .............................................................. 77
5.1.5 Preparation of Millipore® water ........................................................................... 77
5.1.6 Clean room conditions ......................................................................................... 77
5.2 Biological material, plasmids and oligonucleotides................................................. 77
5.3 Buffers and solutions................................................................................................ 80
5.4 Microbiological methods.......................................................................................... 83
5.4.1 Culture media and antibiotics............................................................................... 83
5.4.2 Cultivation and long term storage of Streptomyces lividans strains .................... 84
5.4.3 Cultivation of Streptomyces sp. GW2/5831......................................................... 85
5.4.4 Preparation of a spore suspension from Streptomyces albus for conjugation...... 86
5.4.5 Cultivation and long term storage of recombinant Streptomyces albus strains ... 86
5.4.6 Cultivation and long term storage of recombinant E. coli strains........................ 87
5.4.7 Growth kinetics of Streptomyces lividans ............................................................ 87
5.5 Molecular biological methods.................................................................................. 87
5.5.1 Isolation of genomic DNA from gram positive bacteria...................................... 87
5.5.2 Isolation of plasmid and cosmid DNA................................................................. 88
5.5.3 Purification, concentration and quantification of DNA ....................................... 88
5.5.4 Agarose gel electrophoresis ................................................................................. 90
5.5.5 DNA amplification by the polymerase chain reaction (PCR).............................. 91
5.5.6 Reverse transcription polymerase chain reaction (RT-PCR) ............................... 94
5.5.7 Enzymatic manipulation of DNA......................................................................... 96
5.5.8 Cloning of PCR fragments in a T-overhang vector.............................................. 98
5.5.9 Preparation of competent cells and their transformation ..................................... 99
5.5.10 Construction of a gene library from Streptomyces sp. GW2/5831 .................... 101
5.5.11 Intergeneric transfer of cosmid DNA between E. coli and Streptomyces .......... 104
5.5.12 DNA sequence analysis...................................................................................... 105
5.6 Protein biochemical methods ................................................................................. 107
5.6.1 Preparation of crude cell-free extracts from Streptomyces liquid cultures ........ 107
5.6.2 Protein purification by means of fractionated ammonium sulfate precipitation 107
Table of contents
III
5.6.3 Removal of low molecular weight components from crude cell-free extracts .. 108
5.6.4 Concentration of pre-purified proteins from column eluents............................. 108
5.6.5 Colorimetric quantitative analysis based on Bradford’s method ....................... 109
5.6.6 UV-spectroscopy................................................................................................ 109
5.6.7 Protein separation via polyacrylamide gel electrophoresis (PAGE).................. 110
5.7 Analytical methods................................................................................................. 112
5.7.1 Thin layer chromatography (TLC)..................................................................... 112
5.7.2 High performance liquid chromatography (HPLC)........................................... 112
5.7.3 Fast Protein Liquid Chromatography (FPLC).................................................... 112
5.7.4 Mass spectroscopy.............................................................................................. 113
5.7.5 1 H-NMR experiments........................................................................................ 114
5.8 Synthesis of 2-oxoglutaramate............................................................................... 114
6 Appendix ....................................................................................................................... 116
7 Curriculum vitae .......................................................................................................... 118
8 Selbständigkeitserklärung........................................................................................... 120
9 References ..................................................................................................................... 121

IV

Abbreviations
V
List of abbreviations
A Adenine ACP Acyl carrier protein ATP Adenosine tri phosphate BLAST Basic local alignment search tool bp Base pairs BSA Bovine serum albumin C Cytosine °C Degree centigrade CoA Coenzyme A Da Dalton DMSO Dimethyl sulfoxide DNA Deoxyribonucleic acid DNase Deoxyribonuclease dNTP Deoxynucleoside triphosphate EDTA Ethylen diamine tetra acetic acid e.g. Latin ‘exempli gratia’; for example et al. Latin ‘et alii’; and others EtOH Ethanol FPLC Fast protein liquid chromatography g G-force g Gram G Guanine GC Gas chromatography h Hour HPLC High performance liquid chromatography kb Kilo base pairs KS β-ketoacylsynthase, ketosynthase λ Wavelength [nm] l Liter LB Luria Bertani medium M Molar [Mol/l] MALDI-TOF Matrix-assisted laser desorption/ionisation-
time of flight MCS Multiple cloning site mg 10-3 gram ml 10-3 liter mM 10-3 molar min Minute(s) MS Mass spectroscopy m/v Mass-to-volume ratio m/z Mass-to-charge ratio µg 10-6 gram µl 10-6 liter NAD Nicotinamide adenine dinucleotide NADH Nicotinamide adenine dinucleotide, reduced
form ng 10-9 gram nm 10-9 meter

Abbreviations
VI
NMR Nuclear magnetic resonance OD600 Optical density at λ = 600 nm PCR Polymerase chain reaction pH Potentia hydrogenii PKS Polyketide synthase ppm Parts per million rif Gene from rifamycin cluster Rif Protein from rifamycin cluster RNA Ribonucleic acid rpm Rounds per minute SDS-PAGE Sodium dodecyl sulfate-polyacrylamide gel
electrophoresis sec Second (s) sp. Species t/min Time in minutes T Thymine TAE Tris-acetate-EDTA Taq Thermus aquaticus TBE Tris-borate-EDTA TLC Thin layer chromatography U Unit UV Ultra violet V Volt VIS Visible
Summary
1
1 Summary The first section of this work comprises investigations concerning the initial steps in
rifamycin biosynthesis. The amino sugar kanosamine was described to represent the most
likely source of the nitrogen atom in the aminoshikimate pathway and is putatively
synthesised by the catalytic activity of the enzymes RifL, RifK and RifM. Furthermore, in
earlier studies kanosamine was even converted to kanosamine 6-phosphate by the rifamycin
biosynthetic enzyme RifN. Therefore, evidence but no proof for the occurrence of
kanosamine at an early stage in rifamycin biosynthesis was provided before the beginning of
the present work. In this work functional studies of the gene products of rifL, rifK and rifM
from the rifamycin producer Amycolatopsis mediterranei S699 were carried out using the
plasmid pHGF7604 for the heterologous expression of the rifG-N genes in Streptomyces
lividans TK24. Kanosamine was supposed to be synthesised by RifL, RifK and RifM during
the RifL assay, employing a cell-free extract of Streptomyces lividans pHGF7604. These
studies were based on former results concerning the RifL assay and aimed at the analytical
detection of the putatively synthesised intermediate kanosamine en route to the known
ansamycin precursor AHBA. Therefore, the RifL assay system was optimised, protein
purification of cell-free extracts from Streptomyces lividans pHGF7604 was performed and
analytical methods for kanosamine detection were developed within the scope of this study.
The amino sugar was not detected in any RifL incubation sample, whereas concurrently no
RT-PCR product of RifL could be verified. However, actual proof for an involvement of rifL,
rifK and rifM in the postulated biosynthetic pathway of rifamycin could not be demonstrated
under the terms of this study.
The second section of this work is directed towards the characterisation of the gene cluster
encoding the biosynthesis of the polycyclic xanthone IB-00208 in Streptomyces sp.
GW2/5831. As polyketides represent an important source of nature-derived pharmaceuticals,
their exploration provides promising opportunities for the discovery of new biogenic agents.
Moreover, the acquirement of insights on the genetic level provides important information for
genetic engineering that can lead to novel hybrid compounds with improved therapeutic
values. In polyketide gene clusters “core” polyketide synthase (PKS) genes are encountered
along with “post” PKS genes encoding modifying enzymes like oxygenases, methyl- and
glycosyltransferases. In particular, glycosylation reactions that take place during post-PKS
tailoring processes are relevant for genetic engineering. Especially genes encoding
glycosyltransferases that catalyse (deoxy-) sugar attachments to the matured molecule are

Summary
2
focussed on. The information obtained in this part of the work should provide a prerequisite
for a prospective genetic engineering of the IB-00208 and griseorhodin A biosynthetic
pathways. A glycosylated griseorhodin A molecule is expected to feature improved
pharmacokinetic properties. As both compounds share the same polyaromatic core skeleton, it
can be envisioned that griseorhodin A will be accepted as an aglycon-substrate by the
glycosylating enzyme from the IB-00208 cluster. To isolate the IB-00208 cluster, a genomic
library was established from DNA of Streptomyces sp. GW2/5831, and screening was
performed employing ketosynthase (KS) primers. Sequencing of the positive cosmid clones
and subsequent BLAST search allowed the deduction of a putative cluster fragment
containing protein coding regions characteristic of this kind of PKS clusters, and genes
possibly involved in the biosynthesis of IB-00208 were identified. The library was
constructed using a shuttle vector that enabled the heterologous expression of the cosmid
sequences in Streptomyces albus. This study sets the stage for further investigations of the IB-
00208 biosynthetic gene cluster from Streptomyces sp. GW2/5831.
Both parts of the study are in the field of actinomycete genetics in drug development,
representing different types of PKS systems. The genetics of streptomycetes is of particular
importance, as it opens up many possibilities in the fields of biotechnology and pharmacy.
Therefore many sequencing projects contribute to an enlarged knowledge on biosynthetic
gene clusters of therapeutic agents that are of substantial interest.
Introduction
3
2 Introduction Secondary metabolites are natural products originating from micro- and macroorganisms.
They are widespread in nature and often exhibit potent physiological activities. The
pharmacological properties of biogenic agents are beneficial for example in the treatment of
infectious diseases or cancer.1 Natural products are generally employed as putative drug
candidates themselves or serve as drug leads in pharmaceutical research.2 In contrast to the
basic primary metabolism, the secondary metabolism is not absolutely essential for the
survival of organisms. These compounds are more likely to inherit ecological functions
regarding defence against predators or diseases, reproductive advantages, improved
intraspecies communication or interspecies competition.3 The secondary metabolism is
usually induced at a certain developmental stage of an organism or by environmental
conditions. Mediation of mutualistic interactions between higher organisms and producing
microorganisms is frequently encountered (e.g., the pederin-producing bacterium, related to
Pseudomonas aeruginosa, that is associated with the beetle Paederus fuscipes4). Natural
products occur in a wide spectrum of chemical product classes (families) including alkaloids,
glycosides, polyketides, terpenoids among others. Polyketides represent a prominent group of
nature-derived drugs, prevalently antibiotics that are mainly produced by actinomycetes, in
particular Streptomyces strains.
2.1 Streptomycetes as polyketide factories
The genus Streptomyces comprises Gram-positive, obligate aerobic bacteria exhibiting a high
content of cytosine and guanine in their DNA.5 Taxonomically, Streptomyces species reside in
the diverse group of actinomycetes. Due to their growth as a vegetative hyphal mass that
creates a filamentous mycelium, enabling them to easily spread through soil, they were
formerly designated as “ray fungi”. Streptomycetes are ubiquitous soil bacteria, likely to be
present in aquatic habitats as well,6 and many of them are able to colonise plant rhizospheres.7
They are important decomposers utilising extracellular hydrolytic enzymes. Their
morphological differentiation is characterised by a life cycle consisting of the germination of
vegetative mycelium from a single spore, followed by growth of aerial hyphae. Septation of
these hyphae then produces unigenomic spore compartments that can commence a new cycle.
The conidiospores represent a semi-dormant stage in the life cycle that can hold on for
decades. It is reported by Morita that viable Streptomyces cultures were recovered from 70
year old soil samples.8 Streptomycetes are still an outstanding source of therapeutically
important agents, even though they have been known for a long time. As a consequence, they

Introduction
4
are invaluable in the medical field, providing approximately half of all known antibiotics.5
Many drugs for the treatment of cancer are Streptomyces-derived as well.9 Furthermore, these
compounds are utilised in agriculture as growth promoters, agents for crop protection,
antiparasitic agents and herbicides.10
The aromatic polyketide actinorhodin 1 (figure 2.1), produced by Streptomyces coelicolor,
provides one of the most thoroughly studied examples of all Streptomyces antibiotics.11 The
production of antibiotics in Streptomycetes is generally growth phase-dependent. The onset of
growth in liquid cultures takes place at the beginning of the stationary phase, whereas on solid
media it coincides with morphological differentiation.
O O
OH OH
OHOH
O
O
O
O COOHHOOC
Figure 2.1: Chemical structure of actinorhodin 1 from Streptomyces coelicolor with antibacterial activity.
As microorganisms developed resistance against antibiotics, and multidrug-resistant
pathogens like methicillin-resistant Staphylococcus aureus (MRSA) appeared, the search of
new agents and modified compounds was greatly enforced. Therefore the development of
analytical methods in chemistry and molecular biology led to improved screening techniques
(counter screening), optimised fermentation procedures and target-based modifications on
producing strains. For example, Lang et al. described a dereplication methodology for rapid
small-scale investigation of natural products extracts.12
Many important Streptomyces-derived antibiotics belong to the functionally and structurally
diverse group of polyketides sharing considerable pharmaceutical properties. They especially
serve as lead structures for the synthesis of improved pharmacological compounds. A small
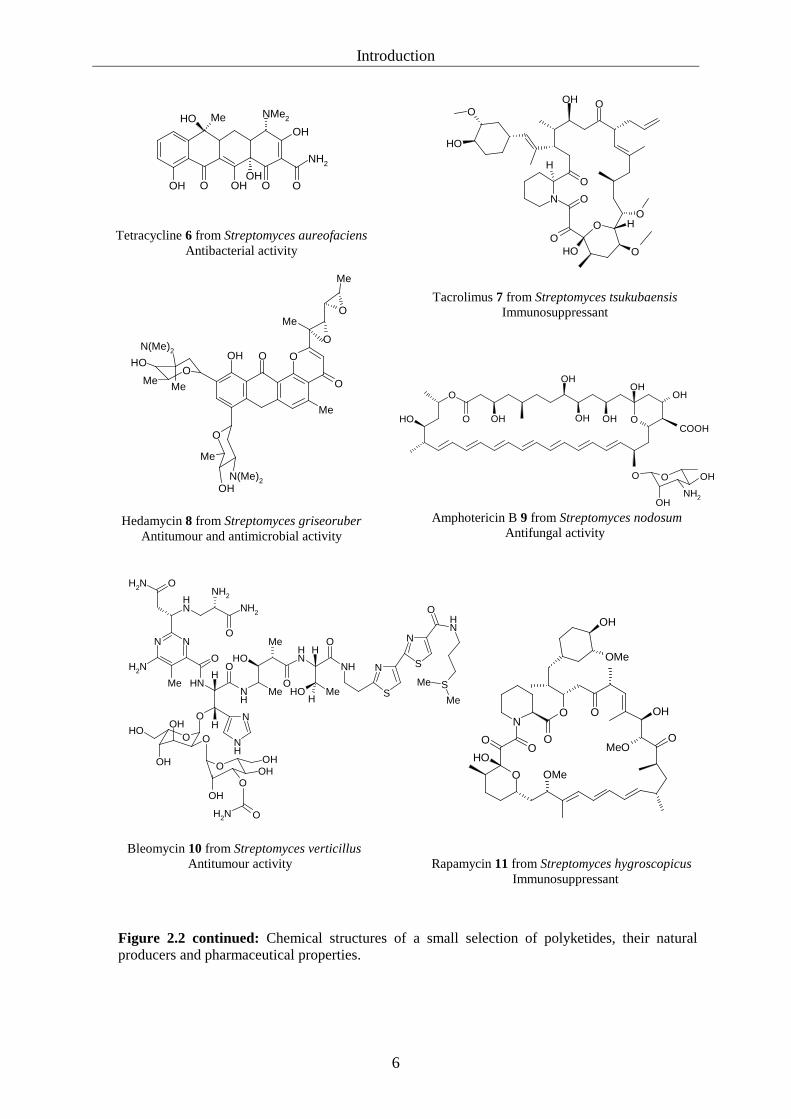
selection of polyketide structures and their natural producers is displayed in figure 2.2.
Polyketides inherit a wide spectrum of pharmaceutically relevant activities, including
antibacterial (monensin 2, tetracycline 6, rifamycin 14), antifungal (amphotericin 9),
antiparasitic (avermectin 3), antitumour (doxorubicin 4, rubromycin 5, hedamycin 8,
bleomycin 10) and immunosuppressant (tacrolimus 7, rapamycin 11) agents. Polyketides are a

Introduction
5
prominent class of natural products often synthesised by soil bacteria like Streptomyces
species, but also by other bacteria, fungi, marine organisms or plants.
The mode of action of a polyketide can, for example, be due to the inhibition of bacterial
protein biosynthesis by disruption of t-RNA binding to the ribosome 30S subunit
(tetracycline 6).13, 14 Furthermore, the reaction can be based on a DNA alkylation process
(hedamycin 8)15 that causes the inhibition of tissue growth, or nuclear or mitochondrial DNA
strands can be ruptured by DNA intercalating agents like doxorubicin 4, resulting in a
cytostatic effect.16
O
OH
O
O O
O
OH
OH
HOOC
MeO
Monensin A 2 from Streptomyces cinnamonensis Antibacterial activity
OH
O
O
OMe
O
O
OMe
O
Me
MeO
OH
O
OH
OO
Avermectin B 3 from Streptomyces avermitilis Antiparasitic activity
OH
O
OH
OH
CH2OH
O
O
O
OMe
NH2OH
O
OO
O
O
MeO
OH
OH
OH
O
O
COOMe
Doxorubicin 4 from Streptomyces peucetius Antitumour activity
γ-rubromycin 5 from Streptomyces collinus Antitumour activity
Figure 2.2: Chemical structures of a small selection of polyketides, their natural producers and pharmaceutical properties.
Introduction
6
OH
MeOH
OH OH
OH
NH2
O O O
NMe2
Tetracycline 6 from Streptomyces aureofaciens Antibacterial activity
OHO
OH
O
OH
HO
O
N
O
H
O
O
O
Tacrolimus 7 from Streptomyces tsukubaensis Immunosuppressant
O
OH
O
O
O
Me
Me
OOH
O
Me
O
N(Me)2
Me
Me Me
OH
N(Me)2
Hedamycin 8 from Streptomyces griseoruber Antitumour and antimicrobial activity
OHOH
OHOH
OOHOH
OHO
OCOOH
O
NH2
O
OH
OH
Amphotericin B 9 from Streptomyces nodosum Antifungal activity
OOH
OHOH
O
NH2 O
NH
S
O
Me
Me
S
N
O
OH
NH
NH
H
O
O
S
N
HN N
Me
NH2
NHNH
Me
NH
OO
OH
OMeOH
H
NH
OMe
NH
NH2
NH2
O
NH2 O
OHOH N
O OMe
O
OHO
O
O
OH
OMe
O OH
MeOO
Bleomycin 10 from Streptomyces verticillus Antitumour activity Rapamycin 11 from Streptomyces hygroscopicus
Immunosuppressant
Figure 2.2 continued: Chemical structures of a small selection of polyketides, their natural producers and pharmaceutical properties.
Introduction
7
2.2 Biosynthesis of polyketides
Polyketide core structures are synthesised by polyketide synthases (PKSs) that are enzymes
related to fatty acid synthases (FASs).17 A wide variety of post-PKS tailoring enzymes act on
the polyketide backbone, yielding structural diversity of the compounds (2.2.2). The
abundance of polyketides can even be further enlarged by genetic engineering of different
biosynthetic pathways (2.2.3).
2.2.1 Polyketide synthases
Different types of polyketides show different architectures of their biosynthetic enzymes,
accompanied by distinct PKS programming. Based on their architecture, PKSs were initially
classified into three families (type I, type II, type III PKS).18 Type I PKSs were described to
work in a modular way, whereas type II PKSs were reported to act in an iterative fashion and
exclusively in bacteria. Ketosynthases (KSs) of type III were classified as iterative chalcone
synthases from plants. However, increasing evidence shows that there are many exceptions to
the original classification. Iterative usage of a type I PKS was reported by a number of
groups, e.g. Bechthold and coworkers.19 Furthermore, the iterative usage of single modules
within a modular type I PKS was discovered (“stuttering”).20-22 Moreover, iteratively acting
distant acyltransferases (ATs) were described that load the extender units in trans to AT-less
type I PKSs, the so-called trans-AT PKSs.23, 24 Later works showed that trans-AT PKSs
evolved in a completely different way than cis-AT systems.25 In the work of Kwon et al. a
novel type II PKS is described that works non-iteratively and lacks an ACP.26 The presence of
(plant-like) PKSs of type III in Streptomyces strains was also discovered. For example, a
bioinformatic approach revealed the presence of three type III PKSs in Streptomyces
coelicolor.27 It has thus become evident that transitional stages between all of the PKS classes
can occur.28 Even a type I/type III polyketide synthase hybrid pathway is described for the
biosynthesis of the structurally diverse ansa compound kendomycin produced by
Streptomyces violaceoruber.29 However, despite the unambiguous occurrence of exceptions,
the type I, II and III paradigms are well appreciated as a rough basis in polyketide
biosynthesis research.18 Therefore, I will now describe the general modes of operation of
different PKS systems to this classification. All types of PKSs share sequential
decarboxylative condensation of the acyl CoA precursors and C-C bond formation catalysed
by the ketoacyl synthase (KS) domains (in type I PKSs) or -subunits (in type II and III PKSs).
Introduction
8
Type I PKSs are multifunctional enzymes that are organised in modules, each harbouring a set
of different domains that mostly work non-iteratively. Each domain catalyses a different step
in the biosynthesis of the polyketide, whereas one cycle of polyketide chain elongation is
catalysed by one module. The giant PKS protein consists of a certain number of chain-
building modules that synthesise (PKS) and modify (reductive cycle, figure 2.3) the carbon
chain. The different domains are ketosynthase- (KS), acyl carrier protein- (ACP), acyl
transferase (AT)-, dehydratase- (DH) or ketoreductase- (KR) domains, except for the trans-
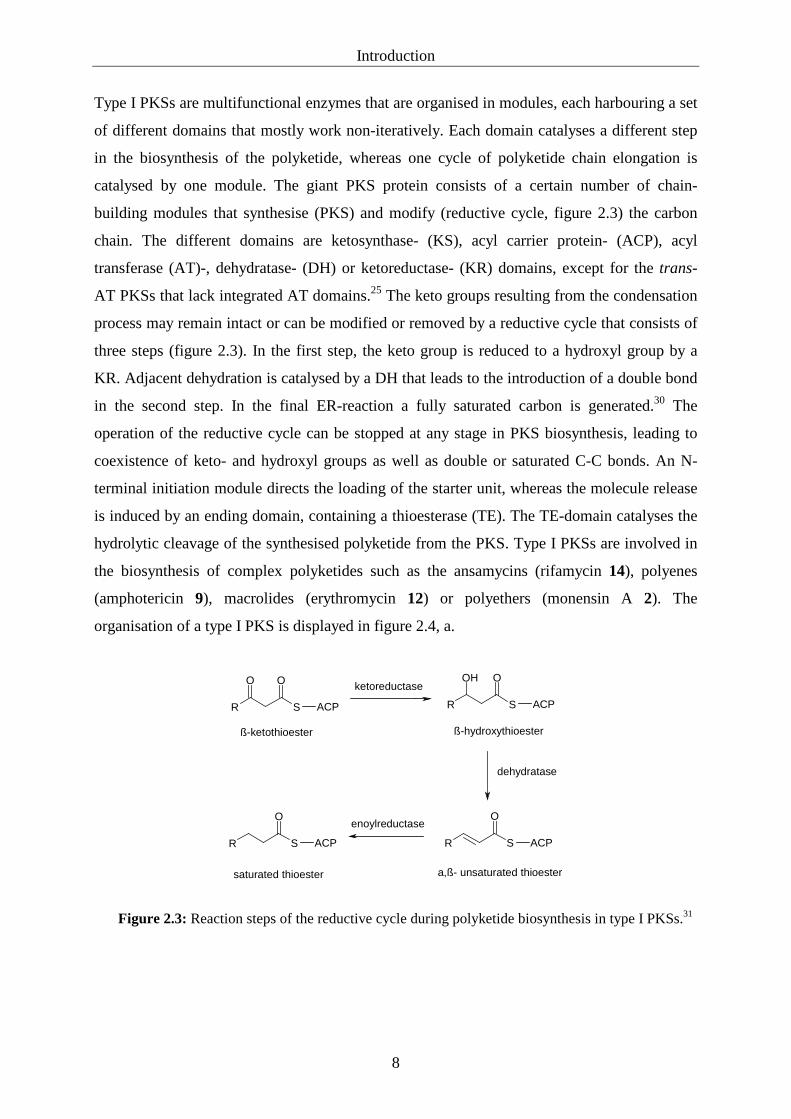
AT PKSs that lack integrated AT domains.25 The keto groups resulting from the condensation
process may remain intact or can be modified or removed by a reductive cycle that consists of
three steps (figure 2.3). In the first step, the keto group is reduced to a hydroxyl group by a
KR. Adjacent dehydration is catalysed by a DH that leads to the introduction of a double bond
in the second step. In the final ER-reaction a fully saturated carbon is generated.30 The
operation of the reductive cycle can be stopped at any stage in PKS biosynthesis, leading to
coexistence of keto- and hydroxyl groups as well as double or saturated C-C bonds. An N-
terminal initiation module directs the loading of the starter unit, whereas the molecule release
is induced by an ending domain, containing a thioesterase (TE). The TE-domain catalyses the
hydrolytic cleavage of the synthesised polyketide from the PKS. Type I PKSs are involved in
the biosynthesis of complex polyketides such as the ansamycins (rifamycin 14), polyenes
(amphotericin 9), macrolides (erythromycin 12) or polyethers (monensin A 2). The
organisation of a type I PKS is displayed in figure 2.4, a.
R S
O O
ACP R S
OOH
ACP
ACPS
O
RACPS
O
R
ketoreductase
dehydratase
enoylreductase
ß-hydroxythioester
a,ß- unsaturated thioester
ß-ketothioester
saturated thioester
Figure 2.3: Reaction steps of the reductive cycle during polyketide biosynthesis in type I PKSs.31

Introduction
9
a) b) c)
S
R
OS
O
OO
SO
OO
SO
OO
RS
OH O O
KSKR KSKSAT ACP AT ACP AT ACP AT KR DH ACP
Loading
(module-1)
PKS
(module-2)
PKS
(module-3)
PKS
(module-4)
KS AT KR DH ACP
PKS
(module-4)
SHS
RO
SO
OO
SO
O
RO
KSα KSβ ACP( - )x - ( y) KSα KSβ ACP( - )x - ( y)
(
KS( )n KS( )n
SO
OO
CoA
S
O
OO
CoA
S
O
O
SH
( )m
)z
Figure 2.4: Schematic organisation of a) type I, b) type II and c) type III PKSs.18 Undefined number of iterative rounds is indicated by lower-case letters.
Type II PKSs are multienzyme complexes carrying a single set of iteratively working proteins
(figure 2.4, b). The enzymatic instrumentation of type II PKSs is based on a minimal PKS32
consisting of the tandem pair termed ketosynthase (KS or KSα) / chain length factor (CLF or
KSβ), that are both beta-ketoacyl synthases, and an acyl carrier protein (ACP). The KSβ
subunit is closely associated with the KSα, thus generating a channel between the two
proteins. When amino acids at four key positions in the KSβ are changed, the channel size is
altered. This mechanism is the controlling factor for chain length determination.33, 34 KSα and
KSβ catalyse the concerted condensation of acyl-thioesters to form a carbon skeleton. The
ACP shuttles acyl components between the active sites of the minimal PKS, and it stabilises
the nascent polyketide intermediates. The ACP unit tethers the growing chain that is extended
by two carbon atoms with any further condensation round.35, 36 The building blocks used for

Introduction
10
extension are for example the activated derivatives of acetic acid and malonic acid, acetyl-
CoA and malonyl-CoA. The acetyl-CoA starter unit is not directly loaded onto the PKS. It is
derived from a previously loaded malonyl-CoA molecule by loss of carbon dioxide.37 As only
one KS pair is present in this type II PKSs, iterative rounds are necessary to produce a carbon
chain. Additional PKS subunits like ketoreductases (KRs), cyclases (CYCs) and aromatases
(AROs) direct the processes that convert the elongated poly-β-ketoacyl chain to the
polyketide intermediate that is subsequently modified by tailoring enzymes (2.2.2). Cyclases
and related subunits function as “chaperone-like” enzymes ensuring the proper assembly of
one single product from the highly instable poly-β-ketoacyl chain.38 Type II PKSs are
responsible for the biosynthesis of aromatic polyketides like actinorhodin 1 (figure 2.1),
doxorubicin 4, rubromycin 5, tetracycline 6 (figure 2.2), tetracenomycin 13 (figure 2.6) or
griseorhodin A 17 (figure 3.1).39 The basic mechanism of type II polyketide biosynthesis is
displayed in figure 2.4, b.
A wide variety of natural products is synthesised by type III PKSs (figure 2.4, c), especially
pigmented compounds like flavonoids occurring in flowers or fruits. These polyketides, such
as chalcones, stilbenes or resveratrols, exhibit biological activities. For example, chalcones act
as free radical scavengers (antioxidants) and stilbene phytoalexins are involved in plant
pathogen defence.40 Resveratrols, occurring for example in grapes, are described to show
cancer chemopreventive properties.41 Chalcones represent a type III polyketide scaffold, and
the naringenin chalcone synthase (CHS) was identified as one of many enzymes that catalyse
the flavonoid biosynthetic pathway.42 In figure 2.5 the biosynthesis of the flavonoid precursor
naringenin chalcone is displayed. Type III PKSs represent the structurally simplest members
of the three PKS types and, mechanistically, they do not use ACP.43 The monomer subunits of
type III PKSs work independently, each capable of performing all reaction steps. The
assembly of this class of natural products is governed by the simple homodimer KS (III)
protein that performs a series of decarboxylation, condensation and cyclisation reactions. The
active site uses free CoA-linked substrates. Type I and II PKSs use acyl carrier protein (ACP)
for the activation of the acyl CoA substrates, and for the channelling of the growing
polyketide intermediates. Type III PKSs are independent from an ACP function, as they
directly act on the acyl CoA substrates. The iteratively working homodimeric KS protein is
encoded in a single open reading frame and exhibits a small size (80-90 kDa). Therefore type
III PKSs are ideal targets for protein engineering, and one focus in type III polyketide
research is placed on rational engineering of their active sides by changing amino acid

Introduction
11
residues to generate and modify diverse compounds. For example, three of the functionally
divergent type III polyketide synthases, chalcone synthase43, octaketide synthase44 (OKS) and
pentaketide chromone synthase45 (PCS), have been characterised and engineered. Products of
type III PKSs can also be incorporated into more complex natural products like the
glycopeptide antibiotic vancomycin.46
CoAS
O
OH
OH
O O
CoAS OH
OH
OH
OOH
+3x
CHS
p-coumaroyl-CoA malonyl-CoA naringenin chalcone
Figure 2.5: Biosynthesis of the flavonoid precursor naringenin chalcone via the type III PKS chalcone synthase (CHS).42
2.2.2 Post-PKS tailoring
The nascent polyketide molecule synthesised by the PKS can be further modified due to the
activity of tailoring enzymes like monooxygenases, methyltransferases and
glycosyltransferases that act on the natural product.1 Thus the post-PKS tailoring processes
have a huge impact on the overall structure of a polyketide, accompanied by biasing its
pharmaceutical properties, for example antibiotic activity.2 Particularly, glycosyltransferases
play a very important role providing polyketides with sugar moieties.
Sugar components, especially 6-deoxyhexoses, play a major role in natural product activity by
changing the pharmacokinetic properties of the aglycons and serve as recognition sites for
reaction mechanisms.47 Many therapeutically important compounds like avermectin 3,
doxorubicin 4 or erythromycin 12 contain sugar moieties attached to the aglycone core. The
attachment is catalysed by the activity of glycosyltransferases (GTs) that are usually located
inside the biosynthetic gene clusters of the compounds. To a certain extent, some
glycosyltransferases exhibit a “relaxed substrate specificity”48 regarding the structure of the
appended glycosyl unit of the aglycone target and the attachment site on the target core.49, 50
These facts are of avail in genetic engineering (2.2.3). A brief insight into the results of
tailoring enzyme activity on a polyketide core is shown in figure 2.6 instancing erythromycin
A 12 and tetracenomycin 13 biosynthesis.
Introduction
12
a)
SCoA
O O O
SCoA
OH
OH
OH
O
O
O
OH MeO
NMe2OH
Me
C2H5Me
Me
O
O
MeOH
OH
MeMe
O
O
O
OOH
OMe
+DEBS
- CoA (7x)- CO2 (6x) (10x)
tailoring
enzymes
O-
Erythromycin A 12
b)
CoAS O
O OO O O
Me
OO
OOO
SEnz
O
OH
OH OH OH
OH
OH
OMe
OHOH
OHOH Me OO O
O
OMe
OMe
MeO
(10x)
TcmKLM
- CoA- CO2
(10x)
- CO2
- H2O (4x)
tailoring enzymes
aldol addition
Tetracenomycin 13
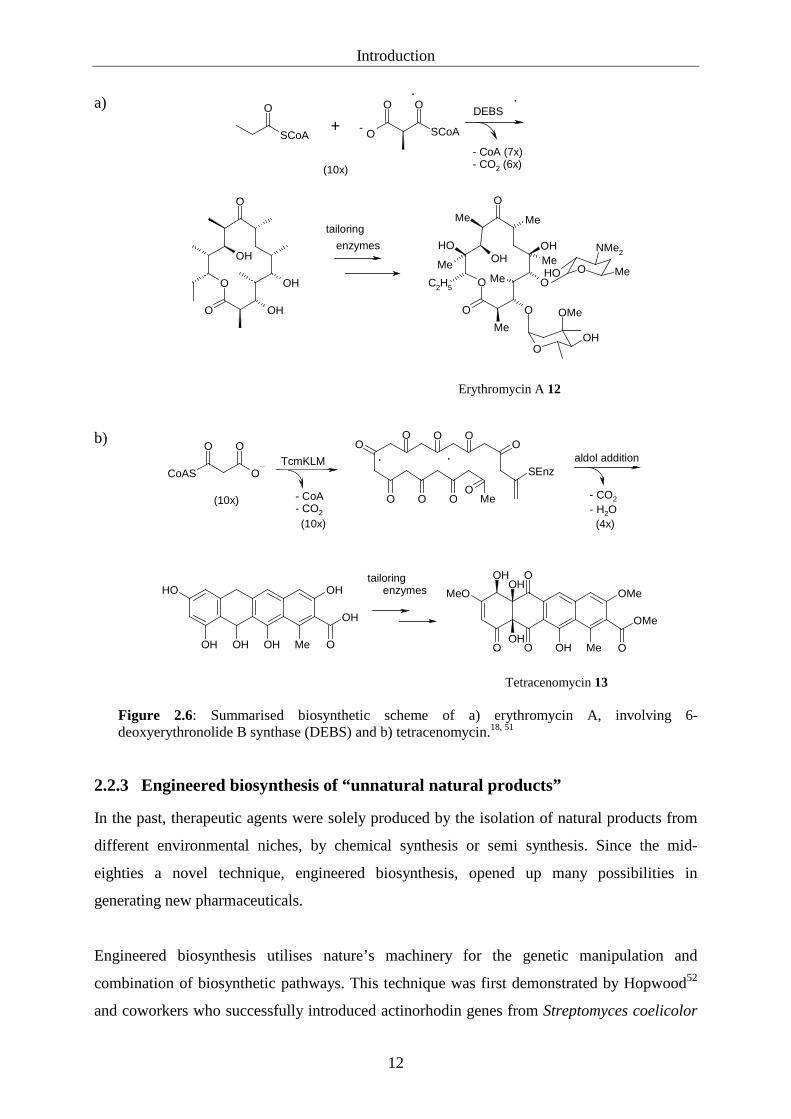
Figure 2.6: Summarised biosynthetic scheme of a) erythromycin A, involving 6-deoxyerythronolide B synthase (DEBS) and b) tetracenomycin.18, 51
2.2.3 Engineered biosynthesis of “unnatural natural products”
In the past, therapeutic agents were solely produced by the isolation of natural products from
different environmental niches, by chemical synthesis or semi synthesis. Since the mid-
eighties a novel technique, engineered biosynthesis, opened up many possibilities in
generating new pharmaceuticals.
Engineered biosynthesis utilises nature’s machinery for the genetic manipulation and
combination of biosynthetic pathways. This technique was first demonstrated by Hopwood52
and coworkers who successfully introduced actinorhodin genes from Streptomyces coelicolor

Introduction
13
into the medermycin producer Streptomyces sp. AM-7161, yielding the new compound
mederrhodin A that carried an additional OH-group as compared to actinorhodin. This
combination of genes from two or more pathways is called combinatorial biosynthesis.
Genetic engineering has become a powerful tool in recent years, leading to the construction of
hybrid compounds that feature improved drug actions.53 Moreover, by generating new
effective agents, genetic engineering might represent an answer to overcoming the resistance
of microorganisms against antibiotics. Due to the fact that sugars are crucial for the effectivity
of many pharmaceutical agents they represent an interesting target for genetic engineering
that is aimed at the biosynthesis of new glycosylated natural products. As a precondition, the
corresponding gene clusters and their functionalities must be investigated and described.
Genes encoding GTs and deoxysugar biosynthesis represent an important biotechnological
tool for altering glycosylation reactions in combinatorial biosyntheses of medically important
compounds. Natural products are of high complexity, making chemical modifications as well
as their total synthesis difficult and non-economic. Therefore the biological approach lends
itself to generating new versions of therapeutical agents. The key benefit of known natural
core skeletons is their validation by evolution. One approach to genetic engineering can be the
modification of the glycosylation pattern. The first recombination experiment involving a GT
was reported by Solenberg et al. where a hybrid glycopeptide was synthesised by using a
cloned GT from the vancomycin producer Amycolatopsis orientalis expressed in
Streptomyces toyocaensis.54 A further study describes the production of several novel
glycosylated tetracenomycins. The hybrid compounds were synthesised by engineered
biosynthesis of the elm gene encoding a GT from the elloramycin producer Streptomyces
olivaceus Tü2352 that was transformed into the urdamycin producer Streptomyces fradiae
Tü2717 and the mithramycin producing strain Streptomyces argillaceus ATCC12956.55
2.3 Sugar moieties in early and late polyketide biosynthesis
2.3.1 Rifamycins
Rifamycins were first isolated from the actinomycete Amycolatopsis mediterranei by Sensi
and coworkers.56, 57 The compounds of this family are potent antibacterial agents, inhibiting
RNA polymerase and thus DNA transcription.58 Rifamycin B 14 (figure 2.7) and derivatives
like rifampicin represent the most important drugs in the treatment of tuberculosis and
leprosy. Rifamycins (A, B, C, D, E, S, SV, W) belong to the family of ansamycins that are
macro cyclic lactam antibiotics.59 Their characteristic structure consists of an aromatic (or
Introduction
14
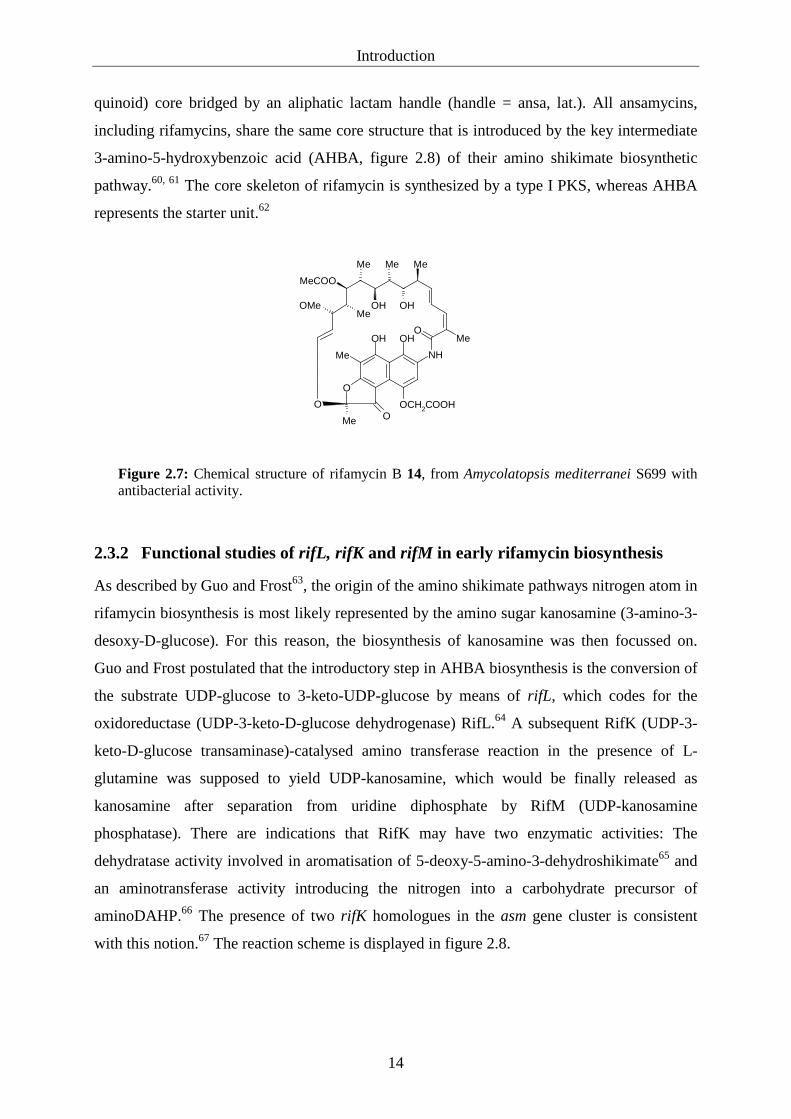
quinoid) core bridged by an aliphatic lactam handle (handle = ansa, lat.). All ansamycins,
including rifamycins, share the same core structure that is introduced by the key intermediate
3-amino-5-hydroxybenzoic acid (AHBA, figure 2.8) of their amino shikimate biosynthetic
pathway.60, 61 The core skeleton of rifamycin is synthesized by a type I PKS, whereas AHBA
represents the starter unit.62
O
Me
NH
O
Me Me Me
OH OH
MeCOO
MeOMe
Me
O
OH OH
Me
OCH2COOHO
Figure 2.7: Chemical structure of rifamycin B 14, from Amycolatopsis mediterranei S699 with antibacterial activity.
2.3.2 Functional studies of rifL, rifK and rifM in early rifamycin biosynthesis
As described by Guo and Frost63, the origin of the amino shikimate pathways nitrogen atom in
rifamycin biosynthesis is most likely represented by the amino sugar kanosamine (3-amino-3-
desoxy-D-glucose). For this reason, the biosynthesis of kanosamine was then focussed on.
Guo and Frost postulated that the introductory step in AHBA biosynthesis is the conversion of
the substrate UDP-glucose to 3-keto-UDP-glucose by means of rifL, which codes for the
oxidoreductase (UDP-3-keto-D-glucose dehydrogenase) RifL.64 A subsequent RifK (UDP-3-
keto-D-glucose transaminase)-catalysed amino transferase reaction in the presence of L-
glutamine was supposed to yield UDP-kanosamine, which would be finally released as
kanosamine after separation from uridine diphosphate by RifM (UDP-kanosamine
phosphatase). There are indications that RifK may have two enzymatic activities: The
dehydratase activity involved in aromatisation of 5-deoxy-5-amino-3-dehydroshikimate65 and
an aminotransferase activity introducing the nitrogen into a carbohydrate precursor of
aminoDAHP.66 The presence of two rifK homologues in the asm gene cluster is consistent
with this notion.67 The reaction scheme is displayed in figure 2.8.

Introduction
15
OOH
OHO-UDP
OH
OOH
OOH
O-UDP
OOH
NH2 OHO-UDP
OHO
OHNH2 OH
NH2OH
COOH
RifL RifK
glutamine/PLP
oxidoreductase aminotransferase
phosphatase
RifM
UDP-glucose 3-keto-UDP-glucose
UDP-kanosamine Kanosamine
AHBA
RifG, H, I, N, J
NAD+
CH2OH
CH2OHCH2OH
CH2OH
Figure 2.8: Proposed introductory steps in AHBA biosynthetic pathway yielding the intermediate kanosamine.63
Guo and Frost detected kanosamine by electrospray mass spectrometry under reaction
conditions including UDP-6,6-[2H2]-glucose, NAD+, glutamine, a cell-free extract from
Amycolatopsis mediterranei and pH 6.8.63 Interestingly, in their study no additional
supplements like PLP or magnesium were required for kanosamine formation. Their work
was inspired by experiments carried out by Umezawa68, where a cell-free extract of the
natural kanosamine producer Bacillus pumilus69 (formerly known as Bacillus
aminoglucosidicus) was incubated with UDP-14C-D-glucose, NAD+ and glutamine yielding 3-
amino-3-deoxy-D-glucose (kanosamine). Furthermore, it was shown by Arakawa et al.70 that
the RifN protein (kanosamine kinase) specifically converts kanosamine into kanosamine-6-
phosphate. In the work of Guo, Frost and Arakawa a cell-free extract of the natural rifamycin
producer Amycolatopsis mediterranei was used.
The gene cluster encoding zwittermicin A biosynthesis in Bacillus cereus UW85 was isolated
in a study by Thomas and coworkers.71 Interestingly, it was proposed that this cluster also
includes genes encoding enzymes involved in kanosamine biosynthesis. The deduction from
the gene sequences led to a putative kanosamine biosynthetic pathway that is analogous to the
mechanism proposed by Guo and Frost.63
A preliminary work by Boettcher72 showed that the RifL oxidoreductase activity was
detectable in cell-free extracts of Streptomyces lividans TK24 pHGF7604. Furthermore, RifL
oxidoreductase activity was not present in cell-free extracts of Streptomyces lividans TK24

Introduction
16
that contained the plasmid pHGF7607 (carrying a mutated rifL gene) or pHGF7608 (carrying
a mutated rifM gene), respectively. Therefore, a specific RifL reaction as well as a co-
operative mechanism among the gene products of at least rifL and rifM could be assumed.
These findings formed the basis of the first section of this work. The putative multienzyme
complex formed by RifL, RifK and RifM could be further investigated by utilisation of
mutants harbouring either a point mutated rifK* gene or a rifK deletion mutant, respectively.
Functional proof of rifL, rifK and rifM in kanosamine biosynthesis is still missing. Although
several indications for the involvement of kanosamine in AHBA formation existed, the amino
sugar had not been verified as an intermediate (formed by RifL, RifK and RifM) of the
rifamycin pathway before the beginning of this work.
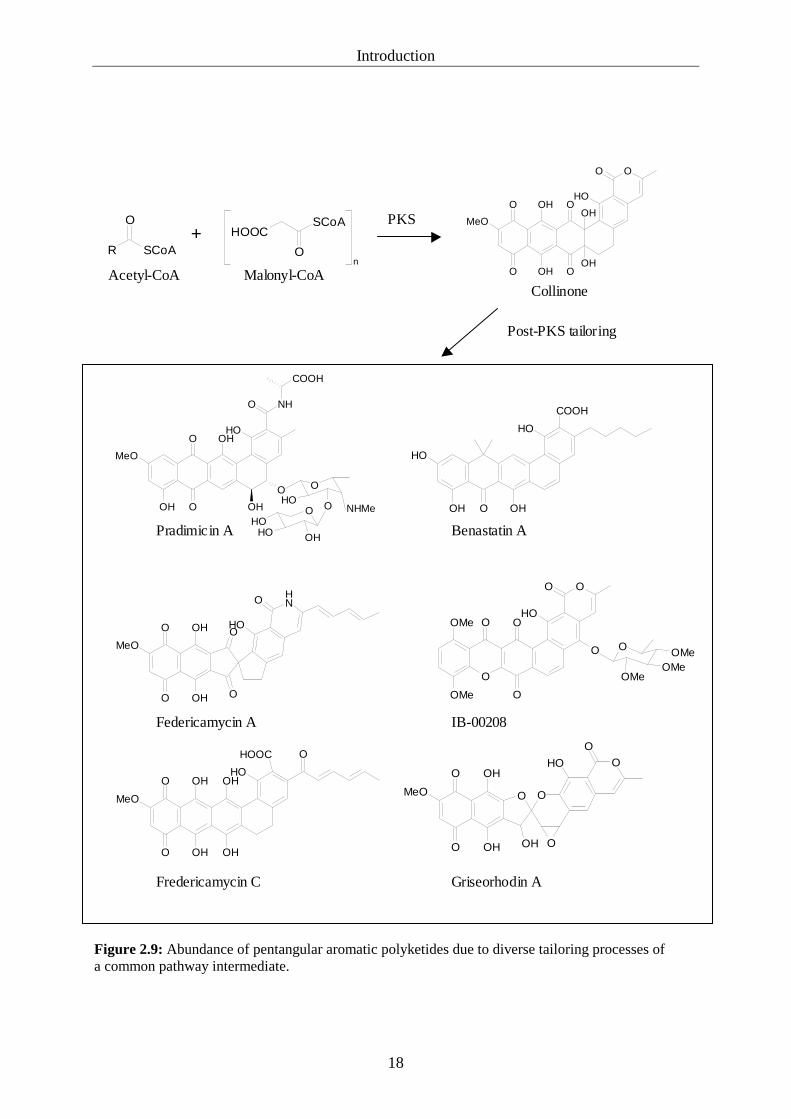
2.3.3 Pentangular aromatic polyketides
Pentangular aromatic polyketides are a group of biosynthetically related, albeit structurally
diverse compounds from actinomycetes. Members of this group are the benastatins (apoptosis
inducing), pradimicins (antifungal), fredericamycins (topoisomerase inhibitor) and members
of the griseorhodin/ rubromycin (human telomerase inhibitor, HIV reverse transcriptase
inhibitor) family (figure 2.9). Different pentangular polyketides are naturally synthesised from
the shared precursor collinone by utilisation of different post-PKS tailoring enzymes. Another
compound that is structurally related to collinone is the polycyclic xanthone IB-00208 (2.3.4,
figure 2.9). The biosynthetic family was termed “pentangular polyketides” by Piel and
Hertweck.73 They identified an unusual type of C-19 ketoreductase (BenL in the benastatin
cluster) that occurs in all pentangular polyketide pathways. Furthermore, gene inactivation
experiments revealed collinone as common intermediate of the rubromycin and griseorhodin
pathways.74 The members of the griseorhodin/ rubromycin family are extensively modified
aromatic polyketides that possess a unique spiroketal pharmacophore crucial for the
antitumour (telomerase inhibition) activity.75 The spiroketal moiety is generated in a highly
complex oxidative tailoring process.76 This includes the cleavage of four carbon-carbon bonds
in a pentangular polyketide precursor followed by an epoxidation event. Concurrent, a large
number of oxidoreductases is encoded in the griseorhodin A PKS system.
2.3.4 IB-00208 and post-PKS tailoring in late polyketide biosynthesis
The polycyclic xanthone IB-00208 displays antibiotic activity against Gram-positive
organisms and antitumour activity against mouse leukaemia, human lung and colon

Introduction
17
carcinoma and human melanoma cell lines.77 Another member of the family of polycyclic
xanthones is the aromatic polyketide lysolipin that is a potent antimicrobial and antitumour
agent that was characterised on the genetic level.78 Other kinds of antibacterial and antitumour
compounds structurally related to IB-00208 are cervinomycins and citreamicins.79, 80 IB-
00208 was first isolated from a marine-derived Actinomadura sp. strain by Malet-Cascon and
co-workers.81 The polycyclic xanthone structure is glycosylated. The appended sugar is a
trimethyldeoxypyranose hexose introduced by a GT during post-PKS tailoring processes.
Moreover, IB-00208 exhibits oxygen units at positions C-2 and C-9. This represents another
similarity to the highly oxidised griseorhodin A and other members of the rubromycin family
(besides the similar intermediate), albeit a spiroketal part is not present in IB-00208.
Genetic engineering between different pentangular post-PKS biosynthetic routes seems to be
a promising method for generating pharmaceuticals tailored to particular needs.
Introduction
18
Figure 2.9: Abundance of pentangular aromatic polyketides due to diverse tailoring processes of a common pathway intermediate.
R SCoA
O SCoA
O
HOOC
n
+PKS
O
O
O
OH
OH
O
O
OH
O
MeOOH
OH
O
OOH
OHOH
NHO
COOH
MeO
OH
O OOH OO
OH
OHOH
NHMe
NH
O
O
O
O
OH
OH O
OH
MeO
OH
OH
OH
OH
OHO
O
O
MeO
HOOC
O
OO
O
O
MeO
OH
OH OH
OH
O
O
O
O
OMe
OMe
O O
O
O
O
OH
O
OMe
OMeOMe
OH
OH
OH OHO
COOH
Pradimicin A
Federicamycin A
Fredericamycin C Griseorhodin A
IB-00208
Benastatin A
Post-PKS tailoring
Acetyl-CoA Malonyl-CoACollinone
Goals of the study
19
3 Goals of the present study The present study comprises two parts that display sugars involved in early and late
polyketide biosynthesis.
Goal of the work presented in chapter 4.1 was to provide a better understanding of the
introductory steps in rifamycin biosynthesis, specifically concerning the formation of the
amino sugar intermediate kanosamine that is putatively encoded by the genes rifL, rifK and
rifM.64 Functional studies of rifL, rifK and rifM from rifamycin B (14) producer
Amycolatopsis mediterranei S699 in a heterologous host should verify their involvement in
kanosamine formation. The analytical detection of kanosamine should be carried out after an
enzymatic catalysis by means of RifL, RifK and RifM from a cell-free extract of Streptomyces
lividans pHGF7604 in the RifL assay system. The enzyme assay should be performed by the
use of a cell-free extract from Streptomyces lividans pHGF7604, harbouring all genes
required for AHBA biosynthesis, the starter unit UDP-glucose and all necessary cofactors
(5.6.6). The RifL assay was previously described to monitor the oxidoreductase reaction
catalysed by RifL.72 Moreover, the existence of a multienzyme complex putatively formed by
RifL, RifK and RifM should be verified. Therefore, cell-free extracts of the rifK mutants
Streptomyces lividans pHGFrifL, K*, M and Streptomyces lividans pHGFrifL, M should be
applied to the assay system. As a consequence, kanosamine should not be formed due to the
pathway interruption caused by a non-functional or lacking rifK gene. The oxidoreductase
RifL was supposed to show activity when associated with inactive RifK*, whereas the
absence of RifK would inhibit RifL activity.
Focus of the second part of this work is the isolation of the polyketide gene cluster encoding
the biosynthesis of IB-00208 15 in Streptomyces sp. GW2/5831 (4.2). The strain Streptomyces
sp. GW2/5831 was isolated from a soil sample by co-workers of Prof. Laatsch.82 The bacterial
cells exhibit a red colour when cultivated on solid medium and in liquid culture due to the
presence of the polyketide. Other compounds produced by Streptomyces sp. GW2/5831 are
not known. The structure of IB-00208 contains a deoxysugar moiety putatively introduced to
the polyketide core structure by a glycosyltransferase during the tailoring processes in late
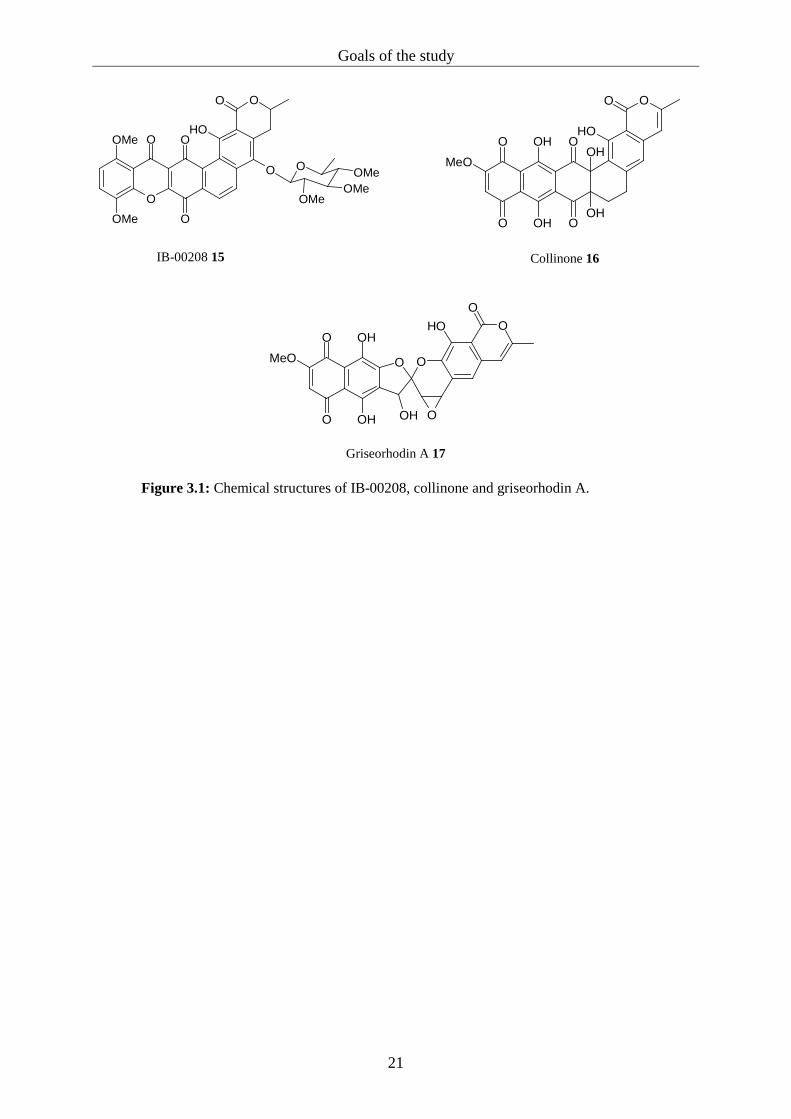
polyketide biosynthesis. IB-00208 is reminiscent of the polyaromatic tridecaketide collinone
16, a precursor of pentangular polyketides like, for example, griseorhodin A 17 (figure 3.1).83
It was therefore assumed that IB-00208 might be synthesised by a type II PKS as well.
Griseorhodin A (a member of the rubromycin family) is a telomerase inhibitor and therefore a

Goals of the study
20
potential anti tumour agent. Due to its insolubility in most solvents, severe restrictions exist
on the utilisation as a drug, whereas structure modification could lead to improved
pharmacokinetics. A promising approach could be the introduction of a deoxysugar moiety
into griseorhodin A structure. The tailoring steps in griseorhodin biosynthesis could thus be
modified by adding the glycosyltransferase gene from Streptomyces sp. GW2/5831. A hybrid
biosynthetic pathway could therefore lead to a glycosylated griseorhodin A compound,
exhibiting improved pharmacokinetic properties. These properties comprise the liberation,
absorption (resorption), distribution, metabolism and excretion of therapeutic agents
(LADME principle).
In Streptomycetes all genes required for the biosynthesis of a particular antibiotic usually
occur in a single cluster accompanied by one or more antibiotic self-resistance genes.84 Type
II PKS biosynthetic gene clusters generally consist of 15 to 40 open reading frames, holding
coding capacities between 20 to 60 kb. Therefore it is promising to establish a genomic
library of a producing organism using lambda phage particles that can be packaged with 40 kb
DNA strands as the maximum size. As the average insert size of the cosmids in the library is
35 kb (4.2), it might be possible to encounter a large portion or even the complete IB-00208
cluster located on one of the positive cosmids. The strategy for detecting the IB-00208 cluster
from Streptomyces sp. GW2/5831 relied on earlier work on griseorhodin A biosynthesis, in
which degenerate PKS primers (deduced from highly conserved motifs of ketosynthase
domains) were utilised as probes to identify the PKS genes encoding griseorhodin A
biosynthesis.83 Therefore a genomic cosmid library should be established and screened for the
ketosynthase domain. Sequence alignments of the positive cosmid clones should reveal
similarities to other type II PKS systems in the data base, and a putative genetic organisation
of the cluster should be deduced. Another goal was the heterologous expression of genomic
fragments from the IB-00208 cluster, harbouring the ketosynthase domain, in Streptomyces
albus that should help to verify the cluster by functional proof.
Goals of the study
21
O
O
OMe
OMe
O O
O
O
O
OH
O
OMe
OMeOMe
O
O
O
OH
OH
O
O
OH
O
MeOOH
OH
IB-00208 15
Collinone 16
O
OO
O
O
MeO
OH
OH OH
OH
O
O
Griseorhodin A 17
Figure 3.1: Chemical structures of IB-00208, collinone and griseorhodin A.

Results and discussion
22
4 Results and discussion
4.1 Investigating the initial steps in rifamycin biosynthesis
The initial steps in rifamycin biosynthesis were proposed to be catalysed by the enzymes
RifL, RifK and RifM yielding the amino sugar kanosamine (figure 2.8).63 In this study, it was
intended to reveal their biosynthetic function in precursor supply by detecting kanosamine
synthesised in a cell-free system (RifL assay, 5.6.6).
The procedure to assay the RifL-oxidoreductase was established in our lab by Boettcher
within the scope of her study on AHBA biosynthesis.72 In the former study, the over-
expression of the relevant enzymes RifL, RifK and RifM in E. coli was not successful as it
resulted in inactive protein. In general, the expression of Streptomyces genes in E. coli can be
difficult because of different codon usage in these strains. Furthermore, incorrect protein
folding or the formation of insoluble inclusion bodies can result in inactive proteins. As
attempts to perform an over-expression of RifL, RifK and RifM in Streptomyces lividans had
been unsuccessful in the study of Boettcher, the rif genes could only be constitutively
expressed. Therefore, Streptomyces lividans TK24 was used by Boettcher as a heterologous
host to the shuttle vector pHGF7604 (figure 4.1) harbouring all eight rifamycin biosynthetic
genes rifG-N required for AHBA biosynthesis.66
In the present study, analytical experiments were developed and carried out in order to detect
the early stage intermediate kanosamine in RifL incubations. The assays were performed
employing cell-free extracts from Streptomyces lividans (TK24) pHGF7604 that was kindly
provided by Boettcher. The assays described in 4.1.9 were carried out using cell-free extracts
from Streptomyces lividans TK23 harbouring different plasmids respectively (figure 4.16,
table 5.8). These experiments were performed in order to access only the relevant genes for
kanosamine formation instead of the complete equipment for AHBA biosynthesis. The
plasmids and recombinant strains employed in 4.1.9 were kindly constructed by Kaulard.85
In this study, the RifL assay was reproduced and carried out using minimal and standard
conditions (4.1.1), different nitrogen sources (4.1.2), different hydride acceptors (4.1.3) and
different purification grades of the cell-free extracts respectively (4.1.4). Protein analysis of
the cell-free extracts was performed using SDS-PAGE and MALDI-TOF-MS (4.1.5). Means
to detect kanosamine comprised TLC, HPLC and GC-MS measurements (4.1.6). Furthermore,

Results and discussion
23
the RifL reaction was monitored via 1H-NMR (4.1.7). RT-PCR was carried out in order to
verify the presence of the required gene products (4.1.8). A putative enzyme complex
between RifL, RifK and RifM was studied (4.1.9) and the RifK and RifM reactions were
investigated separately (4.1.10).
Figure 4.1: Plasmid pHGF7604, map taken from Yu et al. (2001). Shuttle vector, ColE1-origin, Ampr (selection in E. coli); SCP2*-origin, Thior (selection in Streptomyces), genes rifG-N from the rifamycin biosynthetic gene cluster of Amycolatopsis mediterranei S699, under control of the actII-orf4 promoter.
4.1.1 The RifL-oxidoreductase assay
Reproduction of previous experiments
Preliminary studies concerning the NAD+-dependent oxidoreductase RifL were described to
result in the specific conversion of UDP-glucose by RifL in the presence of the hydride
acceptor NAD+.72 At first the earlier assays were reproduced as a precondition to the
analytical detection of the putative assay product kanosamine. The RifL oxidoreductase
enzyme assay was conducted as described in 5.6.6. Initially, no RifL enzyme activity was
encountered. This was overcome by verification of the procedure with regard to all assay
parameters that were double checked. To verify the cultivation period of seven days for
Streptomyces lividans pHGF7604, a growth kinetics was conducted as described in 5.4.7. The
corresponding culture mycelia were harvested after different cultivation periods between one
day to seven days. Each cell pellet was subjected to the production of a cell-free extract that
was applied to the RifL assay. This experiment was the crucial step, revealing NAD+

Results and discussion
24
consumption in a cell-free extract obtained after a five-days cultivation (table 4.1, figure 4.3)
instead of after a seven-days cultivation that had been recommended before. All other assay
conditions were applied as described before, and it was then possible to carry out the assay,
yielding reproducible data relating to NADH accumulation.
Table 4.1 Growth kinetics of Streptomyces lividans (TK24) pHGF7604 and RifL assay results of the corresponding cell-free extracts prepared from mycelia cultivated between one and seven days
Cultivation time [h] Weight [g] Colour of mycelium and R5-medium
UV signal (340 nm) in RifL assay
24 1,6 Yellow - 48 1,9 Yellow - 72 3,3 Yellow - 96 3,9 Yellow - 120 4,2 Blue + 144 4,8 Blue - 168 4,8 Blue -
Figure 4.2: Liquid culture of Streptomyces lividans pHGF7604 in R5 medium, showing blue colour after 120 h cultivation time (table 4.1).
The emerging blue colour of the cultivation medium was attributed to the actII-orf4 promoter
activity located on plasmid pHGF7604 to control gene transcription (figure 4.2). The actII-
orf4 regulatory gene originates from the gene cluster of Streptomyces coelicolor encoding the
biosynthesis of the red-blue coloured antibiotic actinorhodin.5 The formation of this antibiotic,
that is physiologically produced at very low amounts in Streptomyces lividans, can be highly
increased if actinorhodin activation genes are cloned into Streptomyces lividans. This
indicates that ActII-ORF4 should also regulate the downstream genes on pHGF7604
properly.72
Results and discussion
25
Negative control reactions
To provide the test system with a negative control, the unmodified Streptomyces lividans TK
24 strain was utilised and the corresponding preparation of a cell-free extract was performed
as described before. In RifL assay measurements that were carried out employing the
unmodified Streptomyces lividans TK 24 cell-free extract no UV signal at 340 nm occurred
and therefore it was assumed that no NADH production took place (figure 4.3). This was
considered to putatively correlate with the absence of RifL in the cell-free extract of the
unmodified strain. Further control reactions were carried out omitting UDP-glucose, NAD+ or
the cell-free enzyme solution, respectively (figure 4.3). Furthermore, denatured enzyme that
was obtained after heating at 95 °C for 10 min was used as negative control (figure 4.3). All
of these control measurements showed no deviation from a negative reaction. These
observations formed the new basis of RifL enzyme assay, providing evidence that the
predicted RifL-catalysed oxidoreductase reaction takes place.
Standard assay conditions
In order to provide all cofactors and reaction conditions required for kanosamine biosynthesis,
the following substances were included in the standard RifL enzyme essay (5.6.6):
pyridoxalphosphate (PLP) serves as cosubstrate for the RifK aminotransferase. In crystal
structure experiments RifK was shown to be tightly bound to its cofactor PLP.86 The gene
product RifK is known to belong to a family of PLP-dependent aminotransferases
preferentially used by streptomycetes in secondary metabolic pathways for the formation of
amino sugars, aminocyclitols and other amino compounds.87 Due to a typical PLP-binding
motif with a conserved aspartate (Asp-159) and the active site lysine (Lys-188) it is presumed
that the cofactor binds as a Schiff’s base.65 As RifM has considerable similarity to the CBBY
family of phosphoglycolate phosphatases, the RifM-catalysed reaction was supposed to
require magnesium chloride as reported for other CBBY phosphatases.66, 88 Moreover,
magnesium chloride was found to enhance RifL activity (Arakawa, personal communication).
The incubation also required the supply of a nitrogen source for the introduction into the
kanosamine ring (figure 2.8). As reported by Guo and Frost, glutamine was supposed to be
the appropriate nitrogen donor.63
Minimal assay conditions
As described above, the standard enzyme assay included components required for RifL
activity and additionally contained putative supplements for RifK and RifM reactions. In
Results and discussion
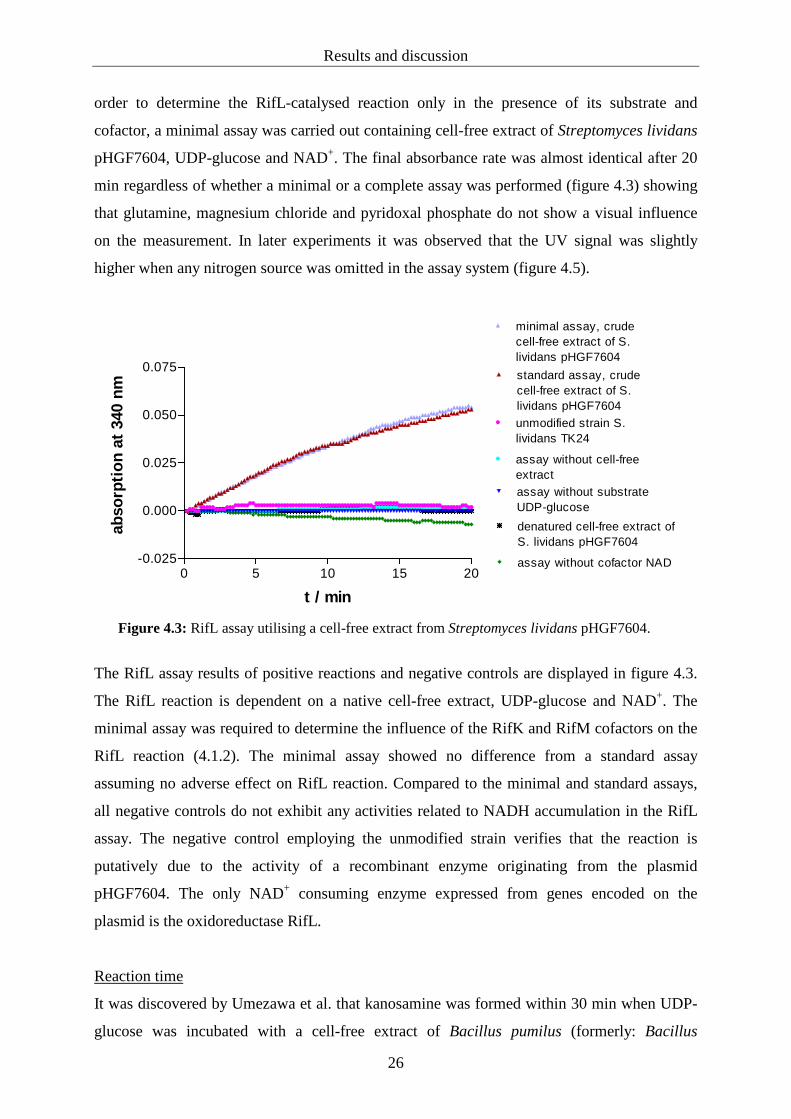
26
order to determine the RifL-catalysed reaction only in the presence of its substrate and
cofactor, a minimal assay was carried out containing cell-free extract of Streptomyces lividans
pHGF7604, UDP-glucose and NAD+. The final absorbance rate was almost identical after 20
min regardless of whether a minimal or a complete assay was performed (figure 4.3) showing
that glutamine, magnesium chloride and pyridoxal phosphate do not show a visual influence
on the measurement. In later experiments it was observed that the UV signal was slightly
higher when any nitrogen source was omitted in the assay system (figure 4.5).
0 5 10 15 20-0.025
0.000
0.025
0.050
0.075
unmodified strain S.lividans TK24
standard assay, crudecell-free extract of S.lividans pHGF7604
assay without substrateUDP-glucose
assay without cofactor NAD
assay without cell-freeextract
denatured cell-free extract ofS. lividans pHGF7604
minimal assay, crudecell-free extract of S.lividans pHGF7604
t / min
abso
rpti
on
at 3
40 n
m
Figure 4.3: RifL assay utilising a cell-free extract from Streptomyces lividans pHGF7604.
The RifL assay results of positive reactions and negative controls are displayed in figure 4.3.
The RifL reaction is dependent on a native cell-free extract, UDP-glucose and NAD+. The
minimal assay was required to determine the influence of the RifK and RifM cofactors on the
RifL reaction (4.1.2). The minimal assay showed no difference from a standard assay
assuming no adverse effect on RifL reaction. Compared to the minimal and standard assays,
all negative controls do not exhibit any activities related to NADH accumulation in the RifL
assay. The negative control employing the unmodified strain verifies that the reaction is
putatively due to the activity of a recombinant enzyme originating from the plasmid
pHGF7604. The only NAD+ consuming enzyme expressed from genes encoded on the
plasmid is the oxidoreductase RifL.
Reaction time
It was discovered by Umezawa et al. that kanosamine was formed within 30 min when UDP-
glucose was incubated with a cell-free extract of Bacillus pumilus (formerly: Bacillus

Results and discussion
27
aminoglucosidicus), glutamine and NAD+ in phosphate buffer.68 In a study by Lee it was
reported that UDP-kanosamine can be detected via HPLC after the incubation of NapL
(homologous to RifL) and NapK (homologous to RifK) with 4 mM UDP-glucose, 4 mM
NADP and 3 mM glutamine for 12 hours at 37 °C and pH 7.4.89 Lee observed that NapL
activity (absorbance rate) was ten-fold higher when NapL was incubated together with NapK.
NapL and NapK are enzymes from the geldanamycin producer Streptomyces hygroscopicus
that correspond to RifL and RifK from the rifamycin producer Amycolatopsis mediterranei.
On the one hand, the first two biosynthetic steps catalysed by RifL and RifK can be assumed
to take place within 12 hours as well, because the absorbance rate of NapL (0.03) was
comparable to RifL (0.05) in this study both determined after 20 min incubation time. On the
other hand, although the Rif and Nap proteins are homologous enzymes, they are functionally
not completely identical. For example, NADP serves as hydride acceptor in NapL/ NapK
incubation as described above, whereas it is not accepted in the RifL reaction (4.1.3.2).
Moreover, there was no PLP needed to accomplish UDP-kanosamine formation, although
RifK is described to be a PLP-dependent aminotransferase.65
The RifL assays were directly subjected to HPLC, and additional assay duplicates were
prepared and were stored at 37 °C for 1, 2, 5, 12 and 24 h for kanosamine formation before
they were proceeded to analysis.
4.1.2 Impact of different nitrogen sources on the RifL assay
For the introduction of the nitrogen atom into the amino sugar ring, glutamine was supposed
to be the appropriate source (figure 2.8).63, 68 To test the influence of different nitrogen
sources on NADH accumulation during the UV assay, glutamine, glutamic acid, asparagine,
aspartic acid and ammonium chloride were tested separately. As reported by Arakawa et al.,
the rate of NADH formation increases when glutamine is added to the RifL assay as nitrogen
source. Asparagine and ammonia were less effective in his study, whereas glutamate and
aspartate were inactive.70 Lee reported that NapL activity was increased in the presence of
glutamine. In this study, all tested nitrogen sources yielded the same absorption rate for
NADH production (figure 4.4).

Results and discussion
28
0 5 10 15 200.000
0.025
0.050
0.0752 mM glutamine
2 mM glutamic acid
2 mM asparagine
2 mM aspartic acid
2 mM ammonia
t/ min
abso
rpti
on
at 3
40 n
m
Figure 4.4: Different nitrogen sources applied to the RifL standard assay.
In another UV incubation series, any nitrogen source was omitted from the assay system in
order to determine the influence of nitrogen absence on the RifL reaction. The RifL assays
without a nitrogen source were carried out employing crude cell-free extract or 60%
ammonium sulfate-precipitated cell-free extract from Streptomyces lividans pHGF7604
respectively. In comparison to standard assays using crude or precipitated cell-free extract, the
absorption rate was increased if any nitrogen source was omitted in the incubation reaction
(figure 4.5).
0 5 10 15 200.00
0.05
0.10
0.15
S. lividans pHGF7604, crudeCFE, without nitrogen source
S. lividans pHGF7604, 60%ammonium sulfate fraction,without nitrogen source
S. lividans pHGF7604, crudeCFE, standard assay
S. lividans pHGF7604, 60%ammonium sulfate fraction,standard assay
t/ min
abso
rpti
on
at 3
40 n
m
Figure 4.5: The effect of nitrogen absence in the RifL assay.
Results and discussion
29
4.1.3 Application of different hydride acceptors in the RifL assay
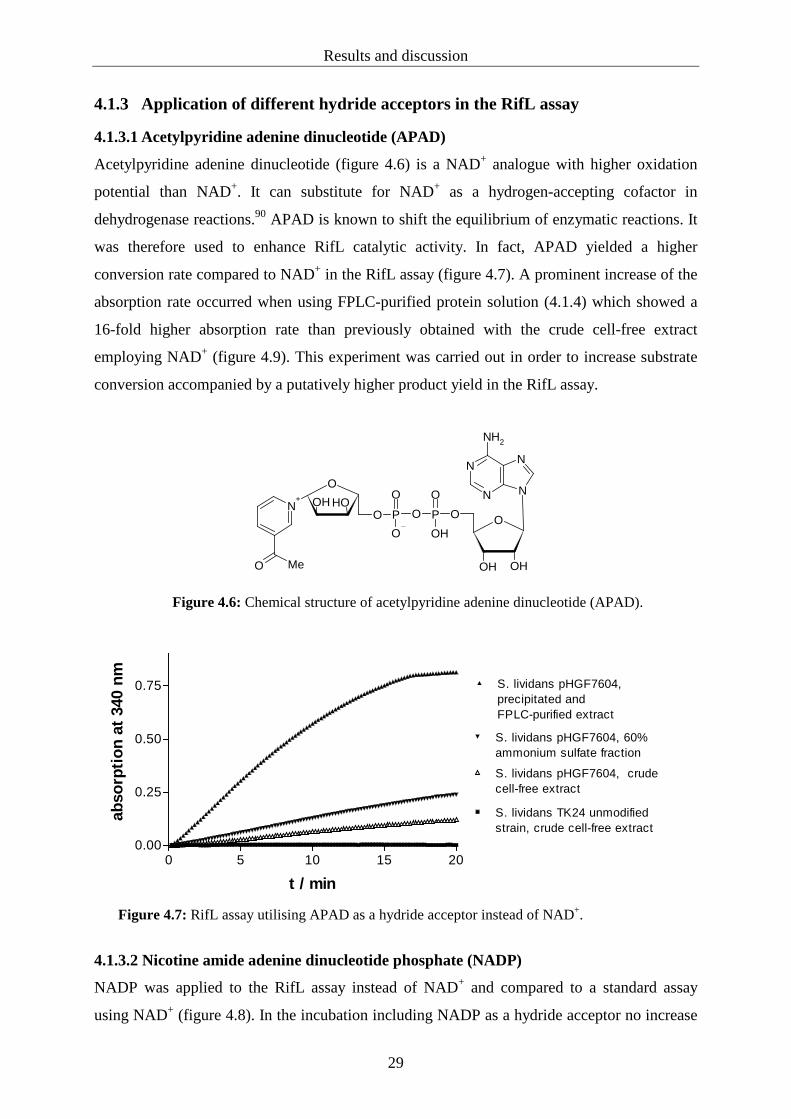
4.1.3.1 Acetylpyridine adenine dinucleotide (APAD)
Acetylpyridine adenine dinucleotide (figure 4.6) is a NAD+ analogue with higher oxidation
potential than NAD+. It can substitute for NAD+ as a hydrogen-accepting cofactor in
dehydrogenase reactions.90 APAD is known to shift the equilibrium of enzymatic reactions. It
was therefore used to enhance RifL catalytic activity. In fact, APAD yielded a higher
conversion rate compared to NAD+ in the RifL assay (figure 4.7). A prominent increase of the
absorption rate occurred when using FPLC-purified protein solution (4.1.4) which showed a
16-fold higher absorption rate than previously obtained with the crude cell-free extract
employing NAD+ (figure 4.9). This experiment was carried out in order to increase substrate
conversion accompanied by a putatively higher product yield in the RifL assay.
N
N
O
O
OH OH
O Me
N+
O
OH OH
P O
O
P O
OH
N
N
NH2
O
O
Figure 4.6: Chemical structure of acetylpyridine adenine dinucleotide (APAD).
0 5 10 15 200.00
0.25
0.50
0.75
S. lividans TK24 unmodifiedstrain, crude cell-free extract
S. lividans pHGF7604, crudecell-free extract
S. lividans pHGF7604, 60%ammonium sulfate fraction
S. lividans pHGF7604,precipitated andFPLC-purified extract
t / min
abso
rpti
on
at 3
40 n
m
Figure 4.7: RifL assay utilising APAD as a hydride acceptor instead of NAD+.
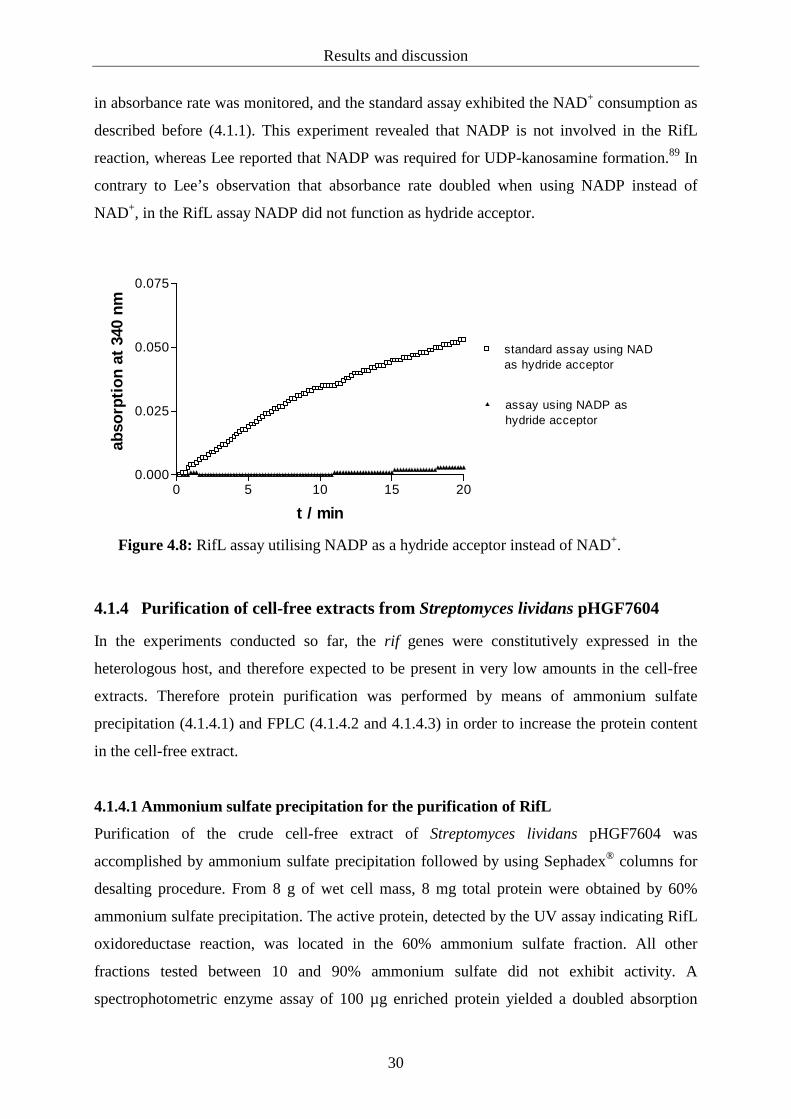
4.1.3.2 Nicotine amide adenine dinucleotide phosphate (NADP)
NADP was applied to the RifL assay instead of NAD+ and compared to a standard assay
using NAD+ (figure 4.8). In the incubation including NADP as a hydride acceptor no increase
Results and discussion
30
in absorbance rate was monitored, and the standard assay exhibited the NAD+ consumption as
described before (4.1.1). This experiment revealed that NADP is not involved in the RifL
reaction, whereas Lee reported that NADP was required for UDP-kanosamine formation.89 In
contrary to Lee’s observation that absorbance rate doubled when using NADP instead of
NAD+, in the RifL assay NADP did not function as hydride acceptor.
0 5 10 15 200.000
0.025
0.050
0.075
standard assay using NADas hydride acceptor
assay using NADP ashydride acceptor
t / min
abso
rpti
on
at 3
40 n
m
Figure 4.8: RifL assay utilising NADP as a hydride acceptor instead of NAD+.
4.1.4 Purification of cell-free extracts from Streptomyces lividans pHGF7604
In the experiments conducted so far, the rif genes were constitutively expressed in the
heterologous host, and therefore expected to be present in very low amounts in the cell-free
extracts. Therefore protein purification was performed by means of ammonium sulfate
precipitation (4.1.4.1) and FPLC (4.1.4.2 and 4.1.4.3) in order to increase the protein content
in the cell-free extract.
4.1.4.1 Ammonium sulfate precipitation for the purification of RifL
Purification of the crude cell-free extract of Streptomyces lividans pHGF7604 was
accomplished by ammonium sulfate precipitation followed by using Sephadex® columns for
desalting procedure. From 8 g of wet cell mass, 8 mg total protein were obtained by 60%
ammonium sulfate precipitation. The active protein, detected by the UV assay indicating RifL
oxidoreductase reaction, was located in the 60% ammonium sulfate fraction. All other
fractions tested between 10 and 90% ammonium sulfate did not exhibit activity. A
spectrophotometric enzyme assay of 100 µg enriched protein yielded a doubled absorption

Results and discussion
31
rate for NADH production, compared with 100 µg of total protein from the crude extract
(figure 4.9).
4.1.4.2 Fast Protein Liquid Chromatography (FPLC) of precipitated extracts using
DEAE-Sepharose
Advanced purification of previously pre-purified extracts (4.1.4.1) was performed by means
of FPLC using DEAE-Sepharose. The separated fractions consisting of 10 ml were
concentrated up to 1.5 ml each by using Amicon® Ultra-15 centrifugal filter devices. The
concentrated protein fractions were each applied to the RifL assay. One active fraction was
detected that showed a higher absorption rate after 20 min compared to the 60% ammonium
sulfate fraction. The active fraction comprised approximately 1.5 mg protein. The FPLC-
chromatogram is shown in the appendix (6.1).
0 5 10 15 200.0
0.1
0.2
S. lividans TK24 unmodifiedstrain, crude cell-free extract
S. lividans pHGF7604, crudecell-free extract
S. lividans pHGF7604, 60%ammonium sulfate fraction
S. lividans pHGF7604,precipitated andFPLC-purified extract
t / min
abso
rpti
on
at 3
40 n
m
Figure 4.9: RifL assay utilising different purification grades of Streptomyces lividans pHGF7604 cell-free extracts.
The use of cell-free extracts with higher purification grades resulted in higher absorption rates
in the RifL assay compared to that with lower purity or the crude extract respectively. These
findings are summarised in figure 4.9, where the negative control is also included. Therefore
it was assumed that the target enzyme RifL had been purified or at least enriched.
4.1.4.3 Intermediate protein purification and gel filtration of Streptomyces lividans
pHGF7604 cell-free extract by means of FPLC
After the protein capture step (4.1.4.2), intermediate purification of the active protein fraction
was attempted by hydrophobic interaction chromatography (HIC). The intention of this
Results and discussion
32
purification step was to prepare the protein for gel filtration. This procedure yielded an
inactive protein (data not shown). The loss of enzyme activity after FPLC-HIC purification
might be due to long room temperature exposure, since it was not possible to cool the
equipment. This was nevertheless followed by gel filtration on a Superdex© column in order
to at least determine the protein sizes. No proper separation could be achieved (data not
shown). For the determination of the protein sizes SDS-PAGE (4.1.5.1) and MALDI-TOF
analysis were therefore carried out (4.1.5.2).
4.1.5 Size determination of proteins from Streptomyces lividans pHGF7604
4.1.5.1 SDS-PAGE
A protein gel (SDS-PAGE) was employed to analyse a precipitated cell-free extract of
Streptomyces lividans pHGF7604 (4.10, lane 4) as well as three different FPLC-purified
fractions (4.10, lanes 1-3) thereof. The extracts applied to lane 2 and lane 4 showed activity in
the RifL assay, whereas the extracts applied to lane 1 and 3 were inactive but flanked the
active fraction in FPLC. The following protein sizes were expected: RifL exhibits a size of 40
kDa, RifK comprises 43 kDa in size and RifM resembles a 26 kDa protein.91 It was shown on
the gel that a ~25 kDa protein was enriched in the active cell-free extract fraction from
Streptomyces lividans pHGF7604 after FPLC purification (figure 4.10, lane 2). As the size
determination is not precise, this band resides in the range of the 26 kDa RifM phosphatase.
This was not expected, because the RifL protein (~40 kDa) was the targeted molecule as it
was monitored with the enzyme assay system. An approximately 40 kDa protein was also
enriched, but in much lower amounts than the ~25 kDa protein. Maybe this is evidence for the
existence of a multi enzyme complex that was reported earlier for RifL and RifK (4.1.9).
1 2 3 4 5
97.0 kDa 66.0 kDa 45.0 kDa 30.0 kDa 20.1 kDa
Figure 4.10: SDS-PAGE, all protein solutions were obtained from a cell-free extract of Streptomyces lividans (TK24) pHGF7604. Lane 1: FPLC purified protein fraction 1 showing no RifL activity, lane 2: FPLC purified protein fraction 2 showing high RifL activity, lane 3: FPLC purified protein fraction 3 showing no RifL activity, lane 4: 60% ammonium sulfate fraction, lane 5: molecular weight marker.

Results and discussion
33
4.1.5.2 MALDI-TOF-MS
The purified cell-free extract (4.1.4.2) from a liquid culture (5.4.2.2) of Streptomyces lividans
pHGF7604 was prepared and applied to MALDI-TOF-MS analysis (5.7.4.3). The mass range
comprised 0.2 to 100 kDa. The ions were detected in the range between 0.5 and 2.2 kDa,
whereas Rif-proteins exhibit sizes of 40 kDa (RifL), 43 kDa (RifK) and 26 kDa (RifM).91
Therefore the presence of the proteins RifL, RifK and RifM in the cell-free extract of
Streptomyces lividans pHGF7604 could not be confirmed. For the mass spectrum see
appendix.
4.1.6 Detection of kanosamine
RifL, RifK and RifM were supposed to catalyse the enzymatic steps that would finally release
kanosamine. Previous experiments indicated that the RifL-catalysed reaction takes place, and
subsequent RifK and RifM catalysis was assumed (4.1.1). It was therefore now attempted to
provide evidence for kanosamine to be an intermediate in early stage AHBA biosynthesis. As
the formation of kanosamine was to be elucidated in incubation samples, TLC and HPLC
methods for the detection of the amino sugar were developed. Furthermore, mass
spectrometry and NMR analysis were carried out to check for the presence of kanosamine.
4.1.6.1 TLC for kanosamine detection
The reference kanosamine was detected by TLC at amounts of up to 20 µg (figure 4.11).
However this sample showed 40% impurity determined in the laboratory of H. Floss. The
detection limit of the pure compound was assumed to be much lower. The structure isomer 2-
amino-2-desoxy-D-glucose (glucosamine) was tentatively used as reference substance
because it was available in unlimited amounts. The detection limit of glucosamine was
determined to be 0.2 µg, although this method is maybe still not sensitive enough for very low
amounts of the analyte that might be encountered in the enzyme assay. Furthermore, since the
components of the RifL assay solution interfered with the detection on a TLC, this method
was not applicable to the samples generated in this study (data not shown).
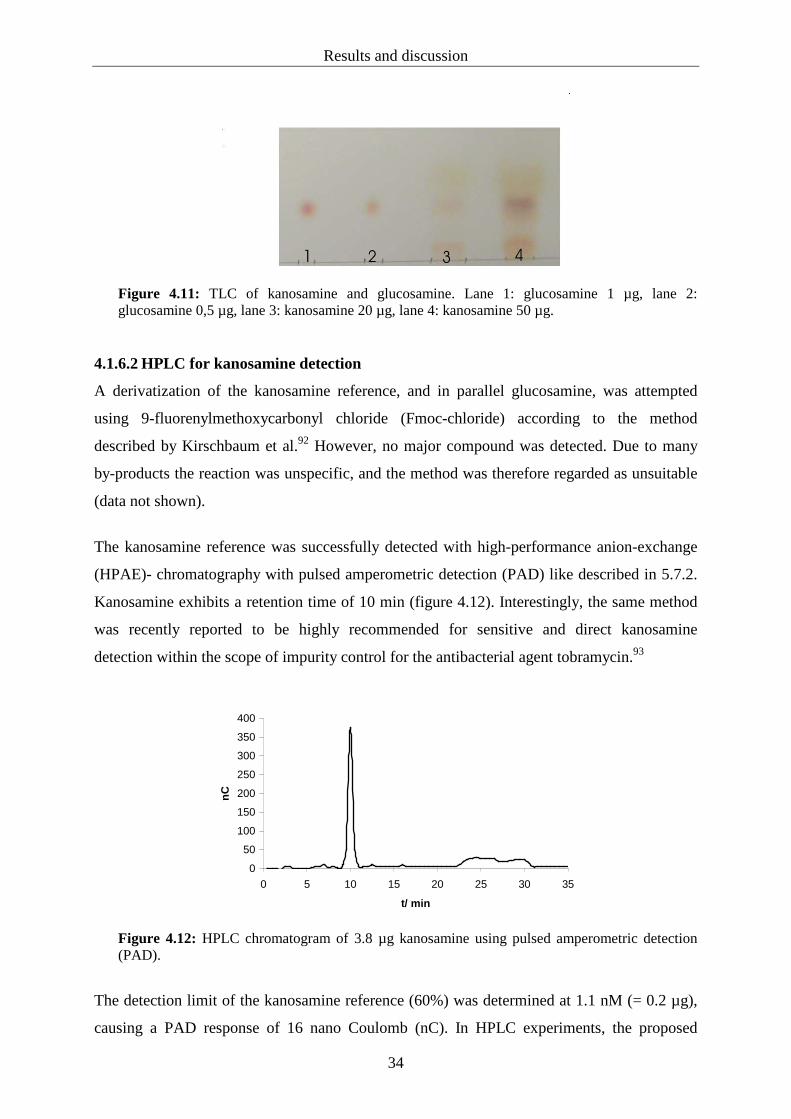
Results and discussion
34
Figure 4.11: TLC of kanosamine and glucosamine. Lane 1: glucosamine 1 µg, lane 2: glucosamine 0,5 µg, lane 3: kanosamine 20 µg, lane 4: kanosamine 50 µg.
4.1.6.2 HPLC for kanosamine detection
A derivatization of the kanosamine reference, and in parallel glucosamine, was attempted
using 9-fluorenylmethoxycarbonyl chloride (Fmoc-chloride) according to the method
described by Kirschbaum et al.92 However, no major compound was detected. Due to many
by-products the reaction was unspecific, and the method was therefore regarded as unsuitable
(data not shown).
The kanosamine reference was successfully detected with high-performance anion-exchange
(HPAE)- chromatography with pulsed amperometric detection (PAD) like described in 5.7.2.
Kanosamine exhibits a retention time of 10 min (figure 4.12). Interestingly, the same method
was recently reported to be highly recommended for sensitive and direct kanosamine
detection within the scope of impurity control for the antibacterial agent tobramycin.93
0
50
100
150
200
250
300
350
400
0 5 10 15 20 25 30 35
t/ min
nC
Figure 4.12: HPLC chromatogram of 3.8 µg kanosamine using pulsed amperometric detection (PAD).
The detection limit of the kanosamine reference (60%) was determined at 1.1 nM (= 0.2 µg),
causing a PAD response of 16 nano Coulomb (nC). In HPLC experiments, the proposed

Results and discussion
35
compound kanosamine that is putatively formed by the gene products of rifL, rifK and rifM
could not be detected in any RifL incubation sample. However the assay components
interfered with a proper HPLC detection showing many peaks in the chromatogram (data not
shown). All samples were therefore subjected to GC-MS analysis (4.1.6.3), because this was
supposed to provide more reliable results.
4.1.6.3 GC-MS measurements for kanosamine detection
Samples for GC-MS analysis were prepared according to the procedure described in 5.6.6,
including measurement of absorbance change at 340 nm for 20 minutes. Prior to further
analysis, the samples were stored at 37 °C for 24 hours in order to allow sufficient time for
the formation of the putative compound. The reaction was then stopped by addition of 500 µl
methanol. Variables in the RifL assay comprised the use of different cofactors, nitrogen
sources and protein purification grades. For cofactor supply, either 4 mM NAD+ or 0.8 mM
APAD was utilised. The following nitrogen sources (2 mM each) were employed individually
to investigate kanosamine formation: glutamine, glutamic acid, asparagine, aspartic acid. The
enzyme solution was represented by a crude cell-free extract, a fraction precipitated in 60%
ammonium sulfate or a purified FPLC fraction. Only a single parameter was varied in each
assay sample.
It was required to stabilise the analyte using trimethylsilyl (TMS) derivatization in order to
prevent degradation during GC-MS chromatography. The reference kanosamine was detected
as trimethylsilyl ether exhibiting a molecular mass of 553.36 m/z (see appendix). However, in
silylated assay samples no compound with a corresponding molecular mass was detected.
4.1.7 1H-NMR experiments of RifL-incubation samples
To gain further insights into the procedures of the RifL assay 1H-NMR measurements were
carried out. For 1H-NMR experiments RifL incubation reactions were pipetted as listed in
5.6.6, whereas the reagents were dissolved in deuterium oxide and immediately placed in the
NMR tube for measurement. A duplicate sample was always measured by UV spectroscopy
for comparison and verification of “active” protein.
A signal emerging at 5.5 ppm (figure 4.13) was observed. This was attributed to a background
epimerase reaction (figure 4.14) by G. Dräger on the basis of his earlier works. Therefore, an
incubation was set up according to the RifL assay except for containing UDP-glucose-

Results and discussion
36
epimerase instead of a cell-free extract. In fact, the same signal at 5.5 ppm was observed as
described before, and no signal apart from that occurred. Blank tests employing either a cell-
free extract from the unmodified strain Streptomyces lividans TK24 or omitting any protein
showed no signal at 5.5 ppm. The cell-free extract from the unmodified strain Streptomyces
lividans TK23 was analysed as well as a cell-free extract from Streptomyces lividans TK23
pHGFrifK, L, M. Both exhibited the signal at 5.5 ppm. Also tested was the incubation with
UDP-galactose instead of UDP-glucose that yielded the same signal as well.
It is noted by Oguiza et al. that Streptomyces lividans harbours a galE gene encoding a protein
that shares a high degree of identity to known UDP-galactose-4-epimerases from gram-
positive microorganisms.94 These proteins catalyse the interconversion of UDP-galactose and
UDP-glucose.95 As the GalE protein has a size of ~34 kDa,96 it is unlikely that the enriched
unknown ~25 kDa protein shown in SDS-PAGE (4.10) represents GalE. But there are other
bands visible that are located within the range of 34 kDa.
These results suggest that NAD+ consumption in the RifL assay was only based on this
putative epimerase reaction. Epimerases and oxidoreductases are both NAD+- consuming
enzymes, and in the RifL assay only NADH accumulation is monitored. Besides this fact
there is no further indication for the proposed RifL reaction. There is no other NAD+-
consuming enzyme encoded on the plasmid pHGF7604.
A B
Figure 4.13: 1H-NMR spectra of cell-free extracts from Streptomyces lividans TK24 pHGF7604 (A) and Streptomyces lividans TK24 (B), arrows indicate the 1H chemical shift at 5.50-5.54 ppm (A) and the absent signal (B).
Cell-free extract from Streptomyces lividans TK 24 pHGF7604
Cell-free extract from Streptomyces lividans TK 24
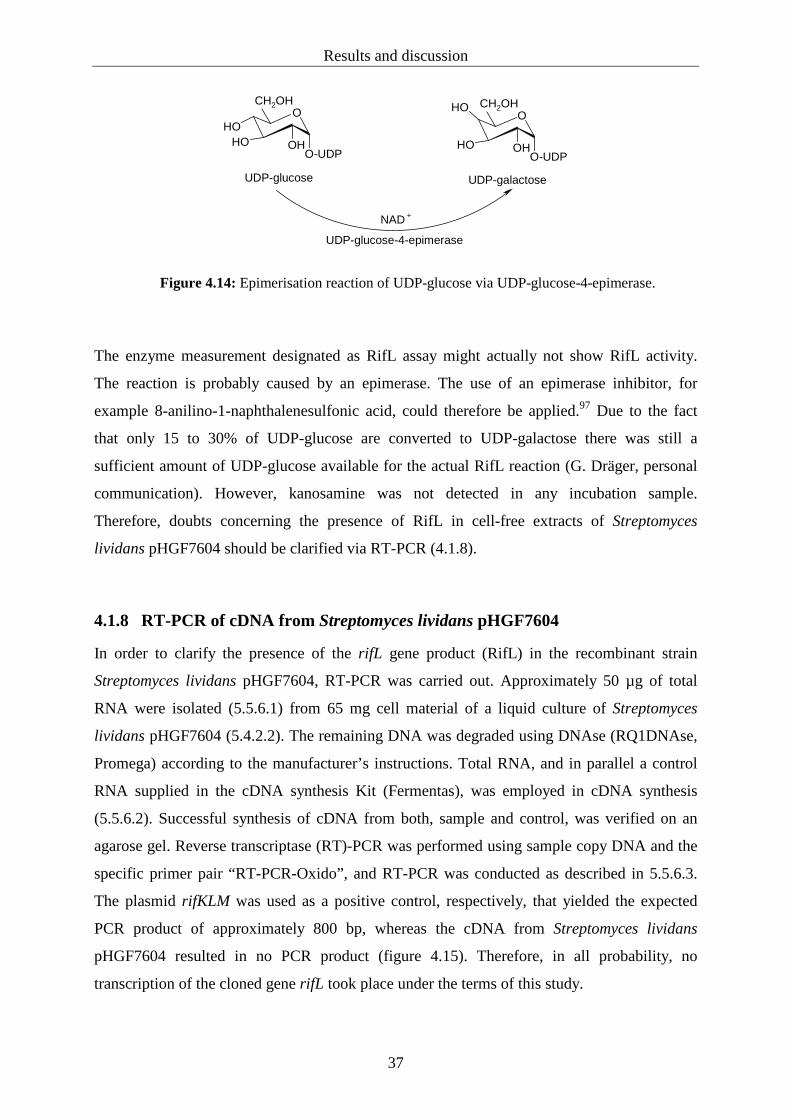
Results and discussion
37
OOH
OHO-UDP
OH
O
OHO-UDP
OH
OH
UDP-glucose
CH2OH
UDP-galactose
CH2OH
UDP-glucose-4-epimerase
NAD
+
Figure 4.14: Epimerisation reaction of UDP-glucose via UDP-glucose-4-epimerase.
The enzyme measurement designated as RifL assay might actually not show RifL activity.
The reaction is probably caused by an epimerase. The use of an epimerase inhibitor, for
example 8-anilino-1-naphthalenesulfonic acid, could therefore be applied.97 Due to the fact
that only 15 to 30% of UDP-glucose are converted to UDP-galactose there was still a
sufficient amount of UDP-glucose available for the actual RifL reaction (G. Dräger, personal
communication). However, kanosamine was not detected in any incubation sample.
Therefore, doubts concerning the presence of RifL in cell-free extracts of Streptomyces
lividans pHGF7604 should be clarified via RT-PCR (4.1.8).
4.1.8 RT-PCR of cDNA from Streptomyces lividans pHGF7604
In order to clarify the presence of the rifL gene product (RifL) in the recombinant strain
Streptomyces lividans pHGF7604, RT-PCR was carried out. Approximately 50 µg of total
RNA were isolated (5.5.6.1) from 65 mg cell material of a liquid culture of Streptomyces
lividans pHGF7604 (5.4.2.2). The remaining DNA was degraded using DNAse (RQ1DNAse,
Promega) according to the manufacturer’s instructions. Total RNA, and in parallel a control
RNA supplied in the cDNA synthesis Kit (Fermentas), was employed in cDNA synthesis
(5.5.6.2). Successful synthesis of cDNA from both, sample and control, was verified on an
agarose gel. Reverse transcriptase (RT)-PCR was performed using sample copy DNA and the
specific primer pair “RT-PCR-Oxido”, and RT-PCR was conducted as described in 5.5.6.3.
The plasmid rifKLM was used as a positive control, respectively, that yielded the expected
PCR product of approximately 800 bp, whereas the cDNA from Streptomyces lividans
pHGF7604 resulted in no PCR product (figure 4.15). Therefore, in all probability, no
transcription of the cloned gene rifL took place under the terms of this study.

Results and discussion
38
1000 bp 500 bp
Figure 4.15: RT-PCR on an agarose gel. Lane 1: DNA Ladder Mix; lane 2: sample cDNA; lane 3: sample cDNA; lane 4: sample cDNA; lane 5: sample cDNA; lane 6: sample cDNA; lane 7: negative control reaction using no template DNA; lane 8: positive control reaction using rifKLM as template DNA.
4.1.9 Studies of a putative functional interaction between RifL, RifK and RifM
In parallel, other plasmids were constructed during the work of Kaulard85 that were intended
for the study of a putative enzyme complex. It should be demonstrated in the present work
that the three enzymes RifL, RifK and RifM exhibit functional interaction and therefore pass
their products among each other. It was shown by Guo and Frost that RifL and RifK form a
complex.63 Moreover, RifL and RifM deletion mutants show no UV reaction in RifL assay,72
and the RifK homologue NapK is co-eluted if only the RifL homologue NapL is His-tagged.89
This part of the study was carried out to access only the relevant genes for kanosamine
formation. Therefore rifL, rifK and rifM were cloned in a Streptomyces shuttle vector, and
transformed into Streptomyces lividans host cells.85 However, the introduction of the plasmids
into Streptomyces lividans TK24 that was used for pHGF7604 was not possible, and therefore
the TK23 derivative of Streptomyces lividans was used. The strains Streptomyces lividans
TK23 and Streptomyces lividans TK24 are mutants of Streptomyces lividans 1326 that should
only differ in their antibiotic resistance.5 For comparison with my earlier experiments the
plasmid pHGF7604 and the empty plasmid pHGF were also transformed into Streptomyces
lividans TK23 and were applied to the RifL assay (4.16). In parallel, two other constructs,
pHGFrifL, K*, M and pHGFrifL, M, were cloned to analyse the putative multi enzyme
complex formed by RifL, RifK and RifM. These constructs were designed in order to explore
the influence of RifK aminotransferase on kanosamine production and on a functional
interaction of rifL, rifK and rifM gene products respectively. Whereas the rifK gene carries a
point mutation in pHGFrifL, K*, M, it is deleted on the plasmid pHGFrifL, M. In the proposed

Results and discussion
39
pathway kanosamine will not be formed in the absence of rifK or if rifK is mutated (rifK*).
Enzymatic activity of RifL should not be influenced by the point mutation found in
pHGFrifL, K*, M in which RifK* is assumed to have no altered conformation, and is
therefore available for complex formation. A conversion of 3-keto-UDP-glucose to
kanosamine ought to be impossible, and heterologous expression of pHGFrifL, M should
impede complex formation and thus RifL activity. Site-directed mutagenesis to construct
pHGFrifL, K*, M was carried out by replacing the codon for lysine with the codon for aspartic
acid at position 188 of RifK by change of two nucleotides. As all PLP-requiring enzymes
share this conserved region as an active site for cofactor-binding, catalysis of RifK reactions
should be blocked in the rifK* mutant. The gene products should be expressed and
biosynthetic analysis was intended in the present work. As a precondition, a cell-free extract
from the unmodified strain Streptomyces lividans TK23 was tested in rifL assay (figure 4.16).
This resulted in showing a high NAD+ consumption, unlike what was observed for
Streptomyces lividans TK24 unmodified strain. Therefore, the general expression of
pHGF7604 and in particular in Streptomyces lividans TK23 was challenged. Nevertheless, the
samples were checked for the presence of kanosamine via GC-MS, and kanosamine was not
detected. Purification by means of 60% ammonium sulfate fractionation did not result in a
higher absorption rate in the RifL assay compared to the crude cell-free extract. Both showed
an absorption rate of 0.06 after 20 min.
The rifL, rifK and rifM genes are absolutely essential for the biosynthesis of AHBA.65
However they are not related to any shikimate pathway enzymes, whereas the other rif genes
resemble their counterparts in shikimate pathway. Different AHBA gene clusters were
compared, and it was observed that the arrangement of the rifG-N homologues involved in
AHBA biosynthesis relative to rifK and its homologues is not uniform in all studied gene
clusters. A variation of the relative arrangement of rifK (and homologues) to the other AHBA
biosynthetic genes exists, although a conserved close association between rifK, rifL and rifM
homologues occurs in all analyses. The linked arrangement of rifK, rifL and rifM in one
operon is highly conserved in all analysed clusters. The rifL gene encodes a 359-amino acid
protein (40 kDa) with its initiation codon located 73 bases downstream of the rifK gene. The
rifM gene encodes a 232-amino acid protein (26 kDa), and is located 14 bases downstream of
rifL. The rifK gene encodes a 388-amino acid protein (43 kDa).91 Therefore a functional
interaction of the corresponding proteins was assumed, and the existence of a multienzyme
complex between RifL, RifK and RifM was hypothesised.98 In an enzyme complex the
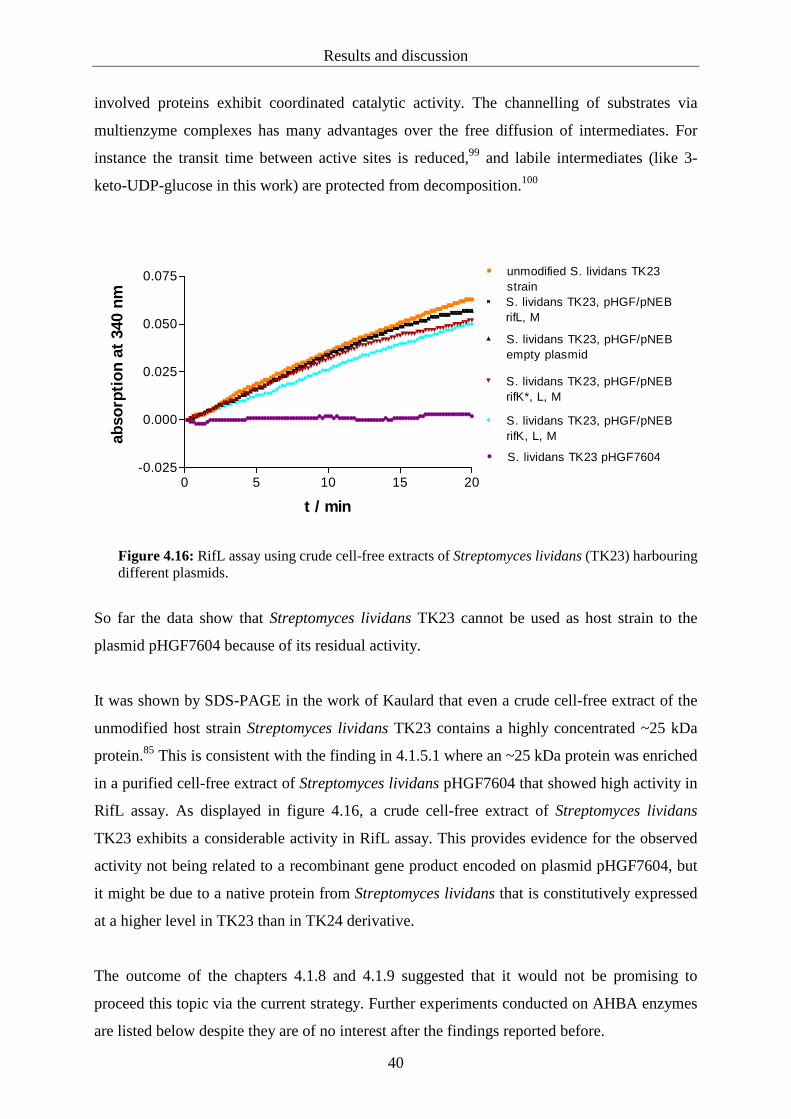
Results and discussion
40
involved proteins exhibit coordinated catalytic activity. The channelling of substrates via
multienzyme complexes has many advantages over the free diffusion of intermediates. For
instance the transit time between active sites is reduced,99 and labile intermediates (like 3-
keto-UDP-glucose in this work) are protected from decomposition.100
0 5 10 15 20-0.025
0.000
0.025
0.050
0.075
S. lividans TK23, pHGF/pNEBrifK*, L, M
S. lividans TK23 pHGF7604
S. lividans TK23, pHGF/pNEBrifL, M
unmodified S. lividans TK23strain
S. lividans TK23, pHGF/pNEBempty plasmid
S. lividans TK23, pHGF/pNEBrifK, L, M
t / min
abso
rpti
on
at 3
40 n
m
Figure 4.16: RifL assay using crude cell-free extracts of Streptomyces lividans (TK23) harbouring different plasmids.
So far the data show that Streptomyces lividans TK23 cannot be used as host strain to the
plasmid pHGF7604 because of its residual activity.
It was shown by SDS-PAGE in the work of Kaulard that even a crude cell-free extract of the
unmodified host strain Streptomyces lividans TK23 contains a highly concentrated ~25 kDa
protein.85 This is consistent with the finding in 4.1.5.1 where an ~25 kDa protein was enriched
in a purified cell-free extract of Streptomyces lividans pHGF7604 that showed high activity in
RifL assay. As displayed in figure 4.16, a crude cell-free extract of Streptomyces lividans
TK23 exhibits a considerable activity in RifL assay. This provides evidence for the observed
activity not being related to a recombinant gene product encoded on plasmid pHGF7604, but
it might be due to a native protein from Streptomyces lividans that is constitutively expressed
at a higher level in TK23 than in TK24 derivative.
The outcome of the chapters 4.1.8 and 4.1.9 suggested that it would not be promising to
proceed this topic via the current strategy. Further experiments conducted on AHBA enzymes
are listed below despite they are of no interest after the findings reported before.
Results and discussion
41
4.1.10 The steps catalysed by RifK and RifM
As Streptomyces lividans pHGF7604 was assumed to be equipped with the genetic tools to
synthesize AHBA, there was no tight control of the enzyme assay in order to stop the reaction
at the stage of kanosamine or, on the other hand, to monitor the actual state during RifL assay.
Therefore the remaining RifK- and RifM- catalysed reactions were originally intended to be
investigated individually.
4.1.10.1 Aminotransferase reaction putatively catalysed by RifK
In a study by Lucher et al., the keto acid product derived from the amino donor glutamine was
characterized as 2-oxoglutaramate, indicating that the α-amino group of glutamine
participates in the transamination reaction.101 For this reason, 2-oxoglutaramate was
synthesised as described in 5.8 for employment as the predicted amino acceptor deriving from
glutamine. The unstable intermediate 3-keto-UDP-glucose was not available for an individual
RifK reaction. Therefore the reversed reaction should have been carried out employing UDP-
kanosamine and the putative amino acceptor 2-oxoglutaramate. However, precipitation
occurred in the UV cuvette that was attributed to 2-oxoglutaramate that would probably
interfere with any substantial reaction.
4.1.10.2 Phosphatase reaction putatively catalysed by RifM
RifM has considerable similarity to the CBBY family of phosphatases.66 UDP-kanosamine
was incubated with a cell-free extract of Streptomyces lividans pHGF7604 in the presence of
magnesium chloride, but the conversion of UDP-kanosamine to kanosamine was not
confirmed in HPLC measurements of the present work correlating with the absence of rif
genes (4.1.8) in the cell-free extracts (data not shown).
Conclusion
In a study by Yu et al.66 the genes rifG-N were heterologous expressed in Streptomyces
coelicolor YU105 that is unable to produce AHBA or AHBA-derived ansamycins. This
resulted in the production of AHBA. Therefore it was assumed that AHBA biosynthesis must
be attributed to the rifG-N genes. In the present study, however, the early stage intermediate
kanosamine was not detected in RifL incubation samples using cell-free extracts of
Streptomyces lividans pHGF7604 harbouring the rifG-N genes. The rifG-N genes, in
particular rifL, were putatively not expressed under the terms of the present study. It might be
the case that Streptomyces lividans does not provide the genetic equipment for a proper

Results and discussion
42
expression of the rif genes. Unfortunately, no further insights into the early steps of rifamycin
biosynthesis could be gathered during this part of the work. To date the mechanism of
nitrogen introduction in early stage AHBA biosynthesis via kanosamine is neither verified nor
another mechanism is proposed in further studies. Therefore this mechanism still remains
unclear.
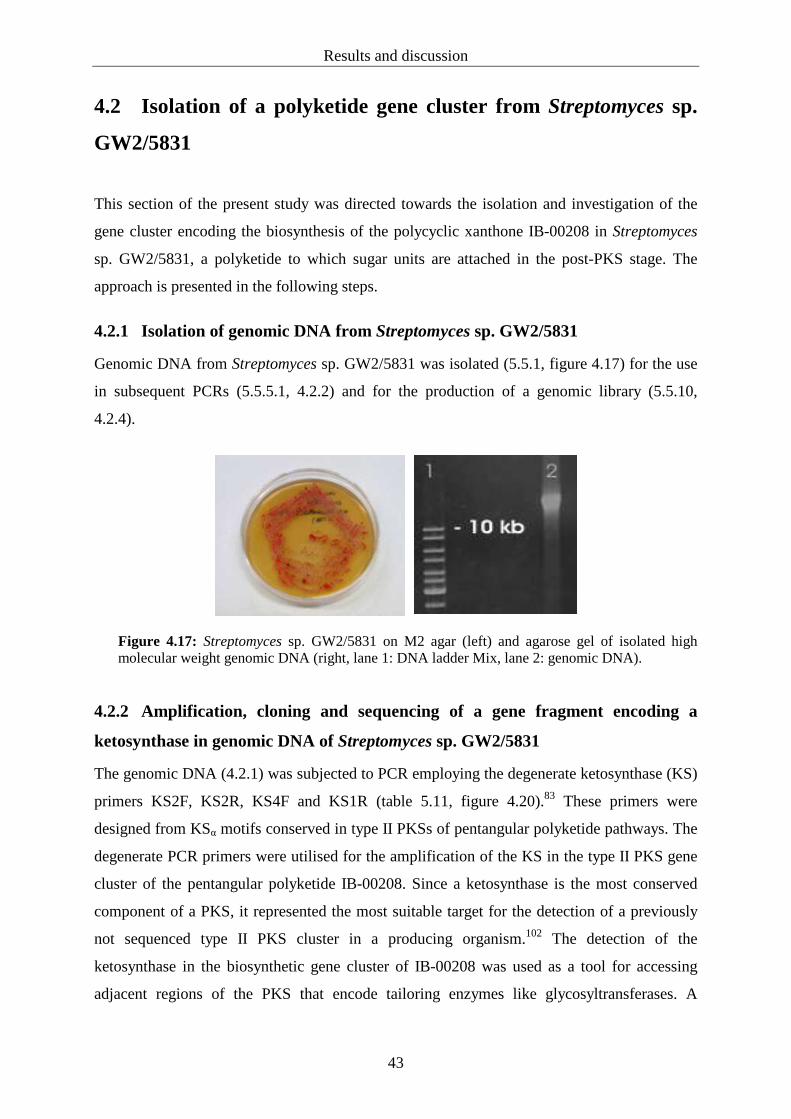
Results and discussion
43
4.2 Isolation of a polyketide gene cluster from Streptomyces sp.
GW2/5831
This section of the present study was directed towards the isolation and investigation of the
gene cluster encoding the biosynthesis of the polycyclic xanthone IB-00208 in Streptomyces
sp. GW2/5831, a polyketide to which sugar units are attached in the post-PKS stage. The
approach is presented in the following steps.
4.2.1 Isolation of genomic DNA from Streptomyces sp. GW2/5831
Genomic DNA from Streptomyces sp. GW2/5831 was isolated (5.5.1, figure 4.17) for the use
in subsequent PCRs (5.5.5.1, 4.2.2) and for the production of a genomic library (5.5.10,
4.2.4).
Figure 4.17: Streptomyces sp. GW2/5831 on M2 agar (left) and agarose gel of isolated high molecular weight genomic DNA (right, lane 1: DNA ladder Mix, lane 2: genomic DNA).
4.2.2 Amplification, cloning and sequencing of a gene fragment encoding a
ketosynthase in genomic DNA of Streptomyces sp. GW2/5831
The genomic DNA (4.2.1) was subjected to PCR employing the degenerate ketosynthase (KS)
primers KS2F, KS2R, KS4F and KS1R (table 5.11, figure 4.20).83 These primers were
designed from KSα motifs conserved in type II PKSs of pentangular polyketide pathways. The
degenerate PCR primers were utilised for the amplification of the KS in the type II PKS gene
cluster of the pentangular polyketide IB-00208. Since a ketosynthase is the most conserved
component of a PKS, it represented the most suitable target for the detection of a previously
not sequenced type II PKS cluster in a producing organism.102 The detection of the
ketosynthase in the biosynthetic gene cluster of IB-00208 was used as a tool for accessing
adjacent regions of the PKS that encode tailoring enzymes like glycosyltransferases. A
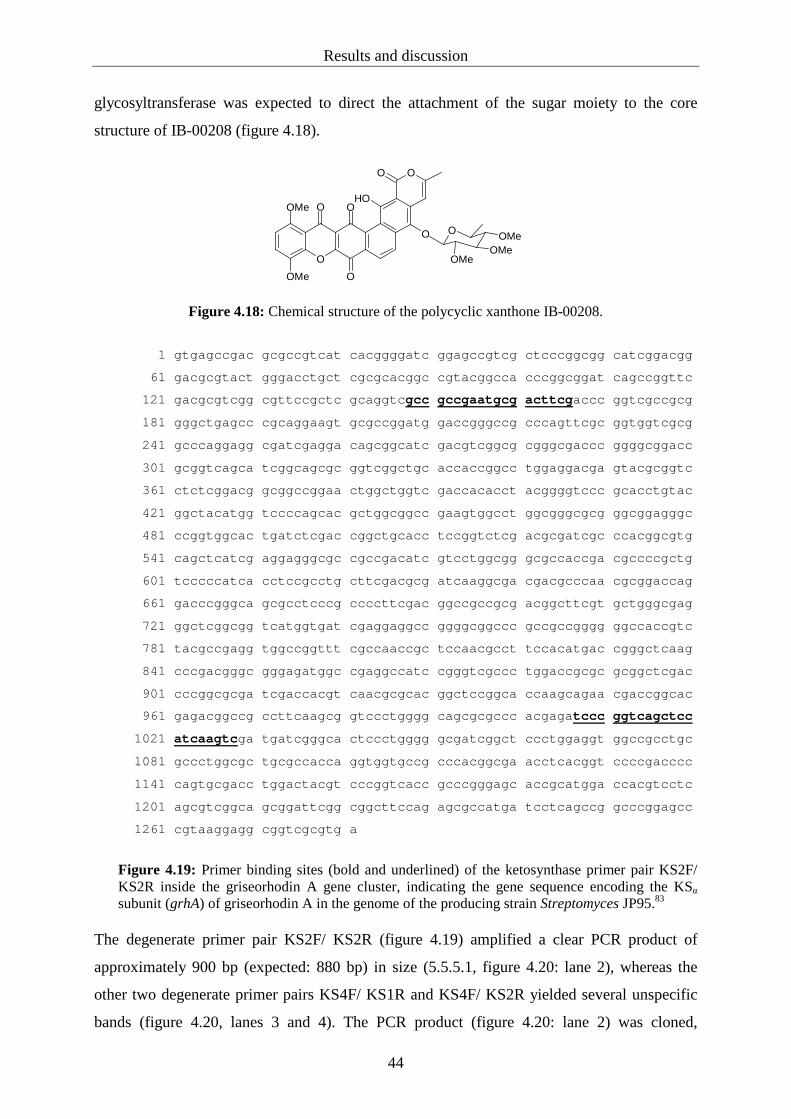
Results and discussion
44
glycosyltransferase was expected to direct the attachment of the sugar moiety to the core
structure of IB-00208 (figure 4.18).
O
O
OMe
OMe
O O
O
O
O
OH
O
OMe
OMeOMe
Figure 4.18: Chemical structure of the polycyclic xanthone IB-00208.
1 gtgagccgac gcgccgtcat cacggggatc ggagccgtcg ctcccggcgg catcggacgg
61 gacgcgtact gggacctgct cgcgcacggc cgtacggcca cccggcggat cagccggttc
121 gacgcgtcgg cgttccgctc gcaggtcgcc gccgaatgcg acttcgaccc ggtcgccgcg
181 gggctgagcc cgcaggaagt gcgccggatg gaccgggccg cccagttcgc ggtggtcgcg
241 gcccaggagg cgatcgagga cagcggcatc gacgtcggcg cgggcgaccc ggggcggacc
301 gcggtcagca tcggcagcgc ggtcggctgc accaccggcc tggaggacga gtacgcggtc
361 ctctcggacg gcggccggaa ctggctggtc gaccacacct acggggtccc gcacctgtac
421 ggctacatgg tccccagcac gctggcggcc gaagtggcct ggcgggcgcg ggcggagggc
481 ccggtggcac tgatctcgac cggctgcacc tccggtctcg acgcgatcgc ccacggcgtg
541 cagctcatcg aggagggcgc cgccgacatc gtcctggcgg gcgccaccga cgccccgctg
601 tcccccatca cctccgcctg cttcgacgcg atcaaggcga cgacgcccaa cgcggaccag
661 gacccgggca gcgcctcccg ccccttcgac ggccgccgcg acggcttcgt gctgggcgag
721 ggctcggcgg tcatggtgat cgaggaggcc ggggcggccc gccgccgggg ggccaccgtc
781 tacgccgagg tggccggttt cgccaaccgc tccaacgcct tccacatgac cgggctcaag
841 cccgacgggc gggagatggc cgaggccatc cgggtcgccc tggaccgcgc gcggctcgac
901 cccggcgcga tcgaccacgt caacgcgcac ggctccggca ccaagcagaa cgaccggcac
961 gagacggccg ccttcaagcg gtccctgggg cagcgcgccc acgagatccc ggtcagctcc
1021 atcaagtcga tgatcgggca ctccctgggg gcgatcggct ccctggaggt ggccgcctgc
1081 gccctggcgc tgcgccacca ggtggtgccg cccacggcga acctcacggt ccccgacccc
1141 cagtgcgacc tggactacgt cccggtcacc gcccgggagc accgcatgga ccacgtcctc
1201 agcgtcggca gcggattcgg cggcttccag agcgccatga tcctcagccg gcccggagcc
1261 cgtaaggagg cggtcgcgtg a
Figure 4.19: Primer binding sites (bold and underlined) of the ketosynthase primer pair KS2F/ KS2R inside the griseorhodin A gene cluster, indicating the gene sequence encoding the KSα subunit (grhA) of griseorhodin A in the genome of the producing strain Streptomyces JP95.83
The degenerate primer pair KS2F/ KS2R (figure 4.19) amplified a clear PCR product of
approximately 900 bp (expected: 880 bp) in size (5.5.5.1, figure 4.20: lane 2), whereas the
other two degenerate primer pairs KS4F/ KS1R and KS4F/ KS2R yielded several unspecific
bands (figure 4.20, lanes 3 and 4). The PCR product (figure 4.20: lane 2) was cloned,
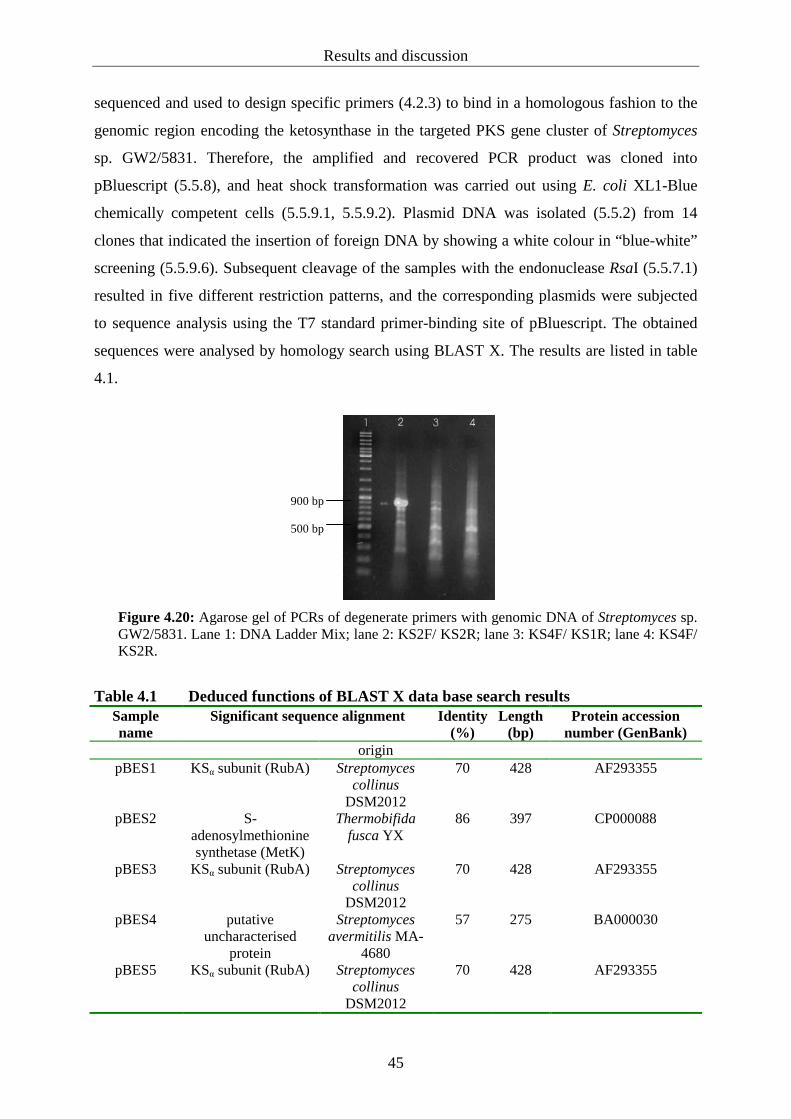
Results and discussion
45
sequenced and used to design specific primers (4.2.3) to bind in a homologous fashion to the
genomic region encoding the ketosynthase in the targeted PKS gene cluster of Streptomyces
sp. GW2/5831. Therefore, the amplified and recovered PCR product was cloned into
pBluescript (5.5.8), and heat shock transformation was carried out using E. coli XL1-Blue
chemically competent cells (5.5.9.1, 5.5.9.2). Plasmid DNA was isolated (5.5.2) from 14
clones that indicated the insertion of foreign DNA by showing a white colour in “blue-white”
screening (5.5.9.6). Subsequent cleavage of the samples with the endonuclease RsaI (5.5.7.1)
resulted in five different restriction patterns, and the corresponding plasmids were subjected
to sequence analysis using the T7 standard primer-binding site of pBluescript. The obtained
sequences were analysed by homology search using BLAST X. The results are listed in table
4.1.
900 bp 500 bp
Figure 4.20: Agarose gel of PCRs of degenerate primers with genomic DNA of Streptomyces sp. GW2/5831. Lane 1: DNA Ladder Mix; lane 2: KS2F/ KS2R; lane 3: KS4F/ KS1R; lane 4: KS4F/ KS2R.
Table 4.1 Deduced functions of BLAST X data base search results Sample name
Significant sequence alignment Identity (%)
Length (bp)
Protein accession number (GenBank)
origin pBES1 KSα subunit (RubA) Streptomyces
collinus DSM2012
70 428 AF293355
pBES2 S-adenosylmethionine synthetase (MetK)
Thermobifida fusca YX
86 397 CP000088
pBES3 KSα subunit (RubA) Streptomyces collinus
DSM2012
70 428 AF293355
pBES4 putative uncharacterised
protein
Streptomyces avermitilis MA-
4680
57 275 BA000030
pBES5 KSα subunit (RubA) Streptomyces collinus
DSM2012
70 428 AF293355

Results and discussion
46
The sequence alignment of the cloned PCR product (figure 4.20, lane 2) showed a high
similarity to the rubromycin rubA sequence, exhibiting an identity of 70% to the KSα subunit.
This result is represented in the samples pBES1, pBES3 and pBES5. The query lengths
comprised 701 bp (pBES1), 710 bp (pBES3) and 602 bp (pBES5), whereas the region of
sequence homology spanned 428 bp in all of the three samples. Since the KS of a pentangular
type II PKS system from a Streptomyces strain was the targeted sequence and the KSα subunit
of the pentangular type II PKS rubromycin gene cluster from Streptomyces collinus exhibited
a significant similarity, these data strongly suggest that the analysed sequence belongs to the
IB-00208 gene cluster. The sequence of pBES2 encodes S-adenosylmethionine synthetase
from Thermobifida fusca. Taxonomically, Thermobifida fusca and Streptomyces strains are in
the order of Actinomycetales. The sequence encoded on pBES4 produced a significant
alignment with a putative uncharacterised protein from Streptomyces avermitilis. As only 3
samples out of five contained the targeted KS-fragment, it was shown that degenerate primers
can cause false positive detections. Therefore a specific primer pair was required for the
library screening (4.2.3).
4.2.3 Design of specific primers
Specific primers were designed based on the sequenced PCR product between positions 45 bp
and 734 bp of plasmid pBES1. Thus, the specific primer pair BES1 should amplify a PCR
product with a size of 691 bp (figure 4.21).
1 ggccccctcg aggtcgacgg tatcgataag cttgattccg atcatcgact tgatggagct
61 gaccggcacc tcgtaggccc gctgcccgag gctgcgcttg aacgcggccg tctcgtgccg
121 gtcgttctgc ttggtgcccg acccgtgcgc gttgatgtag tcgatgtcgt ccggccccag
181 cctcgcctgc cgcatggcga ccgtgatggc ctcggccatc tcgcggccgt cgggcttcag
241 cccggtcatg tggtaggcgt tgctgcgccc ggcgaccccg gccacctcgg cgtacacgtg
301 ggcgtcgcgg cggcgcgccg ccgacgcctc ctccagcaca acacggccga gccctcgccg
361 aggacgaacc cgtcccggtc gcggtcgaac ggccgcgagg cgtgcgcggg gtcgtcgttg
421 ttgggggacg tcgccttgat cgcgtcgaag caggccgagg tgatcggcga gatcggcgcg
481 tcggtggccc cggcgatcac cacgtccgcg gcgccctccc ggatgagctg ggcgccgtgc
541 gcgacggcgt ccagcccgga ggtgcagccg gtggagatca gcgccaccgg cccctcggcg
601 ccgacccgcc aggccacctc gaccgccagc gtgctgggca ccatgtagcc gtacagctgc
661 ggcaccccgt actcgtggtc gaccagccac tgccggccgc cgtcgctgag gacgatgtac
721 tcctcctcca gccccatcgt gcagccgacc gcgctgccga ggctgacgcc gacgcggtcc
781 cggtcgcagc
Figure 4.21: Primer binding sites (bold and underlined) of the specific primer pair BES1 in the ketosynthase region of Streptomyces sp. GW2/5831 DNA sequence.

Results and discussion
47
The specific primer pair was used in a PCR with genomic DNA from Streptomyces sp.
GW2/5831, yielding an amplified product of approximately 700 bp (figure 4.22). Based on
this result, the BES1 primer pair was then used for screening a Streptomyces sp. GW2/5831
library for the ketosynthase of interest (4.2.5).
700 bp 500 bp
Figure 4.22: Agarose gel of PCR of specific primer pair BES1 with genomic DNA. Lane 1: DNA Ladder Mix; lane 2: ~700 bp PCR product.
4.2.4 Production of a genomic library from Streptomyces sp. GW2/5831
A genomic cosmid library was constructed as described in 5.5.10, using genomic DNA from
Streptomyces sp. GW2/5831 (4.2.1) and the pAY1 shuttle vector. Both are displayed in figure
4.23, visualised on agarose gels. PAY1 was constructed based on the stable integrative
plasmid pSET152 containing the oriT region for conjugative transfer, the ФC31 attachment
site and the cos site that was inserted from the plasmid pWEB.83 Shuttle vectors are employed
to enable intergeneric transfer between different bacterial strains. In this case we hoped that
this technique allows gene expression of a cosmid from the library in a heterologous host.
The sheared, non blunt-ended, genomic DNA was recovered from a low-melting point
agarose gel with the appropriate size of ~ 40 kb (figure 4.23). For the ligation into pAY1 it
was required to be blunt-ended, because the vector was restricted with EcoRV yielding blunt
ends. Therefore the sticky ends of the DNA fragments were filled with deoxynucleotides
during the blunt ending reaction (5.5.10.1). The pAY1 vector DNA was prepared as described
in 5.5.10.2.
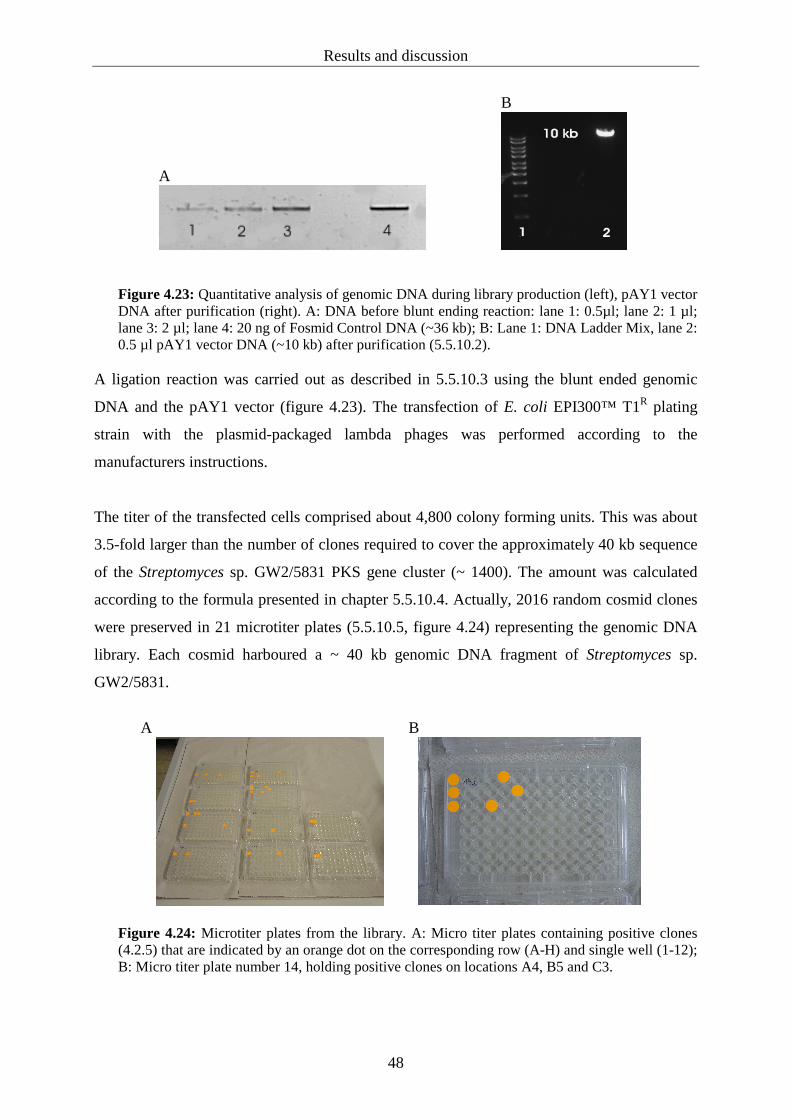
Results and discussion
48
A
B
Figure 4.23: Quantitative analysis of genomic DNA during library production (left), pAY1 vector DNA after purification (right). A: DNA before blunt ending reaction: lane 1: 0.5µl; lane 2: 1 µl; lane 3: 2 µl; lane 4: 20 ng of Fosmid Control DNA (~36 kb); B: Lane 1: DNA Ladder Mix, lane 2: 0.5 µl pAY1 vector DNA (~10 kb) after purification (5.5.10.2).
A ligation reaction was carried out as described in 5.5.10.3 using the blunt ended genomic
DNA and the pAY1 vector (figure 4.23). The transfection of E. coli EPI300™ T1R plating
strain with the plasmid-packaged lambda phages was performed according to the
manufacturers instructions.
The titer of the transfected cells comprised about 4,800 colony forming units. This was about
3.5-fold larger than the number of clones required to cover the approximately 40 kb sequence
of the Streptomyces sp. GW2/5831 PKS gene cluster (~ 1400). The amount was calculated
according to the formula presented in chapter 5.5.10.4. Actually, 2016 random cosmid clones
were preserved in 21 microtiter plates (5.5.10.5, figure 4.24) representing the genomic DNA
library. Each cosmid harboured a ~ 40 kb genomic DNA fragment of Streptomyces sp.
GW2/5831.
A
B
Figure 4.24: Microtiter plates from the library. A: Micro titer plates containing positive clones (4.2.5) that are indicated by an orange dot on the corresponding row (A-H) and single well (1-12); B: Micro titer plate number 14, holding positive clones on locations A4, B5 and C3.

Results and discussion
49
4.2.5 Library screening for polyketide synthase gene fragments
To isolate the gene cluster responsible for IB-00208 biosynthesis, a PCR based screening of
the gene library from Streptomyces sp. GW2/5831 was performed. This approach was
conducted using the KS-specific primer pair BES1 (see also 4.2.3).
To save time and minimize reagent amount, “row-pools” were established by combining
aliquots of each well (12) in a row into one eppendorf tube (5.5.10.5). Thus eight “row pools”
resulted from each microtiter plate. The “row-pools” were then screened for the PCR product
(5.5.10.6). After the detection of a positive pool (figure 4.25 A), all the 12 wells of the
corresponding row were screened individually (figure 4.25 B). The positive clones identified
in this manner are listed in table 4.2.
3000 bp
1000 bp
500 bp
A
3000 bp
1000 bp
500 bp
B
Figure 4.25: Agarose gels of PCRs from screening procedure. A: PCR from the pooled rows A-H of microtiter plate four, lane 1: DNA Ladder Mix; lane 2: pool A; lane 3: pool B; lane 4: pool C; lane 5: pool D; lane 6: pool E; lane 7: pool F; lane 8: pool G; lane 9: pool H; lane 10: negative control; lane 11: positive control; lane 12: DNA Ladder Mix. B: PCR from 12 single wells in row G of microtiter plate four, lane 1: DNA Ladder Mix; lane 2: well 1; lane 3: well 2; lane 4: well 3; lane 5: well 4; lane 6: well 5; lane 7: well 6; lane 8: well 7; lane 9: well 8; lane 10: well 9; lane 11: well 10; lane 12: well 11; lane 13: well 12; lane 14: positive control.
The screening of the genomic library from Streptomyces sp. GW2/5831 with the KS-specific
primer pair BES1, conducted as described in 5.5.5.3, yielded 16 positive cosmid clones that
are listed in table 4.2. The corresponding PCRs were double-checked and are shown on an
agarose gel (figure 4.26). This confirmed the location of the sixteen positive cosmid clones in
the library.

Results and discussion
50
Table 4.2 Location of positive cosmid clones in the library exhibiting a BES1 PCR product (~700 bp)
Cosmid number Coordinates Microtiter plate Row (A-H) Number (1-12) 1 1 C 3 2 3 A 2 3 3 A 3 4 3 E 10 5 4 G 1 6 9 F 3 7 9 F 7 8 10 E 8 9 10 G 2 10 14 A 4 11 14 B 5 12 14 C 3 13 17 G 6 14 18 C 7 15 19 D 1 16 20 D 1
Figure 4.26: Agarose gel of all positive cosmid clones after amplification of the ~700 bp PCR product. Lane 1: DNA Ladder Mix; lane 2: cosmid 1; lane 3: cosmid 2; lane 4: cosmid 3; lane 5: cosmid 4; lane 6: cosmid 5; lane 7: cosmid 6; lane 8: cosmid 7; lane 9: cosmid 8; lane 10: DNA Ladder Mix; lane 11: DNA Ladder Mix; lane 12: cosmid 9; lane 13: cosmid 10; lane 14: cosmid 11; lane 15: cosmid 12; lane 16: cosmid 13; lane 17: cosmid 14; lane 18: cosmid 15; lane 19: cosmid 16; lane 20: negative control; lane 21: positive control; lane 22: DNA Ladder Mix.
4.2.6 Restriction mapping and spot-sequencing of the positive cosmid clones
The obtained positive cosmid clones (4.2.5) were further analysed for discovery of putative
identical clones. Therefore cosmid DNA was isolated from an overnight culture of every

Results and discussion
51
positive clone. Subsequent single restriction analysis was carried out using BamHI
endonuclease. A distinct restriction pattern was obtained for each of the 16 positive clones
that showed that the clones contained different sequences (figure 4.27).
Figure 4.27: Restriction analysis of positive cosmid clones with BamHI. Lane 1: DNA Ladder Mix; lane 2: cosmid 1; lane 3: cosmid 2; lane 4: cosmid 3; lane 5: cosmid 4; lane 6: cosmid 5; lane 7: cosmid 6; lane 8: cosmid 7; lane 9: cosmid 8; lane 10: cosmid 9; lane 11: cosmid 10; lane 12: cosmid 11; lane 13: cosmid 12; lane 14: DNA Ladder Mix; lane 15: DNA Ladder Mix; lane 16: cosmid 13; lane 17: cosmid 14; lane 18: cosmid 15; lane 19: cosmid 16; lane 20: DNA Ladder Mix.
In order to gain insight into the cosmid content, spot-sequencing primers were designed
employing the upstream and downstream parts of the EcoRV restriction site of the pAY1
vector (figure 4.28). As the genomic DNA fragments of Streptomyces sp. GW2/5831 were
cloned at the EcoRV restriction site of pAY1 vector, it was thus possible to end-sequence
each positive construct.
4100
4151
agcacgccat agtgactggc gatgctgtcg gaatggacga ta_tcgaattc
EcoRV gtaatcatgt catagctgtt tcctgtgtga aattgttatc cgctcacaat
Figure 4.28: Section around EcoRV cleavage site (4142 bp, underlined) from pAY1 vector sequence (4100-4200bp), primer binding sites (AY1ES1 forward, AY1ES1 reverse) are bold and underlined.
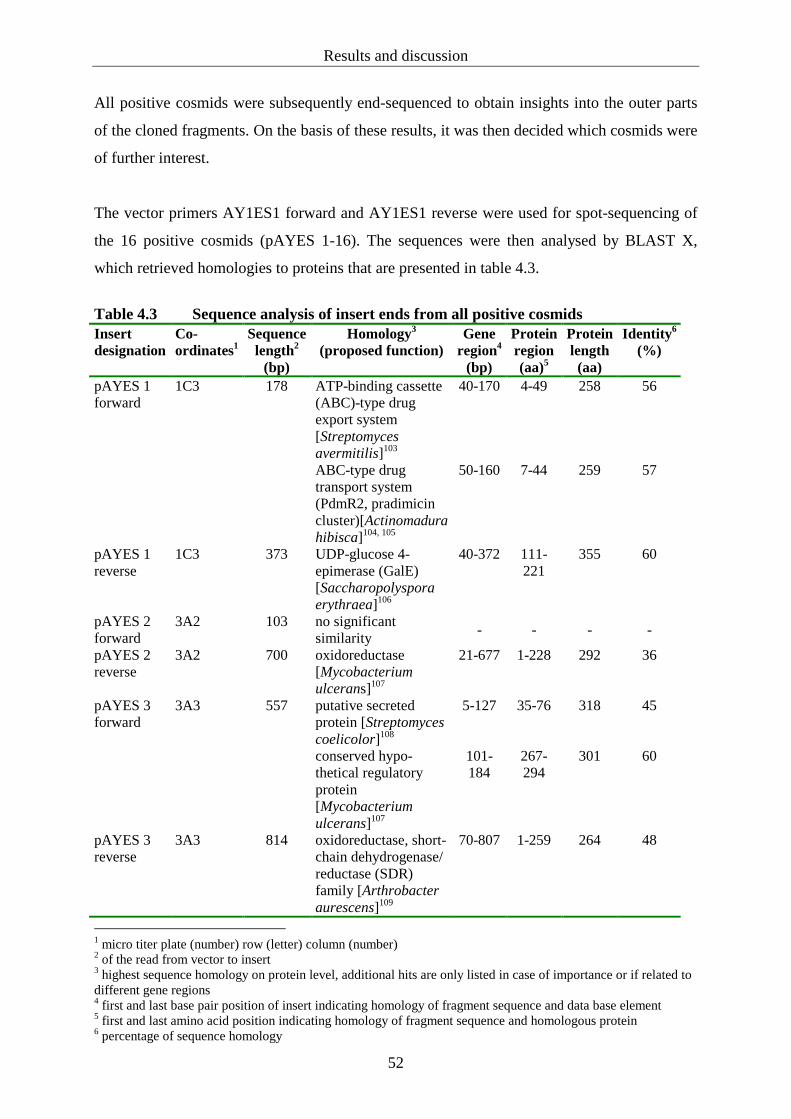
Results and discussion
52
All positive cosmids were subsequently end-sequenced to obtain insights into the outer parts
of the cloned fragments. On the basis of these results, it was then decided which cosmids were
of further interest.
The vector primers AY1ES1 forward and AY1ES1 reverse were used for spot-sequencing of
the 16 positive cosmids (pAYES 1-16). The sequences were then analysed by BLAST X,
which retrieved homologies to proteins that are presented in table 4.3.
Table 4.3 Sequence analysis of insert ends from all positive cosmids Insert designation
Co-ordinates1
Sequence length2
(bp)
Homology3 (proposed function)
Gene region4
(bp)
Protein region (aa)5
Protein length (aa)
Identity 6 (%)
pAYES 1 forward
1C3 178 ATP-binding cassette (ABC)-type drug export system [Streptomyces avermitilis]103 ABC-type drug transport system (PdmR2, pradimicin cluster)[Actinomadura hibisca]104, 105
40-170
50-160
4-49
7-44
258
259
56
57
pAYES 1 reverse
1C3 373 UDP-glucose 4-epimerase (GalE) [Saccharopolyspora erythraea]106
40-372 111-221
355 60
pAYES 2 forward
3A2 103 no significant similarity
- - - -
pAYES 2 reverse
3A2 700 oxidoreductase [Mycobacterium ulcerans]107
21-677 1-228 292 36
pAYES 3 forward
3A3 557 putative secreted protein [Streptomyces coelicolor]108 conserved hypo- thetical regulatory protein [Mycobacterium ulcerans]107
5-127
101-184
35-76
267-294
318
301
45
60
pAYES 3 reverse
3A3 814 oxidoreductase, short-chain dehydrogenase/ reductase (SDR) family [Arthrobacter aurescens]109
70-807
1-259
264
48
1 micro titer plate (number) row (letter) column (number) 2 of the read from vector to insert 3 highest sequence homology on protein level, additional hits are only listed in case of importance or if related to different gene regions 4 first and last base pair position of insert indicating homology of fragment sequence and data base element 5 first and last amino acid position indicating homology of fragment sequence and homologous protein 6 percentage of sequence homology
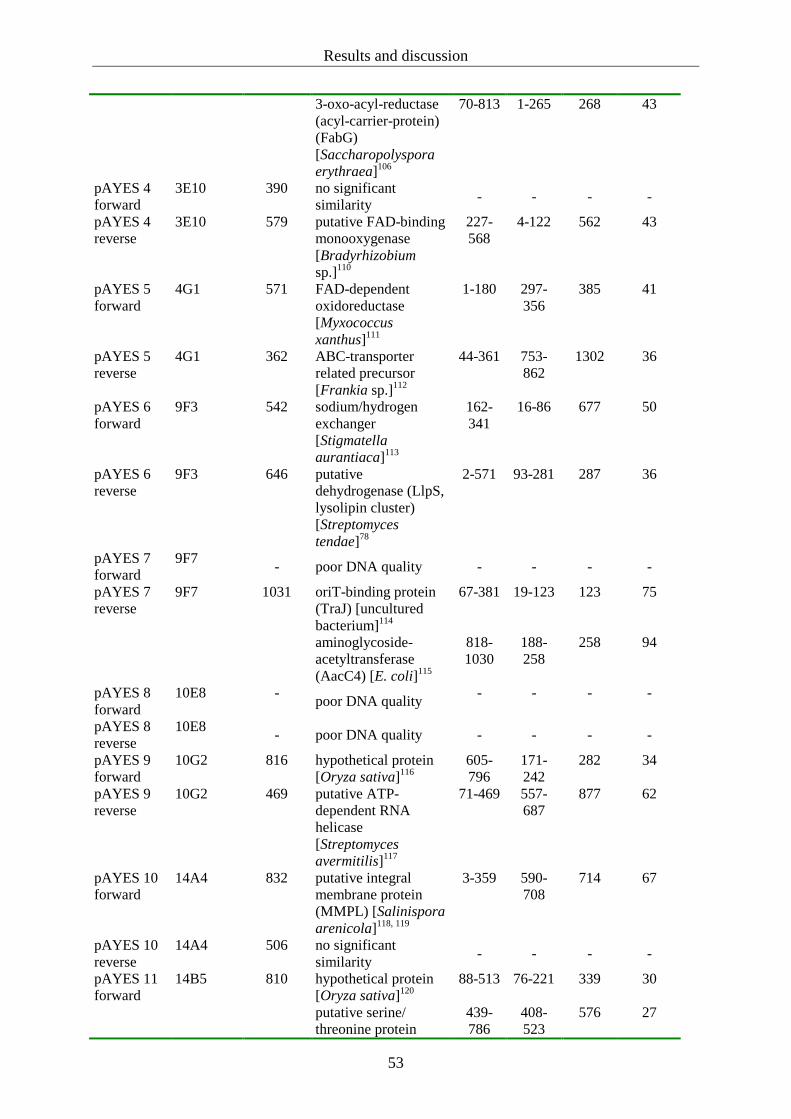
Results and discussion
53
3-oxo-acyl-reductase (acyl-carrier-protein) (FabG) [Saccharopolyspora erythraea]106
70-813
1-265 268 43
pAYES 4 forward
3E10 390 no significant similarity
- - - -
pAYES 4 reverse
3E10 579 putative FAD-binding monooxygenase [Bradyrhizobium sp.]110
227-568
4-122 562 43
pAYES 5 forward
4G1 571 FAD-dependent oxidoreductase [Myxococcus xanthus]111
1-180
297-356
385 41
pAYES 5 reverse
4G1 362 ABC-transporter related precursor [Frankia sp.]112
44-361 753-862
1302 36
pAYES 6 forward
9F3 542 sodium/hydrogen exchanger [Stigmatella aurantiaca]113
162-341
16-86 677
50
pAYES 6 reverse
9F3 646 putative dehydrogenase (LlpS, lysolipin cluster) [Streptomyces tendae]78
2-571 93-281 287 36
pAYES 7 forward
9F7 - poor DNA quality - - - -
pAYES 7 reverse
9F7 1031 oriT-binding protein (TraJ) [uncultured bacterium]114 aminoglycoside-acetyltransferase (AacC4) [E. coli]115
67-381
818-1030
19-123
188-258
123
258
75
94
pAYES 8 forward
10E8 -
poor DNA quality -
-
-
-
pAYES 8 reverse
10E8 - poor DNA quality - - - -
pAYES 9 forward
10G2 816 hypothetical protein [Oryza sativa]116
605-796
171-242
282 34
pAYES 9 reverse
10G2 469 putative ATP-dependent RNA helicase [Streptomyces avermitilis]117
71-469 557-687
877 62
pAYES 10 forward
14A4 832 putative integral membrane protein (MMPL) [Salinispora arenicola]118, 119
3-359 590-708
714 67
pAYES 10 reverse
14A4 506 no significant similarity
- - - -
pAYES 11 forward
14B5 810 hypothetical protein [Oryza sativa]120 putative serine/ threonine protein
88-513
439-786
76-221
408-523
339
576
30
27

Results and discussion
54
kinase [Streptomyces coelicolor]108
pAYES 11 reverse
14B5 516 putative cyclase (PdmL, pradimicin cluster) [Actinomadura hibisca]104, 105 putative polyketide cyclase [Streptomyces griseus]121 putative cyclase (GrhS, griseorhodin cluster) [Streptomyces sp. JP95]83 polyketide synthase [Frankia alni]112 putative cyclase (RubE, similar to PdmL in pradimicin cluster) [Streptomyces collinus]122
222-515
234-515
255-515
237-515
11-133
2-99
1-94
10-96
3-93
70-110
147
141
144
172
123
69
62
62
59
56
pAYES 12 forward
14C3 -
poor DNA quality
- - - -
pAYES 12 reverse
14C3 - poor DNA quality - - - -
pAYES 13 forward
17G6 471 no significant similarity
- - - -
pAYES 13 reverse
17G6 742 FAD-dependent oxidoreductase [Myxococcus xanthus]111
1-699 133-356
385 40
pAYES 14 forward
18C7
778 oxygenase (GrhM) [Streptomyces sp. JP95]83 putative monooxygenase (fredericamycin cluster) [Streptomyces griseus]121 oxygenase (PdmE, pradimicin cluster) [Actinomadura hibisca]104, 105 RubQ (rubromycin cluster, similar to ORF5 in pradimicin cluster) [Streptomyces collinus]122
254-577
239-568
263-583
251-577
5-112
2-110
8-114
3-110
150
149
153
148
47
45
42
47
pAYES 14 reverse
18C7 - poor DNA quality - - - -
pAYES 15 forward
19D1 584 hemerythrin cation- binding domain protein (HHE) [Mycobacterium sp.]118
33-584 351-533
747 30

Results and discussion
55
pAYES 15 reverse
19D1 501 6-aminohexanoate cyclic dimer hydrolase [Mycobacterium smegmatis]123
75-194 525-565
1075 39
pAYES 16 forward
20D1 - poor DNA quality - - - -
pAYES 16 reverse
20D1 999 aminoglycoside-acetyltransferase (AacC4), apramycin resistance gene [E. coli]115
492-998
90-258
258
86
Homologies to gene products from type II PKS systems occur frequently within the
sequenced DNA fragments. Several of them (pAYES 1 forward, pAYES 11 reverse, pAYES
14 forward) belong to the biosynthetically related pradimicin-type pentangular polyketides
like the fredericamycins and members of the griseorhodin/ rubromycin family.73 Furthermore,
oxidoreductases that often occur as tailoring enzymes in polyketide biosynthesis were
discovered on the fragments pAYES 2 reverse, pAYES 3 reverse, pAYES 5 forward and
pAYES 13 reverse. Therefore it is most likely that at least parts of the targeted IB-00208 gene
cluster are encountered on the positive cosmid clones.
4.2.7 Heterologous expression of the positive cosmid sequences
To reveal the function of the positive cosmid sequences (table 4.2), heterologous expression
was carried out using Streptomyces albus as host strain. Intergeneric transfer of the cosmid
DNA was accomplished as described in 5.5.11. The inserted cosmids and the corresponding
designation of the conjugated strains are listed in table 4.4.
Biosynthetic gene clusters that code for aromatic polyketides usually comprise 15 to 40 open
reading frames, holding capacities between 20 to 60 kb. For IB-00208 we expected a size of
approximately 40 kb. Since the sizes of the inserts in the generated cosmid gene library reach
approximately 40 kb, it is theoretically possible to encounter the whole IB-00208 gene cluster
in one of the 16 positive clones. A heterologous expression could therefore be accomplished
by the transfer of a single cosmid. Ideally, successful transfer of the complete gene cluster
would be accompanied by the production of the compound. Due to the intense red colour of
the xanthone, a producing recombinant may be identified visually after the heterologous
expression in Streptomyces albus host strain via conjugal transfer. Therefore, any deviation
from a white mycelium was monitored. On the other hand, it could be possible that the
heterologous expression of only parts of the cluster, dependent on the cosmid content, yields

Results and discussion
56
another secondary metabolite, even previously unknown. For example collinone, an
intermediate from the griseorhodin pathway, is produced by a knockout mutant lacking the
oxygenase GrhO5.73
The transfer of genetic information between E. coli and Streptomyces can be accomplished by
intergeneric conjugation.5 This method is advantageous because it is still easier to manipulate
E. coli rather than Streptomyces DNA. The mating system consisted of the non-methylating/
mobilisation-proficient E. coli ET12567/pUZ8002 donor strain 124 and Streptomyces albus
J1074 host strain. The donor strain was transformed with the positive pAY1 cosmid clone
DNA. The vector pAY1 possesses an origin of transfer (oriT) sequence and contains an
integrase function of the actinomycete phage ФC31 where the site-specific integration of the
foreign DNA into the host genome takes place.125 A successful transfer of cosmid DNA can
be verified by selection on the apramycin resistance gene marker (aacC4). The overlay with
nalidixic acid inhibits the bacterial growth of the donor strain during incubation after the
conjugation event. Streptomyces exconjugants, that usually appeared after five days of
cultivation, were repeatedly transferred onto fresh agar plates containing different media in
order to remove remaining E. coli cells. Use of different solid and liquid media enhanced the
possibility of finding a putative new secondary metabolite produced by one of the
recombinant Streptomyces albus strains SE01-SE16. This method is described as “one strain
many compounds”- (OSMAC) principle.126 According to this, one strain is enabled to produce
different compounds depending on the provided media components.
Table 4.4 Conjugated Streptomyces albus strains carrying cloned fragments from Streptomyces sp. GW2/5831 (for cosmid numbers see table 4.2.)
Strain designation Conjugated fragment Streptomyces albus SE01 Cosmid 01 Streptomyces albus SE02 Cosmid 02 Streptomyces albus SE03 Cosmid 03 Streptomyces albus SE04 Cosmid 04 Streptomyces albus SE05 Cosmid 05 Streptomyces albus SE06 Cosmid 06 Streptomyces albus SE07 Cosmid 07 Streptomyces albus SE08 Cosmid 08 Streptomyces albus SE09 Cosmid 09 Streptomyces albus SE10 Cosmid 10 Streptomyces albus SE11 Cosmid 11 Streptomyces albus SE12 Cosmid 12 Streptomyces albus SE13 Cosmid 13 Streptomyces albus SE14 Cosmid 14 Streptomyces albus SE15 Cosmid 15 Streptomyces albus SE16 Cosmid 16

Results and discussion
57
All sixteen conjugated Streptomyces albus strains (SE01-SE16) are represented in figure 4.29.
They were grown on solid M2 medium which is known as the production medium for IB-
00208 in Streptomyces sp. GW2/5831.
Figure 4.29 : Conjugated Streptomyces albus strains (SE01-SE16) on M2 medium.
Fifteen of the strains show no visual deviation from the wild type of Streptomyces albus. In
contrast, the characteristic white colour of the spores was repeatedly not exhibited by
Streptomyces albus SE08, which might be due to the lack of sporulation. The morphology of
all conjugated Streptomyces albus (SE01-16) strains cultured on other media did not differ
from appearance in figure 4.29. Utilised agar plates consisted of LB- (figure 4.30), MS- and
2CM medium (without illustration). For the cultivation in liquid media, LB-, TSB- and meat
extract medium were employed (without illustration). Meat extract medium is known as
production medium for IB-00208 in liquid cultures of Streptomyces sp. GW2/5831 (Prof. H.
Laatsch, personal communication). No variation in appearance from unmodified Streptomyces
albus was detected. The absence of any coloured compound indicated that IB-00208 is not
produced by one or more of the conjugated strains. None of the cosmids harbours the entire
IB-00208 biosynthetic gene cluster. To obtain verification of received apramycin resistance of
the host strains, the conjugated strains were spread on LB medium containing apramycin
(figure 4.30). The strains SE02, SE07, SE10, SE12 and SE16 do not grow on apramycin agar
plates, whereas all other conjugated strains exhibit apramycin resistance.
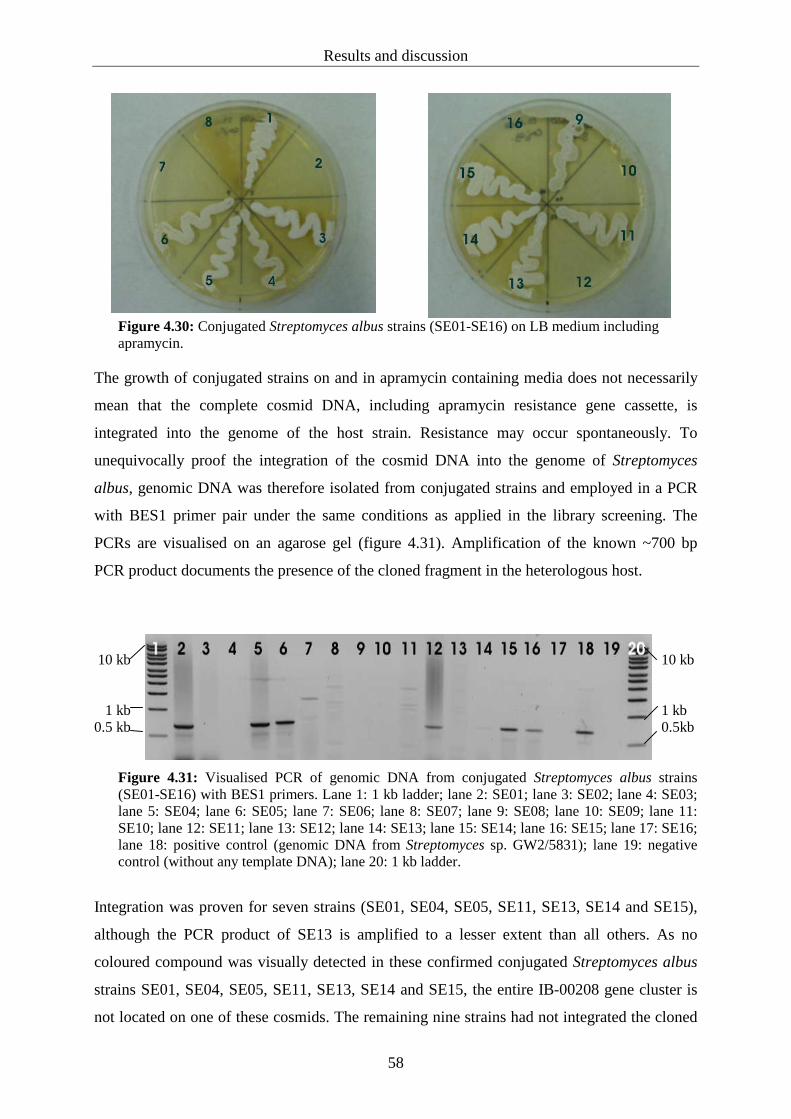
Results and discussion
58
Figure 4.30: Conjugated Streptomyces albus strains (SE01-SE16) on LB medium including apramycin.
The growth of conjugated strains on and in apramycin containing media does not necessarily
mean that the complete cosmid DNA, including apramycin resistance gene cassette, is
integrated into the genome of the host strain. Resistance may occur spontaneously. To
unequivocally proof the integration of the cosmid DNA into the genome of Streptomyces
albus, genomic DNA was therefore isolated from conjugated strains and employed in a PCR
with BES1 primer pair under the same conditions as applied in the library screening. The
PCRs are visualised on an agarose gel (figure 4.31). Amplification of the known ~700 bp
PCR product documents the presence of the cloned fragment in the heterologous host.
10 kb 1 kb 0.5 kb
10 kb 1 kb 0.5kb
Figure 4.31: Visualised PCR of genomic DNA from conjugated Streptomyces albus strains (SE01-SE16) with BES1 primers. Lane 1: 1 kb ladder; lane 2: SE01; lane 3: SE02; lane 4: SE03; lane 5: SE04; lane 6: SE05; lane 7: SE06; lane 8: SE07; lane 9: SE08; lane 10: SE09; lane 11: SE10; lane 12: SE11; lane 13: SE12; lane 14: SE13; lane 15: SE14; lane 16: SE15; lane 17: SE16; lane 18: positive control (genomic DNA from Streptomyces sp. GW2/5831); lane 19: negative control (without any template DNA); lane 20: 1 kb ladder.
Integration was proven for seven strains (SE01, SE04, SE05, SE11, SE13, SE14 and SE15),
although the PCR product of SE13 is amplified to a lesser extent than all others. As no
coloured compound was visually detected in these confirmed conjugated Streptomyces albus
strains SE01, SE04, SE05, SE11, SE13, SE14 and SE15, the entire IB-00208 gene cluster is
not located on one of these cosmids. The remaining nine strains had not integrated the cloned

Results and discussion
59
fragment into their genome. Thus the colour of the mycelia is not significant, and can
therefore not be appraised. The strains SE02, SE07, SE10, SE12 and SE16 neither grow on
apramycin nor do they show a PCR product. The strains SE03, SE06, SE08 and SE09 grow
on apramycin, although their genomic DNA does not contain the corresponding cosmid
sequence. Further attempts could generate exconjugants of SE02, SE03, SE06, SE07, SE08,
SE09, SE10, SE12 and SE16.
The lack of any visible compound might be due to the heterologous expression of the
incomplete IB-00208 biosynthetic gene cluster in the so far conjugated strains. Analytical
investigations could lead to the detection of a putative, uncoloured pathway intermediate that
might be produced by one of the conjugated Streptomyces albus strains containing cluster
fragments.
4.2.8 Subcloning and sequencing of selected cosmid clones
Important sequences might be hidden in regions of the cosmids that were not sequence-
analysed so far. To gain more insight into the sequence content of the cloned fragments,
another approach was required. Therefore, subcloning technique was performed.
4.2.8.1 Subcloning of selected cosmid clones
To obtain more sequence information about the cosmid DNA samples, two out of the sixteen
positive cosmid clones were selected and digested into smaller fragments. Aside from the
results of restriction analysis (4.2.6) and heterologous expression (4.2.7), the information in
table 4.3 was consulted for sample selection. To obtain as much sequence data as possible, the
maximum cluster coverage was aspired. It was putatively represented by the cosmids 11 and
14.
For restriction of the cosmid DNA three different type II endonucleases (table 4.5) were
tested. NotI is an eight base cutter, whereas SacI and PstI are six base cutters. For cosmid 11,
the NotI restriction pattern was the most suitable which exhibited the best band separation and
yielded 12 fragments of reasonable size for cloning (table 4.6). The endonuclease SacI
digested cosmid 14 into 14 fragments (table 4.6). PstI did not generate a useful restriction
pattern. The fragments were recovered from the gel via gel extraction (5.5.4.2). The vector
pBluescript was restricted with NotI for cosmid 11 and SacI for cosmid 14. After the ligation
reaction of the recovered fragments with pBluescript, the DNA was introduced into E. coli

Results and discussion
60
XL-1 Blue electrocompetent cells. Plasmid DNA was isolated from overnight cultures of
white transformants (5.5.9.6), and restriction was carried out. The sizes of vector and
fragments were verified (table 4.6, figures 4.32 and 4.33). As fragment pBSSE1105 (lane 6,
figure 4.32) and pBluescript both exhibit a size of about 3000 bp, the plasmid DNA was
restricted with two endonucleases. Cleavage of pBSSE1105 was therefore carried out with
NotI and ScaI simultaneously, generating three fragments. The fragment pBSSE1105 is
represented in the 3000 bp band, whereas pBluescript was restricted by ScaI yielding one
band at ~1000 bp and a further band at ~ 2000 bp, respectively. A double digestion with ScaI
was also required for fragment pBSSE1406 (lane 8, figure 4.33) that resulted in a 3000 bp
fragment derived from pBSSE1406, and pBluescript was cleaved as described above.
The subclones were subjected to sequence analysis. Sequencing of the obtained fragments,
based on the standard T3 and T7 primers, provided more evidence for putative protein coding
regions involved in IB-00208 biosynthesis (see table 4.7).
Table 4.5 Sequences, cleavage sites and evolving overhang of utilised endonucleases Endonuclease Sequence (5’-3’) Cleavage site (5’-3’) Overhang (5’-3’)
NotI GCGGCCGC GC GGCCGC CGCCGG CG
5’- GGCC
SacI GAGCTC GAGCT C C TCGAG
AGCT-3’
PstI CTGCAG CTGCA G G ACGTC
TGCA-3’
Table 4.6 Fragments and sizes of cosmids 11 and 14
Sample designation Fragment size (bp) Sample designation Fragment size (bp) pBSSE1101 14.000 pBSSE1402 10.000 pBSSE1102 10.000 pBSSE1403 8.000 pBSSE1103 6.000 pBSSE1404 6.000 pBSSE1104 5.000 pBSSE1405 3.800 pBSSE1105 3.000 pBSSE1406 3.000 pBSSE1106 1.800 pBSSE1407 2.500 pBSSE1107 1.400 pBSSE1408 1.800 pBSSE1108 1.100 pBSSE1409 1.600 pBSSE1109 700 pBSSE1410 1.300 pBSSE1110 600 pBSSE1411 1.200 pBSSE1111 550 pBSSE1412 800 pBSSE1112 < 500 pBSSE1413 650 pBSSE1401 12.500 pBSSE1414 550
The sizes of the large fragments were determined by means of the 1 kb extension ladder
(figure 4.32, lane 1 and 4.33, lane 1).
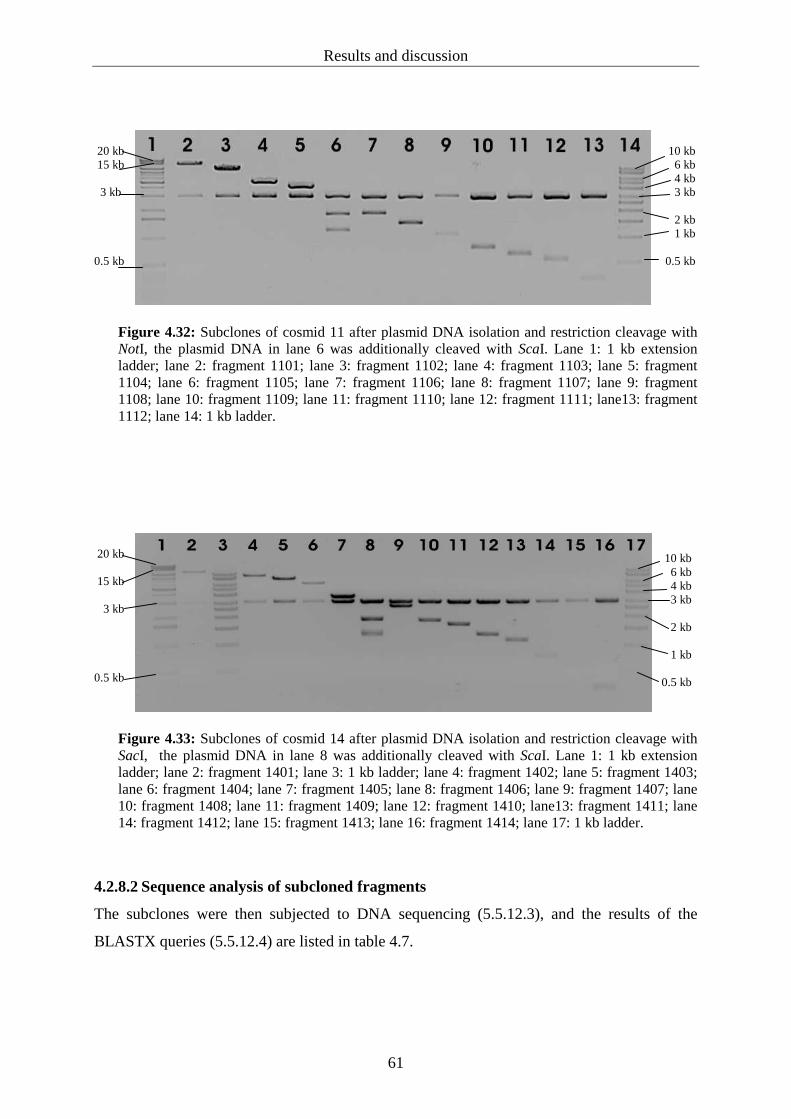
Results and discussion
61
20 kb 15 kb 3 kb 0.5 kb
10 kb 6 kb 4 kb 3 kb 2 kb 1 kb 0.5 kb
Figure 4.32: Subclones of cosmid 11 after plasmid DNA isolation and restriction cleavage with NotI, the plasmid DNA in lane 6 was additionally cleaved with ScaI. Lane 1: 1 kb extension ladder; lane 2: fragment 1101; lane 3: fragment 1102; lane 4: fragment 1103; lane 5: fragment 1104; lane 6: fragment 1105; lane 7: fragment 1106; lane 8: fragment 1107; lane 9: fragment 1108; lane 10: fragment 1109; lane 11: fragment 1110; lane 12: fragment 1111; lane13: fragment 1112; lane 14: 1 kb ladder.
20 kb 15 kb 3 kb 0.5 kb
10 kb 6 kb 4 kb 3 kb 2 kb 1 kb 0.5 kb
Figure 4.33: Subclones of cosmid 14 after plasmid DNA isolation and restriction cleavage with SacI, the plasmid DNA in lane 8 was additionally cleaved with ScaI. Lane 1: 1 kb extension ladder; lane 2: fragment 1401; lane 3: 1 kb ladder; lane 4: fragment 1402; lane 5: fragment 1403; lane 6: fragment 1404; lane 7: fragment 1405; lane 8: fragment 1406; lane 9: fragment 1407; lane 10: fragment 1408; lane 11: fragment 1409; lane 12: fragment 1410; lane13: fragment 1411; lane 14: fragment 1412; lane 15: fragment 1413; lane 16: fragment 1414; lane 17: 1 kb ladder.
4.2.8.2 Sequence analysis of subcloned fragments
The subclones were then subjected to DNA sequencing (5.5.12.3), and the results of the
BLASTX queries (5.5.12.4) are listed in table 4.7.

Table 4.7 Results of BLAST analysis of sequenced subclone-fragments (cosmids 11, 14)
Sample designation
Sequencing direction
Read length (bp)
Proposed function (homolog) Origin
Region of homology
(bp)
Identity (%)
Seq.length (homolog)
(aa)
Region of homology
(aa)
Accession number
pBSSE1101 T3 866 KSβ subunit (RubB)
Streptomyces collinus
204-4 59 422 24-90 AF293355
KSα subunit (RubA) Streptomyces collinus
845-264 79 428 224-417 AF293355
pBSSE1101 T7 1027 serine/threonine protein kinase
Streptomyces coelicolor
680-501 37 576 462-523 NP_628048
pBSSE1102 T3 395 high-affinity branched-chain amino acid
transport protein (ABC superfamily, ATP-
binding)
Frankia alni ACN14a
77-388 51 256 75-181 YP_715216
pBSSE1102 T7 703 ABC transporter, transmembran region,
type 1 precursor
Nocardioides sp. 651-367/343-
113
53/42 1081 434-528/557-
633
YP_922154
pBSSE1103 T3 734 transcriptional regulator (repressor) TetR family
protein
Streptomyces avermitilis
351-665 34 242 42-146 NP_822557
pBSSE1103 T7 525 hypothetical protein
Stigmatella aurantiaca DW4/3-1
518-207 54 499 299-398 ZP_01460657
pBSSE1104 T3 760 putative ABC transporter, drug export
system
Streptomyces avermitilis
740-135 44 258 55-256 NP_827888
pBSSE1104 T7 714 KSβ subunit (RubB) Streptomyces collinus
86-712 67 422 88-302 AF293355
pBSSE1105 T3 695 putative secreted protein
Streptomyces coelicolor
18-692 38 342 97-324 NP_630686
pBSSE1105 T7 946 putative ABC transporter (CydCD)
Streptomyces coelicolor
145-696 49 1172 942-1139 NP_628131
pBSSE1106 T3 925 sodium/hydrogen exchanger
Stigmatella aurantiaca
584-796 50 677 16-86 EAU68588

DW4/3-1 pBSSE1106 T7 945 sodium/hydrogen
exchanger Stigmatella aurantiaca
DW4/3-
708-166 41 677 208-388 EAU68588
pBSSE1107 T3 816 putative ABC transporter ATP-binding
protein
Nocardia farcinica
261-815 35 926 5-184 YP_119573
pBSSE1107 T7 873 putative ABC transporter ATP-binding
protein
Nocardia farcinica
426-797 42 926 1-126 YP_119573
pBSSE1108 T3 907 high-affinity branched-chain amino acid
transport protein (LivG) (ABC superfamily,
ATP-binding)
Frankia alni 850-563 58 272 12-107 YP_715217
pBSSE1108 T7 982 high-affinity branched-chain amino acid
transport protein (ABC superfamily, ATP-
binding)
Frankia alni 240-944 51 272 10-246 YP_715217
pBSSE1109 T3 1036 putative branched-chain amino acid transport
system
Frankia alni 747-25 26 401 12-262 YP_713343
pBSSE1109 T7 1041 putative branched-chain amino acid transport
system
Frankia alni 40-831 27 401 17-269 YP_713343
pBSSE1110 T3 648 polyketide synthase modules and related
proteins
Burkholderia mallei GB8 4
431-291 42 1516 1150-1198 ZP_00439137
pBSSE1110 T7 804 polyketide synthase modules and related
proteins
Burkholderia mallei GB8 4
238-444 41 1516 1150-1205 ZP_00439137
pBSSE1111 T3 1005 putative ABC transporter ATP-binding
protein
Frankia alni 495-1 44 937 354-534 YP_713339

pBSSE1111 T7 1020 putative ABC transporter ATP-binding
protein
Frankia alni 78-638 42 937 354-540 YP_713339
pBSSE1112 T3 1065 putative ABC transporter ATP-binding
protein
Frankia alni 290-111 48 937 536-595 YP_713339
pBSSE1112 T7 - - - - - - - - pBSSE1401 T3 742 SARP family pathway
specific regulatory protein
putative monooxygenase
Streptomyces griseus
Streptomyces
griseus
321-13 731-438
36
46
280
246
1-105
29-127
YP_001827897
AAQ08922
pBSSE1401 T7 595 putative O-methyltransferase
Streptomyces griseus
98-589 52 353 157-322 AAQ08925
pBSSE1402 T3 1010 conjugal transfer protein TraJ
Birmingham IncP-alpha plasmid
763-419 98 123 9-123 YP_001687709
pBSSE1402 T7 761 putative 3-oxoacyl-ACP reductase
Streptomyces tendae
472-86 51 245 45-173 CAM34370
pBSSE1403 T3 1010 hypothetical protein E. coli 873-508 95 123 2-123 NP_040360 pBSSE1403 T7 984 PadR-like family
transcriptional regulator
daunorubicin resistance ABC transporter ATPase
subunit
Streptomyces avermitilis MA-
4680 Alkaliphilus
metalliredigens QYMF
101-667
861-980
44
57
215
323
26-212
11-50
NP_827886
YP_001321687
pBSSE1404 T3 983 putative 3-oxoacyl-ACP reductase
Antibiotic biosynthesis monooxygenase (BenJ)
Streptomyces tendae
Streptomyces sp. A2991200
11-199
536-769
51
38
250
115
183-248
13-90
CAM34340
CAM58802
pBSSE1404 T7 992 uncharacterised protein Streptomyces fradiae
989-303 36 345 115-343 P20187
pBSSE1405 T3 181 no hits found - - - - - - pBSSE1405 T7 923 KSα subunit (RubA)
putative cyclase (RubE)
Streptomyces collinus
Streptomyces
396-922
93-377
67
61
428
143
6-181
45-140
AF293355
AAG03066

collinus pBSSE1406 T3 853 short-chain
dehydrogenase/reductase (SDR)
Frankia sp. EAN1pec
814-752 66 312 13-33 YP_001511055
pBSSE1406 T7 639 hypothetical protein (Pd2U) angucycline
cluster
Streptomyces sp. WP 4669
173-550 50 311 71-195 AAO65359
pBSSE1407 T3 892 FAD-dependent oxidoreductase
Burkholderia sp. 383
830-6 40 566 257-537 YP_366401
pBSSE1407 T7 953 short-chain dehydrogenase/reductase
(SDR)
Frankia sp. EAN1pec
342-812 40 246 36-185 YP_001507428
pBSSE1408 T3 931 O-methyltransferase
dehydrogenase (LlpS)
Streptomyces griseus
Streptomyces tendae
382-2
931-551
51
47
353
293
21-147
161-287
AAQ08925
CAM34368
pBSSE1408 T7 917 putative dehydrogenase (LlpS)
3-oxoacyl-ACP reductase
Streptomyces tendae
Streptomyces tendae
417-872
86-307
51
58
293
245
13-164
172-245
CAM34368
CAM34370
pBSSE1409 T3 928 putative methyltransferase
(GrhL)
Streptomyces sp. JP95
77-772 42 343 65-288 AF509565
pBSSE1409 T7 662 hypothetical protein Streptomyces pristinaespiralis
ATCC 25486
253-612 33 244 117-241 ZP_03191407
pBSSE1410 T3 899 putative polyketide cyclase (RubE)
putative polyketide cyclase (RubD)
Streptomyces collinus
Streptomyces collinus
115-2
545-222
60
69
143
123
1-38
1-108
AAG03066
AAG03065
pBSSE1410 T7 890 flavin reductase domain-containing protein
Frankia sp. EAN1pec
541-101 46 170 6-150 YP_001510489
pBSSE1411 T3 1067 putative 3-oxoacyl-ACP reductase (GrhO10)
Streptomyces sp. JP95
504-4 45 249 1-167 AF509565
pBSSE1411 T7 948 SARP-family regulatory Streptomyces 104-499 41 280 119-250 YP_001827897

protein griseus pBSSE1412 T3 - - - - - - - - pBSSE1412 T7 993 apramycin resistance
gene Cloning vector
pSET152
856-98 99 258 6-258 CAC93947
pBSSE1413 T3 - - - - - - - - pBSSE1413 T7 965 putative
monooxygenase, momA-like
Streptomyces cinnamonensis
385-696 30 206 30-152 CAL34085
pBSSE1414 T3 - - - - - - - - pBSSE1414 T7 962 LacZ alpha peptide Cloning vector
pYESW29 596-1066 100 191 28-184 ABI35978
The clones utilised for subcloning are located at the library coordinates 14B5 (cosmid 11) and 18C7 (cosmid 14).

Results and discussion
67
4.2.8.3 Appraisal of subcloning results
The obtained sequence data (table 4.7) were analysed to identify open reading frames
(5.5.12.5). The predictions of these protein coding regions are listed in table 4.8. The putative
organisation of the identified open reading frames (ORFs) within the genome of Streptomyces
sp. GW2/5831 in the region of the IB-00208 biosynthetic gene cluster is presented in figure
4.34. It was not possible to arrange all sequence information from table 4.7 inside the cluster
scheme. In cosmid 11 the content of sequenced DNA comprises 13.6 kb, covering one third of
the insert. Subcloning of cosmid 14 yielded 19.5 kb of sequenced DNA that corresponds to
one half of the insert size. Sequencing of 33.1 kb of genomic DNA from Streptomyces sp.
GW2/5831 revealed 20 open reading frames encoding PKS-, -post PKS tailoring, -regulatory,
-resistance and transport proteins as well as proteins with unassigned functions.
Table 4.8: Proposed functions of ORFs putatively involved in the biosynthesis of IB-00208 ORF
Amino Acids
Proposed Protein Function
Sequence Similarity (Protein, Origin)
Identity
Protein Accession Number
ORF01 422 KSβ RubB, Streptomyces collinus
67% AAG03068
ORF02 428 KSα RubA, Streptomyces collinus
79% AAG03067
ORF03 143 rubromycin biosynthesis-related cyclase I
RubE, Streptomyces collinus
69% AAG03065
ORF04 143 rubromycin biosynthesis-related cyclase II
RubD, Streptomyces collinus
60% AAQ08915
ORF05 170 Flavin reductase domain-containing protein
Franean1_6241, Frankia sp. EAN1pec
46% YP001510489
ORF06 311 Hypothetical protein from angucycline type II cluster
Pd2U, Streptomyces sp. WP 4669
50% AAO65359
ORF07 312 short-chain dehydrogenase/reductase (SDR)
Franean1_6815, Frankia sp. EAN1pec
66% YP001511055
ORF08 246 short-chain dehydrogenase/reductase (SDR)
FabG, Frankia sp. EAN1pec
40% YP001507428
ORF09 566 FAD-dependent oxidoreductase
Bcep18194 _C6708, Burkholderia sp. 383
40% YP366401
ORF10 345 Unknown Uncharacterised protein, Streptomyces fradiae
36% P20187
ORF11 115 Antibiotic biosynthesis monooxygenase
BenJ, Streptomyces sp. A2991200
38% CAM58802.1
ORF12 249 3-oxoacyl-ACP reductase
GrhO10, Streptomyces sp. JP95
45% AAM33668
ORF13 280 Regulatory protein SARP family pathway specific regulatory
41% YP001827897

Results and discussion
68
protein, Streptomyces griseus
ORF14 246 Monooxygenase FdmL, Streptomyces griseus
46% AAQ08922
ORF15 353 O-methyltransferase FdmN, Streptomyces griseus
52% AAQ08925
ORF16 293 Dehydrogenase LlpS, Streptomyces tendae
47% CAM34368.1
ORF17 245 3-oxoacyl-ACP reductase
LlpZIII, Streptomyces tendae
58% CAM34370.1
ORF18 323 Resistance protein daunorubicin resistance ABC-transporter ATPase subunit, Alkaliphilus metalliredigens
57% YP_001321687
ORF19 215 Transcriptional regulator PadR, Streptomyces avermitilis MA-4680
43% BAC74421
ORF20 206 Monooxygenase MomA, Streptomyces cinnamonensis
30% CAL34085
0.3 kb 20 19 18 17 16 15 14 13 12 11 10 // // // // // // 1413 1403 1408 1401 1411 1404 -- ---------- --------- --------------- -------------- ----- -- ------- // ▲ // ▲ ▲ // ▲// ▲// // ▲ SacI SacI SacI SacI SacI SacI 09 08 07 06 05 04 03 02 01 // // // // 1407 1406 1410 1405 / ... 1101 1104 ------------- --- --- ----- -------------- -------- ------------------- // ▲ // ▲ // ▲// ▲ ▲ SacI SacI SacI SacI/ NotI NotI Minimal PKS genes Redox tailoring genes Regulatory and resistance genes
Other core PKS genes Other tailoring genes unknown function
Figure 4.34: Genetic organisation of ORFs in the putative IB-00208 gene cluster deduced from the sequences of the cosmids 11 and 14. Each arrow represents the direction of transcription of an ORF (1-20), proposed functions are summarized in table 4.8. Restriction sites (NotI/ SacI) of the cosmid DNA are indicated by black triangles (▲), homologous regions are labelled by a black dashed line (----), gaps are marked with (//), fragment numbers are shown in bold, and the border between cosmids 11 and 14 is indicated by (/...).
Results and discussion
69
Polyketide core genes
The backbone of the polyketide structure is synthesised due to catalytic activity of a minimal
PKS (KSα, KSβ, ACP). Genes belonging to the minimal PKS of the putative IB-00208 gene
cluster are encountered within the sequenced fragments of the subclones. Parts of the KSα
subunit are encoded on the fragments “pBSSE1405 T7” (6-156 aa) and “pBSSE1101 T3”
(224-417 aa) that together represent ORF02. The query sequence of ORF02 shows a high
identity (79%) to KSα subunits of other type II PKS systems from pentangular73 polyketides
like rubromycin from Streptomyces collinus (RubA). The fragment “pBSSE1101 T3” contains
an acyltransferase GHSxG motif around Ser350 that is typical for a KSα. Furthermore,
“pBSSE1104 T7” and “pBSSE1110 T3” cover homologies to polyketide synthases and
related proteins. The sequence on “pBSSE1104 T7”, designated as ORF01, encodes a part of
the KSβ subunit similar to RubB (88-302 aa) in the rubromycin biosynthetic gene cluster. The
sequence on “pBSSE1110 T3” is similar to polyketide modules and related proteins.
Therefore it may harbour the so far undetected ACP component of the minimal PKS. The
KSβ-encoding fragment “pBSSE1104” exhibits a size of approximately 5 kb, whereas the
fragment “pBSSE1101 T3”, that is connected to “pBSSE1104” in the upstream direction,
comprises approximately 14 kb. The resulting distance between the KS subunits and ACP
would suggest a disconnected minimal PKS like described before for the griseorhodin and
daunorubicin clusters (see regulatory and resistance genes). On the other hand it could also be
the case that the ACP component follows downstream the KSβ on the unsequenced region of
“pBSSE1104 T7”. The formation of a polyketide ring system is referred to catalytic activity
of at least two cyclases.83 Two cyclases were identified on the subcloned fragments
“pBSSE1410 T3” and “pBSSE1405 T7” holding sequence homologies to genes involved in
the biosynthesis of pentangular polyketides. The sequence encoded on “pBSSE1410 T3”
shows a high identity to the RubD (60%) and RubE (69%) putative polyketide cyclases
(ORF04, ORF03) from the rubromycin cluster. A part of ORF3 (RubE, 45-140) is located on
“pBSSE1405 T7”.
PKS tailoring genes
The tailoring genes that are detected inside the analysed sequences encode proteins involved
in electron transfer reactions, except for one that putatively directs a methyltransferase
reaction. As IB-00208 contains many oxygenated residues, enzymes that catalyse redox
processes are expected. Parts of the fragments “pBSSE1411 T3” (1-167 aa) and “pBSSE1404
T3” (183-249 aa) contain a sequence homologous to GrhO10 that has the proposed function

Results and discussion
70
of a 3-oxoacyl-ACP reductase (ORF12). Interestingly, GrhO10 is described to code for an
unusual type of ketoreductase of the SDR family that is found in gene clusters of pentangular
polyketide pathways.73 The ORF17 that is spread between “pBSSE1402 T7” (38-172 aa) and
“pBSSE1408 T7” (173-245 aa) exhibits similarity to the lysolipin LlpZIII 3-oxoacyl-ACP
reductase from Streptomyces tendae. Another similarity to the lysolipin cluster is detected in
ORF16 that is functionally related to the dehydrogenase LlpS on the protein level. The
sequences on “pBSSE1406 T3” and “pBSSE1407 T7” produce alignments to proteins of the
family of short-chain dehydrogenases/ reductases (SDRs) and are not further characterised
(ORF07, ORF08). As monooxygenases transfer oxygen atoms to a substrate they are expected
in the biosynthetic pathway of IB-00208. The ORF14 encodes a putative monooxygenase
from Streptomyces griseus known as the producer of fredericamycin. Two other
monooxygenases from Streptomyces strains are detected in ORF11 (“pBSSE1404 T3”) and
ORF20 (“pBSSE1413”). ORF11 is similar to the BenJ antibiotic biosynthesis monooxygenase
from the benastatin cluster, whereas ORF20 represents a MomA-like monooxygenase that is
not further characterised. These oxygenases may play roles in common post-PKS tailoring
steps.121 The transfer of methyl groups from the ubiquitous S-adenosyl-L-methionine (SAM)
to nitrogen, oxygen or carbon atoms is frequently employed in bacteria, and is well known in
Streptomycetes. As IB-00208 contains five methoxy groups, the presence of O-
methyltransferases was expected. The sequences “pBSSE1401 T7” (157-329 aa) and
“pBSSE1408 T3” (21-147 aa) feature homology to the FdmN O-methyltransferase (ORF15)
from the fredericamycin cluster.
Regulatory and resistance genes
The sequence of “pBSSE1403 T7” is similar to a PadR transcriptional regulator (ORF19).
The sequence encoded in ORF13 belongs to the Streptomyces antibiotic regulatory protein
(SARP) family.127 Proteins of this family bind to promoter regions to activate the transcription
of downstream genes. They are part of many PKS systems, and they often contain a TTA
codon involved in regulation. A TTA codon is present in the sequence of “pBSSE1411 T7”
(ORF13). The gene encoded in ORF18 belongs to the branched-chain amino acid transport
protein family within the large super family of ATP-binding cassette (ABC) transporter
proteins.112 They are known to be responsible for the translocation of a variety of compounds
across biological membranes. ABC transporters are involved in the extrusion of noxious
substances, ranging from small ions to macromolecules. They therefore may be responsible
for antibiotic resistance (drug transporter) or fulfil functions in primary metabolism. The

Results and discussion
71
protein function of the sequence encoded on “pBSSE1403 T7” (ORF18) is annotated as a
daunorubicin resistance ABC transporter ATPase component in the database. Many ABC
transporters are detected on cosmid 11 that might contain mainly DNA beyond the cluster.
Proteins with unknown functions
Proteins with unknown functions (ORF06, ORF10) are similar to uncharacterised proteins
from Streptomycetes.
Outlook and prospects for future research
The sequencing results of the cosmid DNA fragments from two of the positive clones from
the library strongly suggest an involvement of the corresponding gene products in the
biosynthesis of IB-00208. Although the presence of polyketide core genes, tailoring genes,
regulation and resistance genes provides an indication of finding the demanded cluster, one
must keep in mind that further experiments, like gene inactivation, are still necessary for
proof of the actual function of the isolated DNA fragments.
As no genes coding for sugar biosynthesis or sugar attachment were identified so far, the
remaining DNA regions of the subclones should be analysed. Furthermore, screening of the
cosmids should be attempted by chromosome walking.
Another approach for generating a glycosylated compound could be the usage of biosynthetic
gene cassettes for the heterologous production of several deoxyhexoses.128 Their transfer to
polyketide aglycones could then be accomplished by utilising glycosylation engineering to
replace the natural substituents.129-131
A new candidate, IB-00208, is here described that belongs to the rare and barely investigated
class of pentangular polyketides. IB-00208 carries an unusually high number of methyl
groups. This class of pentangular polyketides includes compounds that exhibit unusual
spiroketal moieties resulting from the cleavage of C-C bonds, like, for example, the heavily
oxidised griseorhodin A.76 Members of this class share the pathway precursor collinone.
Therefore it can be envisioned that either griseorhodin A can be glycosylated by a GT from
the IB-00208 cluster or it can be considered possible that the griseorhodin tailoring genes76
can be used to convert IB-00208 into a hybrid polyketide carrying the spiroketal
pharmacophore.

Results and discussion
72
In conclusion, the findings on the genetic level in this work so far correlate very well with the
chemical structure of the molecule, and represent a basis for further investigations and
modifications of the IB-00208 biosynthetic gene cluster from Streptomyces sp. GW2/5831.
These insights contribute to polyketide research, and can be applied to tailored biosynthesis.

Materials and methods
73
5 Materials and methods (experimental procedures)
5.1 Chemicals, laboratory equipment and other materials
5.1.1 Chemicals
Table 5.1 Chemicals utilised in experiments of the present work Chemical Source Acetonitrile SDS GmbH, 76437 Rastatt Acetylpyridine adenine dinucleotide (APAD) Sigma-Aldrich, 82024 Taufkirchen Acrylamide Carl Roth GmbH, 76185 Karlsruhe Agar Merck-Eurolab, 64295 Darmstadt Agarose, NEEO ultra Carl Roth GmbH, 76185 Karlsruhe Agarose, low melt Carl Roth GmbH, 76185 Karlsruhe L-Amino acid oxidase Sigma-Aldrich, 82024 Taufkirchen Ammonia, liquid Merck-Eurolab, 64295 Darmstadt Ammonium chloride Merck-Eurolab, 64295 Darmstadt Ammonium molybdate heptahydrate Merck-Eurolab, 64295 Darmstadt Ammonium peroxodisulfate (APS) Merck-Eurolab, 64295 Darmstadt Ammonium sulfate Fluka/ Sigma-Aldrich, 82024 Taufkirchen Ampicillin Merck-Eurolab, 64295 Darmstadt Apramycin Sigma-Aldrich, 82024 Taufkirchen Asparagine Merck-Eurolab, 64295 Darmstadt Aspartic acid Merck-Eurolab, 64295 Darmstadt Boric acid Merck-Eurolab, 64295 Darmstadt Bradford Reagent Sigma-Aldrich, 82024 Taufkirchen Bromophenol Blue Sigma-Aldrich, 82024 Taufkirchen Calcium chloride dihydrate Fluka/ Sigma-Aldrich, 82024 Taufkirchen Calcium carbonate Merck-Eurolab, 64295 Darmstadt Casaminoacids Life Technologies (Gibco BRL), 76131 Karlsruhe Catalase Sigma-Aldrich, 82024 Taufkirchen Chloramphenicol Sigma-Aldrich, 82024 Taufkirchen Chloroform SDS GmbH, 76437 Rastatt Coomassie® Brilliant Blue G250 Sigma-Aldrich, 82024 Taufkirchen Copper(II) chloride dihydrate Sigma-Aldrich, 82024 Taufkirchen Deoxynucleoside triphosphates (dNTP’s) 10 mM set of dATP, dCTP, dGTP, dTTP
Invitrogen GmbH, 76131 Karlsruhe
Deuterium oxide Deutero, 56288 Kastellaun Diethylaminoethyl-Sepharose® FF (DEAE) GE Healthcare Bio-Sciences AB Uppsala, Sweden Dimethyl sulfoxide (DMSO) Carl Roth GmbH, 76185 Karlsruhe Dithiothreitol (DTT) Fluka/ Sigma-Aldrich, 82024 Taufkirchen Ethanol SDS GmbH, 76437 Rastatt Ethidium bromide Carl Roth GmbH, 76185 Karlsruhe Ethidium bromide solution (1%) Merck-Eurolab, 64295 Darmstadt Ethyl acetate SDS GmbH, 76437 Rastatt Ethylenediamine-tetraacetic acid (EDTA) Fluka/ Sigma-Aldrich, 82024 Taufkirchen Glacial acetic acid (99%) Merck-Eurolab, 64295 Darmstadt Glucose Merck-Eurolab, 64295 Darmstadt Glutamic acid Fluka/ Sigma-Aldrich, 82024 Taufkirchen Glutamine Sigma-Aldrich, 82024 Taufkirchen Glycerol Merck-Eurolab, 64295 Darmstadt Glycine Carl Roth GmbH, 76185 Karlsruhe

Materials and methods
74
Hydrazine Merck-Eurolab, 64295 Darmstadt Instant Ocean® Aquarium Systems, 57400 Sarrebourg, France IPTG (Isopropyl-ß-D-thiogalactopyranoside) Carl Roth GmbH, 76185 Karlsruhe Iron(III) chloride hexahydrate Merck-Eurolab, 64295 Darmstadt Iron(II) sulfate heptahydrate Sigma-Aldrich, 82024 Taufkirchen Kanamycin Sigma-Aldrich, 82024 Taufkirchen Kanosamine Prof. Floss, Seattle, WA 98195, USA LMW-SDS Marker Kit GE Healthcare Bio-Sciences, 80807 München Lysozyme Merck-Eurolab, 64295 Darmstadt Magnesium chloride hexahydrate Merck-Eurolab, 64295 Darmstadt Magnesium sulfate heptahydrate Merck-Eurolab, 64295 Darmstadt Malt extract Merck-Eurolab, 64295 Darmstadt Manganese chloride tetrahydrate Merck-Eurolab, 64295 Darmstadt Mannitol Sigma-Aldrich, 82024 Taufkirchen Meat extract Carl Roth GmbH, 76185 Karlsruhe Mercaptoethanol Serva, 69115 Heidelberg Methanol SDS GmbH, 76437 Rastatt MOPS (3-morpholinopropanesulfonic acid) Sigma-Aldrich, 82024 Taufkirchen Nalidixic acid Sigma-Aldrich, 82024 Taufkirchen Nicotinamide adenine dinucleotide (ß- NAD+) Sigma-Aldrich, 82024 Taufkirchen Ninhydrine Merck-Eurolab, 64295 Darmstadt Nitrogen Praxair Industriegase, 56659 Burgbrohl Nitrogen, liquid Institut für Strahlen- und Kernphysik, 53115 Bonn Orange G Sigma-Aldrich, 82024 Taufkirchen Orcinol Sigma-Aldrich, 82024 Taufkirchen Oxygen (99,5%) Praxair Industriegase, 56659 Burgbrohl Peptone Carl Roth GmbH, 76185 Karlsruhe Phenol-chloroform-isoamyl alcohol mixture (25:24:1)
Carl Roth GmbH, 76185 Karlsruhe
Phenylmethanesulfonyl fluoride (PMSF) Sigma-Aldrich, 82024 Taufkirchen Potassium acetate (KOAc) Carl Roth GmbH, 76185 Karlsruhe Potassium chloride Carl Roth GmbH, 76185 Karlsruhe Potassium dihydrogen phosphate Merck-Eurolab, 64295 Darmstadt di-Potassium hydrogen phosphate Merck-Eurolab, 64295 Darmstadt Potassium sulfate Fluka/ Sigma-Aldrich, 82024 Taufkirchen L-Proline Merck-Eurolab, 64295 Darmstadt 2-Propanol Merck-Eurolab, 64295 Darmstadt Pyridine Merck-Eurolab, 64295 Darmstadt Pyridoxal 5`-phosphat (PLP) Sigma-Aldrich, 82024 Taufkirchen Sodium acetate Carl Roth GmbH, 76185 Karlsruhe Sodium chloride Merck-Eurolab, 64295 Darmstadt Sodium dodecyl sulfate (SDS) Carl Roth GmbH, 76185 Karlsruhe Sodium hydroxide Merck-Eurolab, 64295 Darmstadt Sodium hydroxide solution 50% Sigma-Aldrich, 82024 Taufkirchen Sodium tetraborate Fluka/ Sigma-Aldrich, 82024 Taufkirchen Soytone Difco Laboratories, Detroit, MI 48288, USA Starch from potato, soluble Sigma-Aldrich, 82024 Taufkirchen Sucrose Merck-Eurolab, 64295 Darmstadt TES-buffer (N-[Tris(hydroxymethyl)methyl]-2-aminoethanesulfonic acid)
Fluka/ Sigma-Aldrich, 82024 Taufkirchen
Tetramethylethylenediamine (TEMED) Fluka/ Sigma-Aldrich, 82024 Taufkirchen Thiostrepton Sigma-Aldrich, 82024 Taufkirchen Trifluoroacetic acid (TFA) Merck-Eurolab, 64295 Darmstadt Tris-Base (Tris-[hydroxymethyl]-aminomethane) Merck-Eurolab, 64295 Darmstadt Tryptone Carl Roth GmbH, 76185 Karlsruhe UDP-galactose Fluka/ Sigma-Aldrich, 82024 Taufkirchen

Materials and methods
75
UDP-glucose Fluka/ Sigma-Aldrich, 82024 Taufkirchen UDP-glucose epimerase Calbiochem (Merck KgaA), 64293 Darmstadt UDP-kanosamine Prof. Floss, Seattle, WA 98195, USA X-gal (5-bromo-4-chloro-3-indolyl-ß-D-galactopyranoside)
Life Technologies (Gibco BRL), 76131 Karlsruhe
Xylene Cyanol FF Sigma-Aldrich, 82024 Taufkirchen Yeast Extract (Select®) Life Technologies (Gibco BRL), 76131 Karlsruhe Zinc(II) chloride Fluka/ Sigma-Aldrich, 82024 Taufkirchen Zinc(II) sulfate heptahydrate Sigma-Aldrich, 82024 Taufkirchen
5.1.2 Molecular biological kits, enzymes and molecular weight markers
Table 5.2 Reagent sets used in the present work Name Manufacturer Epicentre® CopyControl™ Fosmid Library Production Kit CCFOS110
Epicentre Biotechnologies, Madison, WI 53713, USA
First Strand cDNA Synthesis Kit Fermentas GmbH, 68789 St. Leon-Roth QIAquick Gel Extraction Kit Qiagen GmbH, 40724 Hilden RNeasy® Mini Kit Qiagen GmbH, 40724 Hilden
Table 5.3 Enzymes employed in molecular biological experiments Enzyme Manufacturer Antarctic phosphatase New England Biolabs, 65926 Frankfurt Bovine serum albumin (BSA) New England Biolabs, 65926 Frankfurt DNase (RNase-free) Promega, 68199 Mannheim GoTaq® DNA Polymerase (5u/µl) Promega, 68199 Mannheim RNAse A Invitrogen GmbH, 76131 Karlsruhe T4 DNA Ligase New England Biolabs, 65926 Frankfurt Restriction endonucleases BamHI New England Biolabs, 65926 Frankfurt EcoRV New England Biolabs, 65926 Frankfurt NotI New England Biolabs, 65926 Frankfurt RsaI Jena Bioscience GmbH, 07749 Jena SacI New England Biolabs, 65926 Frankfurt ScaI Jena Bioscience GmbH, 07749 Jena Enzymes included in molecular biological kits (5.1.2) are not listed here. Table 5.4 Molecular weight markers for gel electrophoresis Name Source 1 Kb DNA Ladder Invitrogen GmbH, 76131 Karlsruhe 1 Kb DNA Extension Ladder Invitrogen GmbH, 76131 Karlsruhe GeneRuler™ DNA Ladder Mix Fermentas, 68789 St-Leon-Rot

Materials and methods
76
5.1.3 Laboratory equipment and other materials
Table 5.5 Laboratory equipment Facility Manufacturer Analytical balances Mettler, 35353 Gießen; Sartorius, 37075
Göttingen Analytical column Carbopac™ PA-10 Dionex, Sunnyvale, CA 94085, USA Centrifuges 5804R, 5417R Eppendorf, 22339 Hamburg Centrifuge Rotina 35R Hettich, 78532 Tuttlingen Clean bench Laminar Airflow BSB 4A Gelaire Flow Laboratories, 53340 Meckenheim Clean bench Kojair Biowizard Class II Kojair, 35700 Vilppula, Finland Digital camera DC 90 Kodak, 70327 Stuttgart FPLC fraction collector Frac-900 GE Healthcare Bio-Sciences AB Uppsala, Sweden FPLC pump Äkta™ P-920 GE Healthcare Bio-Sciences AB Uppsala, Sweden FPLC UV monitor UPC-900 GE Healthcare Bio-Sciences AB Uppsala, Sweden Gel documentation Syngene gene genius Bio imaging system 3088S Imager
Frederick, MD 21704, USA
Gel electrophoresis systems Biometra, 37079 Göttingen; Bio-Rad, Hercules, CA 94547, USA
HPLC detector (ED-40) Dionex, Sunnyvale, CA 94085, USA HPLC pump (GP-40) Dionex, Sunnyvale, CA 94085, USA Microbiological incubators WTB Binder GmbH, 78532 Tuttlingen; Heraeus
63450 Hanau Microbiological incubator shaker Certomat BS-1 Sartorius, 37075 Göttingen Microbiological incubator shaker HT Infors Infors AG, CH-4103 Bottmingen, Schweiz MicroPulser™ Electroporator Bio-Rad, Hercules, CA 94547, USA Milli-Q ® Water System Millipore, 65760 Eschborn Mixer uzusio VTX-3000L LMS Laboratory and Medical Supplies, 78086
Brigachtal NMR Bruker Avance 300 DPX Bruker, 76287 Rheinstetten NMR Bruker DPX 500 Bruker, 76287 Rheinstetten PCR thermo cycler T3 Biometra, 37079 Göttingen PCR thermo cycler TGradient Biometra, 37079 Göttingen PH meter 766 Calimatic Knick GmbH, 14163 Berlin Polyacrylamide gel electrophoresis Maxigel system
Biometra, 37079 Göttingen
Spectral photometer Biomate3 Thermo Electron/ Thermo Fisher Scientific, Waltham, MA 02454, USA
Spectral photometer Uvikon 860 Kontron, 85386 Eching- München Steam autoclave V65 Systec GmbH, 35435 Wettenberg Steam autoclave Varioklav H+P, 85764 Oberschleißheim Thermomix comfort Eppendorf, 22339 Hamburg Ultra-low temperature freezer VIP series –86 °C Sanyo, Bensenville, IL 60106, USA Ultrasonic disintegrator Sonifier model 250 Branson, Danbury, Connecticut, USA Ultraviolet crosslinker CL-1000 UVP UVP Inc., Upland, CA 91786, USA Vacuum concentrator Speed Vac Plus SC110A Thermo Electron/ Savant
Waltham, MA 02454, USA Vacuum concentrator 5301 Eppendorf, 22339 Hamburg Water bath GFL 1083 GmbH für Labortechnik, 30938 Burgwedel
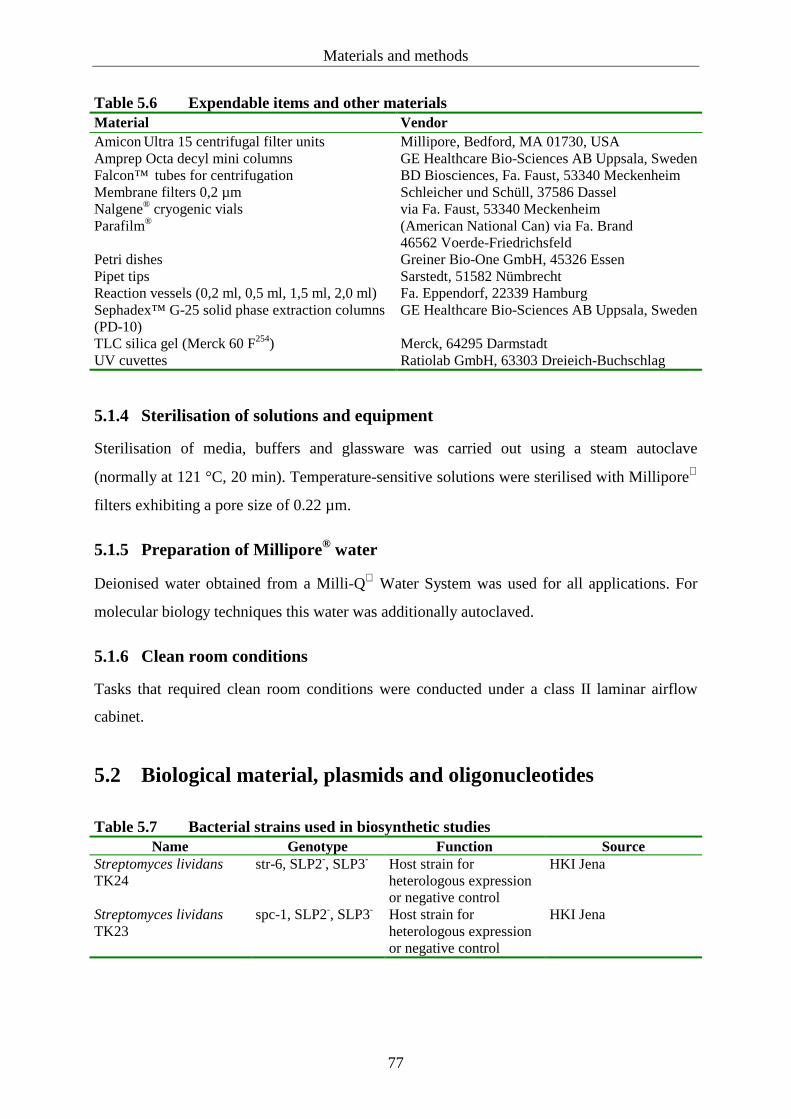
Materials and methods
77
Table 5.6 Expendable items and other materials Material Vendor Amicon Ultra 15 centrifugal filter units Millipore, Bedford, MA 01730, USA Amprep Octa decyl mini columns GE Healthcare Bio-Sciences AB Uppsala, Sweden Falcon™ tubes for centrifugation BD Biosciences, Fa. Faust, 53340 Meckenheim Membrane filters 0,2 µm Schleicher und Schüll, 37586 Dassel Nalgene® cryogenic vials via Fa. Faust, 53340 Meckenheim Parafilm® (American National Can) via Fa. Brand
46562 Voerde-Friedrichsfeld Petri dishes Greiner Bio-One GmbH, 45326 Essen Pipet tips Sarstedt, 51582 Nümbrecht Reaction vessels (0,2 ml, 0,5 ml, 1,5 ml, 2,0 ml) Fa. Eppendorf, 22339 Hamburg Sephadex™ G-25 solid phase extraction columns (PD-10)
GE Healthcare Bio-Sciences AB Uppsala, Sweden
TLC silica gel (Merck 60 F254) Merck, 64295 Darmstadt UV cuvettes Ratiolab GmbH, 63303 Dreieich-Buchschlag
5.1.4 Sterilisation of solutions and equipment
Sterilisation of media, buffers and glassware was carried out using a steam autoclave
(normally at 121 °C, 20 min). Temperature-sensitive solutions were sterilised with Millipore
filters exhibiting a pore size of 0.22 µm.
5.1.5 Preparation of Millipore® water
Deionised water obtained from a Milli-Q Water System was used for all applications. For
molecular biology techniques this water was additionally autoclaved.
5.1.6 Clean room conditions
Tasks that required clean room conditions were conducted under a class II laminar airflow
cabinet.
5.2 Biological material, plasmids and oligonucleotides
Table 5.7 Bacterial strains used in biosynthetic studies
Name Genotype Function Source Streptomyces lividans TK24
str-6, SLP2-, SLP3- Host strain for heterologous expression or negative control
HKI Jena
Streptomyces lividans TK23
spc-1, SLP2-, SLP3- Host strain for heterologous expression or negative control
HKI Jena
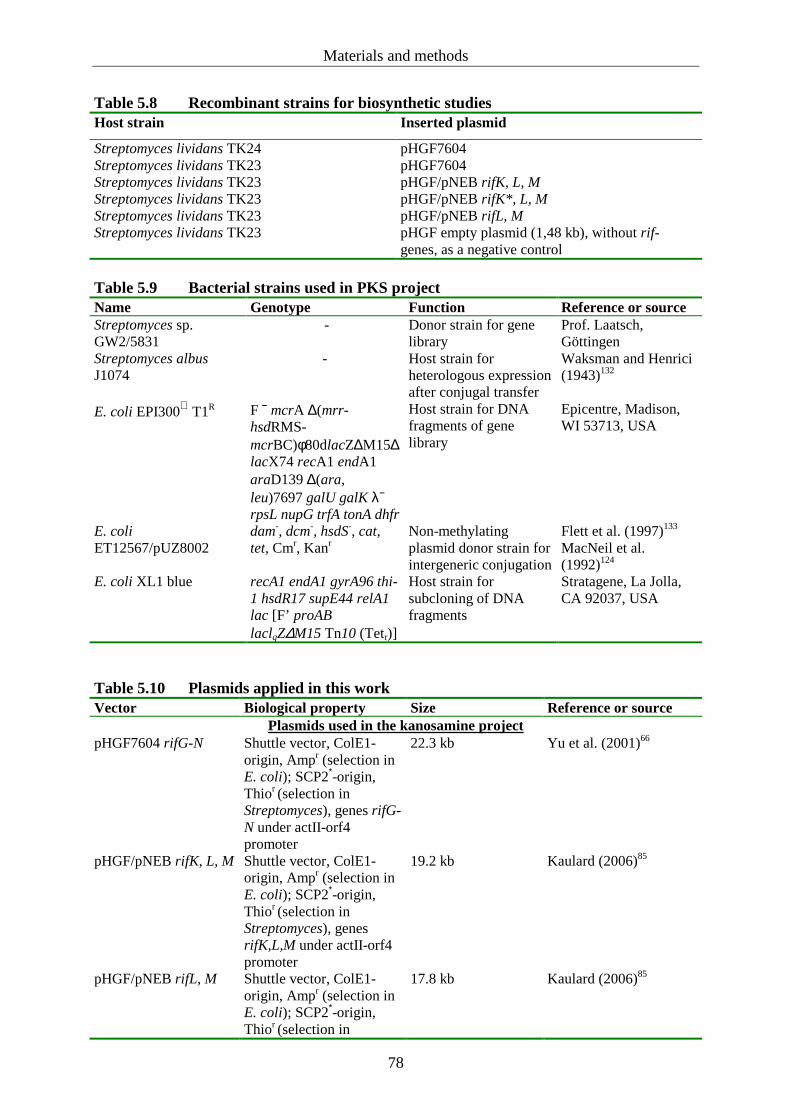
Materials and methods
78
Table 5.8 Recombinant strains for biosynthetic studies Host strain Inserted plasmid
Streptomyces lividans TK24 pHGF7604 Streptomyces lividans TK23 pHGF7604 Streptomyces lividans TK23 pHGF/pNEB rifK, L, M Streptomyces lividans TK23 pHGF/pNEB rifK*, L, M Streptomyces lividans TK23 pHGF/pNEB rifL, M Streptomyces lividans TK23 pHGF empty plasmid (1,48 kb), without rif-
genes, as a negative control Table 5.9 Bacterial strains used in PKS project Name Genotype Function Reference or source Streptomyces sp. GW2/5831
- Donor strain for gene library
Prof. Laatsch, Göttingen
Streptomyces albus J1074
- Host strain for heterologous expression after conjugal transfer
Waksman and Henrici (1943)132
E. coli EPI300 T1R F ̄ mcrA ∆(mrr-hsdRMS-mcrBC)φ80dlacZ∆M15∆ lacX74 recA1 endA1 araD139 ∆(ara, leu)7697 galU galK λ¯ rpsL nupG trfA tonA dhfr
Host strain for DNA fragments of gene library
Epicentre, Madison, WI 53713, USA
E. coli ET12567/pUZ8002
dam-, dcm-, hsdS-, cat, tet, Cmr, Kanr
Non-methylating plasmid donor strain for intergeneric conjugation
Flett et al. (1997)133 MacNeil et al. (1992)124
E. coli XL1 blue recA1 endA1 gyrA96 thi-1 hsdR17 supE44 relA1 lac [F’ proAB laclqZ∆M15 Tn10 (Tetr)]
Host strain for subcloning of DNA fragments
Stratagene, La Jolla, CA 92037, USA
Table 5.10 Plasmids applied in this work Vector Biological property Size Reference or source
Plasmids used in the kanosamine project pHGF7604 rifG-N Shuttle vector, ColE1-
origin, Ampr (selection in E. coli); SCP2*-origin, Thior (selection in Streptomyces), genes rifG-N under actII-orf4 promoter
22.3 kb Yu et al. (2001)66
pHGF/pNEB rifK, L, M
Shuttle vector, ColE1-origin, Ampr (selection in E. coli); SCP2*-origin, Thior (selection in Streptomyces), genes rifK,L,M under actII-orf4 promoter
19.2 kb Kaulard (2006)85
pHGF/pNEB rifL, M Shuttle vector, ColE1-origin, Ampr (selection in E. coli); SCP2*-origin, Thior (selection in
17.8 kb Kaulard (2006)85

Materials and methods
79
Streptomyces), genes rifL,M under actII-orf4 promoter
pHGF/pNEB rifK*, L, M
Shuttle vector, ColE1-origin, Ampr (selection in E. coli); SCP2*-origin, Thior (selection in Streptomyces), genes rifL,M under actII-orf4 promoter, rifK* point mutated
19.2 kb Kaulard (2006)85
pHGF empty plasmid (1,48 kb)
1480 bp fragment of promoter region of pNEB193C in pHGF7604 without rif gene cassette
16 kb Kaulard (2006)85
Plasmids used for the characterisation of the IB-00208 gene cluster pAY1 shuttle vector, Aprar, oriT 9.4 kb Li and Piel (2002)83 pBluescript II SK(+) cloning vector
Ampr, lacZ 3 kb Stratagene, La Jolla, CA
92037, USA ET12567/pUZ8002 helper plasmid, Cmr/Kanr Flett et al. (1997)133 Table 5.11 PCR primer Primer name DNA- sequence
(5`- 3`) Melting point T (°C)
Number of base pairs
Reference
Primer pairs for amplification of oxidoreductase gene rifL Oxidofw (degenerate)
GCG GTG GTC GGG CTC GGS TGG G
80,0 22 Boettcher (2003)72
Oxidorv (degenerate)
GGT TSG GGC TGA AGC CGA AGG TGC
80,0
24 Boettcher (2003)72
RT-PCR-Oxido_for (homologous)
GCG GTC GTC GGG CTC GGC TGG G
73,3 22
Yu et al. (2001)66 NCBI- accession-no. AAS07754
RT-PCR-Oxido_rev (homologous)
GGT TGG GGC TGA AGC CGA AGG TGC
69,6 24 Yu et al. (2001)66 NCBI- accession-no. AAS07754
Primer pairs for amplification of a PKS fragment in analysis of the cosmid gene library KS2F YGS YGC SAR
TGC GAC TTC G 51 19 Li and Piel
(2002)83 GenBank- accession no. AF509565
KS2R CCG AYC ATS GAC TTG ATG GAG C
53 22 Li and Piel (2002)83 GenBank- accession no. AF509565
KS4F GAG GCS VTC GMS GAC AGC GG
57 20 Li and Piel (2002)83 GenBank- accession no. AF509565
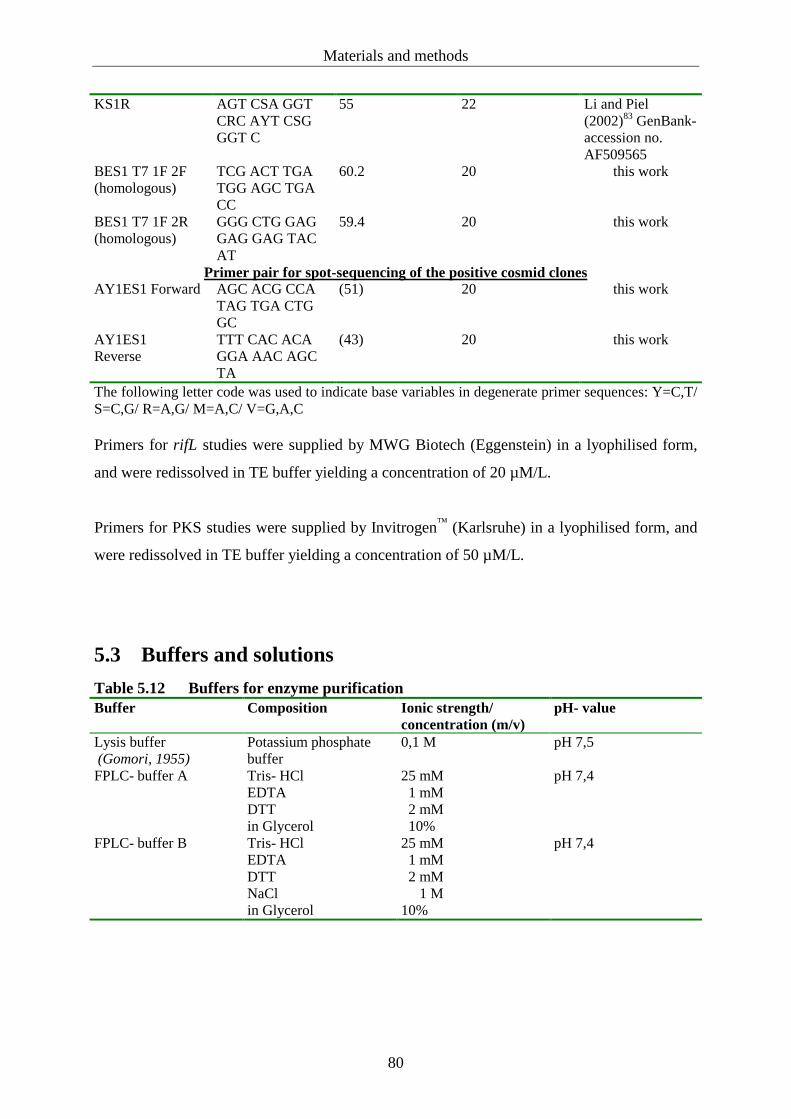
Materials and methods
80
KS1R AGT CSA GGT CRC AYT CSG GGT C
55 22 Li and Piel (2002)83 GenBank- accession no. AF509565
BES1 T7 1F 2F (homologous)
TCG ACT TGA TGG AGC TGA CC
60.2 20 this work
BES1 T7 1F 2R (homologous)
GGG CTG GAG GAG GAG TAC AT
59.4 20 this work
Primer pair for spot-sequencing of the positive cosmid clones AY1ES1 Forward AGC ACG CCA
TAG TGA CTG GC
(51) 20 this work
AY1ES1 Reverse
TTT CAC ACA GGA AAC AGC TA
(43) 20 this work
The following letter code was used to indicate base variables in degenerate primer sequences: Y=C,T/ S=C,G/ R=A,G/ M=A,C/ V=G,A,C Primers for rifL studies were supplied by MWG Biotech (Eggenstein) in a lyophilised form,
and were redissolved in TE buffer yielding a concentration of 20 µM/L.
Primers for PKS studies were supplied by Invitrogen™ (Karlsruhe) in a lyophilised form, and
were redissolved in TE buffer yielding a concentration of 50 µM/L.
5.3 Buffers and solutions
Table 5.12 Buffers for enzyme purification Buffer Composition Ionic strength/
concentration (m/v) pH- value
Lysis buffer (Gomori, 1955)
Potassium phosphate buffer
0,1 M pH 7,5
FPLC- buffer A Tris- HCl EDTA DTT in Glycerol
25 mM 1 mM 2 mM 10%
pH 7,4
FPLC- buffer B Tris- HCl EDTA DTT NaCl in Glycerol
25 mM 1 mM 2 mM 1 M 10%
pH 7,4

Materials and methods
81
Table 5.13 Buffers and solutions for SDS-PAGE and staining of PA matrix
Name Composition Comment denaturing loading buffer (5x)
Glycerol 87 % Mercaptoethanol SDS Bromophenol blue 1% (m/ v) Tris-HCl (1,9 M; pH 6,8)
5,75 g 2,5 ml 9,0 g 0,1 ml 1,65 ml
Ingredients were mixed and heated until completely dissolved, stored at 4-8 °C, warmed up to room temperature before use
APS-solution 20 % Ammonium peroxodisulfate H2O
2,0 g ad 10 ml
Store at –20 °C
Stacking gel buffer SDS Tris-HCl
0,4 % (m/v) 0,5 M
pH 6,8
Resolving gel buffer SDS Tris-HCl
0,4 % (m/v) 1,5 M
pH 8,8
Electrophoresis buffer (5x)
Glycine Tris-HCl SDS
0,96 M 0,125 M 0,5 % (m/ v)
pH 8,5
Coomassie staining solution
Coomassie Brilliant blue G250 Glacial acetic acid (100%) Methanol
1 g/ l 75 ml/ l 200 ml/ l
Colour stripping solution
Glacial acetic acid (100%) Methanol
75 ml/ l 200 ml/ l
Stacking gel matrix 4 %
Stacking gel buffer Acrylamide solution 40% H2O APS (20%) TEMED
2,5 ml 1,0 ml 6,4 ml 75 µl 15 µl
Components 1-3 were mixed and degassed, after adding of APS and TEMED directly poured into glass chamber
Resolving gel matrix 13,5 %
Resolving gel buffer Acrylamide solution 40% H2O APS (20%) TEMED
10 ml 13,4 ml 16,4 ml 200 µl 25 µl
Prepared as above, covered with a layer of butanol, polymerised over night
Low molecular weight marker
Phosphorylase B (97,4 kDa) BSA (66,2 kDa) Ovalbumin (42,7 kDa) Carbohydrase (31 kDa) Soy bean trypsin inhibitor (21,5 kDa) Lysozyme (14,4 kDa)
Table 5.14 Buffers for MALDI-TOF-MS sample preparation
Name Composition Buffer A TFA 0.1% Buffer B Acetonitrile 90%, TFA 0.085%

Materials and methods
82
Table 5.15 Buffers for DNA, RNA and plasmid DNA isolation Name Composition Buffer P1 50 mM Tris-HCl (pH 8)
10 mM EDTA 100 µg/ml RNAse A (heated at 99 °C for 1 min prior to addition to buffer to remove DNAse activity)
Buffer P2 200 mM NaOH 1% SDS
Buffer P3 3 M KOAc (pH 5.5) STE buffer 300 mM Sucrose
25 mM Tris-HCl (pH 8) 25 mM EDTA (pH 8) Lysozyme 5 mg/ml
TE buffer 10 mM Tris-HCl (pH 8) 1 mM EDTA (pH 8)
Table 5.16 Buffers for native agarose gel electrophoresis Name Composition Preparation Loading buffer (6x)
Bromophenol Blue Xylene cyanol Orange G Glycerol
0.05% 0.05% 0.05% 30%
TAE buffer (50x), pH 8.5 Tris-HCl Glacial acetic acid EDTA (0.5 M)
242 g 57.1 ml 100 ml
TBE buffer (10x), pH 8.0 Tris Boric acid EDTA (pH 8)
0.90 M 0.90 M 0.02 M
pH adjustment with HCl
Table 5.17 Solutions for preparation of competent cells by chemical method Name Composition TFB I TFB II
Potassium acetate 30 mM Calcium chloride 10 mM Potassium chloride 100 mM Manganese chloride 50 mM Glycerol 15% MOPS (Sigma) 10 mM Calcium chloride 75 mM Potassium chloride 10 mM Glycerol 15%
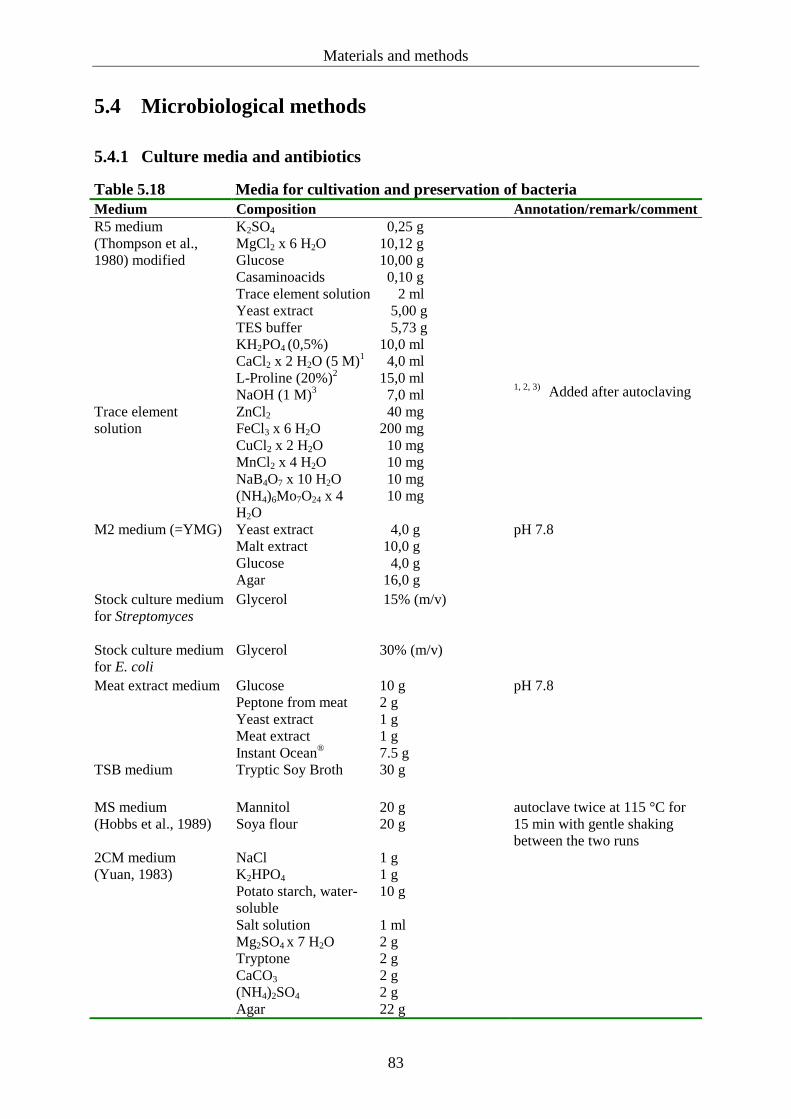
Materials and methods
83
5.4 Microbiological methods
5.4.1 Culture media and antibiotics
Table 5.18 Media for cultivation and preservation of bacteria Medium Composition Annotation/remark/comment R5 medium (Thompson et al., 1980) modified
K2SO4 MgCl2 x 6 H2O Glucose Casaminoacids Trace element solution Yeast extract TES buffer KH2PO4 (0,5%) CaCl2 x 2 H2O (5 M)1
L-Proline (20%)2
NaOH (1 M)3
0,25 g 10,12 g 10,00 g 0,10 g 2 ml 5,00 g 5,73 g 10,0 ml 4,0 ml 15,0 ml 7,0 ml
1, 2, 3) Added after autoclaving
Trace element solution
ZnCl2
FeCl3 x 6 H2O CuCl2 x 2 H2O MnCl2 x 4 H2O NaB4O7 x 10 H2O (NH4)6Mo7O24 x 4 H2O
40 mg 200 mg 10 mg 10 mg 10 mg 10 mg
M2 medium (=YMG) Yeast extract Malt extract Glucose Agar
4,0 g 10,0 g 4,0 g 16,0 g
pH 7.8
Stock culture medium for Streptomyces
Glycerol 15% (m/v)
Stock culture medium for E. coli
Glycerol 30% (m/v)
Meat extract medium Glucose Peptone from meat Yeast extract Meat extract Instant Ocean®
10 g 2 g 1 g 1 g 7.5 g
pH 7.8
TSB medium Tryptic Soy Broth 30 g
MS medium (Hobbs et al., 1989)
Mannitol Soya flour
20 g 20 g
autoclave twice at 115 °C for 15 min with gentle shaking between the two runs
2CM medium (Yuan, 1983)
NaCl K2HPO4 Potato starch, water-soluble Salt solution Mg2SO4 x 7 H2O Tryptone CaCO3 (NH4)2SO4 Agar
1 g 1 g 10 g 1 ml 2 g 2 g 2 g 2 g 22 g

Materials and methods
84
Salt solution FeSO4 x 7 H2O MgCl2 x 6 H2O ZnSO4 x 7 H2O
1 g 1 g 1 g
DSG medium (Kieser et al., 2000)
Yeast extract Casaminoacids CaCl2 (5M)
10 g 10 g 2 ml
LB medium (Bertani, 1951)
NaCl Tryptone Yeast extract
10 g 10 g 5 g
pH 7
Quantities are listed for the preparation of 1 liter solutions Table 5.19 Antibiotics for the counterselection of recombinant strains Antibiotic Concentration
Medium (µg/ ml) Concentration Stock solution (mg/ ml)
solvent
Ampicillin 100 100 water Apramycin 50 50 water Chloramphenicol 25 25 ethanol Kanamycin 25 25 water Nalidixic acid - 1 water Thiostrepton 20 50 DMSO
5.4.2 Cultivation and long term storage of Streptomyces lividans strains
Streptomyces lividans strains were used for biosynthetic studies of RifL oxidoreductase.
5.4.2.1 Cultivation of Streptomyces lividans on solid medium
For plating on YMG agar (table 5.18), 100 µl of a stock culture (5.4.2.3) were used. The
selection of recombinant Streptomyces lividans strains was accomplished by the addition of
thiostrepton in a concentration of 20 µg/ml medium. The petri dish, containing approximately
30 ml of medium, was incubated at 28 °C for 7 days.
5.4.2.2 Cultivation of Streptomyces lividans in nutrient solution
Bacterial growth in liquid culture was initiated by a slice of agar (1 cm2) obtained in 5.4.2.1.
A sterile 500 ml baffled flask was filled with 50 ml of R5 medium containing 20 µg/ml
thiostrepton when required for the recombinant strains. The baffles provided sufficient
Materials and methods
85
aeration of the culture broth. The flasks were covered with aluminium foil. The cells were
harvested for expression studies after shaking at 180 rpm and 28 °C for 5 days (5.4.7).
Alternatively 500 µl of a stock solution from a permanent culture (5.4.2.3) were used to
inoculate liquid cultures of Streptomyces lividans strains.
5.4.2.3 Long term storage of Streptomyces lividans strains
A liquid culture (5.4.2.2) was incubated for three days. Sedimentation was carried out at 5000
rpm and 4 °C for 15 minutes. Subsequent washing with 20 ml of a 15% glycerol solution was
followed by sedimentation at 5000 rpm and 4 °C for 15 minutes and resuspension in a 10 ml
glycerol solution. Aliquots of 1 ml were transferred to Nalgene® cryo tubes and stored at –80
°C. All steps were carried out under sterile conditions.
5.4.3 Cultivation of Streptomyces sp. GW2/5831
Streptomyces sp. GW2/5831 and Streptomyces albus J1074 were employed in polyketide
studies.
5.4.3.1 Cultivation of Streptomyces sp. GW2/5831 for the production of the red-coloured
polycyclic xanthone IB-00208
The fermentation protocol was kindly provided by F. Lissy from the work group of Prof.
Laatsch in Göttingen.
An agar slant of Streptomyces sp. GW2/5831 was used for the inoculation of solid M2
(=YMG) medium, whereas meat extract medium was employed for the production of the red-
coloured compound in liquid broth. The cultures were incubated for 18 days at 28 °C, and 95
rpm respectively.
5.4.3.2 Cultivation of Streptomyces sp. GW2/5831 for genomic DNA isolation
The bacterial strain was grown in tryptic soy broth (TSB) at 28 °C and 95 rpm for 18 days.
For the isolation of genomic DNA the cells were harvested by centrifugation at 5000 rpm
Materials and methods
86
under sterile conditions. Approximately 100 mg of pelleted bacterial cells were used for
genomic DNA isolation (5.5.1). The excess of cell material was stored at –20 °C for later use.
5.4.4 Preparation of a spore suspension from Streptomyces albus for conjugation
Streptomyces albus was inoculated on a MS agar plate and incubated at 30 °C for 7 days. The
mould was then transferred to 2 ml of 20% glycerol using a sterilised Q-tip. The concentration
of the spore suspension was estimated by means of a dilution series that was obtained by
plating of different amounts of spores.
5.4.5 Cultivation and long term storage of recombinant Streptomyces albus
strains
5.4.5.1 Cultivation of conjugated Streptomyces albus strains for the isolation of genomic
DNA
Conjugated Streptomyces albus strains were inoculated in 20 ml LB medium including 500 µl
of a 20% Glycine solution. The flasks were each equipped with a metal coil. After 20-24
hours of cultivation at 30 °C and 200 rpm, 1 ml of liquid culture was used for genomic DNA
isolation (5.5.1). The remaining culture broth was harvested by centrifugation at 5000 rpm
under sterile conditions, and was stored at –20 °C for later use.
5.4.5.2 Cultivation of conjugated Streptomyces albus strains for monitoring of potential
secondary metabolite producing recombinants
For the observation of a potential colour change of the liquid medium or agar plate due to
secondary metabolite production, conjugated strains were inoculated in and on different
media. Liquid cultures were set up in meat extract and LB nutrient broth, whereas agar plates
were established using 2CM, MS, M2 and LB medium.
5.4.5.3 Cultivation of conjugated Streptomyces albus strains for selection of incoming
cosmid
Conjugated Streptomyces albus strains were spread on LB agar plates containing 50 µg/ml
apramycin.

Materials and methods
87
5.4.5.4 Preservation of conjugated Streptomyces albus strains
Conjugated Streptomyces albus strains were grown on MS agar plates for 7 days at 30 °C. A
sterile Q-tip was used to transfer the mould to a tube that contained 15% glycerol solution.
These stock cultures were stored at –80 °C.
5.4.6 Cultivation and long term storage of recombinant E. coli strains
Recombinant E. coli strains were inoculated in 3 ml cultures of LB medium containing the
appropriate antibiotic in the required concentration. Inoculation was carried out using a
sterilised tooth pick that remained in the culture broth. These cultures were grown for 16
hours at 37 °C, and were then utilised for the preparation of plasmid DNA (5.5.2). Stock
cultures were produced by mixing 750 µl of overnight culture with the same amount of 30%
glycerol solution. These stock cultures were stored at –80 °C.
5.4.7 Growth kinetics of Streptomyces lividans
Cultures for protein expression studies were harvested at the end of the exponential growth
phase. To determine the specific time of the end of exponential growth phase, a set of ten
liquid cultures (5.4.2.2), representing different growth phases, was inoculated during ten
consecutive days. On the eleventh day all cultures were subjected to cell-free extract
production (5.6.1) and spectrophotometric measurement (5.6.6). Cell free extract production
was accompanied by weight determination of the cell pellet. Therefore, bacterial growth was
simultaneously documented by quantity. Measurement of the optical density of a cell
suspension is not suitable in this case, because Streptomyces tend to aggregate in liquid
cultures.
5.5 Molecular biological methods
5.5.1 Isolation of genomic DNA from gram positive bacteria
A Streptomyces culture consisting of 20 ml LB medium including 500 µl of a 20% glycine
solution was incubated with shaking at 200 rpm and 37 °C. After 24 hours (for Streptomyces
sp. GW2/5831 see chapter 5.4.3.2) 1 ml was removed from the flask and centrifugation was
carried out in a 2 ml Eppendorf tube at 14000 rpm for 30 seconds. The supernatant was
discarded, and the pellet was resuspended in 500 µl of STE buffer containing 2.5 mg
lysozyme. This mixture was incubated at 37 °C and 200 rpm for 3 hours. After the addition of
500 µl of 10% SDS solution and 100 µl of 3 M sodium acetate pH 5.3 and vigorous mixing,
incubation was continued for 45 minutes. The samples were then extracted three times with a

Materials and methods
88
mixture of phenol-chloroform-isoamyl alcohol (25:24:1). The aqueous layer above the protein
interphase was carefully transferred to 600 µl isopropyl alcohol and was vortexed heavily.
High molecular weight DNA was recovered after centrifugation at 10000 rpm for 2 minutes.
The pellet was rinsed with 500 µl of 70% ice cold ethanol, dried at room temperature and
dissolved in 30 µl TE buffer (pH 8). The DNA quality (size and concentration) was
determined on an agarose gel (5.5.4.1).
5.5.2 Isolation of plasmid and cosmid DNA
The isolation of plasmid or cosmid DNA from recombinant E. coli cells was carried out
according to the method described by Birnboim and Doly with slight modifications.134 The
modified alkaline lysis procedure of the cells was performed as follows:
A 1.5 ml of E. coli overnight culture (5.4.6) was centrifuged in a 1.5 ml Eppendorf tube at
10000 rpm for 30 seconds. The harvested cell pellet was resuspended in 200 µl of buffer P1
(table 5.15). For alkaline lysis 200 µl of buffer P2 were added, and the tube was inverted
several times. After a maximum of 2 minutes 200 µl of buffer P3 were added to the lysate,
after which the tube was inverted several times. The resulting precipitate was removed from
the solution by centrifugation at 13000 rpm for 3 minutes. The supernatant was transferred to
a 1.5 ml Eppendorf tube filled with 500 µl of chloroform. After vigorous mixing the sample
was centrifuged at 13000 rpm for 5 minutes. A 300 µl of the aqueous upper layer were
removed, omitting the protein interphase, and were then intensely mixed with 350 µl of
isopropyl alcohol. After centrifugation at 13000 rpm for 20 minutes the supernatant was
discarded. The DNA pellet was rinsed with 500 µl of ice cold 70% ethanol. The supernatant
was removed and the pellet was vacuum-dried and dissolved in 30 µl of MilliQ water.
5.5.3 Purification, concentration and quantification of DNA
5.5.3.1 Purification of vector DNA via phenol-chloroform extraction
The DNA was extracted twice with a mixture of phenol, chloroform and isoamyl alcohol
(25:24:1, v/v/v), followed by a single chloroform extraction. Between each step,
centrifugation was carried out for 1 minute at 14000 rpm and room temperature. The
supernatant was subjected to precipitation (5.5.3.2 to 5.5.3.4).
Materials and methods
89
5.5.3.2 Purification and concentration of vector DNA by means of isopropyl alcohol
precipitation
The aqueous DNA solution was mixed with 1 volume of isopropyl alcohol and 1/10 volume
of 3 M sodium acetate (pH 5) that provided the required monovalent cations. After storage at
–20 °C for 30 minutes, centrifugation was performed at 14000 rpm and 4 °C for 45 minutes.
The obtained pellet was rinsed two times with ice cold 70% ethanol, and sedimented at 14000
rpm and 4 °C for 15 minutes. The vacuum-dried pellet was resuspended in 5 µl of purified
water.
5.5.3.3 Purification and concentration of insert DNA for library production by means of
ethanol precipitation
The aqueous DNA solution was gently mixed with 1/10 volume of 3 M sodium acetate (pH
7), and 2.5 volume of room temperature-equilibrated 100% ethanol was added. After standing
for 10 minutes, centrifugation was carried out for 40 minutes at 14000 rpm and room
temperature. A small white pellet was visible, and approximately 95% of the supernatant was
carefully removed. Approximately 5 ml of ice cold 70% ethanol were slowly added along the
rim of the vessel. Sedimentation was performed at 4 °C and 11000 rpm for 20 minutes. The
last three steps were repeated, and at the end most of the supernatant was removed, leaving 50
µl of remaining liquid. 50 µl of elution buffer (Qiagen) were added to immediately dissolve
the pellet. Residual ethanol was evaporated under the clean bench.
5.5.3.4 Purification and concentration of blunt ended insert DNA for library production
by means of isopropyl alcohol precipitation
The aqueous DNA solution resulting from blunt ending reaction (5.5.10.1) was gently mixed
with 1.7 volume of isopropyl alcohol and 1/4 volume of 3 M sodium acetate (pH 5). After a
30 min incubation at room temperature, the sample was centrifuged at 4 °C and 14000 rpm
for 45 minutes. 95% of the supernatant was removed, avoiding contact with the inner surface
of the tube. Approximately 500 µl of ice cold 70% ethanol were slowly added, and
sedimentation was carried out for 5 minutes at 14000 rpm. The supernatant was discarded,
leaving approximately 7 µl in the tube. After the addition of 7 µl elution buffer (Qiagen) the
pellet was resuspended while heating at 50 °C in a water bath.

Materials and methods
90
5.5.3.5 Quantification and purity of nucleic acids
The concentration and purity of DNA and RNA samples was determined by means of a
spectrophotometer. Assuming a seam of 1 cm in the cuvette, the absorption value of 1.0 at a
wavelength of 260 nm corresponds to a concentration of 40 µg/ml for single-stranded DNA or
RNA, and to 50 µg/ml for double-stranded DNA. As proteins exhibit an absorption maximum
at 280 nm, the scale of purity was obtained by use of the A260 nm to A280 nm ratio. This quotient
was valid up to an absorption value of 2.0, whereas high quality nucleic acid solution was
reflected by a quotient between 1.7 and 2.0.135
The DNA concentration was calculated according to the following formula: [c] = A260 x dilution factor x 50 [mg/ ml]
5.5.4 Agarose gel electrophoresis
5.5.4.1 Native agarose gel electrophoresis
Due to the negatively charged phosphate groups in DNA molecules, DNA fragments can be
separated in an electric field. According to their size, smaller DNA fragments migrate longer
distances in agarose gel matrices than larger DNA molecules.
Agarose gel electrophoresis was carried out to check for the presence of DNA, to separate
DNA fragments of different sizes and to determine their molecular weight, yield and purity.
This method was additionally used to isolate particular bands for downstream applications
(5.5.5.2, 5.5.10.1) and to visualize PCR products. The gels consisted of 1% agarose NEEO
ultra in either 0.5 x TBE or 1 x TAE buffer. The respective buffer served as an electrophoresis
buffer as well, and thus covered the gel in horizontal gel chambers during electrophoresis.
The current inducing the electric field ranged between 80 V and 120 V, depending on the
required separation. A loading dye was added to each sample in a ratio of 1:10 to visualize
DNA migration on the gel. This dye contained a mixture of Xylene Cyanol FF (migrates at ~
5000 bp), Bromophenol Blue (migrates at ~ 300 bp) and Orange G (migrates at ~ 50 bp).
Glycerol was included in this loading dye to weight the sample solution down to the gel slots.
2-5 µl of a commercial size marker were applied to at least one outer lane. Specific size
markers allowed simultaneous DNA quantification where required (5.5.10.1). The DNA was
visualised by the addition of ethidium bromide. This binds strongly to DNA by intercalating
between the bases and when exposed to ultraviolet light, it will fluorescent with an orange
colour. Ethidium bromide was either directly included in the gel matrix to enable visualisation

Materials and methods
91
under UV light in the gel documentation system or used for staining of the gel after
electrophoresis. Therefore it was agitated in ethidium bromide solution (10 µg/ml) for 3-5
minutes. Non intercalated ethidium bromide was subsequently washed out with purified water
while shaking for 5 minutes. Analysis was performed using a UV transilluminator and a
digital camera.
5.5.4.2 DNA extraction from agarose gels
If required for downstream applications, the designated DNA fragment was excised from the
agarose matrix after the separation on an agarose gel omitting ethidium bromide (5.5.4.3). For
DNA recovery the QIAquick Gel Extraction Kit (Qiagen) was used according to the
manufacturer’s instruction manual.
5.5.4.3 Gel electrophoresis without ethidium bromide
To avoid DNA damage by exposure to UV light, electrophoresis was also performed without
including ethidium bromide in the agarose solution. The DNA was loaded in a larger well of
the agarose gel, with a ladder on each side. After electrophoresis, both sides including the
ladder were cut off with a sharp scalpel, and were then stained with ethidium bromide
solution for 15 minutes with shaking. A scalpel was used to mark the positions were the band
of interest should be situated and then all gel parts were again reassembled. Out of the UV
range, the desired fragments were excised from the gel according to the markings and then
subjected to DNA gel extraction (5.5.4.2).
5.5.5 DNA amplification by the polymerase chain reaction (PCR)
The polymerase chain reaction is a rapid in vitro technique for the amplification of DNA
fragments.136 This enzymatic reaction can only be conducted if at least the sequence
information of the flanked regions of the targeted DNA is known.
The sequence of the target region was taken as a template for deducing complementary
oligonucleotides, which are referred to as primers in the further course of the study (table
5.11).
The PCRs were carried out in a thermo cycler T3 or TGradient for optimisation of cycle
settings respectively. Optimisation of PCR conditions is indispensable for the efficient and
reliable amplification of DNA fragments. Therefore the reaction mixture and the cycling
protocol were varied with respect to the usage of DMSO for GC rich templates, MgCl2

Materials and methods
92
concentration and primer annealing temperature. The most suitable parameters to obtain a
distinct product, without unspecific amplification, were used for analysis as listed below.
For each PCR experiment positive and negative controls were carried out. Genomic DNA of
Streptomyces sp. GW2/5831 was used as template for the positive controls, whereas no DNA
was included in negative controls.
5.5.5.1 PCR conditions for pre testing of degenerate ketosynthase primer pairs on
genomic DNA from Streptomyces sp. GW2/5831
The following degenerate PCR primers were used for pre testing: KS2F, KS2R, KS4F and
KS1R (table 5.11). The primer pairs were applied in the PCR of genomic DNA from
Streptomyces sp. GW2/5831 as listed in table 5.20. Conserved motifs of KSα proteins from
pradimicin-type compound biosynthesis formed the basis of degenerate PCR primer
construction.83 The obtained PCR product was, subcloned in pBluescript II SK (+), sequenced
and the sequences were then used for designing specific primers (5.5.5.2) for library
screening.
Table 5.20 Degenerate primer pairs Primer pair Upstream primer Downstream primer Annealing
temperature
1 KS2F KS2R 46 °C 2 KS4F KS1R 50 °C 3 KS4F KS2R 48 °C Table 5.21 PCR mixture Reagent Volume GoTaq® reaction buffer (green) 10.0 µl dNTP mix 10 mM 1.0 µl DMSO 5.0 µl Upstream primer 1.0 µl Downstream primer 1.0 µl GoTaq® DNA polymerase (5 units/µl) 0.5 µl Millipore water 30.5 µl Template (genomic DNA of Streptomyces sp. GW2/5831)
1.0 µl
The reaction buffer contained magnesium chloride in a final concentration of 1.5 mM in each PCR.

Materials and methods
93
Table 5.22 Cycling protocol Step Temperature Time 1. initial denaturation 97 °C 5 minutes 2. primer annealing 46 °C/ 50 °C/ 48 °C 1.5 minutes 3. extension 74 °C 1 minute 4. denaturation 95 °C 0.5 minutes 5. primer annealing 46 °C/ 50 °C/ 48 °C 1 minute 6. repeat steps 3-5 - 29 cycles 7. final extension 74 °C 10 minutes 8. Cooling 4 °C indefinitely 5.5.5.2 Design of specific primers for the screening of the Streptomyces sp. GW2/5831
library
The yielded PCR product, amplified with degenerate primers (table 5.20), was visualised on a
gel and purified via gel extraction by means of QIAquick® Gel Extraction Kit (Qiagen). The
recovered DNA fragment, having 3’-A overhangs due to terminal transferase activity of Taq
polymerase, was subcloned into pBluescript II SK(+) vector having 3’-T overhangs (5.5.8).
Heat shock transformation (5.5.9.2) was carried out using chemical competent E. coli XL-1
Blue cells (5.5.9.1). Colonies were grown in overnight cultures, consisting of LB medium
including ampicillin, and plasmid DNA was isolated (5.5.2). After restriction analysis with
RsaI, samples were subjected to sequence analysis (5.5.12). Sequence data were then used for
designing specific primers that were required for the PCR screening of the genomic library.
The primer design was done with OligoPerfect™ software from Invitrogen™.
5.5.5.3 PCR conditions for library screening and monitoring of cosmid integration into
Streptomyces albus genome
To optimise PCR conditions, the annealing temperature of the specific primer pair was varied
between 48.5 and 56.2 °C (in steps of 2 °C, and 1.7 °C respectively), whereas 54.5 °C
emerged as suitable annealing temperature (table 5.24) resulting in one clear PCR product
with a size of ~700 bp. The usage of DMSO did not show any improvement of the PCR,
although generally recommended for GC-rich DNA. PCR was carried out in the presence of
1.5 mM magnesium chloride (MgCl2). Additional MgCl2 up to 3 and 4 mM showed no effect
on product amplification. The genomic DNA from Streptomyces sp. GW2/5831 served as a
positive control for each set of PCR. Negative controls were performed simultaneously
excluding any template DNA in the corresponding PCR vessel.

Materials and methods
94
Usage of the PCR program for GC-rich DNA matrices described in 5.5.6.3 resulted in highly
unspecific amplification. Therefore the whole cell cycling program listed in table 5.24 was
used for PCR mixtures (table 5.23).
For saving time and materials, row superpools were prepared for PCR. For that, aliquots of 20
µl culture from each of the 12 wells of an entire row of the microtiter plate were pipetted
together in one eppendorf tube. In this way, one microtiter plate could be screened in a round
of 8 PCRs instead of 96. Once a positive superpool identified, all the 12 wells of the
corresponding row were screened separately.
Screening of the library was conducted via whole cell PCR of E. coli. Direct usage of
Streptomyces cells in PCR is not possible, therefore genomic DNA had to be isolated (5.5.1).
Table 5.23 PCR mixture Reagent Volume GoTaq® reaction buffer (green) 1.25 µl dNTP mix 10 mM 0.125 µl Bovine serum albumin (BSA) 100x 0.0625 µl Upstream primer BES1 T7 1F 2F 1.25 µl Downstream primer BES1 T7 1F 2R 1.25 µl GoTaq® DNA polymerase (5 units/µl) 0.03125 µl Millipore water 9.78125 µl Template (pooled fractions or single wells of library, genomic DNA of Streptomyces sp. GW2/5831 or conjugated Streptomyces albus strains)
1.0 µl
Table 5.24 Cycling protocol Step Temperature Time 1. cell lysis 95 °C 5 minutes 2. initial denaturation 95 °C 0.5 minutes 3. primer annealing 54.5 °C 1 minute 4. extension 72 °C 1 minute 5. repeat steps 2-4 - 34 cycles 6. final extension 72 °C 5 minutes 7. Cooling 4 °C indefinitely
5.5.6 Reverse transcription polymerase chain reaction (RT-PCR)
RT-PCR is a very sensitive technique intended for monitoring gene expression. To prove the
presence of rifL mRNA transcript, total RNA was isolated from Streptomyces lividans
pHGF7604 using the RNeasy® Mini Kit (Qiagen) according to the manual. First strand
synthesis was performed by means of reverse transcriptase and random hexamer primer

Materials and methods
95
according to the technical manual of First Strand cDNA Synthesis Kit (Fermentas). The
obtained cDNA product was used as a template for PCR with the specific primer pair RT-
PCR-Oxido_for and RT-PCR-Oxido_rev (table 5.11). The amplified PCR product was
visualised under UV light after staining with ethidium bromide.
5.5.6.1 Isolation of total RNA from Streptomyces lividans pHGF7604
RNA was isolated using the method described by Chomczynski and Sacchi.137 All steps were
carried out under the clean bench in order to avoid contamination with RNA degrading
enzymes (ribonucleases). Additionally, all instruments (e.g. pipettes, …) were treated with 0.1
M sodium hydroxide solution if possible and exposed to UV light for 30 minutes.
A 50 ml liquid culture (5.4.2.2) of Streptomyces lividans pHGF7604 was harvested at 11000
rpm and 4 °C for 5 minutes. Approximately 65 mg of the cell material were subjected to RNA
isolation, according to the technical manual of the RNeasy® Mini Kit (Qiagen).
5.5.6.2 Protocol for cDNA-synthesis
The First Strand cDNA Synthesis Kit (Fermentas) was used for synthesis of complementary
DNA.
Total RNA 6 µl Random hexamer primer 1 µl Deionised, RNase free water ad 11 µl were carefully mixed in a PCR vessel and centrifuged for 5 seconds. The mixture was heated
at 70 °C in a thermo cycler for 5 minutes and cooled on ice.
5x reaction buffer 4 µl Ribonuclease inhibitor 1 µl 10 mM dNTP mix 2 µl were carefully added, centrifuged for 5 seconds and incubated at 25 °C in a thermo cycler for
5 minutes.
M- MuLV Reverse Transcriptase 2 µl was included in the reaction mixture. The mixture was first incubated at 25 °C for 10 minutes,
then at 37 °C for 60 minutes.
The reaction was stopped while heating at 70 °C for 10 minutes. The sample was cooled
down on ice, quantified and applied to PCR amplification.

Materials and methods
96
5.5.6.3 PCR conditions for RT-PCR
As a precondition to this experiment, a PCR was carried out using the degenerate primer pair
“Oxidofw” and “Oxidorv” (table 5.11) and genomic DNA (5.5.1) from Streptomyces lividans
pHGF7604 as DNA template. The PCR mixture was set up as listed in table 5.24, and the
cycling protocol shown in 5.26 was applied. For increased specificity, the specific primer pair
“RT-PCR-Oxido” (table 5.11) was employed in a PCR performed under the same conditions
as described above. After successful amplification of the rifL fragment, the specific primer
pair “RT-PCR-Oxido” was used for RT-PCR.
Table 5.25 PCR mixture for RT-PCR and corresponding pre test Reagent Volume GoTaq reaction buffer (green) 10.0 µl dNTP mix 10 mM 1.0 µl DMSO 5.0 µl Upstream primer (20 µM) 1.0 µl Downstream primer (20 µM) 1.0 µl GoTaq polymerase (5 units/µl) 0.2 µl Millipore water (sterilised) 30.8 µl DNA template (obtained in 5.5.6.2) 1.0 µl
Table 5.26 Cycling protocol for GC-rich DNA Step Temperature Time 1. Initial denaturation 97 °C 5 minutes 2. Primer annealing 65 °C 1.5 minutes 3. Extension 74 °C 1 minute 4. Denaturation 95 °C 0.5 minutes 5. Repeat steps 3-6 29 cycles 6. Primer annealing 65 °C 1 minutes 7. Final extension 74 °C 10 minutes 8. Cooling 4 °C indefinitely
5.5.7 Enzymatic manipulation of DNA
5.5.7.1 DNA analysis by restriction
Endonucleases were used together with the supplied buffer from the manufacturer. Sequence
specific cleavage was carried out utilising restriction endonucleases type II. Incubation of the
DNA with the enzyme and appropriate buffer, including BSA, was conducted at 37 °C for 2
hours.
Materials and methods
97
Standard protocol for digestion of DNA Reaction: DNA 0.5 µl Endonuclease 0.5 µl Buffer 1.0 µl BSA (100x) 0.1 µl Purified water 7.9 µl 5.5.7.2 Restriction cleavage for subcloning technique
For the subcloning of cosmid DNA fragments into pBluescript II SK (+) vector, both insert
and vector DNA were digested with the same restriction enzyme. The reactions were carried
out as listed below.
Standard protocols for restriction cleavage in subcloning work:
Reaction for insert DNA Cosmid DNA 50.0 µl Endonuclease 10.0 µl Buffer 15.0 µl BSA (100x) 1.25 µl Purified water 23.75 µl Incubation time at 37 °C was extended to 3 hours to ensure complete digestion. The
restriction reaction was applied to a gel without ethidium bromide. The DNA fragments were
excised separately, as far as possible, and were then recovered from the gel (5.5.4.2) for usage
in ligation reactions (5.5.7.4).
Reaction for vector DNA: Vector DNA 20.0 µl Endonuclease 2.5 µl Buffer 5.0 µl BSA (10x) 5.0 µl Purified water 17.5 µl After 2 hours of incubation at 37 °C, inactivation of the enzyme was achieved by heating at
65 °C for 20 minutes. The DNA was then dephosphorylated (5.5.7.3).

Materials and methods
98
5.5.7.3 Dephosphorylation of linearised pBluescript vector DNA
Antarctic phosphatase catalyses the removal of 5´ phosphate groups from DNA.
Dephosphorylation was carried out incubating 50 µl of the vector restriction solution with
6.25 µl of antarctic phosphatase in an appropriate buffer at 37 °C. After 30 minutes another 1
µl of antarctic phosphatase was added, and incubation was continued for further 15 minutes.
Dephosphorylation of pBluescript vector DNA was followed by purification via gel extraction
(5.5.4.2). The vector was then used for ligation (5.5.7.4).
5.5.7.4 Ligation by means of T4 DNA ligase
During ligation, DNA ligase catalyses the formation of covalent phosphodiester bonds
between adjacent nucleotides in duplex DNA strands. As a precondition, one nucleotide
requires a 5'-phosphate group and the other a 3'-hydroxyl group. In this work, T4 DNA ligase
(NEB) was used for all ligation reactions together with the supplied buffer.
Ligation reaction: Insert DNA 7 µl Vector DNA 1 µl T4 ligase 1 µl Ligase buffer 1 µl 10 µl
The ligase reaction was incubated in a thermo block at 16 °C over-night. T4 DNA ligase was
then inactivated by heating at 65 °C for 20 minutes.
Each time, between 2-5 µl of the ligation reaction were transformed either by electroporation
or by heat shock, depending on the size of the introduced foreign DNA. Electroporation was
suitable for large inserts like cosmids, whereas smaller plasmids were transferred by heat
shock transformation.
5.5.8 Cloning of PCR fragments in a T-overhang vector
This method was performed as described by Marchuk et al.138
5.5.8.1 Preparation of a T-overhang vector
The vector pBluescript II SK(+) was digested with the endonuclease EcoRV yielding blunt
ends. Therefore 10 µl of the vector plasmid preparation were incubated with 2.5 µl of the

Materials and methods
99
restriction enzyme, including the appropriate buffer, BSA and purified water to a final volume
of 50 µl. The mixture was incubated for 2 hours at 37 °C, followed by heat inactivation of the
enzyme at 80 °C for 20 minutes. Addition of 3’ T-overhangs was carried out during two hours
of incubation at 70 °C with 0.5 µl Taq polymerase and dTTP’s in a final concentration of 2
mM. The extraction and precipitation of the vector DNA from the reaction mixture was
achieved as described below:
- 100 µl of chloroform were added and the solution was mixed thoroughly - centrifugation was carried out at 13000 rpm for 5 minutes - the upper layer was transferred to 70 µl of isopropyl alcohol, avoiding the protein interlayer - after vigorous shaking, the solution was centrifuged at 4 °C and 13000 rpm for 20 minutes - the supernatant was discarded, and the pellet was rinsed with 200 µl of ice cold 70% ethanol - the pellet was vacuum-dried and dissolved in 10 µl of purified water
5.5.8.2 Ligation of unmodified PCR fragments into T-overhang vector
The TA cloning method benefits from the terminal transferase activity exhibited by Taq
polymerase. This enzyme adds an A-overhang to each end of a PCR product. Therefore it is
possible to perform a ligation of a PCR product directly into a vector provided with T-
overhangs. Therefore the PCR product obtained in 5.5.5.1 could be directly cloned into the
vector pBluescript II SK(+) that was prepared as described in 5.5.8.1.
5.5.9 Preparation of competent cells and their transformation
5.5.9.1 Preparation of E. coli XL1-Blue competent cells for heat shock transformation
Approximately 1 ml of an overnight-culture was added to 100 ml of fresh LB medium, and
grown at 37 °C and 200 rpm to an OD600 between 0.4 and 0.5. Cells were harvested by
centrifugation in 50 ml falcon tubes at 5000 rpm and 4 °C for 6 minutes. Pellets were
dissolved in 12.5 ml TFB I solution (table 5.17), sedimented as above and redissolved in 2 ml
TFB II solution (table 5.17). Aliquots of 100 µl were shock-frozen in liquid nitrogen, and
stored at –80 °C.

Materials and methods
100
5.5.9.2 Heat shock mediated transformation
Chemically competent cells obtained in 5.5.9.1 were mixed with 10 µl of a ligation reaction
(5.5.7.4, 5.5.8.2) and stored on ice for 20 minutes. Heat shock was carried out for 1 minute at
42 °C. Subsequently, the mixture was incubated on ice, and 900 µl of LB medium were
added. Incubation at 37 °C and 200 rpm for 1 hour was followed by centrifugation at 5000
rpm at room temperature for 10 seconds. Approximately 750 µl of the cell suspension were
spread on LB agar plates containing Ampicillin (100 µg/ml) that were impregnated with 20 µl
of X-gal (50 mg/ml) and 100 µl of IPTG (100 mM) at least 30 minutes prior to use. After
incubation at 37 °C for 16 hours colonies were visible. Blue and white colonies were
identified after at least 2 hours of storage at 4-8 °C. White colonies contained the DNA of
interest ligated into the vector (5.5.9.6), and were therefore subjected to plasmid DNA
isolation (5.5.2).
5.5.9.3 Preparation of E. coli ET12567/pUZ8002 competent cells for electroporation
Cells of E. coli ET12567/pUZ8002 were grown overnight at 37 °C for 16 hours in 5 ml LB
medium containing 25 µg/ml chloramphenicol and 25 µg/ml kanamycin. On the next day, 1
ml of this pre-culture was used to inoculate 100 ml of fresh LB medium containing
antibiotics. After reaching the OD600 of approximately 0.4, the cells were recovered by
centrifugation at 4000 rpm and 4 °C for 5 minutes. After decanting the supernatant, the pellet
was washed by gentle resuspension in 40 ml of ice-cold 10% glycerol. This was repeated with
30 ml, as well as 15 ml of ice-cold glycerol. After sedimentation in 15 ml glycerol, the
supernatant was discarded after centrifugation and the cell pellet was resuspended in the
residual glycerol. Aliquots of 50 µl were placed in tubes and treated with liquid nitrogen. The
obtained electrocompetent cells were stored at –80 °C.
5.5.9.4 Preparation of E. coli XL-1 Blue competent cells for electroporation
A 5 ml overnight-culture was used to inoculate 200 ml of fresh LB medium, followed by
incubation at 37 °C and 200 rpm to an OD600 between 0.4 and 0.6. All subsequent steps were
carried out either on ice or at 4 °C. For centrifugation at 5000 rpm for 5 minutes, the culture
broth was portioned into 50 ml falcon tubes. After resuspension in 25 ml of 10% glycerol and
sedimentation, the cells were washed twice with 10 ml of 10% glycerol. Two tubes were
combined and diluted with 5 ml of 10% glycerol to a volume of 25 ml. The next
centrifugation steps were carried out as described above (5.5.9.3). The cell pellet was first

Materials and methods
101
resuspended in 5 ml, then finally in 1 ml glycerol solution. The contents of all tubes were
combined, and aliquots of 70 µl were shock-frozen in liquid nitrogen and stored at –80 °C.
5.5.9.5 Electroporation
Electroporation was carried out using a Bio-Rad MicroPulser® and electroporation cuvettes (2
mm). Electrocompetent cell suspensions were mixed with 2 µl of oriT-containing vector,
including the desired DNA fragment. Electroporation was carried out (program settings:
bacteria, Ec2), and 1 ml of ice-cold LB medium was immediately added to the shocked cells.
This mixture was transferred to a tube and incubated with shaking for 1 hour at 37 °C.
Approximately 500 µl were spread on LB agar plate with appropriate antibiotic selection.
Subsequent incubation at 37 °C took place for 16 hours. The selection of recombinant clones
by “blue-white” screening is referred to in chapter 5.5.9.2 and 5.5.9.6.
5.5.9.6 Identification of recombinant clones using “blue-white” screening
The vector pBluescript II SK(+), employed in primer design and subcloning, contains the lacZ
gene with an internal multiple cloning site harbouring different restriction sites that can be
cleaved with the corresponding endonucleases. The foreign DNA is then inserted within the
lacZ gene in a ligation reaction, preventing the correct expression of ß-galactosidase that
metabolises the modified galactose sugar X-gal after induction with isopropyl-ß-D-1-
thiogalactopyranoside (IPTG). This reaction was then screened by examining the colour of the
resulting colonies. The vector without an insert expressed a functional ß -galactosidase
enzyme that converted its substrate X-gal to a bright blue-coloured product that is visible in
colony clones. The disruption of the lacZ gene results in white colonies that were utilised for
further studies. The insertion of a foreign DNA fragment can thus be monitored, but evidence
for a specific fragment must be obtained otherwise. Therefore plasmid DNA of white clones
was isolated after transferring to liquid medium, and restriction analysis was performed. The
samples were then subjected to sequence analysis.
5.5.10 Construction of a gene library from Streptomyces sp. GW2/5831
5.5.10.1 Genomic DNA isolation and library construction
Genomic DNA from Streptomyces sp. GW2/5831 was isolated according to the previously
described procedure (5.5.1). The highly concentrated high molecular weight DNA solution
obtained in the isolation procedure was dissolved with 1000 µl Millipore® water.
Approximately 700 µl (~ 2 µg) from this crude DNA solution were loaded onto a 0.9% (w/v)

Materials and methods
102
low melting point agarose gel. After electrophoresis, fragments of approximately 40 kb in
size were recovered from the gel by gel-digestion with GELase (Epicentre Biotechnologies),
according to the manufacturer's protocol with following modifications: 1 U of GELase
enzyme preparation was added to each 300 µl of melted agarose, followed by incubation at 45
°C for 2 h. After inactivating the enzyme at 70 °C for 10 min and removing any undigested
agarose by centrifugation at 11.000 rpm for 30 min, the DNA was precipitated at room
temperature with 2.5 volumes of 100% ethanol (5.5.3.3) and 1/10 volume of sodium acetate
(pH 7). That was followed by centrifugation at 11.000 rpm for 40 min and two washing steps
with 70 % Ethanol at 4 °C. The DNA was then dissolved in 50 µl Tris buffer (10 mM, pH
8.5). This size-selected genomic DNA was first blunt-ended for 45 min at room temperature
(see below), the reaction being stopped by adding EDTA to a final concentration of 10 mM
and by a subsequent 10 min inactivation step at 70 °C. The DNA was then precipitated with
isopropyl alcohol (5.5.3.4) and 3 M sodium acetate (pH 5), and after a 30 min incubation step
at room temperature, the nucleic acids were recovered after 45 min of centrifugation at 14.000
rpm and 4 °C. Approximately 50 ng of blunt-ended DNA eluted with 7 µl Tris buffer (10
mM, pH 8.5) were used in a 2 h ligation step (5.5.10.3) at room temperature with
approximately 200 ng of pAY1 vector (5.5.10.2), using Fast-Link DNA ligase (Epicentre
Biotechnologies). The DNA was then packaged in lambda phage and used to infect EPI300™
T1R E. coli cells according to the manufacturers protocol (CopyControl Fosmid Library
Production Kit from Epicentre Biotechnologies). The infected EPI300™ T1R E. coli cells
were spread on 25 LB agar plates containing apramycin, and incubated for 16 hours over
night. Approximately 4800 clones were obtained, and the library was established comprising
2016 random clones (5.5.10.4). The clones were subjected to whole cell PCR screening as
described in 5.5.10.6 and 5.5.5, using the specific primers “BES1 T7 1F 2F” and “BES1 T7
1F 2R”.
blunt ending reaction End-repair buffer (10x) 8 µl dNTP mix (2.5 mM) 8 µl ATP (10 mM) 8 µl DNA (~40 kb) 50 µl End-repair enzyme mix 4 µl (T4 DNA ligase + T4 polynucleotide kinase)

Materials and methods
103
5.5.10.2 Preparation of pAY1 cosmid vector DNA
Cosmid vector DNA was isolated from the E. coli DH5α host strain according to the plasmid
isolation protocol (5.5.2). For the clean-up procedure, the vector DNA was loaded onto a gel
and was recovered via gel extraction (5.5.4.2). Approximately 34 µl of the vector DNA were
then restricted with 2 µl of the endonuclease EcoRV in appropriate buffer including BSA. The
resulting blunt ended DNA was yielded after 3 hours of incubation at 37 °C. The removal of
5’phosphate groups was catalysed by antarctic phosphatase. This was performed during
incubation of 20 µl of vector DNA with 2 µl antarctic phosphatase (see also 5.5.7.3) at 37 °C.
After 30 minutes another 1 µl antarctic phosphatase was added, and incubation was continued
for 30 minutes. The previous step was repeated. The enzyme was inactivated by heating at 65
°C for 5 minutes. The mixture was purified by phenol-chloroform extraction (5.5.3.1) and
concentrated by precipitation (5.5.3.2). The vector DNA was quantified on an agarose gel by
comparing with Fosmid Control DNA.
5.5.10.3 Ligation
The ligation reaction was set up as follows:
8.5 µl insert DNA (approximately 50 ng)
0.5 µl vector DNA (approximately 200 ng)
1.2 µl Fast-Link™ Ligation Buffer (10x)
1.0 µl ATP (10 mM)
1.0 µl Fast-Link™ DNA Ligase
12.2 µl
incubated at room temperature for 2 hours, heat-inactivated at 70 °C for 10 minutes.
5.5.10.4 Size of library for genome coverage
Evaluation of the correct number (N) of clones required for the coverage of the whole genome
of Streptomyces sp. GW2/5831, for an average insert length of 40 kb, was achieved by the
following formula:139
N = ln (1 - P) / ln (1 - f)
Materials and methods
104
In this equation P (99.9% = 0.999) represents the probability of a genome fragment to occur
in the library, whereas f (= 0.005) denominates the quotient of insert length to the genome
size of 8 Mb for Streptomycetes.5
5.5.10.5 Clone picking and replication
The construction of the library was performed by inoculating individual clones into the wells
of 21 microtiter plates, resulting in 2016 preserved clones. Therefore, each well was pre-filled
with 100 µl of LB broth containing 50 µg/ml apramycin. The cosmid clones were transferred
to the medium via sterilised tooth picks, and incubated over night at 37 °C. On the next day a
copy of each microtiter plate was established using a transfer seal to inoculate a fresh pre-
filled microtiter plate as described above. After replication 100 µl of 50% glycerol were
added to the wells of the original plates by gentle mixing. The yielded 25% glycerol stock
cultures that harboured one individual cosmid clone each were stored at –80 °C. The replicas
were used to combine 20 µl aliquots of the wells 1 to 12 in each row, obtaining 8 pooled
fractions from each microtiter plate consisting of 96 wells.
5.5.10.6 PCR based screening of the library
To obtain a general survey on the number and rough location of positive clones included in
the library, whole cell PCR was carried out employing the pooled lines from replicates
(5.5.10.5). Each microtiter plate was analysed by a set of ten PCRs comprising 8 pooled
fractions as well as a positive and a negative control. After the detection of a positive pool,
corresponding wells were screened separately. Hence thirteen PCRs were carried out,
including twelve single well samples and a positive control. This resulted in the identification
of the exact coordinates of single positive clones harbouring the DNA fragment of interest.
5.5.11 Intergeneric transfer of cosmid DNA between E. coli and Streptomyces
This technique was described by Flett et al.133 The cosmid containing oriT was introduced
into the competent cells of E. coli ET12567/pUZ8002 by electroporation (5.5.9.5). A single
colony of the transformant was inoculated into 3 ml of LB medium containing 25 µg/ml
chloramphenicol (for ET12567 selection), 25 µg/ml kanamycin (for pUZ8002 selection) and
50 µg/ml apramycin (for pAY1 selection). The culture was incubated for 16 hours at 30 °C
and 200 rpm. On the next day 100 µl of the pre-culture were used to inoculate fresh LB
medium including appropriate antibiotics. Cultivation was continued until an optical density
of OD600 0.4-0.6 was obtained. At the same time 100 µl of a Streptomyces albus spore
Materials and methods
105
suspension (108) (5.4.4) were mixed with 500 µl of TES buffer (0.05 M TES, pH 8). The
mixture was heat shocked for 10 minutes at 50 °C, and, after cooling down, 500 µl of DSG
(double strength germination) medium were added. Incubation was continued for 1.5 hours at
37 °C.
Approximately 1 ml of E. coli cells was washed three times with fresh LB medium without
any antibiotic, and mixed with the spores after germination. The mixture was shortly
centrifuged, the supernatant was decanted, and the cells were plated on 2CM agar plates.
After incubation at 30 °C for 15-16 hours, the overlay was carried out using 1 ml water
containing 1 mg nalidixic acid and 1 mg apramycin to inhibit overgrowth of E. coli cells.
Agar plates were continuously incubated at 30 °C for approximately 5-7 days until potential
exconjugants matured. Exconjugants were then transferred to different solid and liquid media
for colour monitoring (5.4.5.2).
5.5.12 DNA sequence analysis
5.5.12.1 Sequence analysis of large cosmid DNA via spot-sequencing
For evidence of PKS fragments and coverage of the gene cluster, the positive cosmids were
end-sequenced with primers designed according to the pAY1 sequence adjacent to EcoRV
cleavage site (AY1ES1 Forward and AY1ES1 Reverse) deduced as shown in 4.2.6 (figure
4.26). The end-sequences were analysed by conducting BLAST homology searches with
Advanced BLAST X data base tool (5.5.12.4).
5.5.12.2 Sequence analysis of large cosmid DNA via subcloning technique
To obtain more sequence data, the DNA of two selected cosmid clones comprising
approximately 50 kb was digested into 12-14 smaller fragments by restriction cleavage with
NotI and SacI endonucleases (5.5.7.2). The cloning vector pBluescript was treated with the
equivalent endonuclease, and dephosphorylation was carried out using antarctic phosphatase
(5.5.7.3). After purification of the vector DNA by means of gel extraction (5.5.4.2), each
fragment was inserted into pBluescript via ligation reaction (5.5.7.4). The inserts were end-
sequenced with T7 and T3 universal primers. Sequences were analyzed by BLAST homology
searches.

Materials and methods
106
5.5.12.3 DNA sequencing
The Sequence data were obtained from GATC Biotech AG service or 4baseLab. Samples
were automatically sequenced on an ABI 3730xl DNA Analyzer (Applied Biosystems) using
the dideoxy mediated chain termination method.140 The employed dideoxy nucleotides were
linked with four fluorescent dyes, each base type carrying a specific colour. Therefore the
nucleotide sequences were determined by means of a fluorescence detector subsequent to
sample separation via capillary electrophoresis in a polyacrylamide matrix.
5.5.12.4 Computer-assisted appraisal of obtained DNA sequences
The software programs BioEdit and Vector NTI® were used to attend DNA sequences. The
raw data were subjected to the Advanced BLAST X homology search data base for nucleotide
sequence alignment (http://www.ch.embnet.org/software/aBLAST.html). Advanced BLAST
X program searches a protein database using a translated nucleotide query that provides
information about putative gene products and their functions.141 The computation was
performed using the BLAST network service that utilises the NCBI (National Centre for
Biotechnology Information) BLAST 2 software.
5.5.12.5 Determination of open reading frames (ORFs)
After the determination of the nucleotide sequence, the obtained data were analysed to
identify open reading frames.5 An ORF is a nucleotide sequence of substantial length between
a start and a stop codon that could potentially code for a protein. Analysis of Streptomyces
DNA results in a high Guanine and Cytosine content. In all likelihood the positions 1 and 3 of
each triplet are occupied with a Guanine or Cytosine base (see table 5.27).142 In Streptomyces
G+C rich DNA it is encountered frequently that all of the six possible reading frames (both
directions, position 1, 2 or 3 of a triplet possible as ORF start) produce large ORFs. For
assured prediction of protein coding regions a FRAME analysis was performed using the
FramePlot 4.0 program.143 This program was developed on the basis of the FRAME program
in which the G+C distribution across codons is determined, and the corresponding open
reading frames are calculated with graphical representation.142 Frame shift errors can be
detected in the graph.
Materials and methods
107
Table 5.27: Asymmetric G+C distribution across codons in 64 Streptomyces genes
5.6 Protein biochemical methods
5.6.1 Preparation of crude cell-free extracts from Streptomyces liquid cultures
All steps were carried out at 4 °C or on ice to sustain active protein conformation.
Liquid cultures (5.4.2.2) were harvested after five day cultivation (5.4.7) by centrifugation at
11000 rpm for 20 minutes. For that purpose, the culture broth was transferred to 50 ml falcon
tubes. The resulting cell pellet was washed with chilled 0.1 M potassium phosphate buffer pH
7.5 (table 5.12) and centrifuged again. The supernatant was poured off, and the weight of the
pellet was determined. Potassium phosphate buffer served as a lysis buffer, and was therefore
added in a ratio of 1.5 ml per gram of cell pellet. To inhibit serine degrading enzymes the
protease inhibitor PMSF was required in 1 mM final concentration. Cell disruption was
performed by sonication with a micro tip (ultrasonic disintegrator Sonifier 250, Branson).
Disintegration was directly stopped after the acoustic sound pattern was changed from a high
pitched to a lower pitched frequency. At this stage the cells were lysed and thus proteins were
released into the buffer. After centrifugation at 11000 rpm for 20 minutes the supernatant was
used as a crude cell-free extract (CFE) for subsequent purification and analysis. The samples
were stored at –20 °C, and retained activity for the following 7 days.
5.6.2 Protein purification by means of fractionated ammonium sulfate
precipitation
All steps were carried out at 4 °C.
Ammonium sulfate exhibits high water solubility, even at low temperatures, and it has no
adverse effect on protein activity. At sufficiently high ionic strength, proteins can be
completely precipitated from the solution by hydrophobic interaction. This salting out
procedure is a native precipitation, and thus conserves biological activity of the protein.
The cell-free extracts (5.6.1) were subjected to saturation degrees between 10 and 90% of
ammonium sulfate. The cell-free extracts were carefully stirred in an ice water bath, while the
appropriate amount of grinded salt was slowly added to the protein solution in small
Position in triplet Average G+C content Position 1 70% Position 2 51% Position 3 92%

Materials and methods
108
portions.144 Ammonium sulfate was added only after previous portions had been completely
solved. An extensive foam formation was avoided. The protein solution was stirred for
another 30 minutes after the salt addition was completed. Sedimentation was then carried out
for 15 minutes at 11.000 rpm, and the pellet was resuspended in 3.5 ml of phosphate buffer.
The protein solutions from the different fractions were subjected to the desalting treatment
(5.6.3) and activity testing (5.6.6).
5.6.3 Removal of low molecular weight components from crude cell-free extracts
(desalting procedure)
All steps were carried out at 4 °C.
Compounds with low molecular weight are present in crude cell-free extracts. As their
precipitation can interfere with optical tests like UV-enzyme assays, these compounds were
eliminated through size exclusion chromatography. Compounds (M < 1000) such as salts
migrate through small matrix pores thus covering a longer distance through the column than
large size fragments passing through large pores.
A solid phase extraction column, PD-10 Amersham®, filled with 5 ml Sephadex® G-25, was
first conditioned with 25 ml potassium phosphate buffer. The enzyme solution was then added
to the column, and the flow-through was discarded. Elution of the proteins was carried out
with 3.5 ml of potassium phosphate buffer.
This desalting procedure was used after ammonium sulfate precipitation if necessary.
The column was flushed with 25 ml of 0.1 M sodium hydroxide for regeneration, as well as
washed with deionized water to pH 7.
5.6.4 Concentration of pre-purified proteins from column eluents
Amicon® Ultra-15 centrifugal filter units were used for the concentration of pre-purified
proteins from column eluents. The filtering membrane is made up of regenerated cellulose
(Ultracel). The molecular weight cut-off (= MWCO) lies at 10 kD, therefore compounds with
a molecular weight from 10 kD upwards are retained in the filtering cartridge.

Materials and methods
109
5.6.5 Colorimetric quantitative analysis based on Bradford’s method
The utilized Bradford-reagent contains the synthetic, amphoteric dye Coomassie® Brilliant
Blue G250, ethanol and phosphoric acid. The assay is based on an absorbance shift in the dye
when the previously red form of the Coomassie reagent changes into blue by the binding of
protein. In acidic medium the dye is present in its red, cationic form showing an absorbance
maximum of 465 nm. The amino acids of the proteins form a complex with the dye resulting
in a shift of the absorbance maximum to 595 nm. This is accompanied by a blue coloration.
The increase of the absorbance value at 595 nm correlates with protein quantity. Not all
amino acids take part in complex formation in the same manner, particularly basic and
aromatic amino acid residues are favoured. Therefore it is only possible to determine the total
protein concentration. Since the transient dye-protein complex formation is time-dependent, it
is important to measure all samples after the same reaction time.
The measurement in a spectral photometer at 595 nm took place five minutes after the
addition of 900 µl of Bradford’s reagent to 100 µl of sample solution. The sample solution
contained 10 µl of cell-free extract and 90 µl of purified water. The reference cuvette was
filled with water instead of the sample solution. A calibration curve was established for each
measurement series. Therefore Bovine Serum Albumin (BSA), which was used as a standard
protein was applied in concentrations between 1 and 40 µg per ml.
5.6.6 UV-spectroscopy
Photometric enzyme assay
Light absorption is often an important indicator for activity measurements of enzymes. Time-
referenced change in light absorption represents the velocity of the catalyzed reaction,
associated with the activity of the enzyme.
UV data were recorded on a two-beam spectral photometer (Uvikon 860, Kontron).
The intended purpose of this enzyme assay was to determine the oxidoreductase activity of
the heterologous expressed RifL protein from Amycolatopsis mediterranei by the use of
recombinant Streptomyces lividans strains.

Materials and methods
110
Determination of RifL oxidoreductase activity
The course of the reaction was followed by measuring the consumption of the coenzyme
nicotinamide adenine dinucleotide (NAD+) over a period of 20 minutes. NAD+ and its
reduced form NADH deviate in their absorption maxima. The emerging reduced form NADH
was monitored by the increase of absorption at a wavelength of 340 nm. The temperature of
the photometric chamber was adjusted to 37 °C.
Table 5.28 Assay composition
constituent amount final concentration sample reference UDP-Glucose 50 mM 120 µl - 6 mM NAD+ 50 mM 80 µl 80 µl 4 mM Glutamine 50 mM * 40 µl 40 µl 2 mM Magnesium chloride 1 M** 10 µl 10 µl 10 mM Pyridoxal phosphate 5 mM 2 µl 2 µl 0.01 mM Cell-free extract 100 µg 100 µg Potassium phosphate buffer 0.1 M; pH 7.5 **
ad 1000 µl
ad 1000 µl
Solutions were stored at –20 °C, except for * that was stored at 4-8 °C and ** at room temperature. The assay components (as listed in table 5.28) were combined in the sample cuvette except
for the substrate UDP-Glucose which was added later. At the same time the reference cuvette
was prepared with the assay components as listed above. For volume adjustment 120 µl of
additional buffer were filled in the reference mixture. Both solutions were stirred through
cautious pipetting. The reaction was started after pre incubation at 37 °C for 5 minutes by the
addition of UDP-glucose, and after 1 minute of stabilizing time the change in absorption at
340 nm was monitored.
A negative control reaction was set up in the same manner with the exception that the applied
cell-free extract was obtained from an unaltered Streptomyces lividans strain.
5.6.7 Protein separation via polyacrylamide gel electrophoresis (PAGE)
All buffers and solutions are referred to in table 5.13 .
SDS disrupts the secondary, tertiary and quaternary structure of the analysed proteins in order
to produce a linear polypeptide chain that is coated with negatively charged SDS molecules.
Mercaptoethanol assists the protein denaturation by reducing disulfide bonds. After a uniform

Materials and methods
111
charge had been applied to the proteins using the anionic detergent SDS, electrophoretic
mobility depends primarily on size. Each SDS molecule has one negative charge. Under these
conditions proteins migrate at a rate that reflects their molecular weight. In polyacrylamide
gels larger molecules are restrained from migrating as fast as smaller molecules. The gel has
the function of a molecular sieve.
The discontinuous gel system consisted of two types of matrix compositions that differed in
polyacrylamide concentration as well as in pH value. The resolving gel solution was poured
into the glass apparatus, and was covered by a layer of butanol in order to obtain a straight
edge of the matrix. The organic solvent also prevents the polyacrylamide from oxygenation,
and thus it speeds up the polymerisation that was completed after one hour at room
temperature. The upper organic layer was discarded and the stacking gel solution was added.
The sample-well forming comb was placed in the stacking gel phase and allowed to dry for 30
minutes. Application of a stacking gel is useful to obtain a high resolution due to
isotachophoresis.
The protein samples were mixed with 0.2 parts per volume of the denaturing loading buffer
and were then heated to 100 °C for 10 minutes. Due to the annealing of the SDS molecules to
the protein surface, the derived poly anions mediate the migration through the polyacrylamide
porous matrix when an electrical field is applied. After cooling on ice 20 µl of the sample
solution were filled in the gel slot. The low molecular weight marker was solved in 100 µl of
loading buffer, and was treated in the same manner as the sample solution. 5 µl of the marker
were applied to the matrix in order to estimate the size of the sample proteins. Gels were
developed until the sample reached the lower border of the matrix. This was indicated by the
tracking dye Bromophenol Blue included in the loading buffer. Migration through the
stacking gel takes place at a currency of 20 mA, whereas the resolving gel is passed through
at 60 mA. For staining of the separated proteins, the resolving gel was gently mixed in
Coomassie solution for at least one hour. The stacking gel was discarded. Visualization of the
protein bands was possible after shaking in colour stripping solution over night, and thus
removing unspecific staining of the gel matrix.
Materials and methods
112
5.7 Analytical methods
5.7.1 Thin layer chromatography (TLC)
Thin layer chromatography was used to detect the amino sugar kanosamine. Aluminium
sheets coated with silica gel 60 F254 were applied as the stationary phase. Chromatograms
were developed with acetonitrile, ethyl acetate, water and glacial acetic acid in a ratio of
5:5:3:1 at room temperature.145 Visualisation was accomplished using ninhydrine spraying
reagent (1 g ninhydrine, 50 ml ethanol 96%, 10 ml glacial acetic acid) followed by heating at
100 °C for 5 minutes. Kanosamine caused red-coloured spots on a white plate. Alternatively
an orcinol spraying reagent (0.2% orcinol, 20% sulfuric acid) was used indicating gray-blue
spots of the amino sugar.
For optimization of chromatography conditions, other eluents such as propanol or pyridine
were tested instead of acetonitrile. Every mobile phase mixture was also applied to cellulose-
covered TLC sheets.
For the detection of 2-oxoglutaramate on silica gel plates the mobile phase consisted of
methanol, chloroform and liquid ammonia (20%) in a ratio of 2:2:1.146 The detection was also
carried out using ninhydrine spraying reagent.
5.7.2 High performance liquid chromatography (HPLC)
HPLC was performed on a Dionex system consisting of a GP-40 pump and an ED-40
electrochemical detector. The anion exchange column Carbopac® PA-10 was used with an
adequate pre column, and 18 mM sodium hydroxide represented the mobile phase. The
resulting data were processed with Dionex PeakNet ® software. The high-pH anion-exchange
(HPAE) chromatography coupled with pulsed amperometric detection (PAD) was described
by Hardy and Townsend147 and complemented by Dionex Technical Note 21148 for the
application presented here.
5.7.3 Fast Protein Liquid Chromatography (FPLC)
This method was used on the basis of a protein purification strategy described by Amersham
Biosciences (2000, application note 18-1142-32 AA). Fast Protein Liquid Chromatography
was carried out using the medium pressure system Äkta® FPLC for the purification of protein
solutions. The chromatography column was filled with 20 ml of the anion exchange matrix

Materials and methods
113
DEAE- Sepharose® FF. The chloride anion from the Tris-HCl-buffer solution represents the
counter ion. The previously fractionated (5.6.2) and desalted (5.6.3) cell-free extracts were
applied to the column, and separation was carried out according to the protocol given below
(table 5.29). Buffer composition is listed in table 5.12. Fractions of 10 ml were collected by
means of a fraction collector. Amicon® ultracentrifugation tubes were used to concentrate the
protein fractions up to a volume of 1 ml each (5.6.4).
Quantitative analysis was conducted (5.6.5), and the purified protein fractions were applied to
the enzyme assay (5.6.6).
Table 5.29 Purification protocol , DEAE- Sepharose® FF Chromatography steps Buffer A Buffer B Volume (ml) 1. Equilibration 100% 0% 40 2. Sample application 3. Wash step 1 100% 0% 80 4. Gradient elution 100-50%
50% 0-50% 50%
400 20
5. Wash step 2 0% 100% 40
5.7.4 Mass spectroscopy
5.7.4.1 LC-MS analysis
HPLC-MS measurements were performed using an Agilent 1100 Series HPLC with an diode
array detector (DAD). Sample separation was accomplished by means of a Nucleodur 100
column (RP18, Macherey-Nagel) and gradient elution (from MeOH/H2O 10/90 to
MeOH/H2O 100/0 in 20 minutes, MeOH 100% for 10 minutes, with added NH4OAc, 2 mM
as external standard). This system was coupled to an API 2000, Triple Quadrupole, MS/MS,
Applied Biosystems/MDS Sciex with electro spray ionisation (ESI).
5.7.4.2 GC-MS analysis
GC-MS analysis was kindly carried out by Dr. Marc Lamshöft (INFU, Dortmund) on a
Surveyor MSQ (Thermo Finnigan).

Materials and methods
114
5.7.4.3 MALDI-TOF-MS analysis
MALDI-TOF-MS (Matrix assisted laser desorption ionisation time of flight mass
spectrometry) can be used for molecular weight determination of large sized molecules like
proteins. This application was described by Karas and Hillenkamp.149 Fragmentation of the
analyte was avoided by embedding in the organic matrix sinapic acid. Measurements were
performed on a Voyager-DE STR 4337 (Applied Biosystems), which used an acceleration
voltage of 25 kV. The recorded spectrum was set between 2000 and 100 000 Dalton.
This procedure was applied to cell-free extracts in order to detect the enzymes RifK, RifL and
RifM. Sample preparation was therefore accomplished using an Amprep octadecyl mini
column. That cartridge was first wetted with 5 ml isopropyl alcohol and then equilibrated with
5 ml of buffer A. The sample was diluted with 500 µl of buffer A before it was filled in the
column. Elution of the proteins took place using a 5 ml mixture of buffer A and buffer B
(1:1). Regeneration of the Amprep matrix was possible with 5 ml of a mixture of buffer A and
B in a ratio of 1:9.
5.7.5 1 H-NMR experiments
NMR spectra in biosynthetic studies were measured by Dr. Gerald Dräger (Institut für
Organische Chemie, Hannover) on a Bruker DPX 500.
NMR experiments for the verification of 2-oxoglutaramate were recorded on a Bruker Avance
300 DPX (Institut für Pharmazeutische Biologie, Bonn).
5.8 Synthesis of 2-oxoglutaramate
The substance 2-oxoglutaramate was employed as a nitrogen acceptor in an enzyme assay
(5.6.6), and could not be purchased. Therefore it was synthesized according to the method
described by Nissim et al.150 The synthesis is based on the conversion of the L-amino acid L-
glutamine by the L-amino acid oxidase from the eastern diamond rattle snake Crotalus
adamanteus. The reaction took place for 10 h at 37 °C in 20 mM Tris-HCl buffer pH 8. As a
side effect, the amino acid oxidase irreversibly transferred hydrogen to oxygen yielding
hydrogen peroxide. Added catalase prevented the accumulation of hydrogen peroxide through
its rapid degradation. The enzymes were removed from the solution using an Amicon® Ultra-
15 centrifugal filter device (5.6.4), and the flow-through was applied to a PD-10 column
(5.6.3) for buffer exchange.

Materials and methods
115
The cyclization from 2-oxoglutaramate to 5-hydroxypyroglutamate occurs spontaneously in
aqueous solutions. The formation of 5-hydroxypyroglutamate was verified via LC-MS
analysis (5.7.4.1) and 1H- NMR experiments (5.7.5).

Appendix
116
6 Appendix
6.1 FPLC (DEAE-Sepharose®) of a cell-free extract from Streptomyces
lividans pHGF7604 that was precipitated using 60% ammonium sulfate
prior to FPLC.
RifL assay runs 1-6 the following FPLC fractions were pooled:
1) tested protein solution consisted of fraction 14 and 15 2) tested protein solution consisted of fraction 16 and 17 3) tested protein solution consisted of fraction 19 and 20 4) tested protein solution consisted of fraction 21-24 5) tested protein solution consisted of fraction 27-29 6) tested protein solution consisted of fraction 31-33
RifL activity was only detected in assay run 2) comprising protein fractions 16 and 17.
DEAE02:1COPY_UV DEAE02:1COPY_Fractions DEAE02:1COPY_Inject
0.0
10.0
20.0
30.0
40.0
50.0
60.0
70.0
mAU
0 50 100 150 200 250 300 350 400 ml1 2 3 4 5 6 7 8 9 10 11 12 13 14 15 16 17 18 19 20 21 22 23 24 25 26 27 28 29 30 31 32 33 34 35 Waste

Appendix
117
6.2 Total ion current (TIC) of a GC-MS run using kanosamine reference RT: 0,00 - 58,47
0 5 10 15 20 25 30 35 40 45 50 55Time (min)
0
5
10
15
20
25
30
35
40
45
50
55
60
65
70
75
80
85
90
95
100R
ela
tive
Abu
ndan
ce28,55
33,1228,3541,0720,82
45,5249,5413,53
28,04
6,95
14,706,25 11,7350,5937,6925,67
NL:9,82E7TIC F: MS KANOSAMINE2
6.3 Mass spectrum of a GC-MS run (see 6.2, TIC) using kanosamine
reference- displayed retention time between 28,54 and 28,59 min
KANOSAMINE2 #1352-1355 RT: 28,54-28,59 AV: 4 SB: 6 28,40-28,49 NL: 1,63E4T: {0;0} + c EI det=500,00 Full ms [ 39,00-782,00]
440 460 480 500 520 540 560 580 600 620 640 660 680m/z
0
5
10
15
20
25
30
35
40
45
50
55
60
65
70
75
80
85
90
95
100
Rel
ativ
e A
bund
ance
553,3565
521,2979
554,3669
463,2614
431,2273522,3043 555,3735
432,2448
523,3227464,2703448,2694
510,3005465,2871 556,3530537,3409
466,3472 568,4014494,2766571,4375 601,6327 654,0885627,2867 677,0764


Selbständigkeitserklärung
120
8 Selbständigkeitserklärung Hiermit versichere ich, dass ich die vorliegende Dissertation selbständig und ausschließlich
mit Hilfe der angegebenen Quellen und Hilfsmittel angefertigt habe. Die Arbeit wurde bisher
weder in Teilen noch im Ganzen als Prüfungsleistung zur Begutachtung an einer Hochschule
vorgelegt. Die Promotionsordnung der Mathematisch-Naturwissenschaftlichen Fakultät der
Rheinischen Friedrich-Wilhelms-Universität Bonn ist mir bekannt.
Silke Engels
Bonn, den 20.07.2009
References
121
9 References
1. Newman, D.J. & Cragg, G.M. Natural products as sources of new drugs over the last 25 years. J Nat Prod 70, 461-477 (2007).
2. Hertweck, C., Luzhetskyy, A., Rebets, Y. & Bechthold, A. Type II polyketide synthases: gaining a deeper insight into enzymatic teamwork. Nat Prod Rep 24, 162-190 (2007).
3. Hartmann, T. From waste products to ecochemicals: Fifty years research of plant secondary metabolism Phytochemistry 68, 2831-2846 (2007).
4. Kellner, R.L.L. & Dettner, K. Allocation of pederin during lifetime of Paederus rove beetles (Coleoptera: Staphylinidae): Evidence for polymorphism of hemolymph toxin. J Chem Ecol 21, 1719-1733 (1995).
5. Kieser, T.B., M.J.; Buttner, M.J.; Chater, K.F.; Hopwood, D.A. Practical Streptomyces Genetics. (Norwich, England; 2000).
6. Moran, M.A., Rutherford, L.T. & Hodson, R.E. Evidence for indigenous Streptomyces populations in a marine environment determined with a 16S ribosomal RNA probe. Appl Environ Microbiol 61, 3695-3700 (1995).
7. Watson, E.T. & Williams, S.T. Studies on ecology of Actinomycetes in soil .7. Actinomycetes in a coastal sand belt. Soil Biology & Biochemistry 6, 43-52 (1974).
8. Morita, R.Y. Starvation and miniaturisation of heterotrophs, with special reference on the maintenance of the starved viable state. Bacteria in Natural Environments: The Effect of Nutrient Conditions (1985).
9. Weber, T., Welzel, K., Pelzer, S., Vente, A. & Wohlleben, W. Exploiting the genetic potential of polyketide producing streptomycetes. J Biotechnol 106, 221-232 (2003).
10. Hopwood, D.A., Chater, K.F. & Bibb, M.J. Genetics of antibiotic production in Streptomyces coelicolor A3(2), a model streptomycete. Biotechnology 28, 65-102 (1995).
11. Hopwood, D.A. Forty years of genetics with Streptomyces: from in vivo through in vitro to in silico. Microbiology 145 ( Pt 9), 2183-2202 (1999).
12. Lang, G. et al. Evolving trends in the dereplication of natural product extracts: new methodology for rapid, small-scale investigation of natural product extracts. J Nat Prod 71, 1595-1599 (2008).
13. Chopra, I., Hawkey, P.M. & Hinton, M. Tetracyclines, molecular and clinical aspects. J Antimicrob Chemother 29, 245-277 (1992).
14. Schnappinger, D. & Hillen, W. Tetracyclines: antibiotic action, uptake, and resistance mechanisms. Arch Microbiol 165, 359-369 (1996).
References
122
15. Dziegielewska, B., Beerman, T.A. & Bianco, P.R. Inhibition of RecBCD enzyme by antineoplastic DNA alkylating agents. J Mol Biol 361, 898-919 (2006).
16. Ashley, N. & Poulton, J. Mitochondrial DNA is a direct target of anti-cancer anthracycline drugs. Biochem Biophys Res Commun 378, 450-455 (2009).
17. Khosla, C., Gokhale, R.S., Jacobsen, J.R. & Cane, D.E. Tolerance and specificity of polyketide synthases. Annu Rev Biochem 68, 219-253 (1999).
18. Shen, B. Polyketide biosynthesis beyond the type I, II and III polyketide synthase paradigms. Curr Opin Chem Biol 7, 285-295 (2003).
19. Gaisser, S., Trefzer, A., Stockert, S., Kirschning, A. & Bechthold, A. Cloning of an avilamycin biosynthetic gene cluster from Streptomyces viridochromogenes Tu57. J Bacteriol 179, 6271-6278 (1997).
20. Wilkinson, B. et al. Novel octaketide macrolides related to 6-deoxyerythronolide B provide evidence for iterative operation of the erythromycin polyketide synthase. Chem Biol 7, 111-117 (2000).
21. Olano, C. et al. Evidence from engineered gene fusions for the repeated use of a module in a modular polyketide synthase. Chem Commun (Camb), 2780-2782 (2003).
22. Traitcheva, N., Jenke-Kodama, H., He, J., Dittmann, E. & Hertweck, C. Non-colinear polyketide biosynthesis in the aureothin and neoaureothin pathways: an evolutionary perspective. Chembiochem 8, 1841-1849 (2007).
23. Piel, J. A polyketide synthase-peptide synthetase gene cluster from an uncultured bacterial symbiont of Paederus beetles. Proc Natl Acad Sci U S A 99, 14002-14007 (2002).
24. Cheng, Y.Q., Tang, G.L. & Shen, B. Type I polyketide synthase requiring a discrete acyltransferase for polyketide biosynthesis. Proc Natl Acad Sci U S A 100, 3149-3154 (2003).
25. Nguyen, T. et al. Exploiting the mosaic structure of trans-acyltransferase polyketide synthases for natural product discovery and pathway dissection. Nat Biotechnol 26, 225-233 (2008).
26. Kwon, H.J., Smith, W.C., Xiang, L. & Shen, B. Cloning and heterologous expression of the macrotetrolide biosynthetic gene cluster revealed a novel polyketide synthase that lacks an acyl carrier protein. J Am Chem Soc 123, 3385-3386 (2001).
27. Moore, B.S. et al. Plant-like biosynthetic pathways in bacteria: from benzoic acid to chalcone. J Nat Prod 65, 1956-1962 (2002).
28. Müller, R. Don't classify polyketide synthases. Chem Biol 11 (2004).
29. Wenzel, S.C., Bode, H.B., Kochems, I. & Muller, R. A type I/type III polyketide synthase hybrid biosynthetic pathway for the structurally unique ansa compound kendomycin. Chembiochem 9, 2711-2721 (2008).

References
123
30. Fischbach, M.A. & Walsh, C.T. Assembly-line enzymology for polyketide and nonribosomal Peptide antibiotics: logic, machinery, and mechanisms. Chem Rev 106, 3468-3496 (2006).
31. Hopwood, D.A. Cracking the polyketide code. PLoS Biol 2, E35 (2004).
32. McDaniel, R., Ebert-Khosla, S., Hopwood, D.A. & Khosla, C. Rational design of aromatic polyketide natural products by recombinant assembly of enzymatic subunits. Nature 375, 549-554 (1995).
33. Tang, Y., Tsai, S.C. & Khosla, C. Polyketide chain length control by chain length factor. J Am Chem Soc 125, 12708-12709 (2003).
34. Keatinge-Clay, A.T., Maltby, D.A., Medzihradszky, K.F., Khosla, C. & Stroud, R.M. An antibiotic factory caught in action. Nat Struct Mol Biol 11, 888-893 (2004).
35. Donadio, S., Staver, M.J., Mcalpine, J.B., Swanson, S.J. & Katz, L. Modular organization of genes required for complex polyketide biosynthesis. Science 252, 675-679 (1991).
36. Bevitt, D.J., Cortes, J., Haydock, S.F. & Leadlay, P.F. 6-Deoxyerythronolide-B synthase-2 from Saccharopolyspora erythraea - cloning of the structural gene, sequence-analysis and inferred domain-structure of the multifunctional enzyme. Eur J Biochem 204, 39-49 (1992).
37. Bisang, C. et al. A chain initiation factor common to both modular and aromatic polyketide synthases. Nature 401, 502-505 (1999).
38. Hutchinson, C.R. Microbial polyketide synthases: more and more prolific. Proc Natl Acad Sci U S A 96, 3336-3338 (1999).
39. Hopwood, D.A. Genetic Contributions to Understanding Polyketide Synthases. Chem Rev 97, 2465-2498 (1997).
40. Schröder, J. Comprehensive Natural Products Chemistry. (Elsevier, Oxford; 1999).
41. Jang, M. et al. Cancer chemopreventive activity of resveratrol, a natural product derived from grapes. Science 275, 218-220 (1997).
42. Abe, I. Engineering of plant polyketide biosynthesis. Chem Pharm Bull (Tokyo) 56, 1505-1514 (2008).
43. Austin, M.B. & Noel, J.P. The chalcone synthase superfamily of type III polyketide synthases. Nat Prod Rep 20, 79-110 (2003).
44. Abe, I., Oguro, S., Utsumi, Y., Sano, Y. & Noguchi, H. Engineered biosynthesis of plant polyketides: chain length control in an octaketide-producing plant type III polyketide synthase. J Am Chem Soc 127, 12709-12716 (2005).
45. Abe, I. et al. A plant type III polyketide synthase that produces pentaketide chromone. J Am Chem Soc 127, 1362-1363 (2005).
References
124
46. Chen, H., Tseng, C.C., Hubbard, B.K. & Walsh, C.T. Glycopeptide antibiotic biosynthesis: enzymatic assembly of the dedicated amino acid monomer (S)-3,5-dihydroxyphenylglycine. Proc Natl Acad Sci U S A 98, 14901-14906 (2001).
47. Weymouth Wilson, A. The role of carbohydrates in biologically active natural products. Nat Prod Rep 14, 99-110 (1997).
48. Mendez, C. & Salas, J.A. On the generation of novel anticancer drugs by recombinant DNA technology: the use of combinatorial biosynthesis to produce novel drugs. Comb Chem High Throughput Screen 6, 513-526 (2003).
49. Trefzer, A. et al. Rationally designed glycosylated premithramycins: hybrid aromatic polyketides using genes from three different biosynthetic pathways. J Am Chem Soc 124, 6056-6062 (2002).
50. Dürr, C. et al. The glycosyltransferase UrdGT2 catalyzes both C- and O-glycosidic sugar transfers. Angew Chem Int Ed Engl 43, 2962-2965 (2004).
51. Staunton, J. & Weissman, K.J. Polyketide biosynthesis: a millennium review. Nat Prod Rep 18, 380-416 (2001).
52. Hopwood, D.A. et al. Production of 'hybrid' antibiotics by genetic engineering. Nature 314, 642-644 (1985).
53. Thibodeaux, C.J., Melancon, C.E., 3rd & Liu, H.W. Natural-product sugar biosynthesis and enzymatic glycodiversification. Angew Chem Int Ed Engl 47, 9814-9859 (2008).
54. Solenberg, P.J. et al. Production of hybrid glycopeptide antibiotics in vitro and in Streptomyces toyocaensis. Chem Biol 4, 195-202 (1997).
55. Wohlert, S.E. et al. Novel Hybrid Tetracenomycins through Combinatorial Biosynthesis Using a Glycosyltransferase Encoded by the elm Genes in Cosmid 16F4 and Which Shows a Broad Sugar Substrate Specificity. J Am Chem Soc 120, 10596-10601 (1998).
56. Sensi, P., Margalith, P. & Timbal, M.T. Rifomycin, a new antibiotic; preliminary report. Farmaco [Sci] 14, 146-147 (1959).
57. Sensi, P., Greco, A.M. & Ballotta, R. Rifomycin. I. Isolation and properties of rifomycin B and rifomycin complex. Antibiot Annu 7, 262-270 (1959).
58. McClure, W.R. & Cech, C.L. On the mechanism of rifampicin inhibition of RNA synthesis. J Biol Chem 253, 8949-8956 (1978).
59. Prelog, V. & Oppolzer, W. Ansamycins, a novel class of microbial metabolites. Helv Chim Acta 56, 1179-1187 (1973).
60. Kibby, J.J. & Rickards, R.W. The identification of 3-amino-5-hydroxybenzoic acid as a new natural aromatic amino acid. J Antibiot (Tokyo) 34, 605-607 (1981).

References
125
61. Ghisalba, O. & Nuesch, J. A genetic approach to the biosynthesis of the rifamycin-chromophore in Nocardia mediterranei. IV. Identification of 3-amino-5-hydroxybenzoic acid as a direct precursor of the seven-carbon amino starter-unit. J Antibiot (Tokyo) 34, 64-71 (1981).
62. August, P.R. et al. Biosynthesis of the ansamycin antibiotic rifamycin: deductions from the molecular analysis of the rif biosynthetic gene cluster of Amycolatopsis mediterranei S699. Chem Biol 5, 69-79 (1998).
63. Guo, J. & Frost, J.W. Kanosamine biosynthesis: a likely source of the aminoshikimate pathway's nitrogen atom. J Am Chem Soc 124, 10642-10643 (2002).
64. Guo, J. & Frost, J.W. Synthesis of aminoshikimic acid. Org Lett 6, 1585-1588 (2004).
65. Kim, C.G., Yu, T.W., Fryhle, C.B., Handa, S. & Floss, H.G. 3-Amino-5-hydroxybenzoic acid synthase, the terminal enzyme in the formation of the precursor of mC7N units in rifamycin and related antibiotics. J Biol Chem 273, 6030-6040 (1998).
66. Yu, T.W. et al. Mutational analysis and reconstituted expression of the biosynthetic genes involved in the formation of 3-amino-5-hydroxybenzoic acid, the starter unit of rifamycin biosynthesis in Amycolatopsis mediterranei S699. J Biol Chem 276, 12546-12555 (2001).
67. Yu, T.W. et al. The biosynthetic gene cluster of the maytansinoid antitumor agent ansamitocin from Actinosynnema pretiosum. Proc Natl Acad Sci U S A 99, 7968-7973 (2002).
68. Umezawa, S., Shibahara, S., Omoto, S., Takeuchi, T. & Umezawa, H. Studies on the biosynthesis of 3-amino-3-deoxy-D-glucose. J Antibiot (Tokyo) 21, 485-491 (1968).
69. Umezawa, S., Umino, K., Shibahara, S. & Omoto, S. Studies of aminosugars. XVII. Production of 3-amino-3-deoxy-D-glucose by Bacillus species. Bull Chem Soc Jpn 40, 2419-2421 (1967).
70. Arakawa, K., Müller, R., Mahmud, T., Yu, T.W. & Floss, H.G. Characterization of the early stage aminoshikimate pathway in the formation of 3-amino-5-hydroxybenzoic acid: the RifN protein specifically converts kanosamine into kanosamine 6-phosphate. J Am Chem Soc 124, 10644-10645 (2002).
71. Kevany, B.M., Rasko, D.A. & Thomas, M.G. Characterization of the complete zwittermicin A biosynthesis gene cluster from Bacillus cereus. Appl Environ Microbiol 75, 1144-1155 (2009).
72. Boettcher, T. (Dissertation: Kitasatospora putterlickiae F18-98, ein neu isolierter Bakterienstamm aus der Rhizosphäre von Putterlickia verrucosa. Molekularbiologische und biochemische Untersuchungen zur Aminohydroxybenzoesäure-Biosynthese, Rheinische-Friedrich-Wilhelms-Universität, Bonn; 2003).
References
126
73. Lackner, G. et al. Biosynthesis of pentangular polyphenols: deductions from the benastatin and griseorhodin pathways. J Am Chem Soc 129, 9306-9312 (2007).
74. Martin, R. et al. Collinone, a new recombinant angular polyketide antibiotic made by an engineered Streptomyces strain. J Antibiot (Tokyo) 54, 239-249 (2001).
75. Ueno, T. et al. Inhibition of human telomerase by rubromycins: implication of spiroketal system of the compounds as an active moiety. Biochemistry 39, 5995-6002 (2000).
76. Yunt, Z. et al. Cleavage of four carbon-carbon bonds during biosynthesis of the griseorhodin a spiroketal pharmacophore. J Am Chem Soc 131, 2297-2305 (2009).
77. Canedo LM, G.D., Romero F, Espliego F, Perez-Bas J, Vol. US 6 812 245 B2USA; 2004).
78. Lopez, P. et al. Lysolipin biosynthesis in Streptomyces tendae TÜ4042: cloning, analysis and heterologous expression of the gene cluster. Accession number AM492533. (GenBank, 2007).
79. Omura, S. et al. Cervinomycin A1 and A2, new antibiotics active against anaerobes, produced by Streptomyces cervinus sp. nov. J Antibiot (Tokyo) 35, 645-652 (1982).
80. Maiese, W.M. et al. LL-E19085 alpha, a novel antibiotic from Micromonospora citrea: taxonomy, fermentation and biological activity. J Antibiot (Tokyo) 42, 846-851 (1989).
81. Malet-Cascon, L., Romero, F., Espliego-Vazquez, F., Gravalos, D. & Fernandez-Puentes, J.L. IB-00208, a new cytotoxic polycyclic xanthone produced by a marine-derived Actinomadura. I. Isolation of the strain, taxonomy and biological activites. J Antibiot (Tokyo) 56, 219-225 (2003).
82. Laatsch, H. (Personal communication, University of Göttingen; 2006).
83. Li, A. & Piel, J. A gene cluster from a marine Streptomyces encoding the biosynthesis of the aromatic spiroketal polyketide Griseorhodin A. Chem Biol 9, 1017-1026 (2002).
84. Chater, K.F. & Bruton, C.J. Resistance, regulatory and production genes for the antibiotic methylenomycin are clustered. Embo J 4, 1893-1897 (1985).
85. Kaulard, S. (Dissertation: Untersuchungen zum Vorkommen von Maytansinoiden in Celastraceen und zur Biosynthese von Ansamycinen in Kitasatospora putterlickiae F18-98, Rheinische-Friedrich-Wilhelms-Universität, Bonn; 2007).
86. Eads, J.C., Beeby, M., Scapin, G., Yu, T.W. & Floss, H.G. Crystal structure of 3-amino-5-hydroxybenzoic acid (AHBA) synthase. Biochemistry 38, 9840-9849 (1999).
87. Ahlert, J., Distler, J., Mansouri, K. & Piepersberg, W. Identification of stsC, the gene encoding the L-glutamine:scyllo-inosose aminotransferase from streptomycin-producing Streptomycetes. Arch Microbiol 168, 102-113 (1997).
References
127
88. Schäferjohann, J., Yoo, J.G., Kusian, B. & Bowien, B. The cbb operons of the facultative chemoautotroph Alcaligenes eutrophus encode phosphoglycolate phosphatase. J Bacteriol 175, 7329-7340 (1993).
89. Lee, J.J. Annual Meeting and International Symposium of the Korean Society for Microbiology and Biotechnology (KMB)-Bioactive Compounds for Human Well-Being: Characterisation of geldanamycin biosynthetic genes from Streptomyces hygroscopicus. (2005).
90. Ferrier, B. An enzymatic cycling method for 3-acetylpyridine adenine dinucleotide to increase the sensitivity of enzymatic methods which employ this NAD+ analog. Anal Biochem 186, 229-232 (1990).
91. Watanabe, K., Rude, M.A., Walsh, C.T. & Khosla, C. Engineered biosynthesis of an ansamycin polyketide precursor in E. coli. Proc Natl Acad Sci U S A 100, 9774-9778 (2003).
92. Kirschbaum, J., Luckas, B. & Beinert, W.D. HPLC analysis of biogenic-amines and amino-acids in food - after automatic precolumn derivatization with 9-Fluorenylmethyl chloroformate. Am Lab 26, C28-& (1994).
93. Hanko, V.P. et al. Identification of tobramycin impurities for quality control process monitoring using high-performance anion-exchange chromatography with integrated pulsed amperometric detection. J Pharm Biomed Anal 47, 828-833 (2008).
94. Oguiza, J.A., Marcos, A.T., Malumbres, M. & Martin, J.F. The galE gene encoding the UDP-galactose 4-epimerase of Brevibacterium lactofermentum is coupled transcriptionally to the dmdR gene. Gene 177, 103-107 (1996).
95. Poolman, B., Royer, T.J., Mainzer, S.E. & Schmidt, B.F. Carbohydrate utilization in Streptococcus thermophilus: characterization of the genes for aldose 1-epimerase (mutarotase) and UDPglucose 4-epimerase. J Bacteriol 172, 4037-4047 (1990).
96. Adams, C.W., Fornwald, J.A., Schmidt, F.J., Rosenberg, M. & Brawner, M.E. Gene organization and structure of the Streptomyces lividans gal operon. J Bacteriol 170, 203-212 (1988).
97. Flentke, G.R. & Frey, P.A. Reaction of uridine diphosphate galactose 4-epimerase with a suicide inactivator. Biochemistry 29, 2430-2436 (1990).
98. Chen, S. et al. Biosynthesis of ansatrienin (mycotrienin) and naphthomycin. Identification and analysis of two separate biosynthetic gene clusters in Streptomyces collinus Tu 1892. Eur J Biochem 261, 98-107 (1999).
99. Easterby, J.S. A generalized theory of the transition time for sequential enzyme reactions. Biochem J 199, 155-161 (1981).
100. Rudolph, J. & Stubbe, J. Investigation of the mechanism of phosphoribosylamine transfer from glutamine phosphoribosylpyrophosphate amidotransferase to glycinamide ribonucleotide synthetase. Biochemistry 34, 2241-2250 (1995).

References
128
101. Lucher, L.A., Chen, Y.M. & Walker, J.B. Reactions catalyzed by purified L-glutamine: keto-scyllo-inositol aminotransferase, an enzyme required for biosynthesis of aminocyclitol antibiotics. Antimicrob Agents Chemother 33, 452-459 (1989).
102. Malpartida, F. et al. Homology between Streptomyces genes coding for synthesis of different polyketides used to clone antibiotic biosynthetic genes. Nature 325, 818-821 (1987).
103. Ikeda, H. et al. Complete genome sequence and comparative analysis of the industrial microorganism Streptomyces avermitilis. Nat Biotechnol 21, 526-531 (2003).
104. Kim, B.S., Kim, B.C., Lee, J.M. Pradimicin biosynthetic gene cluster. Accession number EF151801. (GenBank 2006).
105. Kim, B.C., Lee, J.M., Ahn, J.S. & Kim, B.S. Cloning, sequencing, and characterization of the pradimicin biosynthetic gene cluster of Actinomadura hibisca P157-2. J Microbiol Biotechnol 17, 830-839 (2007).
106. Oliynyk, M. et al. Complete genome sequence of the erythromycin-producing bacterium Saccharopolyspora erythraea NRRL23338. Nat Biotechnol 25, 447-453 (2007).
107. Stinear, T.P. et al. Reductive evolution and niche adaptation inferred from the genome of Mycobacterium ulcerans, the causative agent of Buruli ulcer. Genome Res 17, 192-200 (2007).
108. Bentley, S.D. et al. Complete genome sequence of the model actinomycete Streptomyces coelicolor A3(2). Nature 417, 141-147 (2002).
109. Mongodin, E.F. et al. Secrets of soil survival revealed by the genome sequence of Arthrobacter aurescens TC1. PLoS Genet 2, e214 (2006).
110. Giraud, E. [Rhizobium/legume symbiose: a new sesame]. Med Sci (Paris) 23, 663-664 (2007).
111. Goldman, B.S. et al. Evolution of sensory complexity recorded in a myxobacterial genome. Proc Natl Acad Sci U S A 103, 15200-15205 (2006).
112. Normand, P. et al. Genome characteristics of facultatively symbiotic Frankia sp. strains reflect host range and host plant biogeography. Genome Res 17, 7-15 (2007).
113. Nierman, W.C. Stigmatella aurantiaca DW4/3-1. Accession number AAMD01000051. (GenBank, 2006).
114. Tennstedt, T., Szczepanowski, R., Krahn, I., Puhler, A. & Schluter, A. Sequence of the 68,869 bp IncP-1alpha plasmid pTB11 from a waste-water treatment plant reveals a highly conserved backbone, a Tn402-like integron and other transposable elements. Plasmid 53, 218-238 (2005).
References
129
115. Magalhaes, M.L. & Blanchard, J.S. The kinetic mechanism of AAC3-IV aminoglycoside acetyltransferase from Escherichia coli. Biochemistry 44, 16275-16283 (2005).
116. Buell, C.R., Wing, R.A., McCombie, W.A. & Ouyang, S. Oryza sativa subsp. japonica. Accession number DP000011. (GenBank, 2005).
117. Omura, S. et al. Genome sequence of an industrial microorganism Streptomyces avermitilis: deducing the ability of producing secondary metabolites. Proc Natl Acad Sci U S A 98, 12215-12220 (2001).
118. Copeland, A. et al. Complete sequence of chromosome of Mycobacterium sp. KMS. Accession number CP000518. (GenBank, 2006).
119. Copeland, A. et al. Salinispora arenicola (strain CNS-205). Accession number CP000850. (GenBank, 2007).
120. Feng, Q. et al. Sequence and analysis of rice chromosome 4. Nature 420, 316-320 (2002).
121. Wendt-Pienkowski, E. et al. Cloning, sequencing, analysis, and heterologous expression of the fredericamycin biosynthetic gene cluster from Streptomyces griseus. J Am Chem Soc 127, 16442-16452 (2005).
122. Saito, H., Bruenker, P., Martin, R., Minas, W. Streptomyces collinus DSM2012 rubromycin biosynthesis gene cluster. Accession number AF293355. (GenBank, 2005).
123. Fleischmann, R.D. et al. Mycobacterium smegmatis str. MC2 155, complete genome. Accession number CP000480. (2006).
124. MacNeil, D.J. et al. Analysis of Streptomyces avermitilis genes required for avermectin biosynthesis utilizing a novel integration vector. Gene 111, 61-68 (1992).
125. Bierman, M. et al. Plasmid cloning vectors for the conjugal transfer of DNA from Escherichia coli to Streptomyces spp. Gene 116, 43-49 (1992).
126. Bode, H.B., Bethe, B., Hofs, R. & Zeeck, A. Big effects from small changes: possible ways to explore nature's chemical diversity. Chembiochem 3, 619-627 (2002).
127. Xu, Z., Jakobi, K., Welzel, K. & Hertweck, C. Biosynthesis of the antitumor agent chartreusin involves the oxidative rearrangement of an anthracyclic polyketide. Chem Biol 12, 579-588 (2005).
128. Schell, U. et al. Engineered biosynthesis of hybrid macrolide polyketides containing D-angolosamine and D-mycaminose moieties. Org Biomol Chem 6, 3315-3327 (2008).
129. Mendez, C. & Salas, J.A. Altering the glycosylation pattern of bioactive compounds. Trends Biotechnol 19, 449-456 (2001).
References
130
130. Thibodeaux, C.J., Melancon, C.E. & Liu, H.W. Unusual sugar biosynthesis and natural product glycodiversification. Nature 446, 1008-1016 (2007).
131. Blanchard, S. & Thorson, J.S. Enzymatic tools for engineering natural product glycosylation. Curr Opin Chem Biol 10, 263-271 (2006).
132. Waksman, S.A. & Henrici, A.T. The nomenclature and classification of the Actinomycetes. J Bacteriol 46, 337-341 (1943).
133. Flett, F., Mersinias, V. & Smith, C.P. High efficiency intergeneric conjugal transfer of plasmid DNA from E. coli to methyl DNA-restricting streptomycetes. FEMS Microbiol Lett 155, 223-229 (1997).
134. Birnboim, H.C. & Doly, J. A rapid alkaline extraction procedure for screening recombinant plasmid DNA. Nucleic Acids Res 7, 1513-1523 (1979).
135. Sambrook, J.a.R., D. Molecular cloning- A laboratory manual, Edn. 3rd. (Cold Spring Harbor Laboratory, 2001).
136. Mullis, K. et al. Specific enzymatic amplification of DNA in vitro: the polymerase chain reaction. Cold Spring Harb Symp Quant Biol 51 Pt 1, 263-273 (1986).
137. Chomczynski, P. & Sacchi, N. Single-step method of RNA isolation by acid guanidinium thiocyanate-phenol-chloroform extraction. Anal Biochem 162, 156-159 (1987).
138. Marchuk, D., Drumm, M., Saulino, A. & Collins, F.S. Construction of T-vectors, a rapid and general system for direct cloning of unmodified PCR products. Nucleic Acids Res 19, 1154 (1991).
139. Clarke, L. & Carbon, J. A colony bank containing synthetic Col El hybrid plasmids representative of the entire E. coli genome. Cell 9, 91-99 (1976).
140. Sanger, F., Nicklen, S. & Coulson, A.R. DNA sequencing with chain-terminating inhibitors. Proc Natl Acad Sci U S A 74, 5463-5467 (1977).
141. Altschul, S.F. et al. Gapped BLAST and PSI-BLAST: a new generation of protein database search programs. Nucleic Acids Res 25, 3389-3402 (1997).
142. Bibb, M.J., Findlay, P.R. & Johnson, M.W. The relationship between base composition and codon usage in bacterial genes and its use for the simple and reliable identification of protein-coding sequences. Gene 30, 157-166 (1984).
143. Ishikawa, J. & Hotta, K. FramePlot: a new implementation of the frame analysis for predicting protein-coding regions in bacterial DNA with a high G + C content. FEMS Microbiol Lett 174, 251-253 (1999).
144. Dixon, M. Enzymes. (Longman, London; 1967).
145. Stahl, E. Thin Layer Chromatography- A laboratory handbook. (Springer Verlag, 1969).

References
131
146. Giliberti, P. & Niederwieser, A. Separation of neutral amino acids, dipeptides and oligopeptides into classes. Application to urine. J Chromatogr 66, 261-276 (1972).
147. Hardy, M.R. & Townsend, R.R. High-pH anion-exchange chromatography of glycoprotein-derived carbohydrates. Methods Enzymol 230, 208-225 (1994).
148. Dionex Optimal settings for Pulsed Amperometric Detection of carbohydrates using the Dionex ED40 Electrochemical Detector. Technical Note 21 (1998).
149. Karas, M. & Hillenkamp, F. Laser desorption ionization of proteins with molecular masses exceeding 10,000 daltons. Anal Chem 60, 2299-2301 (1988).
150. Nissim, I., Wehrli, S., States, B., Nissim, I. & Yudkoff, M. Analysis and physiological implications of renal 2-oxoglutaramate metabolism. Biochem J 277 ( Pt 1), 33-38 (1991).


![Biosynthesis of Riboflavin. A Simple Synthesis of the ...zfn.mpdl.mpg.de/data/Reihe_B/43/ZNB-1988-43b-1358.pdf · P. Nielsen-A. Bacher Biosynthesis of Riboflavin 1359 (4a) [11 14],](https://cdn.vdokument.com/doc/165x107/5d563f7b88c993646f8bdda3/biosynthesis-of-riboflavin-a-simple-synthesis-of-the-zfnmpdlmpgdedatareiheb43znb-1988-43b-1358pdf.jpg)


