1
Universitätsklinikum Hamburg-Eppendorf
Institut für Pathologie
Direktor: Prof. Dr. Guido Sauter
Betreuer PD. Dr. Ronald Simon
Östrogen-Rezeptor alpha (ESR1) Gen-Amplifikation ist selten bei malignen Ovarialtumoren
Dissertation
Zur Erlangung des Grades eines Doktors der Medizin
der medizinischen Fakultät der Universität Hamburg
Vorgelegt von:
Rana Issa
Aus Syrien
Hamburg 2010

2
To all whom I love

3
Accepted by the medical faculty at: 24.02.2011 Published with approval of the medical faculty of the University of Hamburg Exam-committee, Chairman: Prof. Dr. G. Sauter Exam-committee, 2 Reviewer: Prof. Dr. C. Bokemeyer Exam-committee, 3 Reviewer: Prof. Dr. F. Jänicke Year of Promotion: 2011
4
Contents 1. Introduction 1.1. Ovarian cancers 1.1.1. Incidence/ Mortality 1.1.2. Risk factors 1.1.3. Pathology / Histology 1.1.4. Treatment 1.1.5. Prognostic factors 1.2. Pathogenesis of ovarian cancers 1.3. Estrogen receptors 1.4. Purpose of the work 2. Material and Methods 2.1. Material 2.2. Tissue microarray 2.3. Immunohistochemistry 2.4. Fluorescence in situ hybridization (FISH) 2.5. Statistical analysis 3. Results 3.1. ER Expression 3.2. ER1 Amplification 4. Discussion 5. Conclusion 6. Abstract

5
7. References 8. Acknowledgement
9. CV/ resume 10. Declaration
6
1. Introduction
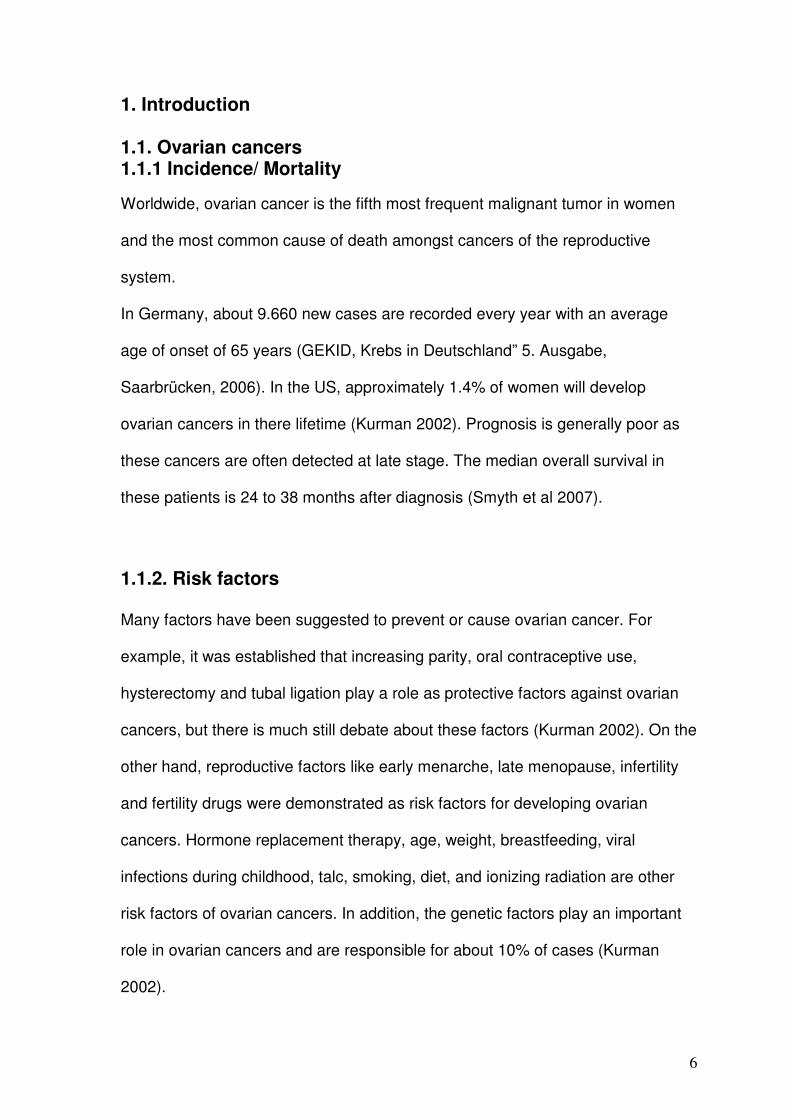
1.1. Ovarian cancers 1.1.1 Incidence/ Mortality Worldwide, ovarian cancer is the fifth most frequent malignant tumor in women
and the most common cause of death amongst cancers of the reproductive
system.
In Germany, about 9.660 new cases are recorded every year with an average
age of onset of 65 years (GEKID, Krebs in Deutschland” 5. Ausgabe,
Saarbrücken, 2006). In the US, approximately 1.4% of women will develop
ovarian cancers in there lifetime (Kurman 2002). Prognosis is generally poor as
these cancers are often detected at late stage. The median overall survival in
these patients is 24 to 38 months after diagnosis (Smyth et al 2007).
1.1.2. Risk factors
Many factors have been suggested to prevent or cause ovarian cancer. For
example, it was established that increasing parity, oral contraceptive use,
hysterectomy and tubal ligation play a role as protective factors against ovarian
cancers, but there is much still debate about these factors (Kurman 2002). On the
other hand, reproductive factors like early menarche, late menopause, infertility
and fertility drugs were demonstrated as risk factors for developing ovarian
cancers. Hormone replacement therapy, age, weight, breastfeeding, viral
infections during childhood, talc, smoking, diet, and ionizing radiation are other
risk factors of ovarian cancers. In addition, the genetic factors play an important
role in ovarian cancers and are responsible for about 10% of cases (Kurman
2002).
7
For first degree relatives, the possibility of having ovarian cancer varies from 1.94
to 25.5 (WHO, Tumors of the breast and female genital organs).
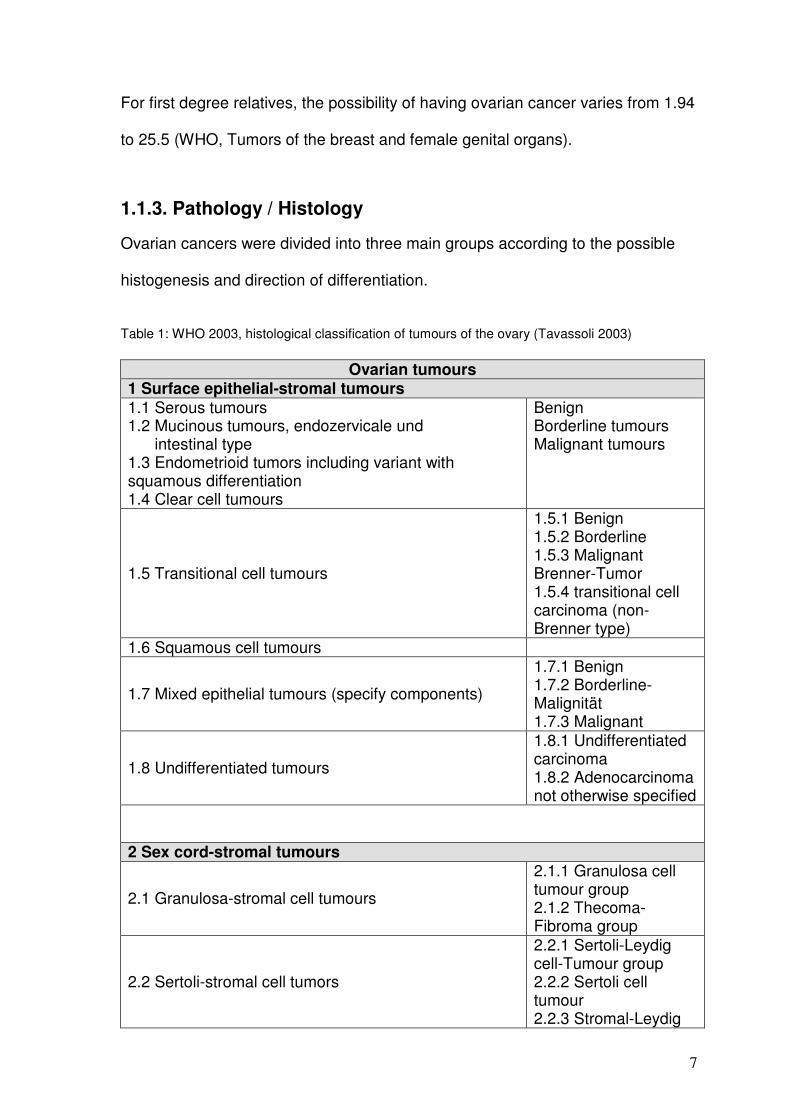
1.1.3. Pathology / Histology Ovarian cancers were divided into three main groups according to the possible histogenesis and direction of differentiation. Table 1: WHO 2003, histological classification of tumours of the ovary (Tavassoli 2003)
Ovarian tumours 1 Surface epithelial-stromal tumours 1.1 Serous tumours 1.2 Mucinous tumours, endozervicale und intestinal type 1.3 Endometrioid tumors including variant with squamous differentiation 1.4 Clear cell tumours
Benign Borderline tumours Malignant tumours
1.5 Transitional cell tumours
1.5.1 Benign 1.5.2 Borderline 1.5.3 Malignant Brenner-Tumor 1.5.4 transitional cell carcinoma (non-Brenner type)
1.6 Squamous cell tumours
1.7 Mixed epithelial tumours (specify components)
1.7.1 Benign 1.7.2 Borderline-Malignität 1.7.3 Malignant
1.8 Undifferentiated tumours
1.8.1 Undifferentiated carcinoma 1.8.2 Adenocarcinoma not otherwise specified
2 Sex cord-stromal tumours
2.1 Granulosa-stromal cell tumours
2.1.1 Granulosa cell tumour group 2.1.2 Thecoma-Fibroma group
2.2 Sertoli-stromal cell tumors
2.2.1 Sertoli-Leydig cell-Tumour group 2.2.2 Sertoli cell tumour 2.2.3 Stromal-Leydig
8
Ovarian tumours cell tumour
2.3 Sex cord-stromal tumoursof mixed or unclassified cell type
2.3.1 Sex cord tumour with annular tubules 2.3.2 Gynandroblastoma 2.3.3 Unclassified
2.6 Steroid cell tumors
2.6.1 Stromal luteoma 2.6.2 Leydig cell tumour group 2.6.3 Steroid cell tumor, not otherwise specified
3 Germ cell Tumours
3.1 Primitive germ cell tumours
3.1.1.Dysgerminoma 3.1.2 Yolk sac tumour 3.1.3 Embryonal carcinoma 3.1.4 Polyembryoma 3.1.5 Non gestational Chorioncarcinoma 3.1.6 Mixed germ cell tumour
3.2 Biphasic or triphasic Teratoma 3.2.1 immature 3.2.2 mature
3.3 Monodermal teratoma and somatic-type tumours associated with dermal cysts
4 Germ cell sex cord-stromal Tumours 4.1 Gonadoblastoma 4.2 Mixed germ cell-sex cord-stromal tumour 5 Tumours of rete ovarii 5.1 Adenocarcinoma 5.2 Adenoma 5.3 Cystadenoma 5.4 Cystadenofibroma
6 Miscellaneous tumours 6.1 Small cell carcinoma, hypercalcaemic type 6.2 Small cell carcinoma, pulmonary type 6.3 Large neuroendocrine carcinoma 6.4 Hepatoid carcinoma 6.5 Primary ovarian mesothelioma 6.6 Wilms tumour 6.7 Gestational choriocarcinoma 6.8.Hytatidiform mole 6.9 Adenoid cystic carcinoma 6.10 Basal cell tumour 6.11 Ovarian wolffian tumour
9
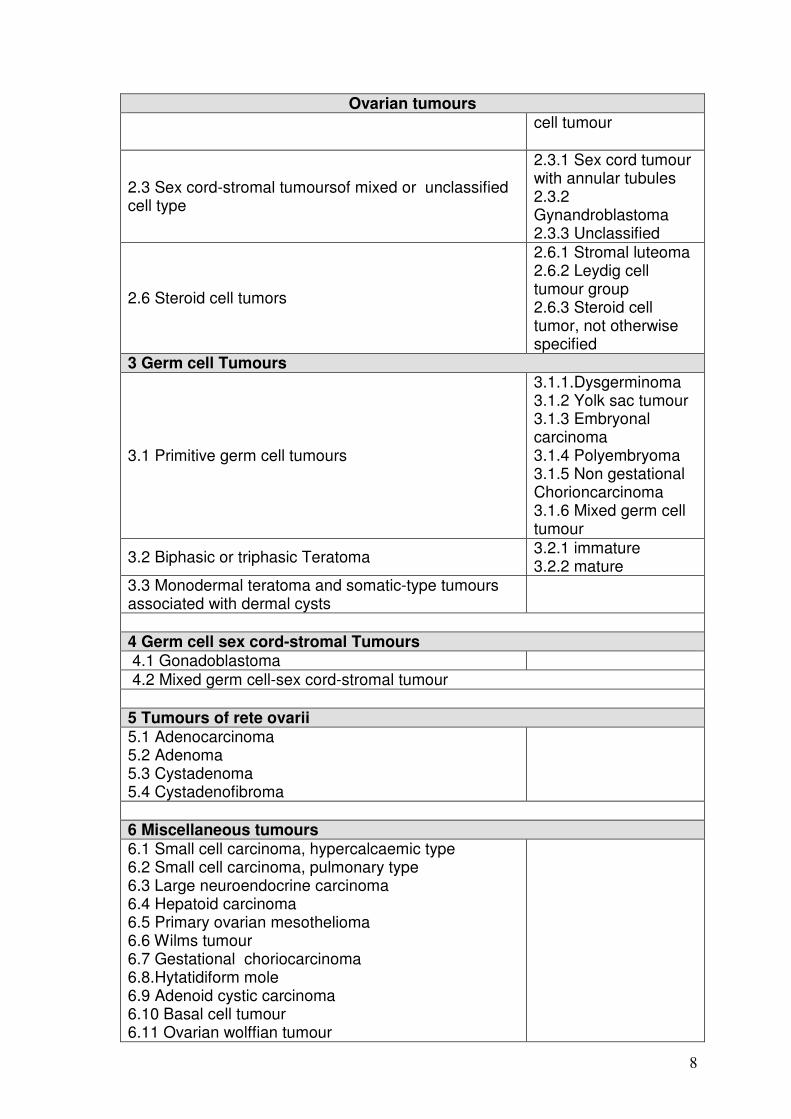
Ovarian tumours 6.12 Paraganglioma 6.13 Myxoma 6.14 Soft tissue tumors not specific to ovary 6.15 Other 7 Tumour-like conditions 8 Lymphoid and haematopoetic tumours 9 Secondary tumours
The main group of the ovarian tumors is the epithelial tumors, which comprises
about 50- 60% of all ovarian tumors (Boecker and Denk 2004), and accounting
for about 90% of malignant tumors (WHO).
Surface epithelial tumors were classified according to the following characters:
- Cell types: serous, endometrioid and mucinous tumors.
- Growth pattern: cystic, solid, papillary.
- Accompanying fibrous tissue.
- Atypia and invasivness.
It is important to say that borderline tumors rank between benign and malignant
tumors, as they don’t fulfill all criteria of malignant one and have better prognosis.
This group accounts for about 5-10% of ovarian tumors.
10-20% of all ovarian tumors are germ cell tumors which is the second most
frequent tumors. Most of them happen in children and young adults (Rosai and
Ackermann 2004). 5-10% of ovarian tumors are sex cord-stromal tumors
(Boecker and Denk, 2004).

10
1.1.4. Treatment Treatment options include surgical removal of the tumor mass with a maximal
reduction of the peritoneal cancer mass in case of local tumor extension. In
addition, topical and systemic cytotoxic therapy is applied. Ovarian cancer
belongs to the group of cancers with frequent expression of steroid hormone
receptors. The frequency of estrogen receptor (ER) expression varies greatly
between different studies, and has been reported in 25 % to 86% of ovarian
cancers with highest percentages reported in endometroid and serous subtypes
(Vang et al 2001, Teufel et al 1983, De Sousa Damião et al 2007, Kommoss et al
1992, Rosen et al 2004, Vang et al 2006, Van Doom et al 2000, Lindgren et al
2004, Lindgren et al 2001, Van Mieghem et al 2005, Cardillo et al 1998, Farinola
et al 2007, Ho 2003, Høgdall et al 2007). Accordingly, endocrine therapy is a
recognized option in the treatment of chemo-resistant ovarian cancer after failure
of first and second line therapies. However, not all ER positive ovarian cancers
respond to anti-estrogen therapy, and it was suggested that might be due to the
facts that most of the studies have been retrospective, small in size, without
adequate selection of the patients and generally used hormonal therapy as a last-
line therapy for the refractory or resistant ovarian cancers; moreover, concerning
tamoxifen, it has not been definitely clarified whether it only acts as a pure
estrogen antagonist in ovarian tissue, or it has also an agonist effects (Perez-
Gracia et al 2002, Langdon et al 1994, Makar 2000, Clinton Hua,1997, Cunat et
al 2004).

11
1.1.5. Prognostic factors
There are many factors known to influence the prognosis of ovarian cancers but
the most important are the following: extension of the tumors beyond the organ
limits, the volume, ascites, DNA ploidy, age of the patient, serum CA-125, P53,
histological grade and type (Kurman 2002).
The most reliable and well spread, world wide applied prognostically relevant
classification is the FIGO Stage (International Federation for Gynecology and
Obstetric) (Table 2).
Table 2: FIGO – Staging of ovarian cancers
01 - FIGO Stage I
01 FIGO Stage I
Tumour limited to ovaries.
01A IA Tumour limited to one ovary; capsule intact, no tumour on ovarian surface; no malignant cells in ascites or peritoneal washings.
01B IB Tumour limited to both ovaries; capsule intact, no tumour on ovarian surface; no malignant cells in ascites or peritoneal washings.
01C IC Tumour limited to one or both ovaries with any of the following: capsule ruptured, tumour on ovarian surface, malignant cells in ascites or peritoneal washings.
02 - FIGO Stage II
02 FIGO Stage II
Tumour one or both ovaries with pelvic extension.
02A IIA Extension and/or implants on uterus and/or tube(s); no malignant cells in ascites or peritoneal washings.
02B IIB Extension to other pelvic tissues; no malignant cells in ascites or peritoneal washings.
02C IIC Pelvic extension (2a or 2b) with malignant cells in ascites or peritoneal washings.
03 - FIGO Stage III
03 FIGO Stage III
Tumour involves one or both ovaries with microscopically confirmed peritoneal metastasis outside the pelvis and/or regional lymph node metastasis.
03A IIIA Microscopic peritoneal metastasis beyond pelvis. 03B IIIB Macroscopic peritoneal metastasis beyond pelvis 2 cm or less in greatest
dimension. 03C IIIC Peritoneal metastasis beyond pelvis more than 2 cm in greatest dimension
and/or regional lymph node metastasis.
04 - FIGO Stage IV
04 FIGO Stage IV Distant metastasis (excludes peritoneal metastasis)
12
1.2. Pathogenesis of ovarian cancers The pathogeneses of the ovarian cancers is still unknown and in comparison to
the carcinomas of the colon there is no reliable tumor progression model.
Many efforts were done to propose a model to clarify the pathway of these
cancers’ development and were based on the clinicopathological and molecular
studies. In this proposed model the surface epithelial tumors were divided into
low and high grade groups. The low grade group arises in a stepwise manner
and contains low grade serous carcinomas, mucinous carcinomas, endomedrioid
carcinomas, malignant Brenner tumors and clear cell carcinomas. The most
molecular changes that associated with Type I are BRAF and KRAS mutations
in serous tumors, KRAS mutation in mucinous tumors and B-catenin and PTEN
mutations and microsatellite instability in endometrioid carcinomas. Type II
includes high grade serous carcinomas, malignant mixed mesodermal tumor, and
undifferentiated carcinomas. The well known molecular change in this group of
tumors is p53 mutations (Figure 1) (Shih and Kurman 2004).
13
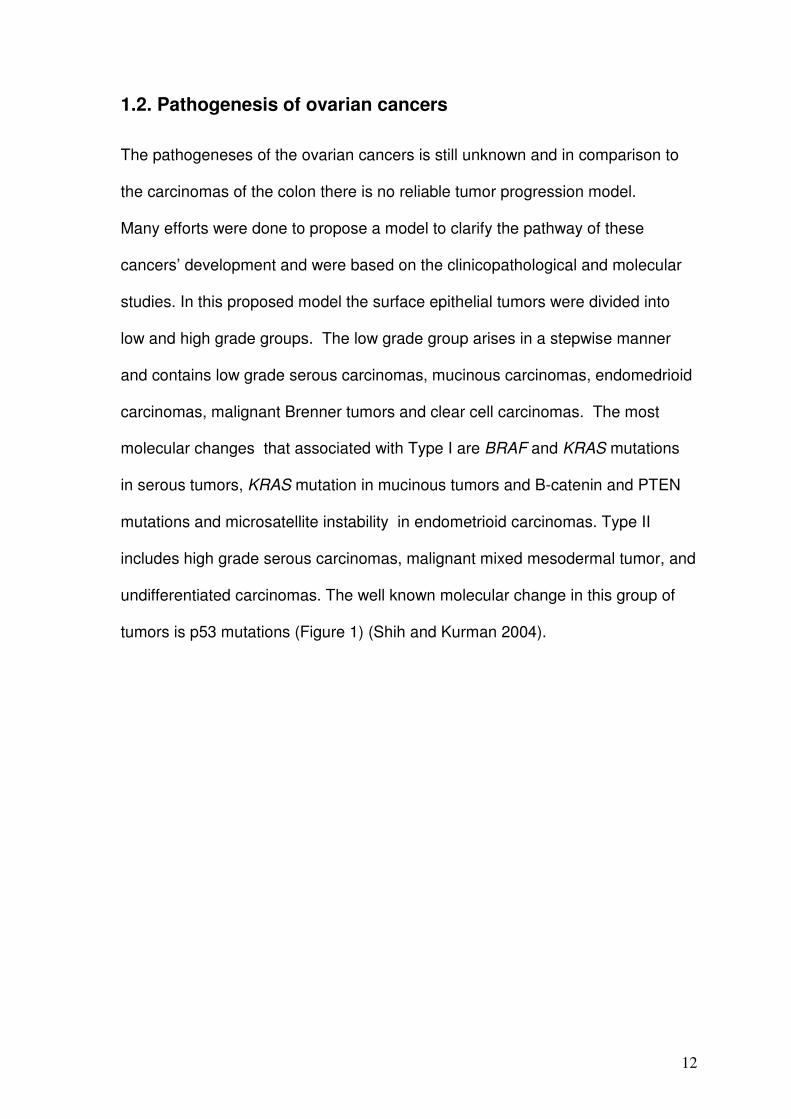
Figure1. Schematic representation of the dualistic model depicting the development of ovarian serous
carcinomas, the most common type of ovarian cancer (Shih and Kurman 2004).
Low-grade serous carcinoma (MPSC) represents the prototypic type I tumor and develops in a stepwise
manner from an atypical proliferative tumor through a noninvasive stage of MPSC (both of these tumors
qualified as borderline) before becoming invasive. These tumors are associated with frequent KRAS or
BRAF mutations. High-grade serous carcinoma represents the prototypic type II tumor and develops from
the ovarian surface epithelium or inclusion cysts without morphologically recognizable intermediate stages.
KRAS and BRAF mutations have been rarely found in these neoplasms. CIN, chromosomal instability.
Recently, the epidemiological and experimental studies have pointed out to the
possible carcinogenetic role of estrogen in promoting the development of ovarian
cancers in postmenopausal women (Cunat et al, 2004).
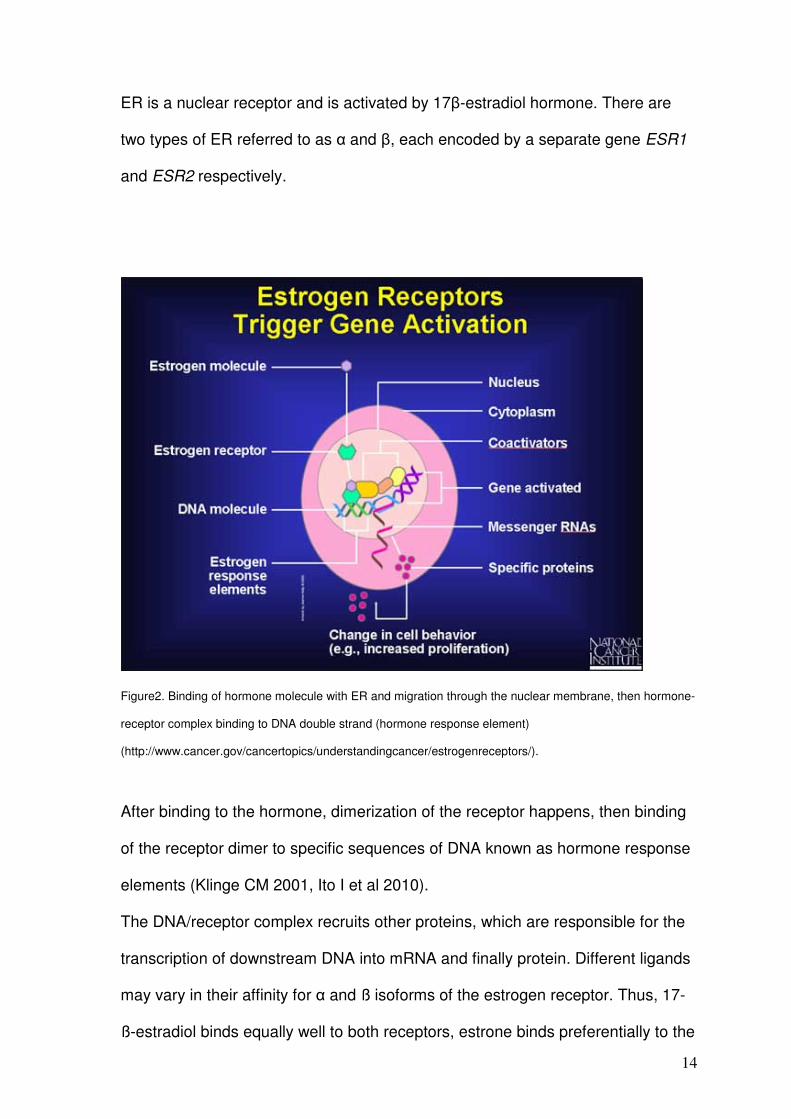
1.3. Estrogen receptors Estrogen is a steroidal hormone can pass through the phospholipid cytoplasmic
membrane without any need to membrane bound receptors (figure 2).
14
ER is a nuclear receptor and is activated by 17β-estradiol hormone. There are
two types of ER referred to as α and β, each encoded by a separate gene ESR1
and ESR2 respectively.
Figure2. Binding of hormone molecule with ER and migration through the nuclear membrane, then hormone-
receptor complex binding to DNA double strand (hormone response element)
(http://www.cancer.gov/cancertopics/understandingcancer/estrogenreceptors/).
After binding to the hormone, dimerization of the receptor happens, then binding
of the receptor dimer to specific sequences of DNA known as hormone response
elements (Klinge CM 2001, Ito I et al 2010).
The DNA/receptor complex recruits other proteins, which are responsible for the
transcription of downstream DNA into mRNA and finally protein. Different ligands
may vary in their affinity for α and ß isoforms of the estrogen receptor. Thus, 17-
ß-estradiol binds equally well to both receptors, estrone binds preferentially to the
15
α receptor, and estriol prefers the ß receptor (Zhu et al 2006). Additionally, the
same ligand may be an agonist in some tissues, and an antagonist in other
tissues. For example Tamoxifen is an antagonist in breast and is therefore used
as a breast cancer treatment, but acts as an ER agonist in endometrium and
skeletal tissue, preserving bone density (Dahlman-Wright et al 2006).
1.4. Purpose of the work
In breast cancer, estrogen receptor alpha (ESR1) gene amplification has been
recently described as a frequent mechanism for ER overexpression. More than
20% of breast cancers showed ESR1 gene amplification and more than 15%
additional cases low level ESR1 gene copy number gains (Holst et al 2007).
Preliminary data also suggested that ESR1 amplified breast cancers may exhibit
a high responsiveness to tamoxifen (Holst et al 2007).
To determine, whether ESR1 amplifications also occur in ovarian cancer, we
analyzed a set of more than 420 primary ovarian cancers for ESR1 gene
amplification. The results of this study suggest that ESR1 amplification is a
mechanism for ER overexpression only in a very small subset of ovarian cancers.
16
2. Material and Methods. 2.1. Material
Primary tumors of 428 ovarian cancer patients were used for this study. Tumors
have been collected from Institute of Pathology at Basel University and Institute
of Pathology at UKE, Hamburg. The median patient age was 58.1 (range 24–84)
years. The mean follow up time was 41.85 months (range 1–210).
Formalin fixed (neutral buffered aqueous four percent solution), paraffin
embedded tumor material was utilized. The pathologic stage was obtained from
the primary pathology reports. All slides from all tumors were reviewed by two
pathologists (HM, RI) to define the histological grade and the histological tumor
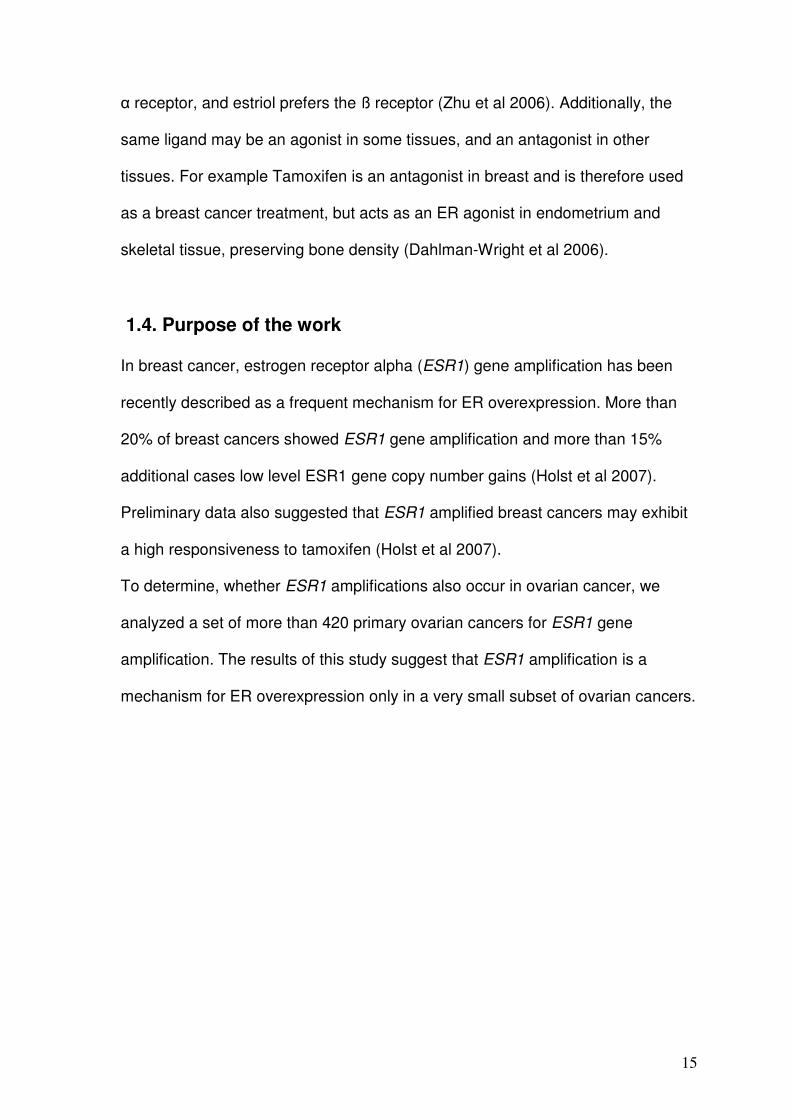
type. The composition of the TMA is described in detail in table 3.
Table3. The composition of the TMA in details.
Histologie
Nr. Cases (Basel) Nr. Cases (Hamburg)
Papillary, Serous Carcinoma 112 63 Mucinous Carcinoma 38 46 Endometrioid Carcinoma 68 22 Clear Cell Carcinoma 24 0 Malignant Brenner Tumor 5 0 Squamous Cell Carcinoma 1 0 Mullerian Mixed Cancer 15 0 Sex Cord- Stromal Tumors 10 0 Yolk Sack Tumor 4 0 Undifferentiated 15 0 other rare types 5 0 Sum 297 131
17
2.2. Tissues Microarray
A single 0.6 mm tissue core was punched from each of the 428 donor blocks and
placed in the recipient paraffin block. The patients were treated at Hamburg and
Basel University Hospitals between 1980 and 2001.
Follow up data was available from 169 patients. The mean follow up time was
41.85 months. The composition of the TMA was shown in details in table2.
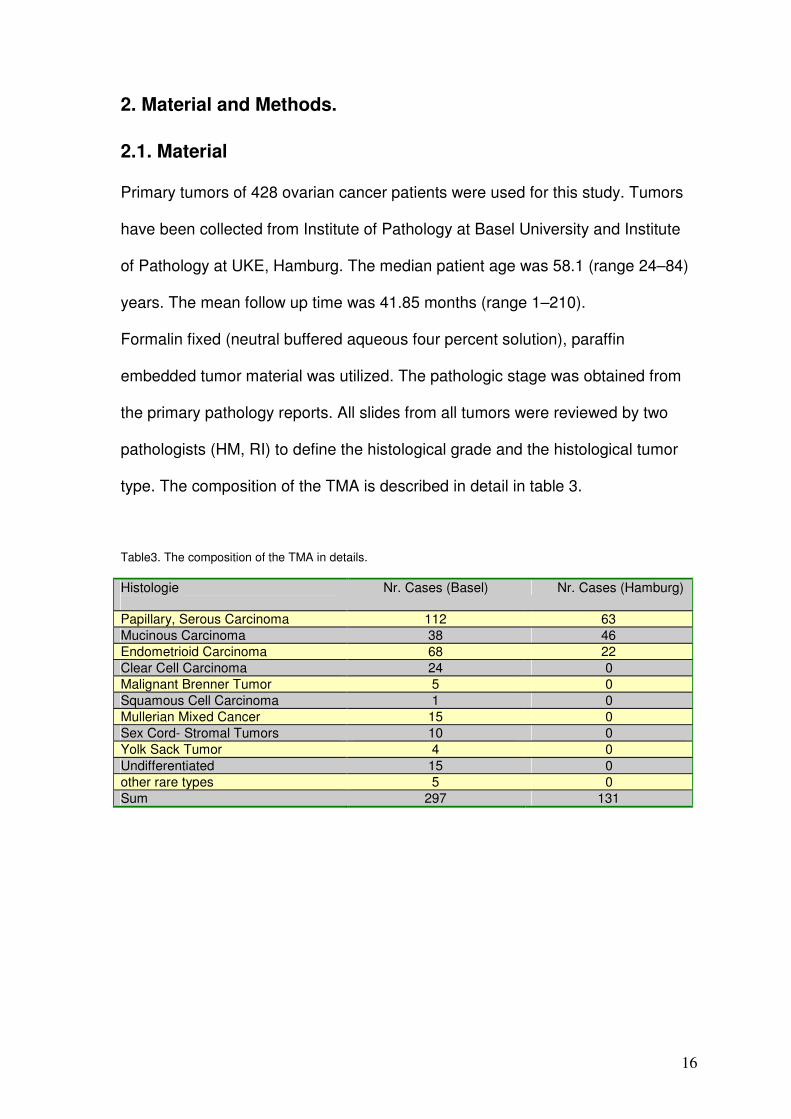
A picture of a hematoxilin and eosin stained arrays section is shown in figure 3.
Figure 3: Hematoxilin & eosin stained sections of our ovarian cancers TMA.
a) TMA block, Basel cases, 297 tumors’ spots. The diameter of each is 0.6 mm.
b) TMA block, Hamburg cases, 131 tumors’ spots with 16 spots of different body tissues.
2.3. Immunohistochemistry
Immunohistochemical detection of ER alpha protein was performed using a
mouse monoclonal antibody (DAKO #M7047, clone 1D5). A 4µm TMA section
was deparaffinized in xylol and rehydrated in a descending series of ethanol
(96%, 90%, 80%, and 70%). For heat induced antigen retrieval, slides were
18
incubated with DAKO’s antigen retrieval solution pH9 (DAKO #S2368). The
primary antibody was diluted 1:50 and incubated for 30 min at room temperature.
The primary antibody was omitted for negative control. All spots were analyzed
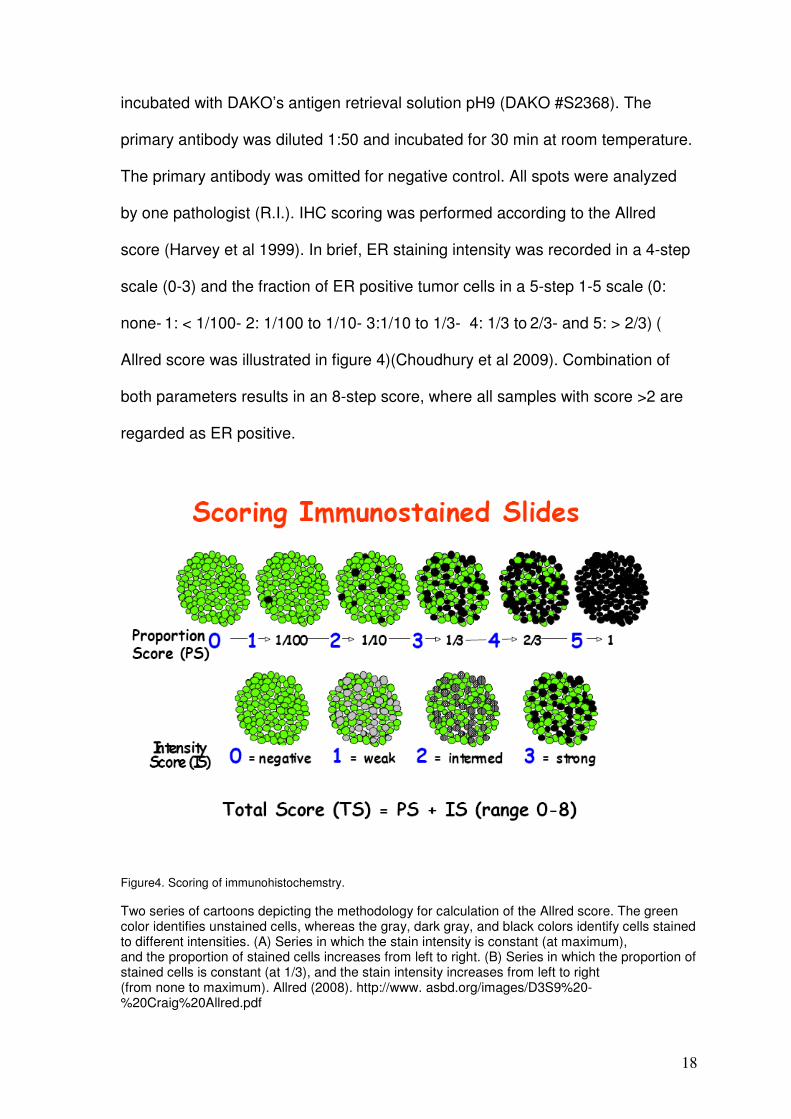
by one pathologist (R.I.). IHC scoring was performed according to the Allred
score (Harvey et al 1999). In brief, ER staining intensity was recorded in a 4-step
scale (0-3) and the fraction of ER positive tumor cells in a 5-step 1-5 scale (0:
none- 1: < 1/100- 2: 1/100 to 1/10- 3:1/10 to 1/3- 4: 1/3 to 2/3- and 5: > 2/3) (
Allred score was illustrated in figure 4)(Choudhury et al 2009). Combination of
both parameters results in an 8-step score, where all samples with score >2 are
regarded as ER positive.
Figure4. Scoring of immunohistochemstry.
Two series of cartoons depicting the methodology for calculation of the Allred score. The green color identifies unstained cells, whereas the gray, dark gray, and black colors identify cells stained to different intensities. (A) Series in which the stain intensity is constant (at maximum), and the proportion of stained cells increases from left to right. (B) Series in which the proportion of stained cells is constant (at 1/3), and the stain intensity increases from left to right (from none to maximum). Allred (2008). http://www. asbd.org/images/D3S9%20-%20Craig%20Allred.pdf
19
2.4. Fluorescence in situ hybridization (FISH)
TMA sections were treated according to the Paraffin Pretreatment Reagent Kit
protocol (Vysis, Downers Grove, IL) before hybridization. FISH was performed
with a digoxigenated BAC probe (BAC RP11-450E24, RZPD, Germany)
containing a part of the ESR1 gene and a Spectrum-Orange labeled chromosome
6 centromeric probe (CEP6) as a reference (purchased from Vysis). Hybridization
and post hybridization washes were according to the ‘LSI procedure’ (Vysis).
Probe visualization using fluorescent isothiocyanate (FITC)-conjugated sheep
anti-digoxigenin (Roche Diagnostics, Rotkreuz, Switzerland) was as described
(Wagneret al 1997). Slides were counterstained with 125 ng/ml 4’, 6-diamino-2-
phenylindole in an antifade solution. Hybridization and post hybridization washes
were according to the ‘LSI procedure’ (Vysis). Slides were then counterstained
with 125 ng/ml 4’,6-diamino-2-phenylindole in an antifade solution. The number of
fluorescence signals was estimated by an experienced person (FH) in each
tissue spot for the centromere 6 and the ESR1 gene probes. ESR1 alterations
were defined based on the ratio of gene copy numbers of ESR1 and centromere
6. Tissues with more at least two-fold more ESR1 than cen. 6 copies (ratio ≥2.0)
were considered “ESR1 amplified”. Tissues with more ESR1 than centromere 6
copies not reaching the criteria for amplification were considered “ESR1 gained”
(ratio >1.0 but <2.0). All other analyzable tissues (Ratio 1.0) were considered
“ESR1 normal”.

20
2.5. Statistical analysis
Contingency table analysis and chi-square tests were used to study the
relationship between clinicopathological parameters of the analysed tissues and
ER expression levels. Kaplan-Meier plots and log-rank tests were employed to
analyze the relationship between ER expression status and patient survival.
21
3. Results
3.1. ER Expression
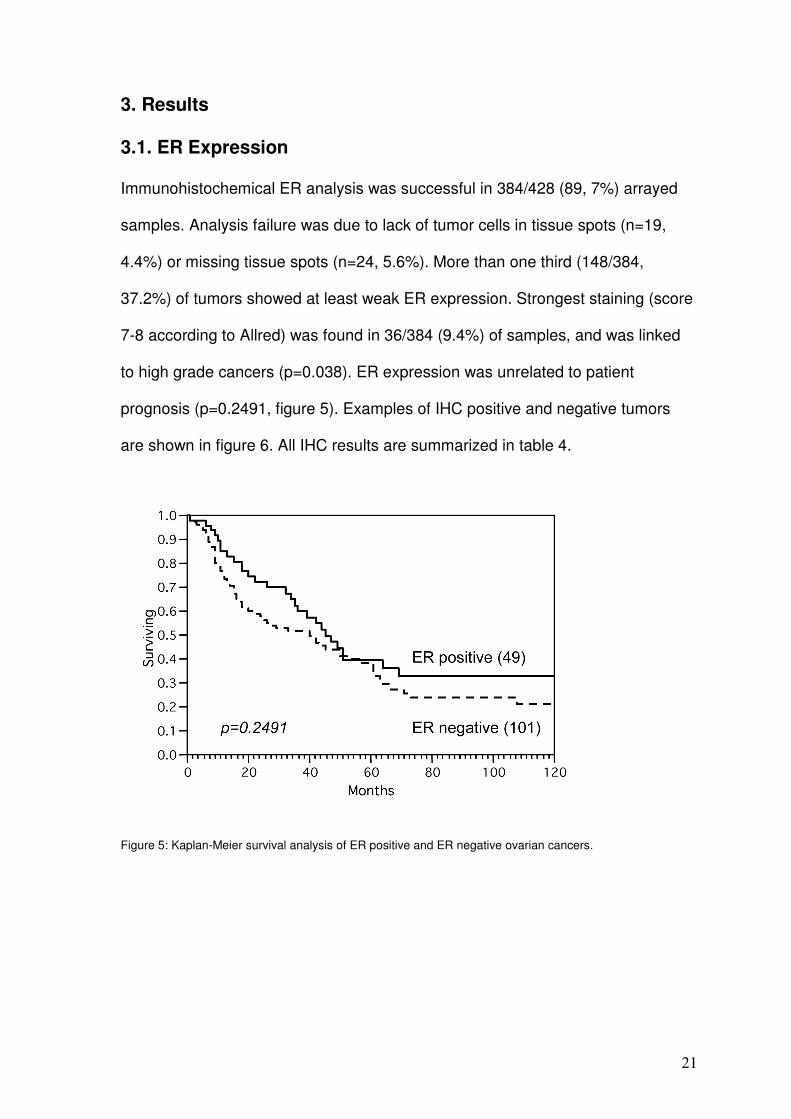
Immunohistochemical ER analysis was successful in 384/428 (89, 7%) arrayed
samples. Analysis failure was due to lack of tumor cells in tissue spots (n=19,
4.4%) or missing tissue spots (n=24, 5.6%). More than one third (148/384,
37.2%) of tumors showed at least weak ER expression. Strongest staining (score
7-8 according to Allred) was found in 36/384 (9.4%) of samples, and was linked
to high grade cancers (p=0.038). ER expression was unrelated to patient
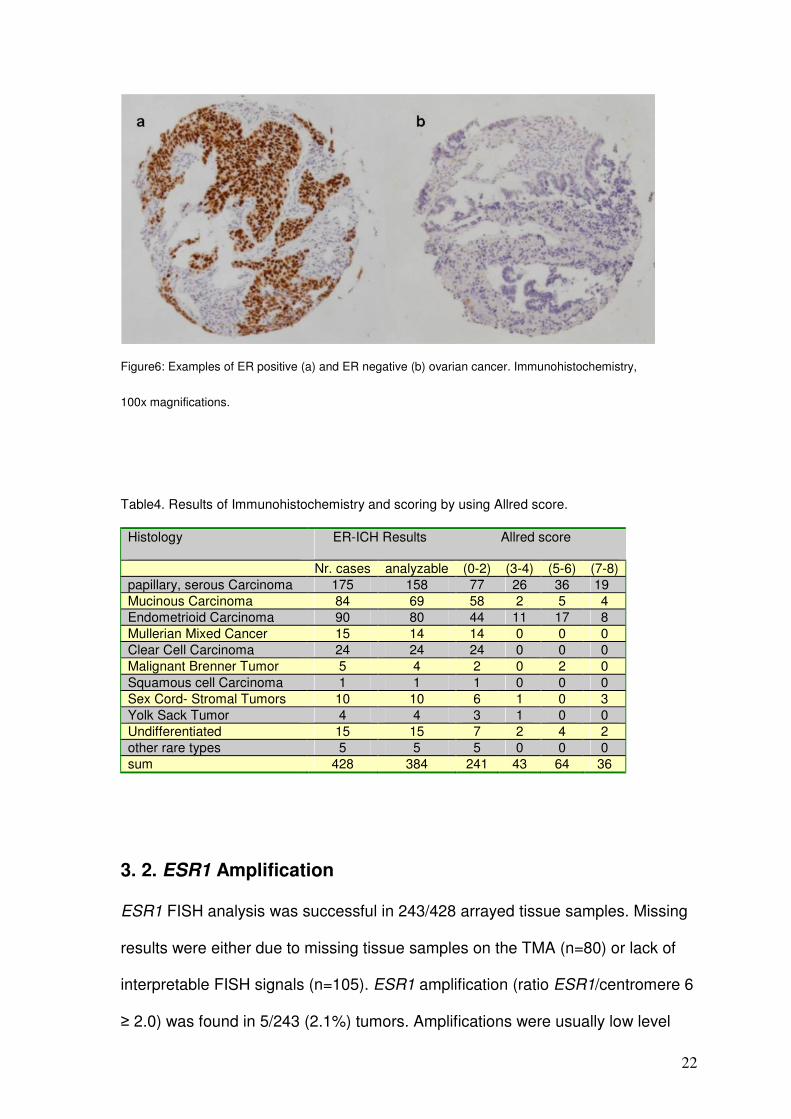
prognosis (p=0.2491, figure 5). Examples of IHC positive and negative tumors
are shown in figure 6. All IHC results are summarized in table 4.
Figure 5: Kaplan-Meier survival analysis of ER positive and ER negative ovarian cancers.
22
Figure6: Examples of ER positive (a) and ER negative (b) ovarian cancer. Immunohistochemistry,
100x magnifications.
Table4. Results of Immunohistochemistry and scoring by using Allred score.
Histology ER-ICH Results Allred score
Nr. cases analyzable (0-2) (3-4) (5-6) (7-8) papillary, serous Carcinoma 175 158 77 26 36 19 Mucinous Carcinoma 84 69 58 2 5 4 Endometrioid Carcinoma 90 80 44 11 17 8 Mullerian Mixed Cancer 15 14 14 0 0 0 Clear Cell Carcinoma 24 24 24 0 0 0 Malignant Brenner Tumor 5 4 2 0 2 0 Squamous cell Carcinoma 1 1 1 0 0 0 Sex Cord- Stromal Tumors 10 10 6 1 0 3 Yolk Sack Tumor 4 4 3 1 0 0 Undifferentiated 15 15 7 2 4 2 other rare types 5 5 5 0 0 0 sum 428 384 241 43 64 36
3. 2. ESR1 Amplification
ESR1 FISH analysis was successful in 243/428 arrayed tissue samples. Missing
results were either due to missing tissue samples on the TMA (n=80) or lack of
interpretable FISH signals (n=105). ESR1 amplification (ratio ESR1/centromere 6
≥ 2.0) was found in 5/243 (2.1%) tumors. Amplifications were usually low level
23
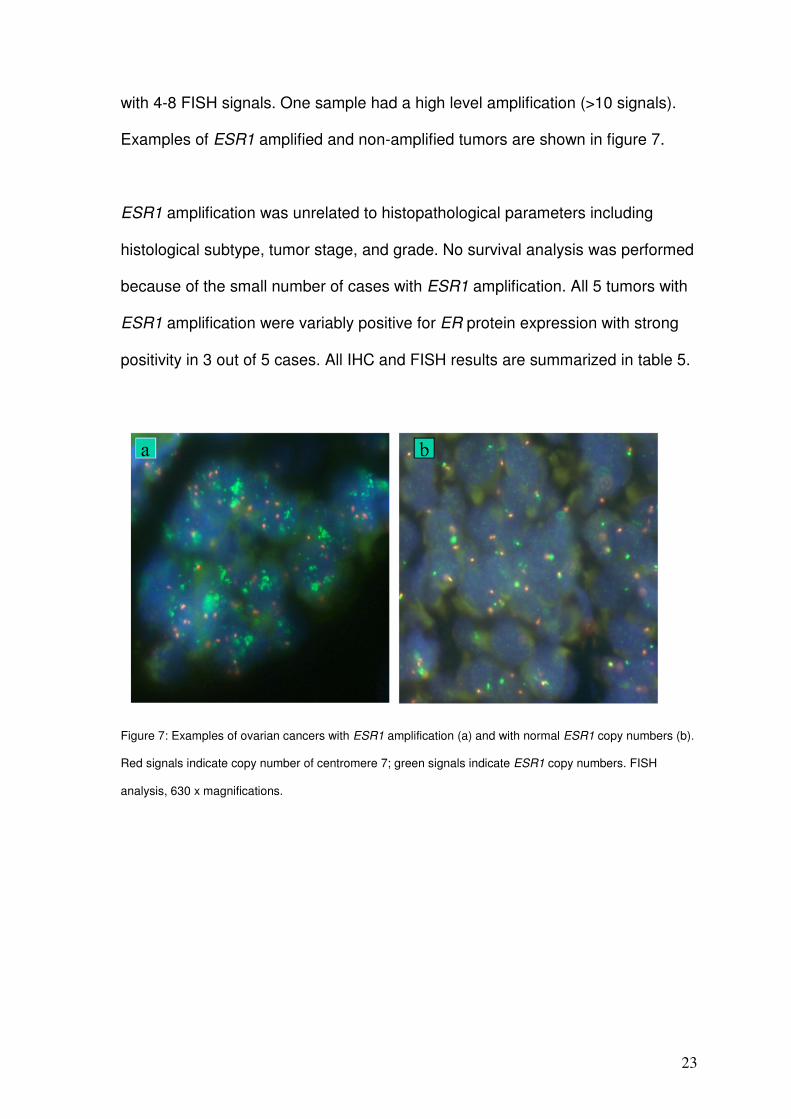
with 4-8 FISH signals. One sample had a high level amplification (>10 signals).
Examples of ESR1 amplified and non-amplified tumors are shown in figure 7.
ESR1 amplification was unrelated to histopathological parameters including
histological subtype, tumor stage, and grade. No survival analysis was performed
because of the small number of cases with ESR1 amplification. All 5 tumors with
ESR1 amplification were variably positive for ER protein expression with strong
positivity in 3 out of 5 cases. All IHC and FISH results are summarized in table 5.
Figure 7: Examples of ovarian cancers with ESR1 amplification (a) and with normal ESR1 copy numbers (b).
Red signals indicate copy number of centromere 7; green signals indicate ESR1 copy numbers. FISH
analysis, 630 x magnifications.
24
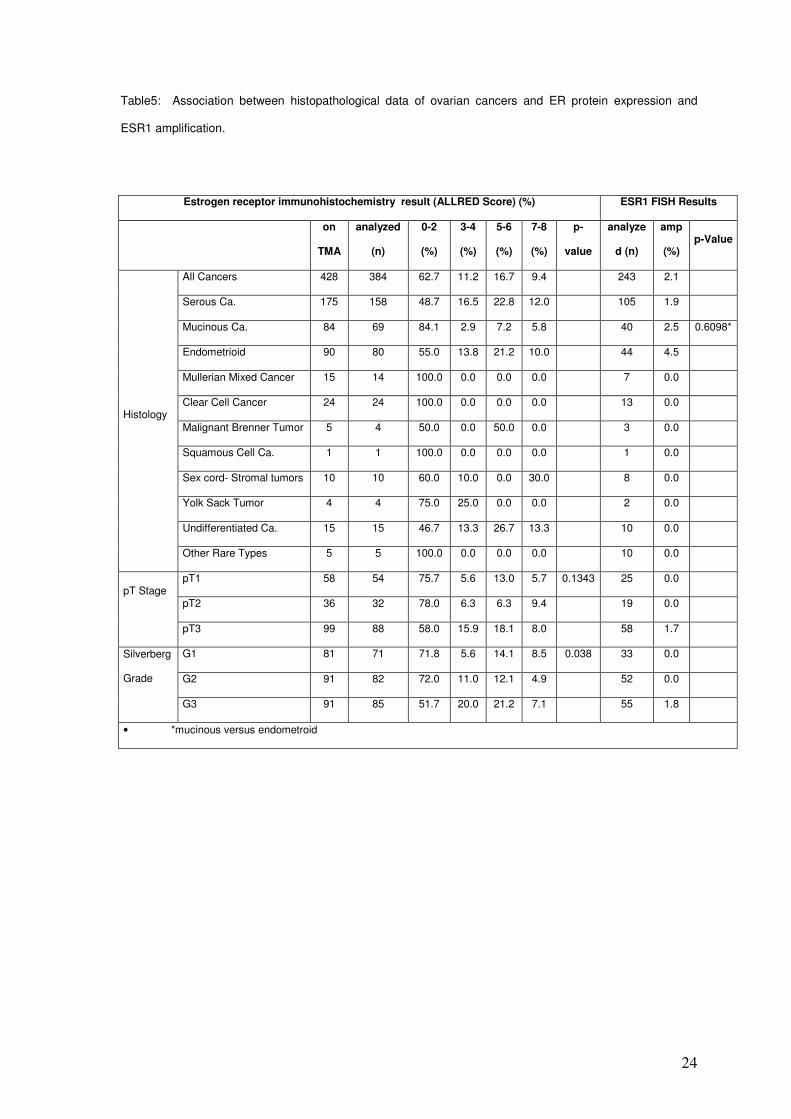
Table5: Association between histopathological data of ovarian cancers and ER protein expression and
ESR1 amplification.
Estrogen receptor immunohistochemistry result (ALLRED Score) (%) ESR1 FISH Results
on
TMA
analyzed
(n)
0-2
(%)
3-4
(%)
5-6
(%)
7-8
(%)
p-
value
analyze
d (n)
amp
(%) p-Value
All Cancers 428 384 62.7 11.2 16.7 9.4 243 2.1
Serous Ca. 175 158 48.7 16.5 22.8 12.0 105 1.9
Mucinous Ca. 84 69 84.1 2.9 7.2 5.8 40 2.5 0.6098*
Endometrioid 90 80 55.0 13.8 21.2 10.0 44 4.5
Mullerian Mixed Cancer 15 14 100.0 0.0 0.0 0.0 7 0.0
Clear Cell Cancer 24 24 100.0 0.0 0.0 0.0 13 0.0
Malignant Brenner Tumor 5 4 50.0 0.0 50.0 0.0 3 0.0
Squamous Cell Ca. 1 1 100.0 0.0 0.0 0.0 1 0.0
Sex cord- Stromal tumors 10 10 60.0 10.0 0.0 30.0 8 0.0
Yolk Sack Tumor 4 4 75.0 25.0 0.0 0.0 2 0.0
Undifferentiated Ca. 15 15 46.7 13.3 26.7 13.3 10 0.0
Histology
Other Rare Types 5 5 100.0 0.0 0.0 0.0 10 0.0
pT1 58 54 75.7 5.6 13.0 5.7 0.1343 25 0.0
pT2 36 32 78.0 6.3 6.3 9.4 19 0.0 pT Stage
pT3 99 88 58.0 15.9 18.1 8.0 58 1.7
G1 81 71 71.8 5.6 14.1 8.5 0.038 33 0.0
G2 91 82 72.0 11.0 12.1 4.9 52 0.0
Silverberg
Grade
G3 91 85 51.7 20.0 21.2 7.1 55 1.8
• *mucinous versus endometroid
25
4. Discussion
The results of this study show that ESR1 amplification is rare in ovarian cancers
(2.1%).
More than one third of ovarian tumors showed immunohistochemically detectable
ER protein expression, most abundant in serous and endometroid subtypes. This
is in line with previous studies done on the classical paraffin blocks. The good
concordance between our data and previous studies demonstrates the
representativity of our TMA data obtained on a 0.6 mm tissue spot per tumor
(Rosen, 2004).
A small subset of ESR1 amplified ER positive cases was indeed found in ovarian
cancers. In comparison, some other genes showed higher rates of amplifications
in these cancers. For example, the amplification of ERBB2 ranges (0-66%) (Wu
et al 2003, Leary et al 1992), EGFR (3.65-12%) (Lassus et al 2006, Dimova et al
2006), CCND1 (0-19%) (Masciullo et al 1997, Courjal et al 1996, Diebold 2000),
C-MYC up to 54.5 (Wu et al 2003, Xin 1993, Bian et al 1995), and KRAS (31%)
(Bian et al 1995).
The significant frequency of ER positivity in ovarian cancers had prompted
treatment efforts using hormonal therapy early on (Long RT and Evans AM
1963). In addition their relatively little toxicity was another provoking factor to
continue going on to achieve more advance in this therapeutic field. Monotherapy
studies using tamoxifen, Aromatase inhibitors and GnRH analogues had yielded
variable results with objective response rates ranging between 0 and 56%
(Perez-Gracia and Carrasco 2002, Makar 2000, Clinton and Hua 1997, Cunat et
al 2004, Li et al 2007, Papadimitriou et al 2004, Balbi et al 2004, Trope et al
2000, Levine et al 2007).
26
Combinatorial treatment regimens combining tamoxifen and goserelin or
tamoxifen and Gefitinib had obtained results with objective response rates of up
to 11, 5% (Hasan et al 2005, Wagner et al 2007). Few of these studies had
selected patients based on the immunohistochemically determined ER status. It
is therefore unclear, whether the ER expression level has any impact on the
likelihood of response, or this just reflects the lack of establishment of well
organized treatment strategy in previously heavily treated patients and who in
significant part already suffered from advanced disease.
The role of ER expression for response prediction to anti-hormonal drugs has
been much better studied in breast cancer, where a strong association between
ER positivity and response to anti-hormonal drugs is well established. However,
also in breast cancer, not all ER positive cancers respond to tamoxifen and
related drugs (Massarweh and Schiff 2006, Higgins and Stearns 2009). In a
recent study we had found that ESR1 amplification may be strongly predict
tamoxifen response among ER positive breast cancers. More than 20% of breast
cancers had amplified or at least elevated ESR1 copy number (Holst et al 2007).
Possible explanations for the predictive effect of ESR1 amplification could be a
particularly high expression of amplified as compared to non amplified cancers.
Alternatively, it could be speculated, that ESR1 amplified are more dependent on
the ER-pathway than other tumors that express ER together with many other
growth receptors. If this latter hypothesis was true, visualization of ESR1
amplification would pinpoint towards an “Achilles tendon” of a tumor that could be
most successfully targeted.
27
The frequency of ESR1 amplified ovarian cancers (2.1%) is much lower than that
in breast cancer. Interestingly, this fraction somehow parallels the percentage of
ovarian cancers reported to show strong responses to hormonal therapies. For
example, in retrospective analysis was conducted of patients who received
tamoxifen at a dose 20 mg twice daily for the treatment of advanced epithelial
ovarian cancer, Karagola et al found that out of twenty-nine eligible patients were
included to the study there were 1 (3%) complete response, 2 (7%) partial
response, 6 (21%) stable disease, and 20 (69%) progressive disease (Karagol et
al 2007) (41). Papadimitriou et al have studied response rate in twenty-seven
patients treated with letrozole at a dose of 2.5 mg once a day. Patients with
measurable or evaluable disease (n = 21) and those with only increasing CA 125
serum levels (n = 6) were eligible. Among the 21 patients with measurable or
evaluable disease, observed one complete response (5%) and two partial
responses (10%) for an objective response rate of 15%. Other studies, in which
the combined regiment had been implicated, Patients were given oral tamoxifen
20 mg twice daily on a continuous basis and subcutaneous goserelin 3.6 mg
once a month until disease progression. In total 26 patients entered this study, of
which 17 had platinum-resistant disease, using the definition of endocrine
response that included patients with stable disease (SD) of 6 months or greater,
the overall response rate (clinical benefit rate) was 50%. This included one
complete response (CR) (3.8%), two partial responses (PR) (7.7%) and 10
patients with SD (38.5%).
28
5. Conclusion
ESR1 amplification is an uncommon mechanism for ER overexpression in
ovarian cancer occurring in about 2.1% of the total number of ovarian cancers. In
general, this frequency parallels the fraction of ovarian cancers reported to show
complete response to anti-estrogenic therapies. Given the strong predictive
power of ESR1 amplification for response to tamoxifen in breast cancer, an
evaluation of such treatments in ESR1 amplified ovarian cancers appears
justified.
29
6. Abstract:
Amplification of the gene encoding estrogen receptor alpha occurs in about 20%
of breast cancers and is an important mechanism for estrogen receptor
overexpression in this tumor type. In ovarian cancer, overexpression of estrogen
receptor protein has been described in more than two thirds of cases. To study a
potential role of estrogen receptor alpha gene amplification for estrogen receptor
overexpression in ovarian cancer, a tumor tissue microarray containing 428
ovarian caners was analyzed by fluorescence in-situ hybridization for estrogen
receptor alpha gene amplification and immunohistochemistry for estrogen
receptors expression. The estrogen receptor alpha gene status was successfully
determined in 243/428 arrayed cancers. Estrogen receptor gene amplification
was found in 5/243 (2%) of tumors. Amplification levels were usually low with 4-8
estrogen receptor alpha gene copies. However, one case had a high level
amplification with more than 30 estrogen receptor alpha gene copies. All 5
amplified tumors were estrogen receptors positive with 3/5 tumors showing
highest (Allred score 7-8) estrogen receptor levels. The data demonstrate that
estrogen receptor alpha amplification occurs only rarely in ovarian cancer.
Keywords: Ovarian cancers, Estrogen receptor alpha gene, Estrogen receptors,
Fluorescence in-situ hybridization, Immunohistochemistry.
30
7. References:
Balbi G, Piano LD, Cardone A, Cirelli G. Second-line therapy of advanced ovarian
cancer with GnRH analogs. Int J Gynecol Cancer 2004; 14:799-803.
Bian M, Fan Q, Huang S. [Amplification of proto-oncogenes C-myc, C-N-ras, C-
Ki-ras, C-erbB2 in ovarian carcinoma]. Zhonghua Fu Chan Ke Za Zhi 1995;
30:406-9.
Boecker W., Denk H.; Heitz Ph. U.: Pathologie, Urban & Fischer, 3. Edition, 2004,
909-918 PP.
Cardillo MR, Petrangeli E, Aliotta N, et al. Androgen receptors in ovarian tumors:
correlation with oestrogen and progesterone receptors in an
immunohistochemical and semiquantitative image analysis study. J Exp Clin
Cancer Res 1998; 17:231-7.
http://www.cancer.gov/cancertopics/understandingcancer/estrogenreceptors/
Choudhury KR, Yagle KJ, Swanson PE, Krohn KA, Rajendran JG. A Robust
Automated Measure of Average Antibody Staining in Immunohistochemistry
Images. J Histochem Cytochem. 2009 Aug 17. [Epub ahead of print]
Clinton GM, Hua W: Estrogen action in human ovarian cancer. Crit Rev Oncol
Hematol 1997; 25:1-9.
Courjal F, Louason G, Speiser P, Katsaros D, Zeillinger R, Theillet C. Cyclin gene
amplification and overexpression in breast and ovarian cancers: evidence for the
selection of cyclin D1 in breast and cyclin E in ovarian tumors. Int J Cancer 1996;
69:247-53.
31
Cunat S, Hoffmann P, Pujol P: Estrogens and epithelial ovarian cancer. Gynecol
Oncol 2004; 94:25-32.
Dahlman-Wright K, Cavailles V, Fuqua SA, Jordan VC, Katzenellenbogen JA,
Korach KS, Maggi A, Muramatsu M, Parker MG, Gustafsson JA. International
Union of Pharmacology. LXIV. Estrogen receptors. Pharmacol Rev. 2006 Dec;
58(4):773-81.
De Sousa Damião R, Fujiyama Oshima CT, Stávale JN, Gonçalves WJ. Analysis
of the expression of estrogen receptor, progesterone receptor and chicken
ovalbumin upstream promoter-transcription factor I in ovarian epithelial cancers
and normal ovaries. Oncol Rep 2007; 18:25-32.
Diebold J, Mösinger K, Peiro G, et al. 20q13 and cyclin D1 in ovarian carcinomas.
Analysis by fluorescence in situ hybridization. J Pathol 2000; 190:564-71.
Dimova I, Raitcheva S, Dimitrov R, Doganov N & Toncheva D. Correlations
between c-myc gene copy-number and clinicopathological parameters of ovarian
tumours. Eur J Cancer 2006; 42:674-9.
Farinola MA, Gown AM, Judson K, et al. Estrogen receptor alpha and
progesterone receptor expression in ovarian adult granulosa cell tumors and
Sertoli-Leydig cell tumors. Int J Gynecol Pathol 2007; 26:375-82.
Geselschaft epidemiologischer krebsregister in Deutschlan: Krebs in
Deutschland” 5. Ausgabe, Saarbrüken, 2006.
32
Harvey JM, Clark GM, Osborne CK, Allred DC. Estrogen receptor status by
immunohistochemistry is superior to the ligand-binding assay for predicting
response to adjuvant endocrine therapy in breast cancer. J Clin Oncol 1999;
17:1474-81.
Hasan J, Ton N, Mullamitha S, et al. Phase II trial of tamoxifen and goserelin in
recurrent epithelial ovarian cancer. Br J Cancer 2005; 93:647-51.
Higgins MJ, Stearns V. Understanding resistance to tamoxifen in hormone
Receptor-positive breast cancer. Clin Chem. 2009 Aug; 55(8):1453-5. Epub 2009
Jun 18.
Høgdall EV, Christensen L, Høgdall CK, et al. Prognostic value of estrogen
receptor and progesterone receptor tumor expression in Danish ovarian cancer
patients: from the 'MALOVA' ovarian cancer study. Oncol Rep 2007; 18:1051-9.
Holst F, Stahl PR, Ruiz C, et al. Estrogen receptor alpha (ESR1) gene
amplification is frequent in breast cancer. Nat Genet. 2007; 39:655-60.
Ho SM: Estrogen, progesterone and epithelial ovarian cancer. Reprod Biol
Endocrinol 2003; 1:73.
Ito I, Hanyu A, Wayama M, Goto N, Katsuno Y, Kawasaki S, Nakajima Y, Kajiro
M, Komatsu Y, Fujimura A, Hirota R, Murayama A, Kimura K, Imamura T,
Yanagisawa J. Estrogen inhibits transforming growth factor beta signaling by
promoting Smad2/3 degradation. J Biol Chem. 2010 May 7;285(19):14747-55.
33
Karagol H, Saip P, Uygun K, et al. The efficacy of tamoxifen in patients with
advanced epithelial ovarian cancer. Med Oncol 2007; 24:39-43.
Klinge CM. Estrogen receptor interaction with estrogen response elements.
Nucleic Acids Res. 2001 Jul 15;29(14):2905-19.
Kommoss F, Pfisterer J, Thome M, Schäfer W, Sauerbrei W, Pfleiderer A. Steroid
receptors in ovarian carcinoma: immunohistochemical determination may lead to
new aspects. Gynecol Oncol 1992; 47:317-22.
Kurman RJ, editor. Blaustein's pathology of the female genital tract. 5th ed.
Springer: New York; 2002, 791pp.
Langdon SP, Crew AJ, Ritchie AA, et al. Growth inhibition of oestrogen receptor-
positive human ovarian carcinoma by anti-oestrogens in vitro and in a xenograft
model. Eur J Cancer 1994; 30A:682-6.
Lassus H, Sihto H, Leminen A, et al. Gene amplification, mutation, and protein
expression of EGFR and mutations of ERBB2 in serous ovarian carcinoma. J Mol
Med 2006; 84:671-81.
Leary JA, Edwards BG, Houghton CR, Kefford RF & Friedlander ML.
Amplification of HER-2/neu oncogene in human ovarian cancer. Int J Gynecol
Cancer 1992; 2:291-4.
Levine D, Park K, Juretzka M, et al. Phase II evaluation of goserelin and
bicalutamide in patients with ovarian cancer in second or higher complete clinical
disease remission. Cancer 2007; 110:2448-56.
34
Li YF, Hu W, Fu SQ, Li JD, Liu JH, Kavanagh JJ. Aromatase inhibitors in ovarian
cancer: is there a role? Int J Gynecol Cancer 2007. [Epub ahead of print]
Lindgren PR, Cajander S, Bäckström T, Gustafsson JA, Mäkelä S, Olofsson JI.
Estrogen and progesterone receptors in ovarian epithelial tumors. Mol Cell
Endocrinol. 2004; 221:97-104.
Lindgren P, Backstrom T, Mahlck C G, Ridderheim M & Cajander S. Steroid
receptors and hormones in relation to cell proliferation and apoptosis in poorly
differentiated epithelial ovarian tumors. Int J Oncol 2001; 19: 31-8.
LONG RT, EVANS AM. DIETHYLSTILBESTROL AS A CHEMOTHERAPEUTIC
AGENT FOR OVARIAN CARCINOMA. Mo Med. 1963 Dec;60:1125-7.
Makar AP: Hormone therapy in epithelial ovarian cancer. Endocr Relat Cancer
2000; 7:85-93.
Masciullo V, Scambia G, Marone M, et al. Altered expression of cyclin D1 and
CDK4 genes in ovarian carcinomas. Int J Cancer 1997; 74: 390-5.
Massarweh S, Schiff R. Resistance to endocrine therapy in breast cancer:
exploiting estrogen receptor/growth factor signaling crosstalk. Endocr Relat
Cancer. 2006 Dec;13 Suppl 1:S15-24.
Papadimitriou CA, Markaki S, Siapkaras J, et al. Hormonal therapy with
letrozole for relapsed epithelial ovarian cancer. Long-term results of a phase II
study. Oncology 2004; 66:112-7.
35
Perez-Gracia JL, Carrasco E M. Tamoxifen therapy for ovarian cancer in the
adjuvant and advanced settings: systematic review of the literature and
implications for future research. Gynecol Oncol 2002; 84:201-9.
Robbins and Cortan. Pathologic Basis of Disease. 7th. Kumar. Abbas. Fausto.
1092-1104pp.
Rosai and Akermann’s Surgical Pathology. Ninth edition, 2004. 1649- 1736 pp.
Rosen DG, Huang X, Deavers MT, Malpica A, Silva EG &Liu J. Validation
of tissue microarray technology in ovarian carcinoma. Mod Pathol 2004; 17:790-
7.
Shih IeM, Kurman RJ. Ovarian tumorigenesis: a proposed model based on
morphological and molecular genetic analysis. J Pathol. 2004 May;164 (5):1511-
8.
Smyth JF, Gourley C, Walker G, et al. Antiestrogen therapy is active in selected
ovarian cancer cases: the use of letrozole in estrogen receptor-positive patients.
Clin Cancer Res 2007; 13:3617-22.
Tavassoli FA, Devilee P (Eds): World Health organization Classification of
Tumors.
Pathology and Genetics. Tumors of the Breast and Female Genital Organs. IARC
Press, Lyon, 2003, pp. 113-202.
Teufel G, Geyer H, de Gregorio G, et al. [Estrogen and progesterone
receptors in malignant ovarian neoplasms]. Geburtshilfe Frauenheilkd 1983;
43:732-40.
36
Trope C, Marth C, Kaern J. Tamoxifen in the treatment of recurrent ovarian
carcinoma. Eur J Cancer 2000; 36 Suppl 4:S59-61.
Van Doorn HC, Burger CW, van der Valk P. & Bonfrer HM. Oestrogen,
progesterone, and androgen receptors in ovarian neoplasia: correlation between
immunohistochemical and biochemical receptor analyses. J Clin Pathol 2000;
53: 201-5.
Vang R, Whitaker BP, Farhood AI, Silva EG, Ro JY, Deavers MT.
Immunohistochemical analysis of clear cell carcinoma of the gynecologic tract. Int
J Gynecol Pathol 2001; 20:252-9.
Vang R, Gown AM, Barry TS, Wheeler DT & Ronnett BM. Immunohistochemistry
for estrogen and progesterone receptors in the distinction of primary and
metastatic mucinous tumors in the ovary: an analysis of 124 cases. Mod Pathol
2006; 19: 97-105.
Van Mieghem T, Abeler VM, Moerman P, Verbist L, Vergote I, Amant F. Gynecol:
CD10, estrogen and progesterone receptor expression in ovarian adenosarcoma.
Gynecol Oncol 2005; 99:493-6.
Wagner U, du Bois A, Pfisterer J, et al. AGO Ovarian Cancer Study Group:
Gefitinib in combination with tamoxifen in patients with ovarian cancer refractory
or resistant to platinum-taxane based therapy--a phase II trial of the AGO Ovarian
Cancer Study Group (AGO-OVAR 2.6). Gynecol Oncol 2007; 105:132-7.
Wagner U, Bubendorf L, Gasser TC, et al. Chromosome 8p deletions are
associated with invasive tumor growth in urinary bladder cancer. Am J Pathol.
1997; 151:753-9.
37
Wu R, Lin L, Beer DG, Ellenson LH, et al. Amplification and overexpression of the
L-MYC proto-oncogene in ovarian carcinomas. Am J Pathol 2003; 162:1603-10.
Xin XY. [The amplification of c-myc, N-ras, c-erb B oncogenes in ovarian
malignancies]. Zhonghua Fu Chan Ke Za Zhi 1993; 28:405-7, 42.
Zhu BT, Han GZ, Shim JY, Wen Y, Jiang XR. Quantitative structure-activity
relationship of various endogenous estrogen metabolites for human estrogen
receptor alpha and beta subtypes: Insights into the structural determinants
favoring a differential subtype binding. Endocrinology. 2006 Sep;147(9):4132-50.

38
8. Acknowledgement:
We are grateful to Ms Michaela Härtling, Ms Sandra Schmidt, Ms Silvia Schnöger
and Mr Sascha Eghtessadi for excellent technical assistance in
immunohistochemistry and FISH analysis, and to Ms Martina Mirlacher for tumor
tissue microarray making.

39
10. Eidesstattliche Versicherung Ich versichere ausdrücklich, dass ich die Arbeit selbständig und ohne fremde Hilfe verfasst, andere als die von mir angegebenen Quellen und Hilfsmittel nicht benutzt und die aus den benutzten Werken wörtlich oder inhaltlich entnommenen Stellen einzeln nach Ausgabe (Auflage und Jahr des Erscheinens), Band und Seite des benutzten Werkes kenntlich gemacht habe. Ferner versichere ich, dass ich die Dissertation bisher nicht einem Fachvertreter an einer anderen Hochschule zur Überprüfung vorgelegt oder mich anderweitig um Zulassung zur Promotion beworben habe. Datum


