experimental investigation into the effect of stressarchimed.uni-mainz.de/pub/2000/0098/diss.pdf ·...
TRANSCRIPT
7. November 2000 1
Experimental investigation into the effect of stress
on dissolution and growth of very soluble
brittle salts in aqueous solution
Dissertation zur Erlangung des Grades
"Doktor der Naturwissenschaften"
am Fachbereich Geowissenschaften
der Johannes Gutenberg-Universität in Mainz
Jacques Morel, geboren am 21.09.1974 in Quimper
Mainz, September 2000
Erklärung 7. November 2000 2
Erklärung
Ich versichere hiermit, die vorliegende Arbeit selbständig und nur unter Verwendungder angegebenen Quellen und Hilfsmittel verfaßt zu haben.
Mainz, September 2000 Jacques Morel
Datum der Prüfung: 8 novembre 2000
Abstract 7. November 2000 3
Abstract
The study of dissolution and growth processes at a solid-fluid interface under non-hydrostatic stresses is essential for the understanding of the deformation mechanismsthat are active in the Earth's crust. Among these, pressure solution is the most importantductile deformation mechanism at diagenetic to low to medium-grade metamorphicconditions. However, it is still poorly understood which mechanical, physical orchemical potential energy gradients drive pressure solution. Commonly, pressuresolution is assumed to be driven either by differences in crystal plastic strain energy, orby differences in grain boundary surface normal stress. Differences in elastic strainenergy are thought to be much too small to play any significant role and are for thisreason commonly neglected as a possible driving force for pressure solution. However,recent experimental as well as theoretical investigations have shown that elastic strainmay in fact strongly influence the dissolution and growth mechanisms of crystals insolution. As deformation mechanisms occurring in the Earth's crust mostly take placewhile the rocks are elastically strained, it is very important to improve ourunderstanding of the effect of the elastic strain and define the role it may have duringdeformation by pressure solution in rocks. This thesis reports on an experimentalinvestigation into the effect of mechanical compressive stress on the dissolution andgrowth of single crystals of different very soluble elastic/brittle salts in aqueoussolution. These salts were chosen as analogues for rock-forming minerals such asquartz or calcite. The effect of stress on the surface dissolution microstructures wasstudied on potassium alum single crystals. Dissolution grooves, 20-40 µm wide, 10-40µm deep and about 20-80 µm apart from each other, developed in the highest stressedregions of the crystals, and disappeared as soon as the stress was taken off. The grooveswere oriented parallel to low index crystallographic directions, and sub-perpendicularto the local maximum compressive stress trajectories. The size of the dissolutiongrooves depended on the local surface stress, the surface energy and the degree ofundersaturation of the aqueous solution. The microstructural evolution of the crystalsurface was found to be in good agreement with theoretical predictions based on themodel of Heidug & Leroy (1994) and Leroy & Heidug (1994). The effect of stress onthe dissolution rate was investigated on sodium chlorate single crystals. The stressedcrystals dissolved faster than the crystals left stress-free. The experimentally observedincrease in the dissolution rate of the stressed crystals was one to two orders ofmagnitude stronger than theoretically predicted on the basis of the increaseddissolution driving force due to the increase in the bulk stored elastic energy. Thedissolution rate increased linearly with the stress and the increase was larger withincreasing degree of undersaturation. Finally, the effect of the stress on crystal growthwas studied using potassium alum and potassium dihydrogen phosphate single crystals.The growth rate of {100} and {110} faces of potassium alum was strongly decreasedon the application of stress, by an amount much larger than theoretically predicted onthe basis of the decreased crystal growth driving force due to the increase in the bulkstored elastic energy. For all these results, the roughness of the crystal surface played akey role, by inducing a non-homogeneous stress distribution on the crystal surface. Theresults show that elastic strain may play a significant role during pressure solution, and
Abstract 7. November 2000 4
that elastic strain gradients may eventually cause significant deformation in the uppercrust. Hence, elastic strain should be taken into account while defining microphysicaldeformation models.
Kurzfassung 7. November 2000 5
Kurzfassung
Das Studium der Auflösungs- und Wachstumsprozesse an Feststoff-Flüssigkeits-Grenzflächen unter nicht-hydrostatischen Beanspruchungen ist wesentlich für dasVerständnis von Defor-mationsprozessen, die in der Erde ablaufen. Unter diesengenannten Prozessen gehört die Drucklösung zu den wichtigsten duktilenDeformationsprozessen, von der Diagenese bishin zur niedrig- bis mittelgradigenmetamorphen Bedingungen. Bisher ist allerdings wenig darüber bekannt, welchemechanischen, physikalischen oder chemischen Potentialenergie-Gradienten dieDrucklösung steuern. I.a. wird angenommen, daß die Drucklösung durch Un-terschiede kristallplastischer Verformungsenergien oder aber durch Unterschiede derNormal-beanspruchung an Korngrenzen gesteuert wird. Unterschiede der elastischenVerformungs-energien werden dabei allerdings als zu gering erachtet, um einensignifikanten Beitrag zu leisten. Aus diesem Grund werden sie als mögliche treibendeKräfte für die Drucklösung vernachlässigt. Andererseits haben neue experimentelleund theoretische Untersuchungen gezeigt, daß die elastische Verformung in der Tateinen starken Einfluß auf Lösungs- und Wachstumsmechanismen von Kristallen ineiner Lösung haben kann. Da die in der Erdkruste vorherrschendenDeformationsmechanismen überwiegend im elastischen Verformungsbereich derGesteine ablaufen, ist es sehr wichtig, das Verständnis für die Effekte, die die elastischeVerformung verursacht, zu erweitern, und ihre Rolle während der Deformation durchDrucklösung zu definieren. Die vorliegende Arbeit beschäftigt sich mit Experimenten,bei denen der Effekt der mechanisch kompressiven Beanspruchung auf Lösungs- undWachstumsprozesse von Einzelkristallen unterschiedlicher, sehr gut löslicher,elastisch/spröder Salze untersucht wurde. Diese Salze wurden als Analogagesteinsbildender Minerale wie Quarz und Calcit ausgewählt. Der Einfluß von Stressauf die Ausbildung der Oberflächenmikrostrukturen in einer untersättigten Lösungwurde an Kaliumalaun untersucht.
Lösungsrillen (20 – 40 µm breit, 10 – 40 µm tief und 20 – 80 µm Abstand) entwickeltensich in den Bereichen, in denen die Beanspruchung im Kristall am größten war. Sieverschwanden wieder, sobald der Kristall entlastet wurde. Diese Rillen entwickeltensich parallel zu niedrig indizierten kristallographischen Richtungen und sub-perpendikular zu den Trajektorien, die der maximalen, lokalen kompressivenBeanspruchung entsprachen. Die Größe der Lösungsrillen hing von der lokalenOberflächenbeanspruchung, der Oberflächenenergie und dem Untersättigungsgrad derwässrigen Lösung ab. Die mikrostrukturelle Entwicklung der Kristalloberflächenstimmte gut mit den theoretischen Vorhersagen überein, die auf den Modellen vonHeidug & Leroy (1994) und Leroy & Heidug (1994) basieren. Der Einfluß derBeanspruchung auf die Auflösungsrate wurde an Natriumchlorat-Einzelkristallenuntersucht. Dabei wurde herausgefunden, daß sich gestresste Kristalle schneller lösenals Kristalle, auf die keine Beanspruchung einwirkt. Der experimentell beobachteteAnstieg der Auflösungsrate der gestressten Kristalle war ein bis zweiGrößenordnungen höher als theoretisch erwartet. Die Auflösungsrate stieg linear mitdem Stress an, und der Anstieg war um so größer, je stärker die Lösung untersättigt
Kurzfassung 7. November 2000 6
war. Außerdem wurde der Effekt der Bean-spruchung auf das Kristallwachstum anKaliumalaun- und Kaliumdihydrogenphosphat-Ein-zelkristallen untersucht. DieWachstumsrate der Flächen {100} und {110} von Kalium-alaun war beiBeanspruchung stark reduziert. Für all diese Ergebnisse spielte dieOberflächenrauhigkeit der Kristalle eine Schlüsselrolle, indem sie eine nicht-homogene Stressverteilung auf der Kristalloberfläche verursachte. Die Resultatezeigen, daß die elastische Verformung eine signifikante Rolle während derDrucklösung spielen kann, und eine signifikante Deformation in der oberen Krusteverursachen kann, bei Beanspruchungen, die geringer sind, als gemeinhinangenommen wird. Somit folgt, daß die elastische Bean-spruchung berücksichtigtwerden muß, wenn mikrophysikalische Deformationsmodelle entwickelt werdensollen.
Table of contents. 7. November 2000 7
Table of contents.
Chapter 1. The concept of pressure solution.
1.1) Introduction 12
1.2) History of research into pressure solution 14
1.3) Investigation of the driving force for pressure solution 15
1.3.1) The film diffusion model 15
1.3.2) The undercutting model 15
1.4) Experiments on pressure solution 16
1.4.1) Experiments on NaCl 16
1.4.2) Experiments on elastic/brittle salts 17
1.5) Investigation of the effect of elastic strain on growth and dissolution 18
1.5.1) Experimental approach 18
1.5.2) Theoretical approach 19
1.5.2.1) Starting conditions 19
1.5.2.2) Application of stress 20
1.5.2.3) Effect of small disturbances on the surface 21
1.5.2.4) Alternative models 22
Table of contents. 7. November 2000 8
Chapter 1. Figures 24
Chapter 2. Experimental procedures.
2.1) Materials used 26
2.1.1) Potassium alum 26
2.1.2) Sodium chlorate 27
2.2) Samples preparation 27
2.2.1) Potassium alum 27
2.2.2) Sodium chlorate 28
2.2.3) Aqueous solution 28
2.3) Experimental set-up and procedures 29
2.3.1) Description of the apparatus 29
2.3.2) Experimental procedure 29
2.4) Estimation of the stress around the hole 30
2.5) In-situ experiments 31
Chapter 2. Figures 32
Chapter 3. Effect of stress on surface microstructures.
3.1) Description of the dissolution features 39
3.1.1) Stress-free crystals 39
3.1.2) Stressed crystals 39
Table of contents. 7. November 2000 9
3.1.2.1) Localisation and orientation of the grooves 40
3.1.2.2) Structure and shape of the grooves 41
3.2) Mechanism of formation of the grooves 41
3.2.1) Stability of stress-free crystal surfaces 41
3.2.1.1) Influence of the surface energy 41
3.2.1.2) Periodic bond chains 42
3.2.2) Stability of stressed crystal surfaces 43
3.2.2.1) Influence of the stress distribution on the surface 43
3.2.2.2) Relation between A-type grooves and PBC-directions 44
3.2.2.3) Formation of a dissolution groove network 44
3.2.2.4) Role of stress trajectories 45
3.2.3) Could crystal plastic strain play a role? 45
3.2.4) Influence of stirring 46
3.3) In-situ experiments 46
3.3.1) Experimental procedures 47
3.3.2) Experimental observations 47
3.3.3) Discussion of in-situ results 48
3.4) Theoretical approach 49
3.4.1) Estimation of the equilibrium configuration 50
3.4.2) Influence of small variations in the parametres 51
3.4.3) Relation between stress and A-type groove size 51
3.5) Conclusion 52
Table of contents. 7. November 2000 10
Chapter 3. Tables and figures 54
Chapter 4. Dissolution rate of sodium chlorate.
4.1) Experimental procedures 77
4.2) Results 77
4.3 ) Discussion 78
4.4) Conclusion 81
Chapter 4. Tables and figures 82
Chapter 5. Effect of stress on growth processes.
5.1) Starting materials sample preparation 88
5.1.1) Potassium dihydrogen phosphate 88
5.1.2) Potassium alum 89
5.1.3) Preparation of the aqueous solutions 89
5.2) Experimental procedures 90
5.3) Results 90
5.4) Discussion 91
5.5) Conclusion 92
Table of contents. 7. November 2000 11
Chapter 5. Tables and figures 94
Chapter 6. Summary and conclusions. 101
References 105
Appendix 1 114
Lebenslauf
Chapter 1 The concept of pressure solution. 7. November 2000 12
Chapter 1 The concept of pressure solution.
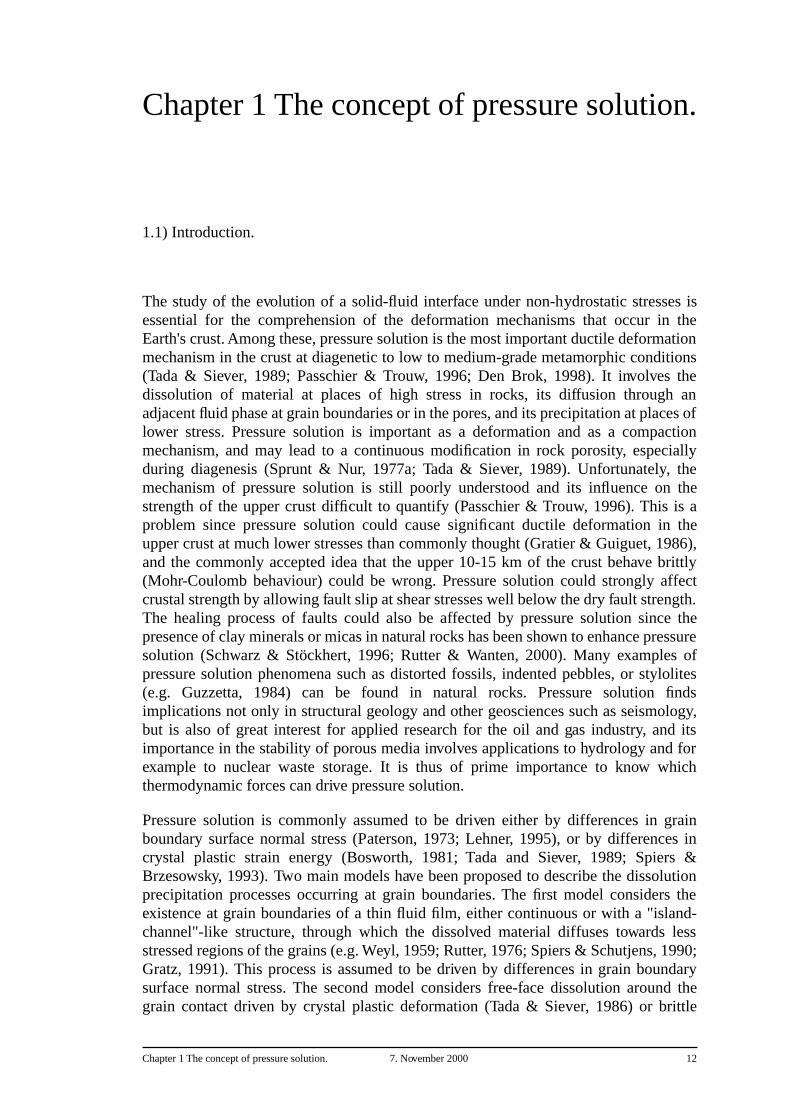
1.1) Introduction.
The study of the evolution of a solid-fluid interface under non-hydrostatic stresses isessential for the comprehension of the deformation mechanisms that occur in theEarth's crust. Among these, pressure solution is the most important ductile deformationmechanism in the crust at diagenetic to low to medium-grade metamorphic conditions(Tada & Siever, 1989; Passchier & Trouw, 1996; Den Brok, 1998). It involves thedissolution of material at places of high stress in rocks, its diffusion through anadjacent fluid phase at grain boundaries or in the pores, and its precipitation at places oflower stress. Pressure solution is important as a deformation and as a compactionmechanism, and may lead to a continuous modification in rock porosity, especiallyduring diagenesis (Sprunt & Nur, 1977a; Tada & Siever, 1989). Unfortunately, themechanism of pressure solution is still poorly understood and its influence on thestrength of the upper crust difficult to quantify (Passchier & Trouw, 1996). This is aproblem since pressure solution could cause significant ductile deformation in theupper crust at much lower stresses than commonly thought (Gratier & Guiguet, 1986),and the commonly accepted idea that the upper 10-15 km of the crust behave brittly(Mohr-Coulomb behaviour) could be wrong. Pressure solution could strongly affectcrustal strength by allowing fault slip at shear stresses well below the dry fault strength.The healing process of faults could also be affected by pressure solution since thepresence of clay minerals or micas in natural rocks has been shown to enhance pressuresolution (Schwarz & Stöckhert, 1996; Rutter & Wanten, 2000). Many examples ofpressure solution phenomena such as distorted fossils, indented pebbles, or stylolites(e.g. Guzzetta, 1984) can be found in natural rocks. Pressure solution findsimplications not only in structural geology and other geosciences such as seismology,but is also of great interest for applied research for the oil and gas industry, and itsimportance in the stability of porous media involves applications to hydrology and forexample to nuclear waste storage. It is thus of prime importance to know whichthermodynamic forces can drive pressure solution.
Pressure solution is commonly assumed to be driven either by differences in grainboundary surface normal stress (Paterson, 1973; Lehner, 1995), or by differences incrystal plastic strain energy (Bosworth, 1981; Tada and Siever, 1989; Spiers &Brzesowsky, 1993). Two main models have been proposed to describe the dissolutionprecipitation processes occurring at grain boundaries. The first model considers theexistence at grain boundaries of a thin fluid film, either continuous or with a "island-channel"-like structure, through which the dissolved material diffuses towards lessstressed regions of the grains (e.g. Weyl, 1959; Rutter, 1976; Spiers & Schutjens, 1990;Gratz, 1991). This process is assumed to be driven by differences in grain boundarysurface normal stress. The second model considers free-face dissolution around thegrain contact driven by crystal plastic deformation (Tada & Siever, 1986) or brittle
Chapter 1 The concept of pressure solution. 7. November 2000 13
deformation at the grain contact (Ostapenko, 1968, 1975). In none of the models,however, differences in elastic strain energy have been considered as a potential drivingforce for pressure solution. Theoretically, the potential energy drop associated withdifferences in elastic strain energy is two to three orders of magnitude smaller than theone due to differences in crystal plastic strain energy, or the one due to differences ingrain boundary surface normal stress (Paterson, 1973; Shimizu, 1995). Recentexperimental (e.g. Ristic et al. 1997a & b) as well as theoretical work (e.g. Heidug &Leroy, 1994; Leroy & Heidug, 1994) shows, however, that elastic strain energy mayhave a much larger influence than commonly thought. The geometry of the solid-fluidinterface and the crystallographic orientation of the solid also appear to be essentialparameters.
This thesis presents experimental evidence that mechanically induced compressiveelastic strain may strongly affect the dissolution process of elastic/brittle salts, when nograin boundary surface normal stress and no crystal plastic strain are present. Theexperimental results are compared with theoretical predictions. In this first chapter, abrief historical and theoretical overview of the concept of pressure solution is given.The two main models describing pressure solution are presented, and the use of elastic/brittle salts as rock analogue materials is justified. Finally, the model of Heidug &Leroy (1994) and Leroy & Heidug (1994), that will be used as a theoretical support forour experimental observations, is described.
The second chapter describes the experimental set-up and the two materials mostlyused in this work, i.e. potassium alum (K-alum) and sodium chlorate. The preparationof the crystal samples and the experimental procedures are explained in detail.
The third and fourth chapters present the results obtained on the influence ofmechanically applied compressive stress on the behaviour of the single crystals inundersaturated solution. The effect of stress on the microstructures of the crystalsurface of K-alum is presented in the third chapter. The stress-induced dissolutionfeatures observed are described in detail and their origin related to the crystallographyof K-alum and to the stress distribution in the samples. The development of thesestructures is studied experimentally and compared with theoretical models andmechanical considerations. The effect of stress on the kinetics of dissolution of sodiumchlorate is studied in the fourth chapter. The observed increase in dissolution rate dueto the stress is compared with theoretical calculations on the bulk stored elastic strainenergy. The cause of this increased dissolution rate is discussed and related to theresults obtained in the third chapter.
Some results obtained on the effect of stress on the growth of K-alum and potassiumdihydrogen phosphate (KDP) single crystals in solution are presented in a fifth chapter.Finally, the results are summarised and conclusions are drawn in the sixth and lastchapter of this work.
Chapter 1 The concept of pressure solution. 7. November 2000 14
1.2) History of research into pressure solution.
Pressure solution is a process during which stressed parts of a solid in contact with asaturated solution dissolve, the dissolved material diffuses along the solid-fluidinterface and precipitates at other parts of the solid that are not or less stressed.Considering this definition, we can probably attribute the first formulation of pressuresolution to Thompson (1862), who noted that applying stress to both a solid and a fluidphase in contact with each other had not the same effect that applying stress only on thesolid phase. Sorby (1863) was the first to apply Thompson's observation to geologicalproblems, attributing indentation pits seen at contacts between pebbles to pressuresolution. The non-hydrostatic thermodynamic theory developed by Gibbs (1878) gavethe mathematical tools necessary for a first quantitative approach in the interpretationof experimental and field observations. Following these steps, Riecke (1912) explainedthat if in a closed system two crystals were placed in contact with a saturated solutionand one of them was stressed, this system would not be in equilibrium any more andthe stressed crystal would start to dissolve, while the stress-free crystal would start togrow. From this idea he concluded that if a crystal was stressed only locally, thematerial dissolving there could precipitate again at other, stress-free places, of the samecrystal.
Russel (1935) showed for the first time with experiments carried out on ammonium-alum, that a single crystal locally stressed with an indenter and in contact with asaturated alum solution, dissolved in the immediate vicinity of the indenter, while itgrew at other places. Unfortunately, he did not specify the material used for theindenter and his results used as a proof of a pressure solution mechanism may in realitybe due to a chemical reaction between the crystal and the indenter. Den Brok & Melisa(1999, 2000) have shown, with the same kind of experiments also carried out on alum(potassium alum), that the indentation is driven by an oxidation reaction between themetal indenter and the weakly acid alum solution. The first observation of true, i.e.stress-driven pressure solution may probably be attributed to Correns (1949). Thisauthor showed, also using alum, that single crystals placed under differential stress in aslightly oversaturated solution dissolved in the direction of maximum stress and grewperpendicular to it, thus developing a crystal growth preferred orientation. Thisobservation was taken as a possible proof for the development of schistosity observedin nature. The mechanism of crystallographic preferred orientation development wasstudied by Kamb (1959), who pointed out the importance of crystal mechanicalanisotropy. All crystallographic directions do not behave similarly when stressed.Applying the thermodynamics of non-hydrostatically stressed solids to pressuresolution, Kamb (1959) also explained that a solid aggregate under differential stresscould never satisfy equilibrium with an interstitial pore fluid. According to him,solution mass transfer from highly stressed regions of the solid to less stressed regionswould lead to a permanent modification of the geometry of the system and hence to apermanent redistribution of the stress. It appeared then that the use of non-equilibriumthermodynamics was necessary for the description of pressure solution phenomena.This was first done by Lehner & Bataille (1984/1985).
Chapter 1 The concept of pressure solution. 7. November 2000 15
1.3) Investigation of the driving force for pressure solution.
Despite an increasing interest of researchers, the mechanism of pressure solution is stillpoorly understood, and the driving forces controlling it are not well identified. Twodifferent models have been proposed to describe the mechanisms driving pressuresolution in a wet solid polycrystalline aggregate (Weyl, 1959).
1.3.1) The film diffusion model.
In this model, an interfacial fluid film is assumed to be present at each grain boundaryof the aggregate. These films are interconnected. Pressure solution is assumed to bedriven by differences in surface normal stress through the grain boundaries. Thematerial that dissolves at places of high normal stress migrates through the fluid filmtowards places of lower normal stress. The fluid film is considered either as continuous(Weyl, 1959; Rutter, 1976; Robin, 1978; Rutter, 1983; Fig. 1.1), or as an "island-channel" structure (Raj & Chyung, 1981; Raj, 1982; Spiers & Schutjens, 1990). Thisstructure is formed by "islands" of grain to grain contacts (dry or with a very thin fluidlayer) separated by "channels" containing free fluid under hydrostatic pressure (Fig.1.1). The structure is described as dynamically stable , i.e. the islands and the channelschange continuously their position but their number and size stays on average the same.Gratz (1991) developed a pressure solution model assuming a static island-channelboundary structure, the channels being localised at microcracks that developperpendicular to the grain boundary (see also Den Brok, 1998).
Several mathematical equations have been proposed to calculate the rate ofdeformation of such a solid matrix by pressure solution, depending on the model usedto describe the grain boundary (see for example Den Brok, 1992 for a review).However, the deformation rates predicted by these different theories stays much lowerthan typical deformation rates measured for natural rocks (Den Brok, 1998).
1.3.2) The undercutting model.
The second model assumes that free-face dissolution around a grain to grain contact,driven by differences in crystal plastic strain energy (Tada & Siever, 1986) or bychemical reactions between grains of different composition and the fluid with whichthey are in contact (Den Brok & Melisa, 2000) leads to a time-dependent decrease inthe contact area, what causes an increase of the stress at the grain to grain contact. Thisincreased stress causes crystal plastic deformation to occur at the contact region (Tada& Siever, 1986, Fig. 1.2), or brittle cataclastic deformation of the contact region(Ostapenko, 1968, 1975). Pressure solution rate at the grain to grain contact isincreased until the contact region finally collapses.
Chapter 1 The concept of pressure solution. 7. November 2000 16
1.4) Experiments on pressure solution.
The goal of experimental work on pressure solution is to get results that will be able tohelp in the understanding of pressure solution in nature. The conditions of pressure,temperature and over all the timescale with which pressure solution takes place in theEarth's crust makes that laboratory experiments on geological material are difficult tocarry out. Reports on such experiments on rock forming minerals include e.g.Schutjens (1991), Elias & Hajash (1992), Rutter & Wanten (2000) for pressure solutionexperiments on quartz sand, Engelder (1982) on calcite, and De Meer & Spiers (1995,1999) on gypsum. Experiments are for this reason mostly performed on rock analoguematerials. These materials, which are characterised by a high solubility and fastkinetics of growth/dissolution at room temperature and atmospheric pressure, allow toget quantitative results in a quite short time.
1.4.1) Experiments on NaCl.
Among rock analogue materials, sodium chloride (halite, NaCl) was the most oftenused in pressure solution studies. NaCl is intensively studied to understand thebehaviour of natural rocksalt, e.g. for the behaviour of salt domes and for the use of saltaggregates as back-fill in holes in salt domes for the storage of nuclear waste (Spiers etal., 1986). Its fast kinetics of growth and dissolution gives the opportunity with thismaterial to get experimental results in a relatively short laboratory timescale. Resultson NaCl are therefore used as analogue for the deformation of rock-forming mineralssuch as quartz or calcite. Hence, NaCl has become one of the most used material forthe study of pressure solution phenomena. Different kind of experiments have beencarried out on this material with this aim to find out which of the above models givesthe best description of natural observations.
Indentation experiments have been carried out by Tada & Siever (1986), Hickman &Evans (1991), Gratier (1993) and Martin et al. (1999). In this kind of experiments, asingle crystal of halite in aqueous solution is stressed locally with either an indenter ofquartz (Tada & Siever, 1986; Hickman & Evans, 1991; Martin et al., 1999), of stainlesssteel (Gratier, 1993), or with another halite single crystal (Hickman & Evans, 1991;Martin et al., 1999) and the mechanisms of dissolution at the contact area and at itsperiphery are studied. Tada & Siever (1986) found in their experiments that pressuresolution took place by free-face dissolution around the indenter, combined with plasticdeformation under the indenter (see above). Gratier (1993) showed that themechanisms driving pressure solution could depend on the experimental conditions.When the solution was saturated, he found that pressure solution was controlled bydifferences in surface normal stress at the contact between the crystal and the indenter.Pressure solution took in that case place by fluid-film diffusion and its rate dependedon the indenter diameter. When the solution was slightly undersaturated, however,pressure solution took place by free-face dissolution around the indenter together withcrystal plastic deformation under the indenter, as found by Tada & Siever (1986), andthe identation rate was independent of the indenter diameter. Hickman & Evans (1991)
Chapter 1 The concept of pressure solution. 7. November 2000 17
showed that pressure solution may depend also on the nature of the contact between thecrystal and the indenter. When two halite lenses were pressed together in saturatedsolution, no pressure solution was observed (at least not at a measurably rate), whilewhen a silica lens was pressed against a halite lens, pressure solution was observed.According to Hickman & Evans (1991), pressure solution took place by fluid-filmdiffusion. Such an influence of the nature of the grain to grain contact have beenobserved on natural rocks, and may particularly be due to the presence ofphyllosilicates (Schwarz & Stöckhert, 1996; Rutter & Wanten 2000). This result showsthe importance of the chemistry of the system on pressure solution rate, and maysuggest an influence of mineral surface energy, on which depends the fluid wettingangle. The experiments from Tada & Siever (1986), Hickman & Evans (1991) andGratier (1993) were carried out with high stress values, conditions under which crystalplastic mechanisms may strongly influence the pressure solution process. Martin et al.(1999), however, used much lower stress to avoid crystal plastic deformation. Theyfound that the convergence rate between the halite crystal and the other crystal was notconstant but showed some periods of acceleration. They suggested that these variationsin rate could be caused by an episodic modification of the interface structure, like adynamically stable "island-channel" structure.
Free-face dissolution induced by crystal plastic strain was also observed by Bosworth(1981) on single crystals of NaCl in undersaturated solution. In his case, rectangularcrystal slabs with a cylindrical hole drilled in their middle were pre-stressed in airunder uniaxial load perpendicular to the axis of the hole, and then placed inundersaturated solution, without load. As a result of the non-homogeneous plasticstrain distribution around the hole, he observed that crystal regions that had undergonecrystal plastic deformation dissolved faster. Dissolution enhanced by a non-homogeneous plastic strain distribution around a centrally drilled hole was alsoobserved by Sprunt & Nur (1977b) on halite crystals and on samples of other materials(quartzite, granite, calcite and others) with the same geometry as used by Bosworth(1981) uniaxially loaded in solution, although for some of the other materialsmechanisms different than plastic deformation may have occurred.
Many pressure solution experiments have also been carried out on NaCl aggregates(e.g. Urai et al., 1986; Spiers & Schutjens, 1990; Spiers & Brzesowsky, 1993). In thatcase, for bulk stresses low enough to avoid crystal plasticity, the deformation rate of asalt aggregate by pressure solution is found to be inversely proportional to the cube ofthe grain size. These experiments yielded observations of pressure solution featuressuch as grain-to-grain indentation and contact truncation, and made the existence of"island-channel"-like grain boundaries during the pressure solution process very likely.
1.4.2) Experiments on elastic/brittle salts.
As rock deformation by pressure solution in the Earth's upper crust generally takesplace under conditions where plastic deformation plays no role, it may be questionedwhether NaCl, which can deform plastically very easily, is a good material to be usedas analogue material for the study of pressure solution. Den Brok et al. (1999a) havedemonstrated, using sodium chlorate, that plasticity does not seem to have a
Chapter 1 The concept of pressure solution. 7. November 2000 18
determinant role in pressure solution. These authors showed that sodium chloratecannot deform by crystal plastic mechanisms at room P-T conditions. However, theyfound that wet compacted sodium chlorate aggregates deform similarly to NaClaggregates under the same conditions. According to them, the use of NaCl as analoguematerial for pressure solution experiments seems therefore justified, in spite of itscrystal plastic behaviour. However, the same authors showed that microstructuraleffects such as grain boundary migration and rate dependent cataclastic behaviour,could occur in wet sodium chlorate as well (Den Brok et al., 1998; Den Brok et al.,1999b). As this material is extremely brittle, it seems likely that these processes weredriven by gradients in elastic strain energy. The interpretation of deformationmicrostructures observed in crustal rocks should thus be made carefully.
1.5) Investigation of the effect of elastic strain on growth and dissolution.
1.5.1) Experimental approach.
The results obtained by Den Brok et al. (1998, 1999a & b) show that differences inelastic strain may play a key role in pressure solution phenomena. Yet these differencesin elastic strain energy are commonly assumed not to play a significant role as a drivingforce for deformation by pressure solution (e.g., Paterson, 1973; Shimizu, 1995; Galand Nur, 1998). It can easily be shown that, theoretically, the potential energy dropassociated with differences in normal stress or differences in crystal plastic strain istwo to three orders of magnitude larger than the potential energy drop associated withdifferences in elastic strain energy at otherwise identical stresses (Paterson, 1973;Shimizu, 1995). However, it has been recently demonstrated that elastic strain canaffect the growth and dissolution rates of crystals in solution much stronger thantheoretically predicted. Ristíc et al. (1997a) have shown that elastic strain in sodiumchlorate single crystals induced by synchrotron radiation affects the thermodynamicequilibrium between the crystals and the solution. They found that in a slightlyoversaturated sodium chlorate solution, non-irradiated parts of the crystals weregrowing while simultaneously irradiated parts were dissolving. Furthermore, Ristíc etal. (1997b) showed that mechanically induced tensile elastic strain during the growth ofpotassium alum crystals strongly affects their growth rate. The growth of someparticular crystal faces could even be stopped. They found that the application of a
tensile stress of 0.1 MPa, corresponding to an increase of 6.2 × 10⁻⁵ J.mol-1. in
chemical potential, leads to a decrease in the growth rate from 2.2 µm.min-1 to 1.8
µm.min-1. The original growth rate could be recovered in two ways: 1) by removing thestress; 2) by increasing, while keeping the crystal under stress, the degree of
undersaturation by an amount corresponding to an increase of 7.2 J.mol-1 in chemicalpotential. This means that two driving forces that theoretically differ by five orders ofmagnitude have the same effect on the growth rate. According to the authors, thiswould mean that the elastic strain would most probably affect the way in which growthcentres develop and propagate.
Chapter 1 The concept of pressure solution. 7. November 2000 19
The recent progress in the formulation of non-equilibrium thermodynamics has led to adifferent theoretical conception of the pressure solution phenomenon, and allows now abetter definition of the role of elastic strain as a potential driving force for pressuresolution. We will now describe the model of Heidug & Leroy (1994) and Leroy &Heidug (1994).
1.5.2) Theoretical approach: the "perturbation" theory.
This theory states that if, on an initially smooth interface between a saturated fluid andan elastically stressed solid, a sinusoidal perturbation appears, the chance for it to growor decay depends on physical parameters such as elastic strain, surface energy andlocal curvature. We describe here the model of Heidug & Leroy (1994) and Leroy &Heidug (1994). All the equations used in this paragraph were taken from the abovementioned publications.
1.5.2.1) Starting conditions.
Let us consider a fluid-filled cylindrical pore of radius embedded in an infinite elasticand isotropic matrix. The cavity is opened and connected to an ambient saturated fluid,so that under non-equilibrium conditions, mass transfer is allowed to take placebetween the pore and the bulk fluid. The thermodynamic driving force X for solid-fluidphase transformation is given by equation (1.1):
where ψs is the Helmholtz free energy of the solid at the interface, p is the fluid
pressure, ρs is the solid mass density at the interface, γ is the surface tension and µf isthe solute chemical potential in the fluid.
In this model, the kinetics of growth-dissolution of the solid-fluid interface areassumed to be controlled by surface reactions, i.e. that diffusion of material away fromthe interface is fast enough to avoid any accumulation of material and change in soluteconcentration. The chemical potential of the fluid is thus considered as constant in thecavity and equal to µ0. It is also assumed that there are no nucleation barriers forgrowth or dissolution at the interface.
X Ψs p
ρs-----γ
Rρs---------– µf–+=
Chapter 1 The concept of pressure solution. 7. November 2000 20
The flux at which the solid-fluid interface may move is derived from the driving forceas (equation 1.2):
where L ≥ 0 is a phenomenological proportionality coefficient.
1.5.2.2) Application of stress.
Consider now this matrix subjected to a hydrostatic stress σ∞ at infinity that will ingeneral be different from the pore fluid pressure p. The assumption is made that thematrix undergoes a plain strain mode of deformation. The application of this stress
increases the Helmholtz free energy ψs of the matrix and modifies its mass density ρs .The cavity is no more in equilibrium and the solid-fluid interface moves. Let ussuppose first that the evolution of the pore geometry is homothetic, i.e. the pore growsor shrinks but keeps the same cylindrical geometry. In that case, the rate at which thesolid-fluid interface moves is given by equation (1.3):
where ρ0 is the solid mass density in the stress-free state, ν is the Poisson ratio, E is the
Young's modulus and
is the effective stress.
The solid-fluid interface moves until an equilibrium radius is reached for
J n LX=
RL
ρ2----- p γR----
– µ0ρ–1 ν+
E------------ρρ0----- σ2
1 2ν–( )σ2∞+( )⋅+
11 ν+
E------------ σ 2ν 1–( )σ∞+( )+
⋅
=
σ σ∞ pγR----
–+=
R 0=
Chapter 1 The concept of pressure solution. 7. November 2000 21
In real situations, however, this equilibrium will not be stable. Structural defects orimpurities in the matrix at the solid-fluid interface will cause variations in the surfacetension around the pore and the formation of small disturbances on the interface. Thesedisturbances lead to a new stress distribution around the hole.
1.5.2.3) Effect of small disturbances on the surface.
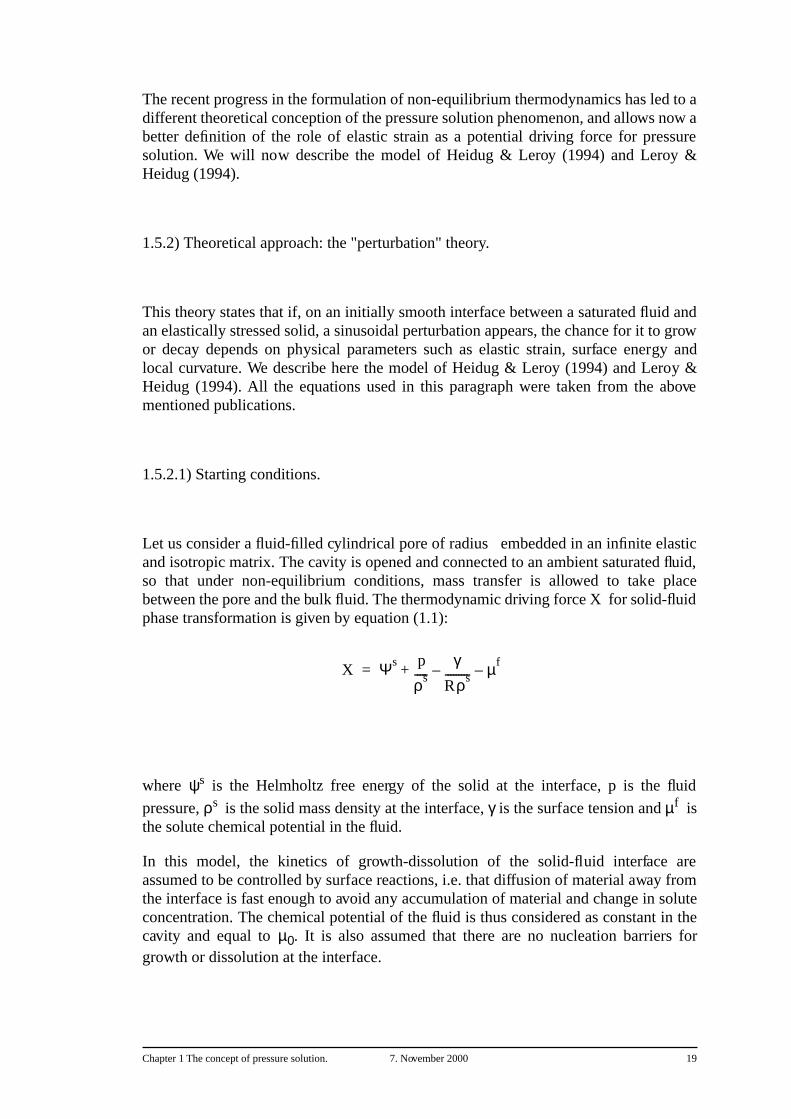
Starting from the equilibrium configuration described above, we consider now thatsmall circumferential perturbations, independent of the position along the axis of thecylindrical cavity, are present on the interface. This kind of perturbations dominateswhen the normal stress at the interface is close to the fluid pressure (longitudinalperturbations along the axis of the cylindrical cavity dominate when the hoop stress atthe interface is close to the fluid pressure). These circumferential disturbances arecharacterised by a "wavenumber" ξ, and can be described for ξ≥ 0 as sinusoidalperturbations of wavelength 2π/ξ around the cylindrical cavity (Fig. 1.3). ξ = 0 is thehomothetic mode of deformation, ξ=1 corresponds to a shape-preserving translationand is not considered in this model.
This perturbation in the geometry of the interface causes a new distribution of stress,strain and surface tension around the cavity. The pore is no more in equilibrium and,again, the interface moves. Depending on the stress, surface tension and curvature, theperturbation grows or shrinks, at a rate λξ given, if =0, by equation (1.4a)
and if ≥2, by equation (1.4b)
where G=E/2(1+ν) is the elastic shear modulus of the matrix.
The opposite effect of stress, that tends to increase the growth rate of the perturbation,and of the surface tension, that tends to decrease it and thus stabilise the surfaceroughness, is clear to see in equation (1.4b).
For a given loading situation, a wavenumber ξ corresponding to the fastest growth rateλξ will be dominant and will determine the geometrical evolution of the interface, andthus of the thermodynamic equilibrium configuration. This dominant growth mode is
λξL
Rρ2----------γR----
⋅=
λξL
Rρ2----------γR----
ξ21–( )– 4
σ2
G------1 ν–( ) ξ 1–( )⋅+
=
Chapter 1 The concept of pressure solution. 7. November 2000 22
found by differentiating the equation (1.4b) with respect to ξ , and is obtained for(equation 1.5):
This wavenumber defines the equilibrium wavelength of the sinusoidal perturbation ofthe surface. The equilibrium will be stable over a range of stresses given by equation(1.6):
with
In this range of stress, the perturbation grows in amplitude, but keeps the samewavelength. By increasing the effective stress, however, the circumferentialperturbation grows with always higher wavenumber ξ, until the original pore breaks upin ξ smaller pores of the same length.
1.5.2.4) Alternative models.
A variation to the model of Heidug & Leroy (1994) and Leroy & Heidug (1994) hasbeen proposed by Gal et al. (1998), based on a calculation method used by Srolovitz(1989). In this model an initially flat solid-fluid interface is subjected to lateral stress,and the evolution of a sinusoidal perturbation of the surface is investigated. The resultsare comparable to those obtained by Heidug & Leroy (1994) and Leroy & Heidug(1994), but restricted to one mode of deformation. Under a given loading situation, theperturbation will grow unstably if its wavelength is larger than a critical wavelength.Otherwise it will be smoothed out.
The theoretical model of Heidug & Leroy (1994) and Leroy & Heidug (1994) gives theopportunity to quantify the effect of elastic strain on the stability of a solid/fluidinterface. It is thus of prime importance for the study of pressure solution phenomena,
ξ 2 1 ν–( ) σ2R
Gγ----------⋅ =
2ξ 1–( )12--- a
2---σ 2ξ 1+( )
12--- a
2---⋅≤ ≤⋅
aG
1 ν–------------γR----
⋅
12---
=
Chapter 1 The concept of pressure solution. 7. November 2000 23
particularly for the study of the "island-channel" model, although particular conditionsoccurring at grain boundaries, such as solid-solid surface tension effects or long-rangeintermolecular forces are not considered. An experimental investigation on the effect ofelastic strain on free-face dissolution (and growth) of elastic/brittle salt single crystalswill help to test this theoretical model.
Chapter 1 The concept of pressure solution. 7. November 2000 24
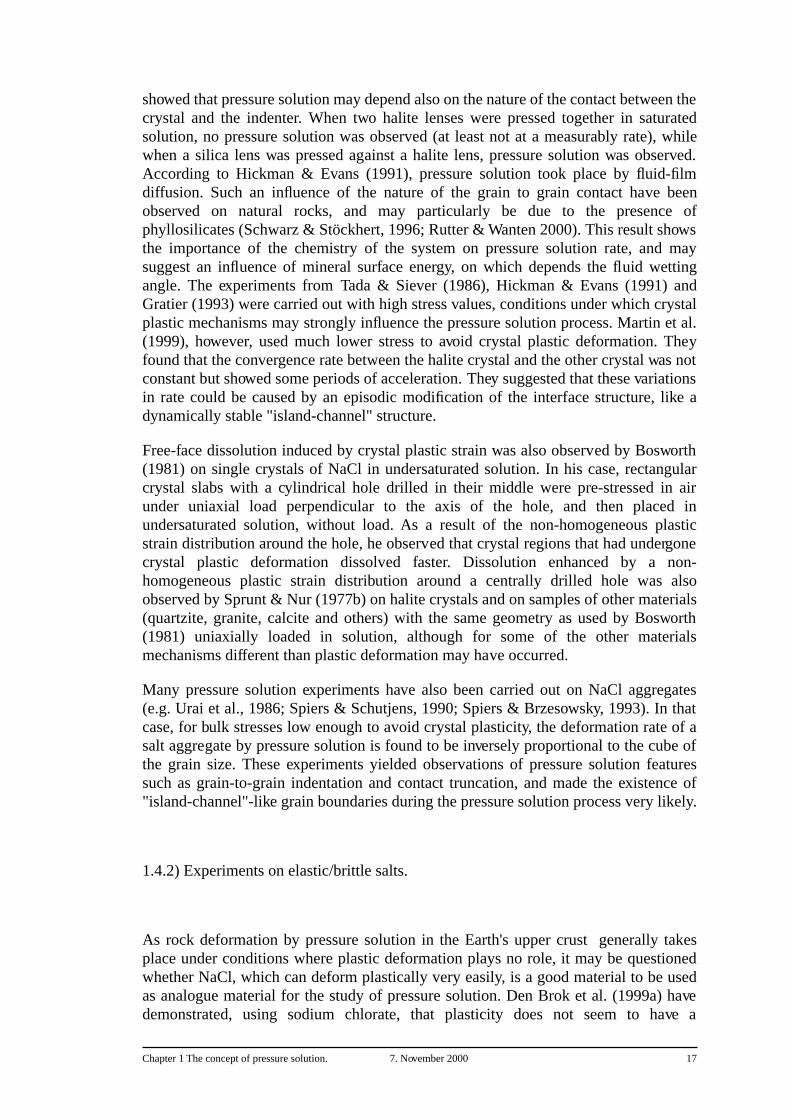
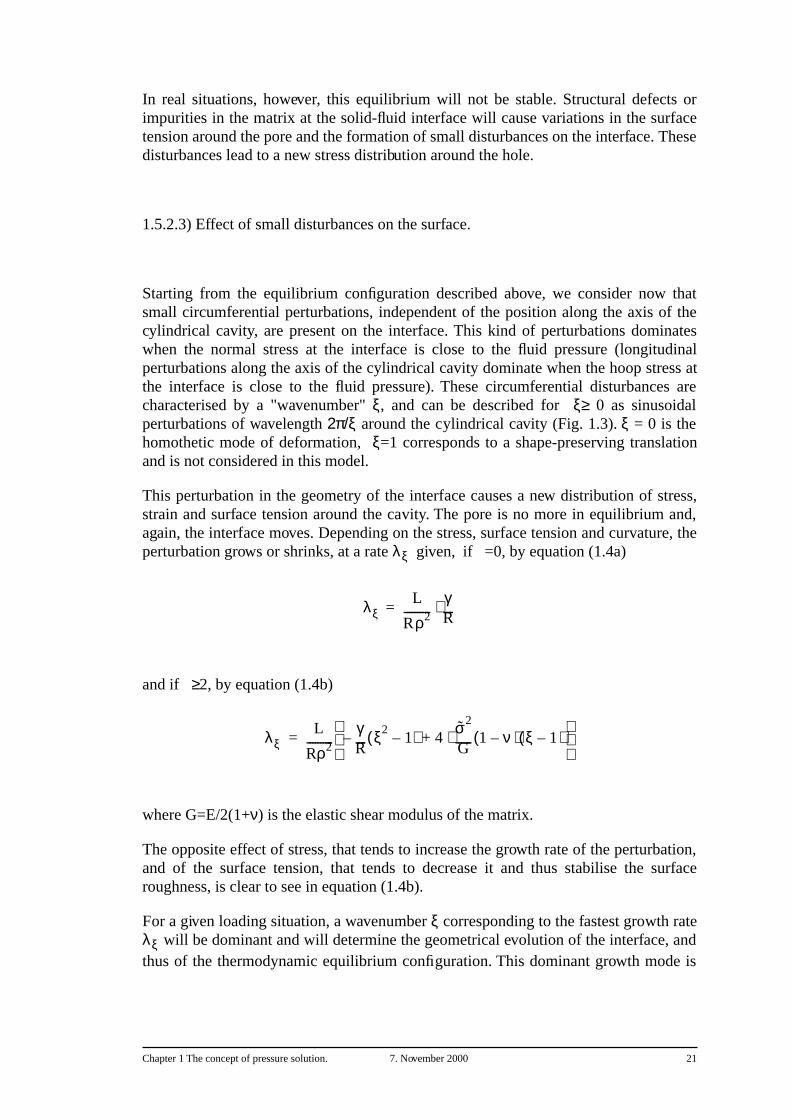
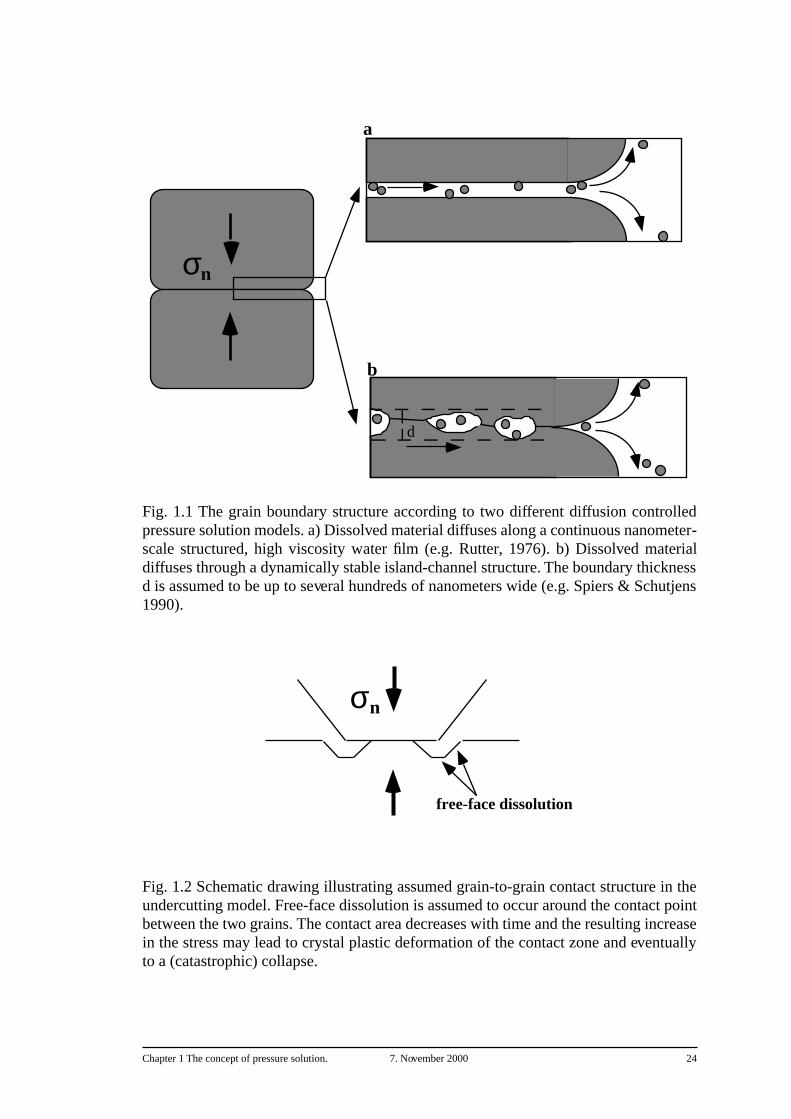
Fig. 1.1 The grain boundary structure according to two different diffusion controlledpressure solution models. a) Dissolved material diffuses along a continuous nanometer-scale structured, high viscosity water film (e.g. Rutter, 1976). b) Dissolved materialdiffuses through a dynamically stable island-channel structure. The boundary thicknessd is assumed to be up to several hundreds of nanometers wide (e.g. Spiers & Schutjens1990).
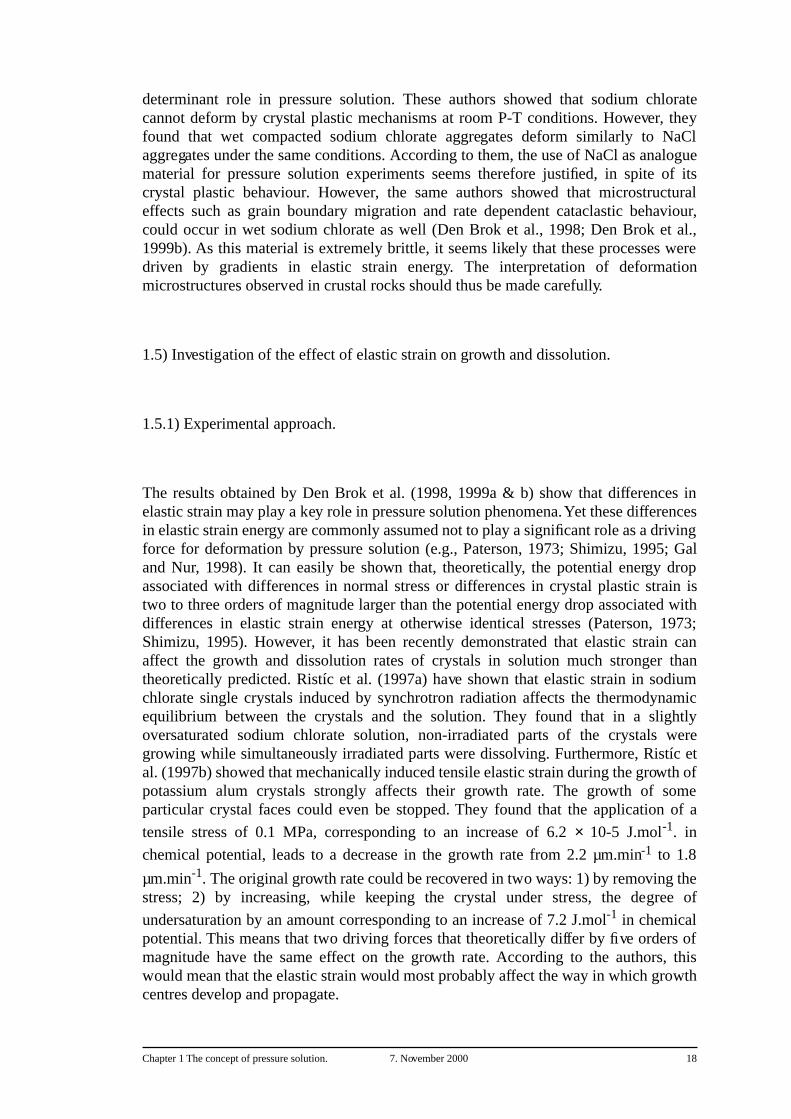
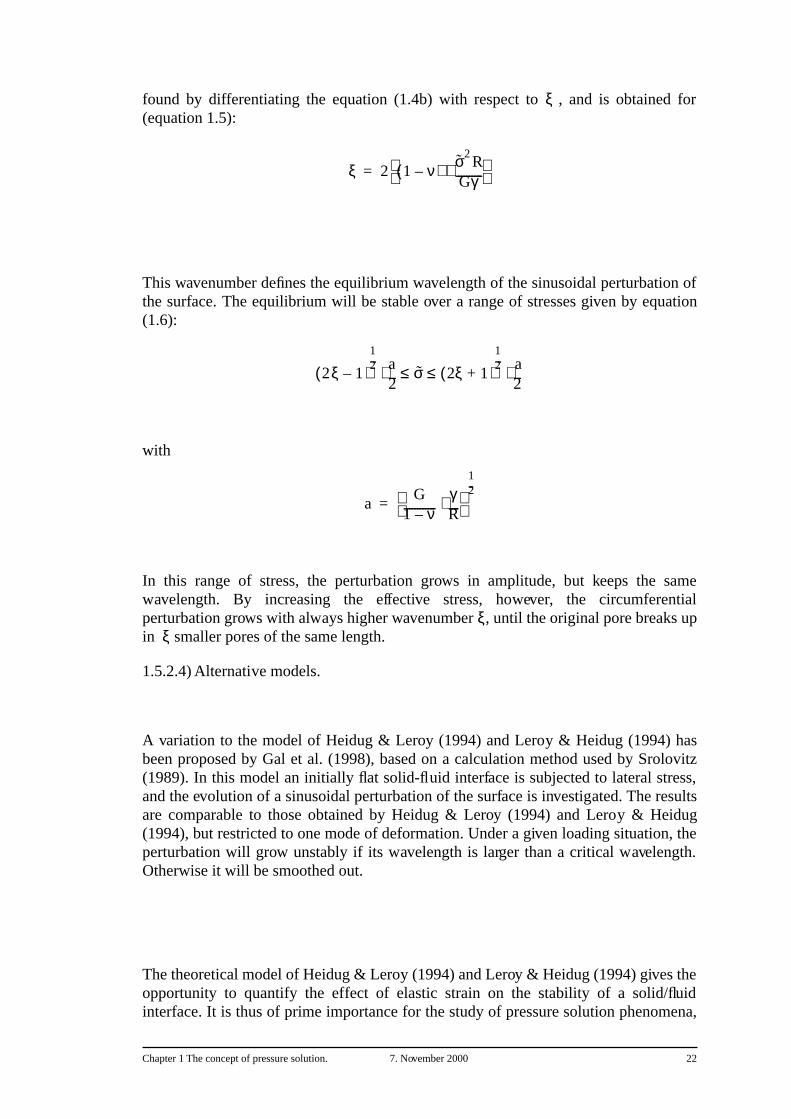
Fig. 1.2 Schematic drawing illustrating assumed grain-to-grain contact structure in theundercutting model. Free-face dissolution is assumed to occur around the contact pointbetween the two grains. The contact area decreases with time and the resulting increasein the stress may lead to crystal plastic deformation of the contact zone and eventuallyto a (catastrophic) collapse.
a
b
σn
d
σn
free-face dissolution

Chapter 1 The concept of pressure solution. 7. November 2000 25
ξ=0
ξ=1
ξ=2
ξ=3
ξ=4
ξ=5
Fig. 1.3 Schematic representation of circumferential perturbations ofwavenumber ξ on the surface of a circular pore (after Leroy &
Heidug, 1994).
Chapter 2 Experimental procedures. 7. November 2000 26
Chapter 2 Experimental procedures.
In this chapter, the choice of the materials used in this thesis is discussed and their mostimportant properties described. The methods for the preparation of the samples and theexperimental procedures to test the model of Heidug & Leroy (1994) and Leroy &Heidug (1994) on the evolution of a cylindrical cavity in a crystal stressed in solutionare explained in detail.
2.1) Materials used.
As we are interested in the effect of elastic deformation, it was necessary to use crystalsthat can not deform by crystal plastic mechanisms at room P-T conditions. To getquantitative results in a relatively short time, it was necessary to choose materials withrelatively fast kinetics of growth and dissolution. Finally, the crystals should notpossess a very significant mechanical anisotropy, so that the isotropic approximationcould be made for the calculation of the elastic strain distribution in the samples. Forthese reasons, potassium alum (K-alum) and sodium chlorate were chosen as rockanalogue materials.
2.1.1) Potassium alum.
Potassium alum (KAl[SO4]2.12H2O) is a cubic salt, and belongs to the space group
Th6. It has a solubility of 0.3 mol.l-1 water at 25°C (Van der Hoek et al., 1983; Ullmann
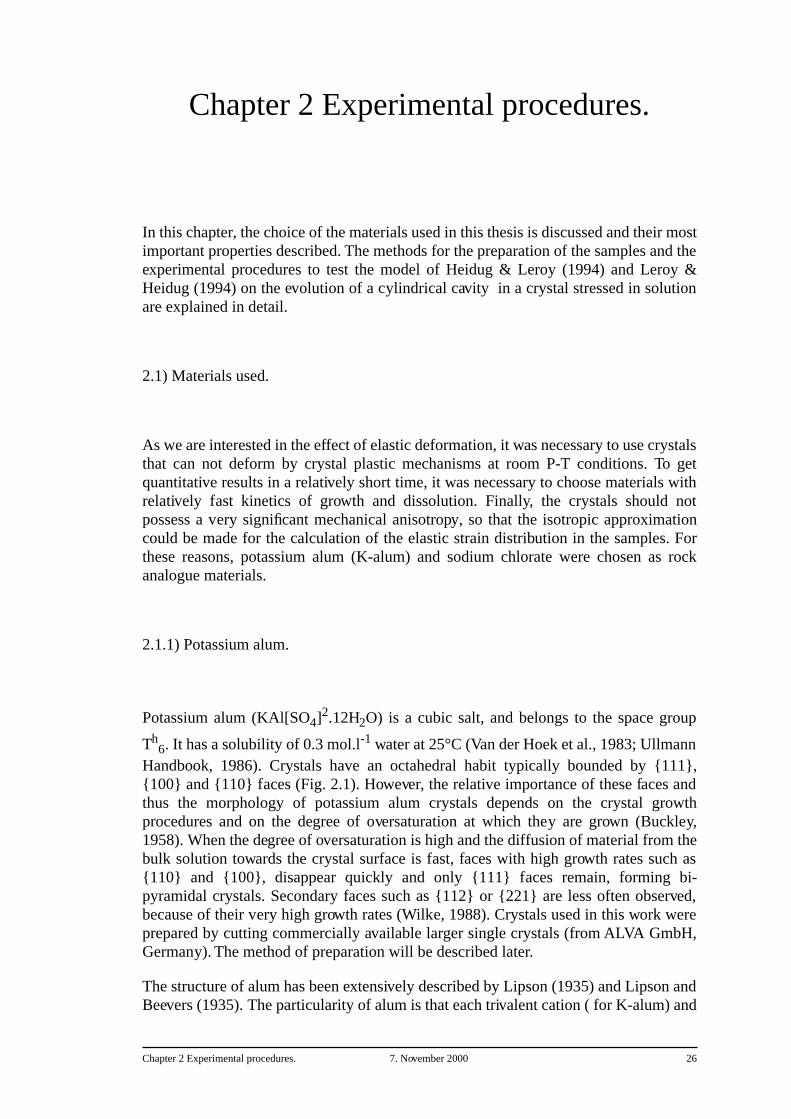
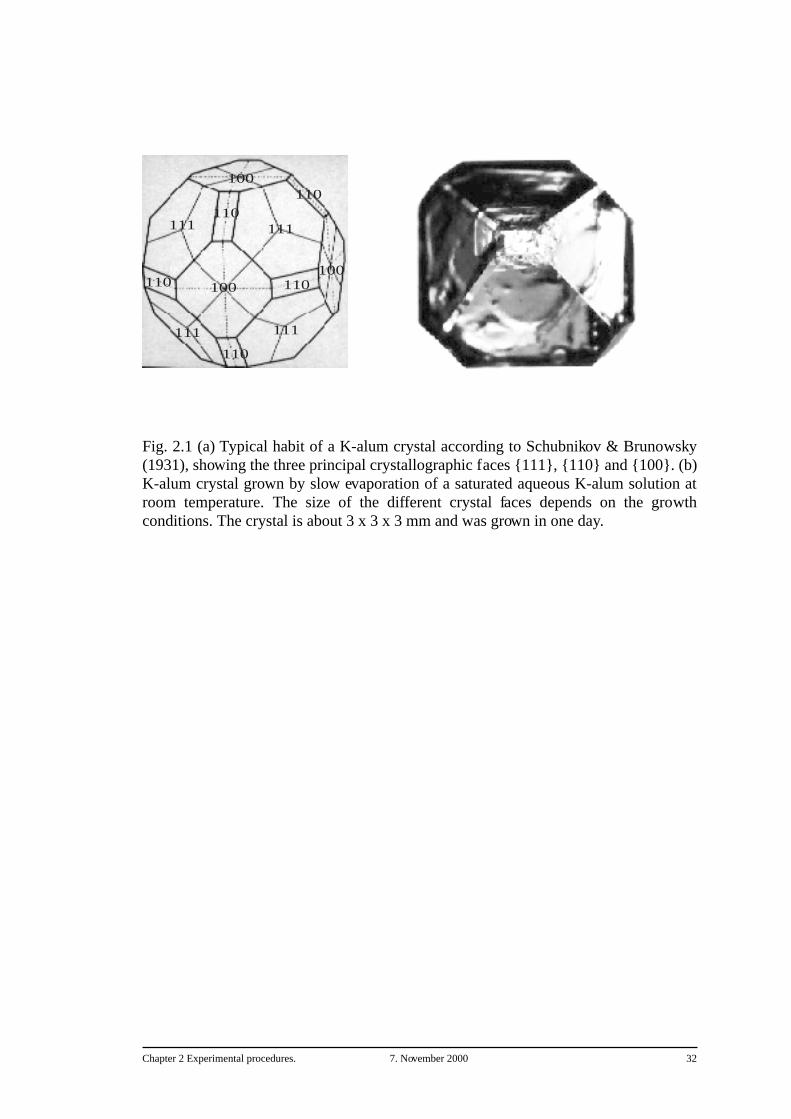
Handbook, 1986). Crystals have an octahedral habit typically bounded by {111},{100} and {110} faces (Fig. 2.1). However, the relative importance of these faces andthus the morphology of potassium alum crystals depends on the crystal growthprocedures and on the degree of oversaturation at which they are grown (Buckley,1958). When the degree of oversaturation is high and the diffusion of material from thebulk solution towards the crystal surface is fast, faces with high growth rates such as{110} and {100}, disappear quickly and only {111} faces remain, forming bi-pyramidal crystals. Secondary faces such as {112} or {221} are less often observed,because of their very high growth rates (Wilke, 1988). Crystals used in this work wereprepared by cutting commercially available larger single crystals (from ALVA GmbH,Germany). The method of preparation will be described later.
The structure of alum has been extensively described by Lipson (1935) and Lipson andBeevers (1935). The particularity of alum is that each trivalent cation ( for K-alum) and
Chapter 2 Experimental procedures. 7. November 2000 27
each monovalent cation ( for K-alum) is surrounded by six water molecules. Accordingto these authors, such an arrangement around a potassium cation is rare in othermaterials. It has to be noted that a different sort of potassium alum, with only elevenwater molecules, can be found in nature. This variety is called kalinite. It has amonoclinic symmetry and a fibrous habit. Little is known about the properties of thismaterial.
Elasticity parameters and elastic moduli of potassium alum can be found in theliterature (e.g. Haussühl, 1961). The Young's modulus E , calculated from the elasticmoduli, is 18.63 GPa.
To test whether potassium alum crystals could deform plastically under room P-Tconditions, an experiment was performed as follows: a dried crystal sample about 6 × 2× 2 mm in size with faces parallel two by two was placed 20 hours under a stress of 15MPa, and then 7 hours under 27 MPa. The length of the sample was measured afterboth stages. No deformation up to 0.1% strain, the resolution of the measurement, wasmeasured.
2.1.2) Sodium chlorate.
Sodium chlorate (NaClO3) is a cubic salt, and belongs to the space group P213. It has a
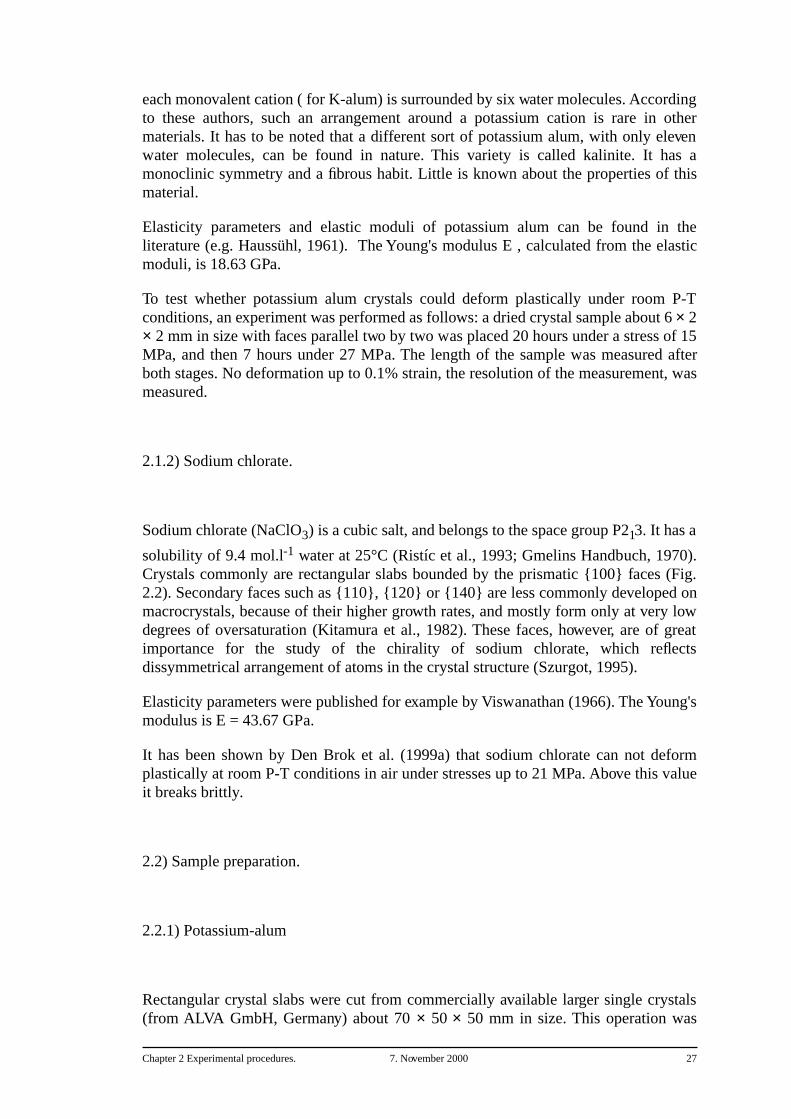
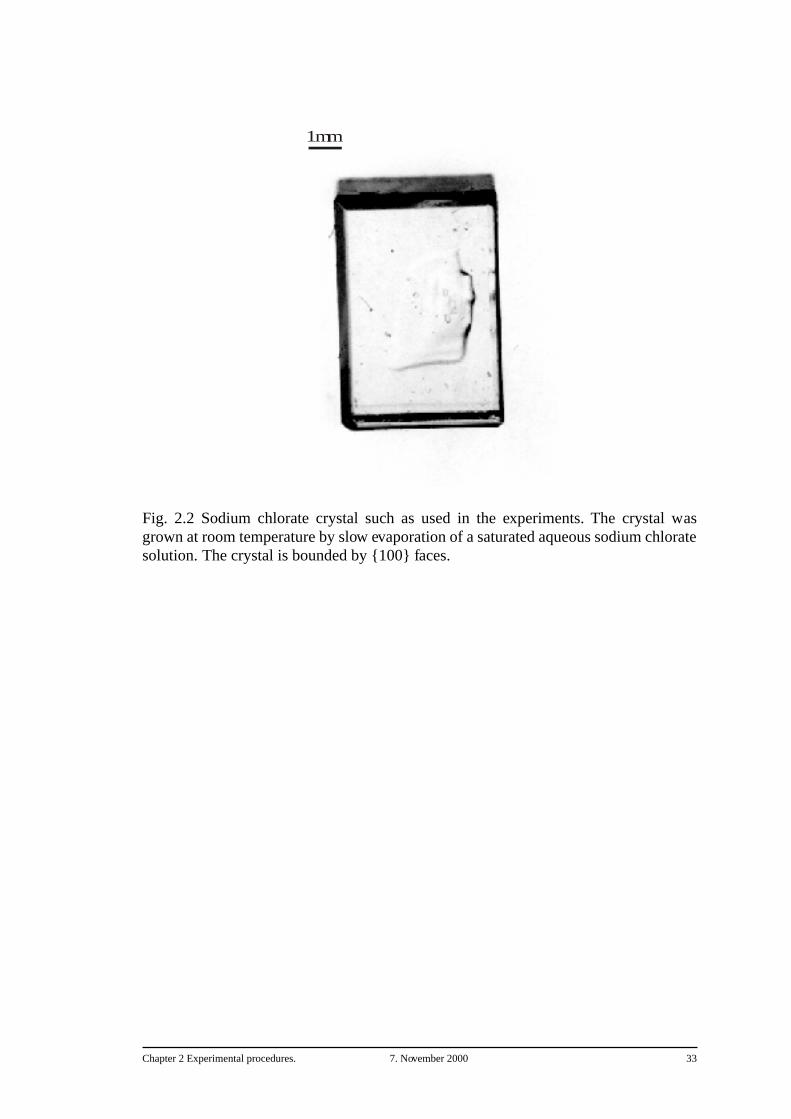
solubility of 9.4 mol.l-1 water at 25°C (Ristíc et al., 1993; Gmelins Handbuch, 1970).Crystals commonly are rectangular slabs bounded by the prismatic {100} faces (Fig.2.2). Secondary faces such as {110}, {120} or {140} are less commonly developed onmacrocrystals, because of their higher growth rates, and mostly form only at very lowdegrees of oversaturation (Kitamura et al., 1982). These faces, however, are of greatimportance for the study of the chirality of sodium chlorate, which reflectsdissymmetrical arrangement of atoms in the crystal structure (Szurgot, 1995).
Elasticity parameters were published for example by Viswanathan (1966). The Young'smodulus is E = 43.67 GPa.
It has been shown by Den Brok et al. (1999a) that sodium chlorate can not deformplastically at room P-T conditions in air under stresses up to 21 MPa. Above this valueit breaks brittly.
2.2) Sample preparation.
2.2.1) Potassium-alum
Rectangular crystal slabs were cut from commercially available larger single crystals(from ALVA GmbH, Germany) about 70 × 50 × 50 mm in size. This operation was
Chapter 2 Experimental procedures. 7. November 2000 28
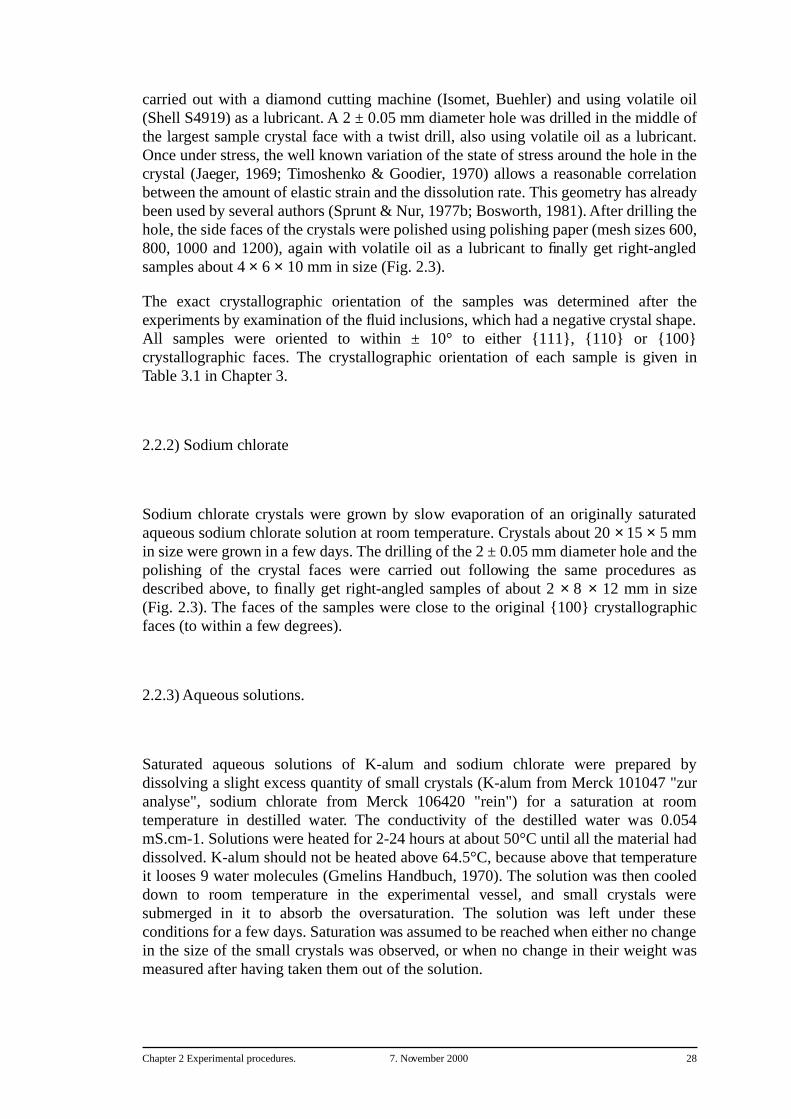
carried out with a diamond cutting machine (Isomet, Buehler) and using volatile oil(Shell S4919) as a lubricant. A 2 ± 0.05 mm diameter hole was drilled in the middle ofthe largest sample crystal face with a twist drill, also using volatile oil as a lubricant.Once under stress, the well known variation of the state of stress around the hole in thecrystal (Jaeger, 1969; Timoshenko & Goodier, 1970) allows a reasonable correlationbetween the amount of elastic strain and the dissolution rate. This geometry has alreadybeen used by several authors (Sprunt & Nur, 1977b; Bosworth, 1981). After drilling thehole, the side faces of the crystals were polished using polishing paper (mesh sizes 600,800, 1000 and 1200), again with volatile oil as a lubricant to finally get right-angledsamples about 4 × 6 × 10 mm in size (Fig. 2.3).
The exact crystallographic orientation of the samples was determined after theexperiments by examination of the fluid inclusions, which had a negative crystal shape.All samples were oriented to within ± 10° to either {111}, {110} or {100}crystallographic faces. The crystallographic orientation of each sample is given inTable 3.1 in Chapter 3.
2.2.2) Sodium chlorate
Sodium chlorate crystals were grown by slow evaporation of an originally saturatedaqueous sodium chlorate solution at room temperature. Crystals about 20 × 15 × 5 mmin size were grown in a few days. The drilling of the 2 ± 0.05 mm diameter hole and thepolishing of the crystal faces were carried out following the same procedures asdescribed above, to finally get right-angled samples of about 2 × 8 × 12 mm in size(Fig. 2.3). The faces of the samples were close to the original {100} crystallographicfaces (to within a few degrees).
2.2.3) Aqueous solutions.
Saturated aqueous solutions of K-alum and sodium chlorate were prepared bydissolving a slight excess quantity of small crystals (K-alum from Merck 101047 "zuranalyse", sodium chlorate from Merck 106420 "rein") for a saturation at roomtemperature in destilled water. The conductivity of the destilled water was 0.054mS.cm-1. Solutions were heated for 2-24 hours at about 50°C until all the material haddissolved. K-alum should not be heated above 64.5°C, because above that temperatureit looses 9 water molecules (Gmelins Handbuch, 1970). The solution was then cooleddown to room temperature in the experimental vessel, and small crystals weresubmerged in it to absorb the oversaturation. The solution was left under theseconditions for a few days. Saturation was assumed to be reached when either no changein the size of the small crystals was observed, or when no change in their weight wasmeasured after having taken them out of the solution.
Chapter 2 Experimental procedures. 7. November 2000 29
2.3) Experimental set-up and procedures.
2.3.1) Description of the apparatus.
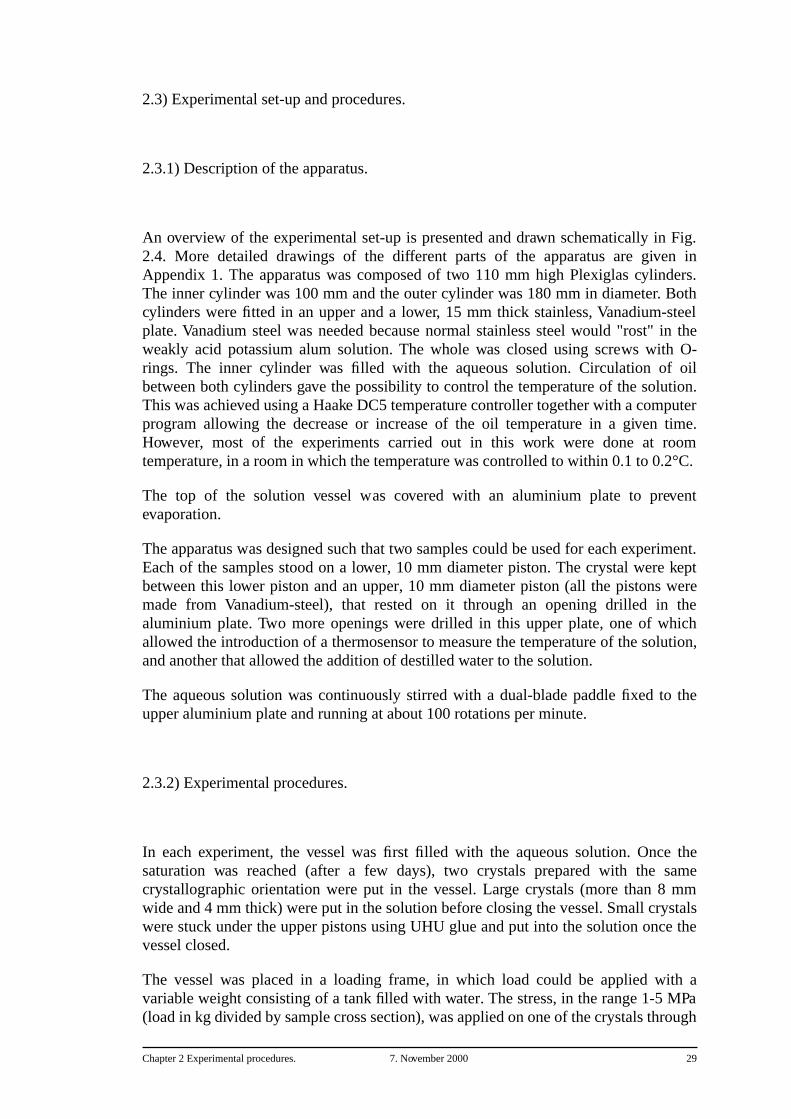
An overview of the experimental set-up is presented and drawn schematically in Fig.2.4. More detailed drawings of the different parts of the apparatus are given inAppendix 1. The apparatus was composed of two 110 mm high Plexiglas cylinders.The inner cylinder was 100 mm and the outer cylinder was 180 mm in diameter. Bothcylinders were fitted in an upper and a lower, 15 mm thick stainless, Vanadium-steelplate. Vanadium steel was needed because normal stainless steel would "rost" in theweakly acid potassium alum solution. The whole was closed using screws with O-rings. The inner cylinder was filled with the aqueous solution. Circulation of oilbetween both cylinders gave the possibility to control the temperature of the solution.This was achieved using a Haake DC5 temperature controller together with a computerprogram allowing the decrease or increase of the oil temperature in a given time.However, most of the experiments carried out in this work were done at roomtemperature, in a room in which the temperature was controlled to within 0.1 to 0.2°C.
The top of the solution vessel was covered with an aluminium plate to preventevaporation.
The apparatus was designed such that two samples could be used for each experiment.Each of the samples stood on a lower, 10 mm diameter piston. The crystal were keptbetween this lower piston and an upper, 10 mm diameter piston (all the pistons weremade from Vanadium-steel), that rested on it through an opening drilled in thealuminium plate. Two more openings were drilled in this upper plate, one of whichallowed the introduction of a thermosensor to measure the temperature of the solution,and another that allowed the addition of destilled water to the solution.
The aqueous solution was continuously stirred with a dual-blade paddle fixed to theupper aluminium plate and running at about 100 rotations per minute.
2.3.2) Experimental procedures.
In each experiment, the vessel was first filled with the aqueous solution. Once thesaturation was reached (after a few days), two crystals prepared with the samecrystallographic orientation were put in the vessel. Large crystals (more than 8 mmwide and 4 mm thick) were put in the solution before closing the vessel. Small crystalswere stuck under the upper pistons using UHU glue and put into the solution once thevessel closed.
The vessel was placed in a loading frame, in which load could be applied with avariable weight consisting of a tank filled with water. The stress, in the range 1-5 MPa(load in kg divided by sample cross section), was applied on one of the crystals through
Chapter 2 Experimental procedures. 7. November 2000 30
the upper piston, perpendicular to the axis of the central hole drilled through the
crystals. The loading was carried out at a rate of about 25 kg.hr-1 within 1-10 minutes.The other crystal was left stress-free (the weight of the piston corresponded to a stressof only 0.03 MPa and was therefore neglected). Fat was used to minimise any frictionbetween the piston and the upper plate. The stress on the stressed crystal was measuredwith a 2 kN, 10 mm diameter and 7 mm high load sensor (Burster, typ 8416) placedbetween the press and the piston (see Fig. 2.4). Displacement of the piston on thestressed crystal was measured with a LVDT displacement sensor (typ HT400Schlumberger with a Schlumberger OD4 transducer conditioner). The length of thesamples was systematically measured before and after each experiment with aprecision of 0.1% strain, using a micrometer screw.
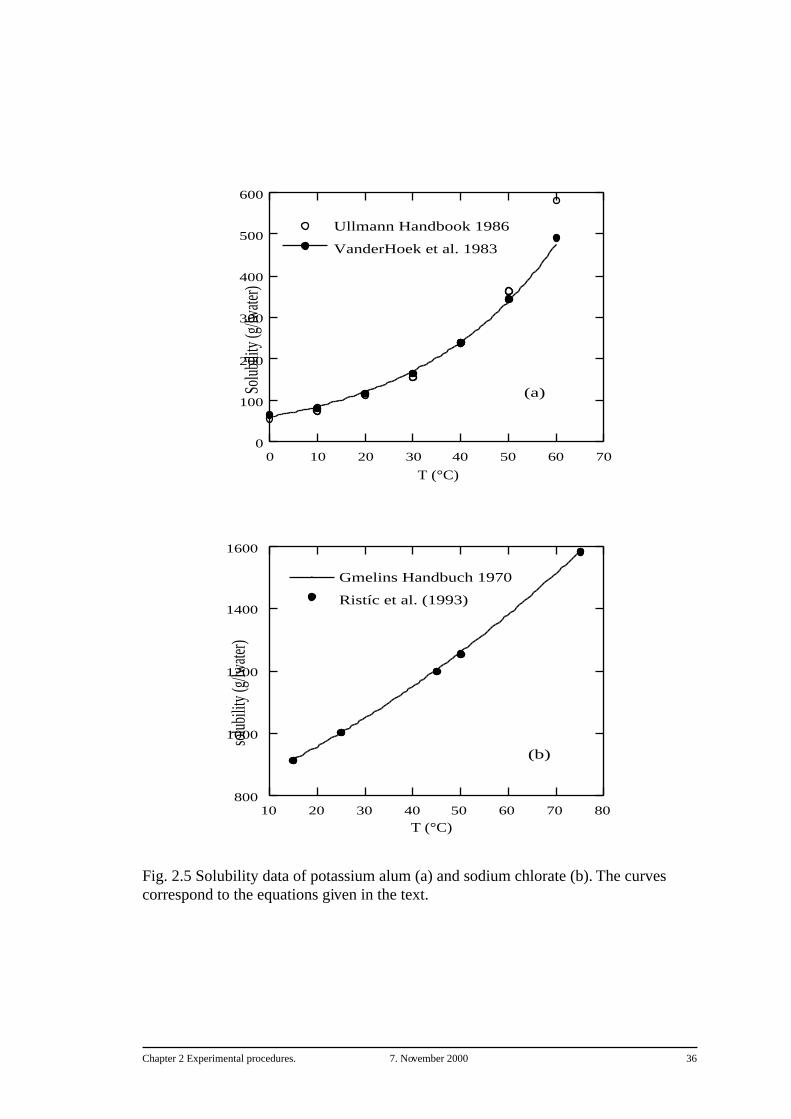
Once the crystals were in the vessel in the saturated solution and the one of them understress, the solution was diluted quasi instantaneously by adding small amounts ofdestilled water through the opening in the upper plate. The resulting degree ofundersaturation was not measured, but calculated in degree Celsius using the empiricalformula:
C0 = e0.034336T (2.1)
for K-alum (Van der Hoek et al., 1983; Ullmann Handbook, 1986), and
C0 = e0.0091557T (2.2)
for sodium chlorate (Ristíc et al., 1993; Gmelins Handbuch, 1970), where C0 is the
saturation concentration (g.l-1water) at temperature T (°C). Fig. 2.5 shows the verygood agreement between these equations and solubility values published in theliterature.
Experiment duration ranged between a few hours and a week. After each experiment,the crystals were removed from the solution and immediately dried using a cleaningtissue. Micrographs of both stressed and stress-free holes were taken before and aftereach experiment under an optical microscope.
2.4) Estimation of the stress around the hole.
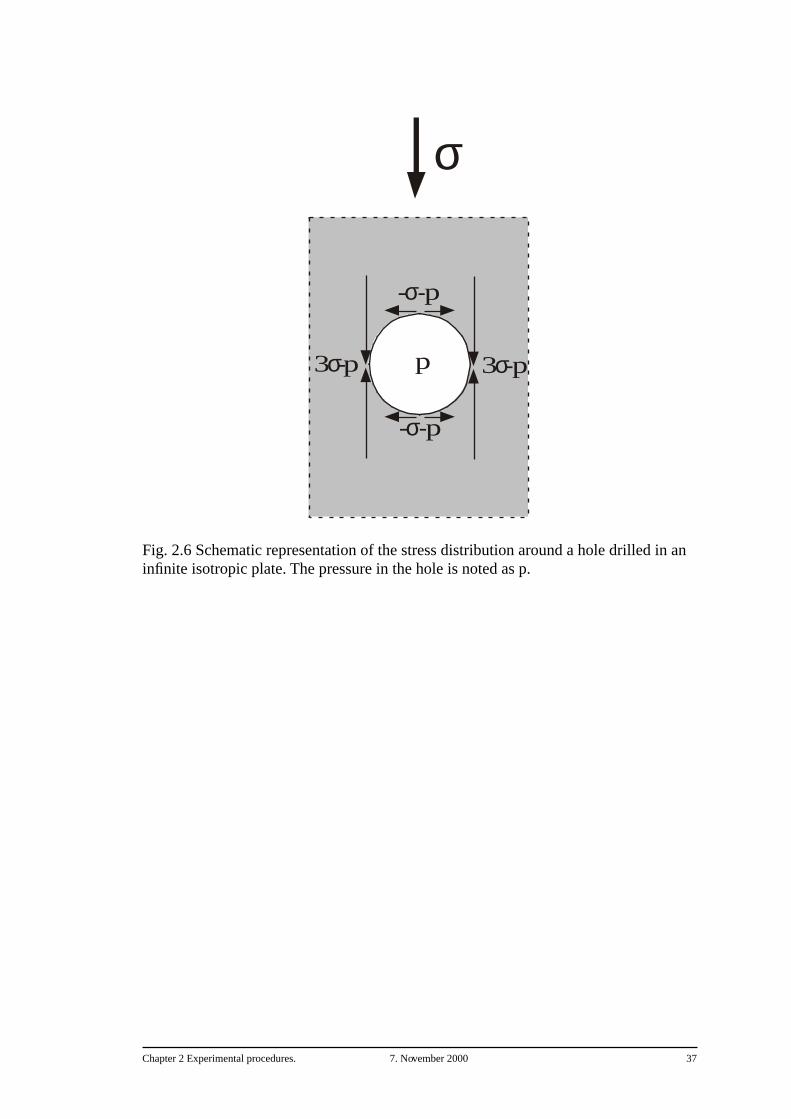
The stress distribution around a hole drilled in an infinite isotropic plate submitted touniaxial compression is well known (Jaeger, 1969; Timoshenko & Goodier, 1970).Under condition of plain strain and if no shear stresses are present, the normal stress at
Chapter 2 Experimental procedures. 7. November 2000 31
the periphery of the hole is equal to the pressure in the hole. In our experiments, theaqueous solution in the hole is connected with the bulk solution and is at theatmospheric pressure, which is negligible with respect to the applied load on thecrystal. The hoop stress at the periphery of the hole drilled through an infinitely largesample varies from a tension equal to minus the bulk applied stress above and belowthe hole to a compression equal to three times the bulk applied stress on the sides leftand right of the hole (Fig. 2.6).
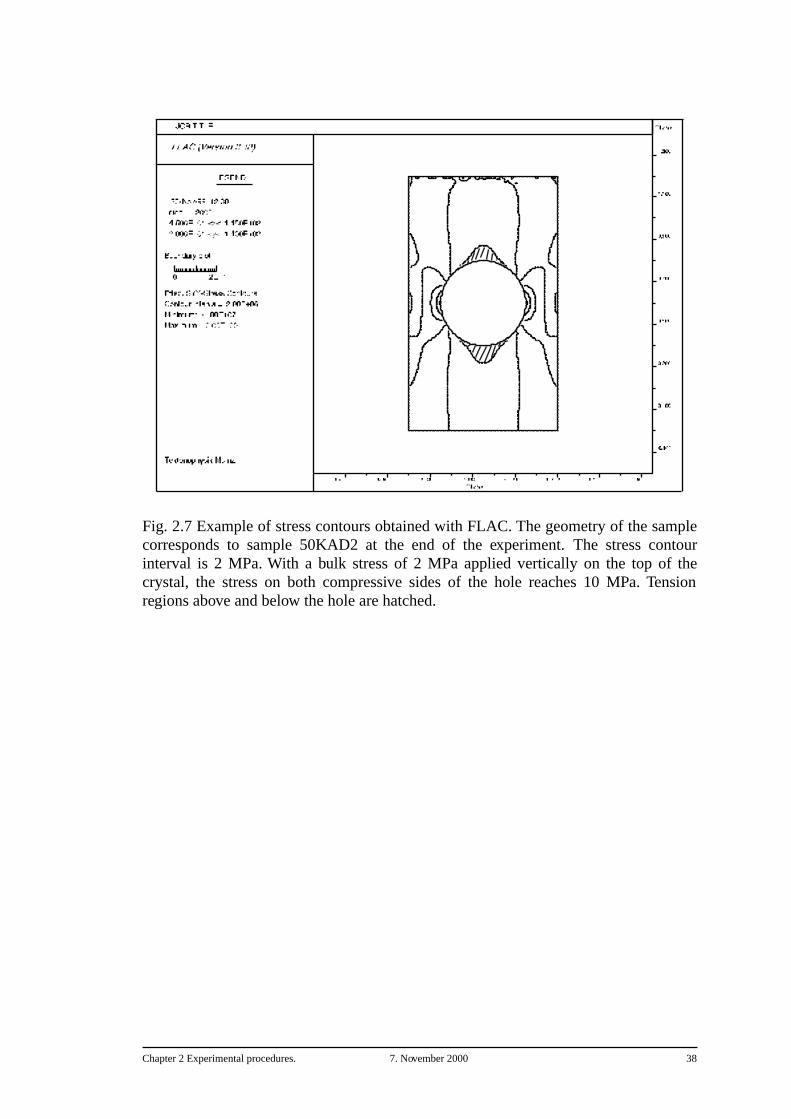
For a finite plate such as in our case with a centrally drilled hole, it can be shown usingfinite differences computer programs such as FLAC (Fast Lagrangian Analysis ofContinua) that the stress on both compressive sides of the hole reaches higher values. Atypical example of stress contours obtained using FLAC in shown on Fig. 2.7. Thestress on both compressive sides at the periphery of the hole reaches five times the bulkapplied stress. The tensional regions above and below the hole (hatched regions) arefound to spread over a much smaller area.
In our case, the polishing of the crystal faces for the preparation of the samples ledgenerally to a undesired asymmetry between both sides of the holes, that was slightlydifferent for each crystal. For this reason, the stress was calculated on both crystalsections on the compressive sides of the hole (load over side cross section), and theaverage between both sides taken as the estimation of the hoop stress at the peripheryon both sides of the hole. The estimation error depended on the asymmetry of thesample. All of the stress values reported in Table 3.1 in Chapter 3 correspond to theconditions of stress at the beginning of the experiments.
2.5) In-situ experiments.
Some experiments were carried out in-situ, i.e. under an optical microscope, in a see-through vessel placed on an horizontal microscope. This vessel consisted of a 1.1 mmthin U-shaped piston made of Ertalon, held and glued with UV-loctite (loctite 350)between two 50 mm high, 50 mm wide and 1.6 mm thick glass plates (Den Brok et al.,1998, 1999b). Crystals used for these experiments had a thickness of about 1 mm.Saturated solution was filled in the vessel with the help of a syringe. The stress wasapplied on the crystal with a dead weight through a 1 mm thick stainless Vanadium-steel piston. The microscope was coupled to a TK-1070E JVC digital colour videocamera connected to a computer, providing the possibility to film the experiment undermicroscope, using NIH-image software. Experiments were carried out at roomtemperature.
Chapter 2 Experimental procedures. 7. November 2000 32
Fig. 2.1 (a) Typical habit of a K-alum crystal according to Schubnikov & Brunowsky(1931), showing the three principal crystallographic faces {111}, {110} and {100}. (b)K-alum crystal grown by slow evaporation of a saturated aqueous K-alum solution atroom temperature. The size of the different crystal faces depends on the growthconditions. The crystal is about 3 x 3 x 3 mm and was grown in one day.
100
111111
111111
110 110
110
110
110100
100
Chapter 2 Experimental procedures. 7. November 2000 33
Fig. 2.2 Sodium chlorate crystal such as used in the experiments. The crystal wasgrown at room temperature by slow evaporation of a saturated aqueous sodium chloratesolution. The crystal is bounded by {100} faces.
1 mm
Chapter 2 Experimental procedures. 7. November 2000 34
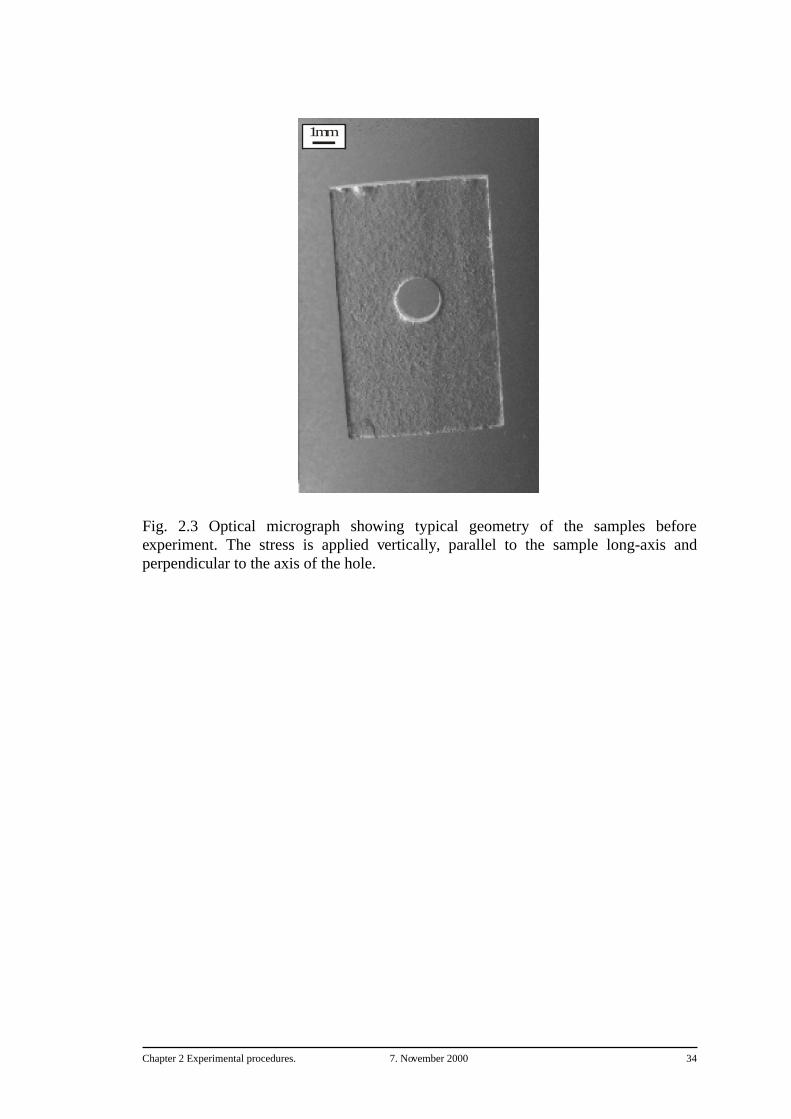
Fig. 2.3 Optical micrograph showing typical geometry of the samples beforeexperiment. The stress is applied vertically, parallel to the sample long-axis andperpendicular to the axis of the hole.
1 mm
Chapter 2 Experimental procedures. 7. November 2000 35
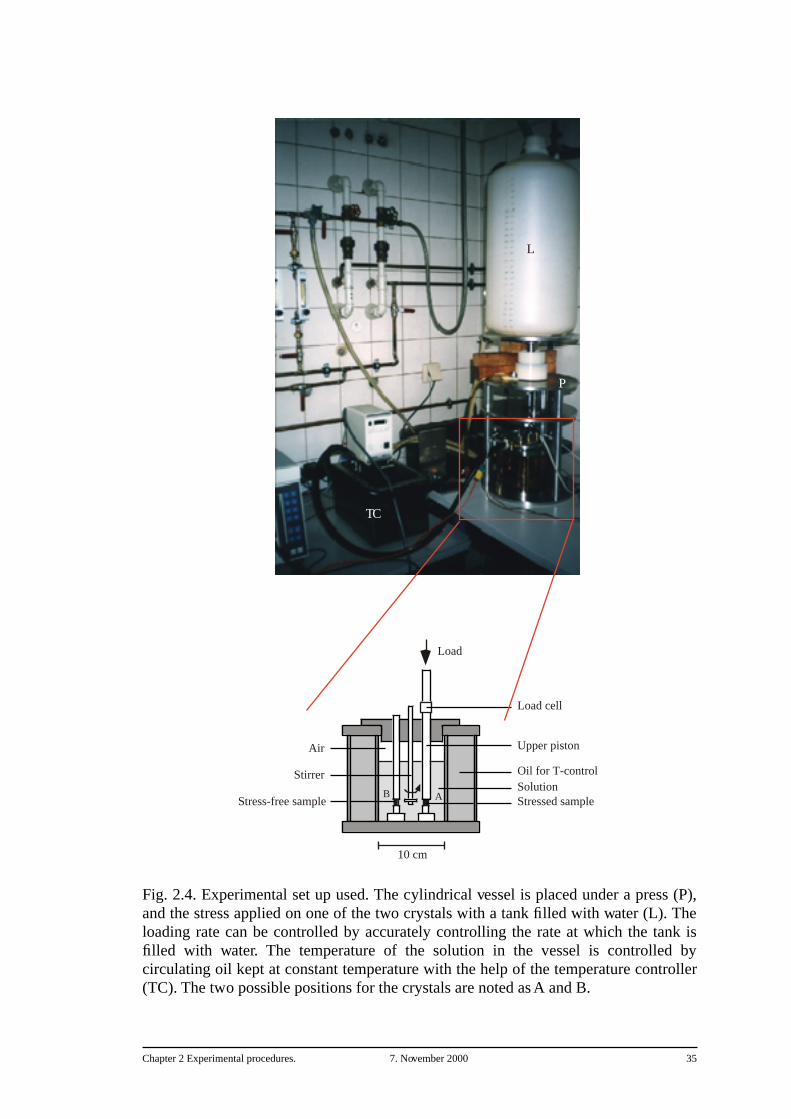
Fig. 2.4. Experimental set up used. The cylindrical vessel is placed under a press (P),and the stress applied on one of the two crystals with a tank filled with water (L). Theloading rate can be controlled by accurately controlling the rate at which the tank isfilled with water. The temperature of the solution in the vessel is controlled bycirculating oil kept at constant temperature with the help of the temperature controller(TC). The two possible positions for the crystals are noted as A and B.
Stressed sample
Oil for T-controlStirrer
Upper piston
Stress-free sampleSolution
Load cell
Air
Load
10 cm
L
TC
P
AB
Chapter 2 Experimental procedures. 7. November 2000 36
Fig. 2.5 Solubility data of potassium alum (a) and sodium chlorate (b). The curves correspond to the equations given in the text.
0
100
200
300
400
500
600
0 10 20 30 40 50 60 70
Ullmann Handbook 1986
VanderHoek et al. 1983So
lubili
ty (g
/lwate
r)
T (°C)
(a)
800
1000
1200
1400
1600
10 20 30 40 50 60 70 80
Gmelins Handbuch 1970
Ristíc et al. (1993)
solub
ility
(g/lw
ater)
T (°C)
(b)
Chapter 2 Experimental procedures. 7. November 2000 37
Fig. 2.6 Schematic representation of the stress distribution around a hole drilled in an infinite isotropic plate. The pressure in the hole is noted as p.
σ
p3σ-p 3σ-p
-σ-p
-σ-p
Chapter 2 Experimental procedures. 7. November 2000 38
Fig. 2.7 Example of stress contours obtained with FLAC. The geometry of the samplecorresponds to sample 50KAD2 at the end of the experiment. The stress contourinterval is 2 MPa. With a bulk stress of 2 MPa applied vertically on the top of thecrystal, the stress on both compressive sides of the hole reaches 10 MPa. Tensionregions above and below the hole are hatched.
Chapter 3 Effect of stress on surface microstructures. 7. November 2000 39
Chapter 3 Effect of stress on surface microstructures.
In this section, the experimental results on the effect of stress on the microstructures offree surfaces of crystals held in undersaturated aqueous solution are presented anddiscussed. After a detailed description of the surface microstructures, the origin of theirformation is discussed in the framework of existing physical models on the evolution ofstressed solid-fluid interfaces.
3.1) Description of the dissolution features.
After each experiment, both stressed and stress-free crystals were taken out of thesolution and immediately dried using a cleaning tissue. A first visual assessment of thecrystals could reveal differences in surface structure between stressed and stress-freecrystals. While the surface of the stress-free crystals appeared smooth and unaltered,the surface of the stressed crystals was characterised by the presence of fine grooves onboth sides of the hole.
3.1.1) Stress-free crystals.
A detailed microscopic examination of the surface of stress-free crystals using anoptical microscope revealed the presence of fine etch grooves. These grooves couldonly be seen at high magnification (× 400). They occurred in bundles at apparentlyarbitrary localities all over the surface. The grooves were roughly parallel to each otherand built an anastomosing pattern (Fig. 3.1). Individual groups of grooves had differentorientations on the same crystal surface. These orientations were always parallel tocrystallographic low index directions. The grooves were typically 1-3 µm wide, 1-2 µmdeep, and separated from each other by 3-10 µm.
3.1.2) Stressed crystals.
On the faces of crystals dissolved under stress, large as well as small grooves wereobserved under the microscope. The small grooves were identical to those observed on
Chapter 3 Effect of stress on surface microstructures. 7. November 2000 40
stress-free samples, but now appeared to occur on the entire surface. They were alloriented in the same direction, at an angle to the bulk applied stress direction rangingfrom 0 to 40°. Our attention, however, was caught by the much bigger dissolutiongrooves that had developed on both sides of the hole (Fig. 3.2). They were equallyspaced and parallel to each other. They were typically 20-70 µm wide, 10-40µm deepand 20-70 µm apart, i.e. about ten times bigger in size than the grooves observed onstress-free crystals (Fig. 3.3).
In the following, the term "A-type grooves" will be used to characterise the dissolutionmacrofeatures observed on the stressed crystals, while the structures observed onstress-free crystals will be called "B-type grooves".
3.1.2.1) Localisation and orientation of the grooves.
A-type grooves developed in all cases on both right and left sides of the hole. Thesegrooves were also present in the hole (Fig. 3.4), but not always over the entire length ofthe hole. A-type grooves developed often only on one face (one 10 × 6 mm face) of thecrystals. Stressed crystals, that fractured during the loading operation or just at thebeginning of the experiment, typically showed A-type grooves far away from the hole,sometimes covering the entire crystal surface on one side of the fracture (Fig. 3.5). A-type grooves never developed above or below the hole, even in the cases where theypropagated everywhere else on the crystal surface (Fig. 3.6). The grooves were alsooften observed on the small side faces of the crystals (10 × 4 mm faces).
A-type grooves appeared mostly as straight structures. They were either linear (see forexample Fig. 3.2), or showed a regular "zig-zag" pattern (Fig. 3.7). While theorientation of B-type grooves made an angle up to 40° with the direction of the bulkapplied stress, A-type grooves were always perpendicular (to within a few degrees) tothe bulk applied stress. However, A-type grooves appeared sometimes curved,especially in the vicinity of the hole (Fig. 3.8). This curved orientation of the groovesfollowed in that case the perpendicular to the local curved stress trajectories. Theorientation of the A-type grooves, the orientation of the 10 × 6 mm crystal face and thedirection of the bulk applied stress for all the experiments are given in Table 3.1. Theseorientations were determined with the help of the crystallographic facets of negativecrystal fluid inclusions.
Some experiments carried out at high stress (bulk stress 3.9-4.2 MPa, Table 3.1), at thelimit of the crystal brittle failure strength, have shown that A-type grooves could alsodevelop under these high stress conditions in directions that were not perpendicular tothe bulk applied stress or to the local stress trajectories. They sometimes even appearedto have developed roughly parallel to the direction of the applied stress. This situationled to the formation of a dissolution groove network (Fig. 3.9).
Chapter 3 Effect of stress on surface microstructures. 7. November 2000 41
3.1.2.2) Structure and shape of the grooves.
A-type grooves looked like alignments of etch pits. In every case, for straight as well asfor curved grooves, dissolution from these individual etch pits occurred along lowindex crystallographic directions, and formed small crystallographic facets (see forexample Fig. 3.3). The shape of the A-type grooves could be observed best in sideview, at the periphery of the holes, where they appeared in cross section as 10-40 µmdeep teeth (Fig 3. 10 and 3.11). In Fig. 3.11 it can be seen that the teeth are formed bycrystallographic facets. Size and shape of the A-type grooves are given for all theexperiments in Table 3.1.
3.2) Mechanism of formation of the grooves.
A comparison of the microstructure of the surface of a stress-free crystal (Fig. 3.1) withthe microstructure observed on the surface of a stressed surface (Fig. 3.3) suggests astrong influence of the stress on their formation. How are these dissolution groovesinitiated and why are they about ten times larger in size on both sides of the hole of thestressed crystals in comparison to the stress-free crystal?
3.2.1) Stability of stress-free crystal surfaces.
3.2.1.1) Influence of the surface energy.
The stability of a solid-fluid interface depends on the thermodynamic state of bothphases in contact with each other, each of them being characterised by a chemicalpotential. In equilibrium situation, both chemical potentials are equal. At temperatureT0, a stress-free crystal with no internal strain (i.e. free of structural defects) is inequilibrium with an aqueous solution saturated at temperature T0. In the experimentsconsidered here, however, a stress-free crystal is not in equilibrium with the aqueoussolution for two reasons. Firstly, the aqueous solution is intentionally undersaturated,i.e., its concentration is lower than it should be for a saturation at temperature T0. This
means that the chemical potential of the fluid is higher than that of the crystal, and thatthe crystal will dissolve, to bring material in the solution to reach the saturationconcentration. Secondly, the faces of the samples are not exactly parallel to low index,stable crystallographic planes (see Chapter 2). This means that the crystals can lowertheir surface energy by facetting. A faceted surface has indeed a lower surface energyand, hence, is more stable (e.g. Herring, 1951). For this reason, once in theundersaturated solution, the crystals loose some material by dissolving along low indexcrystallographic faces, e.g. for K-alum the {111}, {110} and {100} faces (Fig. 3.12).
Chapter 3 Effect of stress on surface microstructures. 7. November 2000 42
Observation after experiment under the microscope of fluid inclusions with negativecrystal shape shows that the fine B-type etch grooves observed on the surface of stress-free crystals (Fig. 3.1) are aligned along crystallographic directions, mostly <110>,and are thus intersections between crystallographic planes. However, many differentcrystallographic planes intersect the crystal surface. So what controls the particularintersection along which the grooves form?
3.2.1.2) Periodic bond chains.
The periodic bond chains (PBC) of a crystal are crystallographic directions in whichatoms are connected to each other by strong energetic bonds. Their number andorientation determine the macromorphology of a growing crystal (Hartman, 1987).They also determine the shape of dissolution pits (Heimann, 1975; Szurgot, 1995), sothat the study of etch pit morphology is often used to find PBC-directions in crystals.The PBC are the direction of high surface energy where the dissolution of a non-crystallographic face starts.
PBC-directions for a wide range of crystals are given by Kern (1955). For potassiumalum, the three principal PBC are, by order of strength:
- A-PBC
...SO42- - Al3+ - SO4
2- -- K+ -- SO42- - Al3+...
along <100> directions.
- B-PBC
...K+ -- SO42- -- K+ -- SO4
2- -- K+...
along <110> directions.
- C-PBC
...SO42- - Al3+ - SO4
2- --. K+ .-- SO42- - Al3+...
along <111> directions. The composition of the C-PBC is the same as the A-PBC, butthe bonds between potassium atoms and sulphate groups are about 20% longer.
The crystallographic faces are then classified as a function of the number and strengthof the PBC that are entirely contained in their plan:
Chapter 3 Effect of stress on surface microstructures. 7. November 2000 43
- {100}: two A- and two B-PBC,
- {111}: three B-PBC,
- {110}: one A-, one B- and two C-PBC.
The most common PBC-direction on the crystal surfaces of potassium alum is thusoriented along <110>. This explains why the B-type grooves observed on stress-freecrystals are mostly oriented along <110>-directions.
3.2.2) Stability of stressed crystal surfaces.
3.2.2.1) Influence of the stress distribution on the surface.
The dissolution of the crystal surface along intersections between crystallographicplanes, as described above (Fig. 3.12), gives the surface a "wavy" aspect (see forexample Fig. 3.11). Once under stress, such a structure oriented parallel to the bulkapplied stress leads to a non-homogeneous stress distribution on the surface. This stressnon-homogeneity may be very easily revealed by photoelasticity experiments carriedout on a Plexiglas sample with a similar geometry (Fig. 3.13). The stress is higher atconcavities ("valleys") than at convexities ("crests"). This stress gradient leads to asurface instability called the Grinfeld instability (Grinfeld, 1986). The stress gradient,and hence the surface instability, then depends on the amplitude and wavelength of thewavy structure.
Let us consider a semi-circular groove of radius r on the surface of a semi-infiniteisotropic plate of width d (Fig. 3.14). If we apply an uniaxial compressive stress σ∞ onthe plate at infinity, the stress will be higher at the periphery of the groove (M) than inthe middle of the section MN. The ratio between the maximum compressive stress atthe periphery of the groove and the compressive stress in the middle of the section MNis given by a constant k, called the factor of stress concentration. Timoshenko (1949)has shown that k ranges between 1 and 3 and increases for decreasing ratio r/d. Thesmaller the groove radius relatively to the width of the plate, the higher the stressheterogeneity it produces. This means that, under stress, the dissolution will beenhanced in the valleys, and a groove will grow in depth and width (so the ratio r/d willincrease) to decrease the stress heterogeneity on the surface. In this way, B-typegrooves (i.e. the surface energy-induced structures), may become A-type grooves (i.e.the stress-induced structures) to minimise the stress heterogeneity.
A-type grooves form always preferentially on both compressive sides of the hole, i.e.where the stress is the highest. This suggests that a "critical" stress may have to bereached for the development of A-type grooves.
Chapter 3 Effect of stress on surface microstructures. 7. November 2000 44
3.2.2.2) Relation between A-type grooves and PBC-directions.
Although the crystal faces were not exactly parallel to either {110}, {111} or {100}(see Chapter 2), the orientation of the A-type grooves could always be identified withan A- or B-PBC contained in the nearest crystallographic face. As mentioned above, acrystal surface generally contains more than one PBC-direction. In all the caseshowever, the PBC that was oriented the most perpendicular to the bulk applied stressappeared to be the one parallel to which A-type grooves developed. This could beillustrated with experiments 76KAD16b and 77KAD17. Both stressed crystals had thesame dissolving {110} face, but the stress was applied along a <110>-direction for thefirst and along a <100>-direction for the second. In both cases, the A-type groovesdeveloped roughly perpendicular to the applied stress, but along a <100> PBC-direction for experiment 76KAD16b and along a <110> PBC-direction for experiment77KAD17. When two PBC were oriented equally favourable for the formation of theA-type grooves, because both had about the same angle with the direction of theapplied stress, the resulting grooves showed a "zig-zag" shape. This could occur withtwo B-PBC (Fig. 3.7) or with an A- and a B-PBC.
3.2.2.3) Formation of a dissolution groove network.
In almost all of the experiments, the A-type grooves developed along a <110>-direction. This is due to the abundance of the B-PBC, so that for almost every crystalfaces there was always one B-PBC oriented roughly perpendicular to the applied stress.In the case of experiment 76KAD16b, the only B-PBC contained on the surface wasoriented roughly parallel to the bulk applied stress, while an A-PBC, along a <100>-direction, was oriented roughly perpendicular to it. As for all the other experiments, A-type grooves developed preferentially along the PBC the most perpendicular to thebulk applied compressive stress, in that case along an A-PBC. However, the B-PBCshowed also dissolution grooves (Fig. 3.15). Development of A-type grooves along aB-PBC direction parallel to the bulk applied stress was also observed in experiment59KAD9 (Fig. 3.9). The formation of B-type grooves parallel to the bulk applied stress,however, should not create a non-homogeneous stress distribution and the groovesshould not develop into A-type grooves. Moreover, following Kern (1955), the strengthof the interatomic bonds in the <110>-direction (B-PBC) is less that the strength of thebonds in the <100>- directions (A-PBC, see Paragraph 3.2.1.2). If dissolution can alsobe enhanced in grooves oriented parallel to the applied stress, as for both experimentsdescribed above, we should expect dissolution to take place also along the A-PBCwhen this is oriented parallel to the applied stress. This never happened. Hence, the<110> direction shows a particular behaviour under stress, and a mechanism other thanthe lowering of the surface energy may enhance the dissolution along this directionmore than along the other directions.
We have seen in Chapter 2 that for potassium alum, each aluminium and eachpotassium cation is surrounded by six water molecules. After Lipson & Beevers(1935), the arrangement of six water molecules around a potassium cation is rare.
Chapter 3 Effect of stress on surface microstructures. 7. November 2000 45
These authors have also shown that the water molecules surrounding the aluminiumcations are close to each other and the bonds linking them are strong and coplanar. Incontrast, the water molecules surrounding the potassium cations are far away from eachother, so that their arrangement around the cations is governed by external atoms, withwhich bonds are weak and not all in the same plane. It could thus be that this structureis more easily affected by stressing the crystal, so that <110>- directions, which presentthe highest density of K-6H2O groups, show a stronger dissolution.
Note, however, that the development of A-type grooves parallel to the bulk appliedstress direction was observed only for the experiments carried out under the higheststresses (bulk stress 3.9-4.2 MPa, corresponding to 12.5 MPa on both compressivesides of the hole), and for crystal faces oriented roughly parallel to {110} faces.Moreover, both experiments (59KAD9 and 76KAD16b) were also the only ones forwhich A-type grooves also developed along C-PBC, i.e. <111>-directions, at ~ 45° tothe bulk applied stress direction. This suggests that for such crystal face orientation,dissolution may be enhanced above a "critical" stress (about 3.5 MPa bulk stress) alongall the PBC-directions, and this independent of their orientation on the surface. Thismechanism may lead to the formation of a dissolution groove network as seen on Fig.3.9 and lead to a subsequent decomposition of the crystal surface in a lot of small parts.This process could lead for longer experiments to a cataclastic deformation of theentire crystal.
3.2.2.4) Role of stress-trajectories.
We have seen in Paragraph 3.2.2 that dissolution under stress led to a significantroughening of the crystal surface, with the formation of valleys (concavities) and crests(convexities). In the absence of the hole or far from it, the stress gradient betweenvalleys and crests is maximum for dissolution grooves perpendicular to the bulkapplied stress direction. A-type grooves propagate laterally perpendicular to the bulkapplied stress. In the vicinity of the hole, however, the stress trajectories are curved(Fig. 3.8). A-type grooves in that case still develop perpendicular to the maximumcompressive stress gradient direction, i.e. perpendicular to the maximum compressivestress trajectories, and are also curved (Fig. 3.8). The PBC-direction the mostperpendicular to the stress changes in that case along the perpendicular to stresstrajectories (Fig. 3.16).
3.2.3) Could crystal plastic strain play a role?
Fig 3.3 and especially Fig. 3.10 show that A-type grooves are formed by joining etchpits. What is the origin of these etch pits? Is it possible that these etch pits developed atscrew dislocation outcrops developed by crystal plastic deformation, i.e. could thedevelopment of dissolution grooves be due to crystal plastic deformation?
Chapter 3 Effect of stress on surface microstructures. 7. November 2000 46
We have seen in Chapter 2 that potassium alum cannot deform plastically under roomP-T conditions (Paragraph 2.1.1). The length of the stressed samples wassystematically measured before and after each experiment by hand with a micrometer,with a precision of 0.1%. None of the samples was found to have deformed plastically.To test whether even smaller amount of crystal plasticity could have played a role, twokey experiments were carried out:
(i) After a common experiment, a crystal that had dissolved under stress and showedabundant A-type grooves was placed back into the undersaturated solution from whichit came from and held in there again, for one hour, but without load. Investigation of thesurface afterwards showed that the A-type grooves had completely disappeared.
(ii) A crystal was held under stress in an approximately saturated solution for 2 hoursand then taken out. No grooves had developed. The sample was placed back into thesolution again and then the solution was diluted, and the crystal held in there for 24hours, without load. Investigation of the surface afterwards showed fine B-type etchgrooves, randomly distributed like on stress-free crystals, but not the wide and deep A-type grooves characteristic for crystals under stress.
The formation and development of A-type grooves is thus a purely elastic effect. Theetch pits observed on Fig. 3.10 are probably the intersection points between several lowindex crystallographic planes along which the crystal dissolved to decrease its surfaceenergy (see Paragraph 3.2.1.1).
3.2.4) Influence of stirring
A-type grooves mostly developed only on one frontal face (10 × 6 mm) of the stressedcrystals, and not on the back face. This could be due to an influence of the stirrer on theevolution of the surface microstructure. For this reason, experiment 76KAD16b wascarried out without stirring. A-type grooves developed on the stressed crystal as in thecase of experiments carried out with stirring. The formation of the grooves on one faceonly is thus more probably due to an eventual non-parallelism between the top and thebottom faces of the crystals, as a consequence of which one frontal face may be morestressed than the other.
3.3) In-situ experiments.
The experimental set-up used for the experiments described above and summarised inTable 3.1 allowed the study of the grooves only after experiment. It is very important,however, to know how fast A-type grooves develop, and how stable these structures arewith respect to small variations in stress. The experimental set-up discussed inParagraph 2.5 gave the opportunity to study the formation and development of thedissolution grooves directly under the microscope. Six experiments were carried out
Chapter 3 Effect of stress on surface microstructures. 7. November 2000 47
using this set-up, also on potassium alum single crystals. Table 3.2 gives theexperimental conditions for all the in-situ experiments.
3.3.1) Experimental procedures.
The experimental vessel consisted of a 1.1 mm thin Ertalon U-shaped piece stuckbetween two glass plates (Den Brok et al., 1998, 1999b). For each of the experiments(see Table 3.2), a 1 × 6 × 8 mm potassium alum crystal was placed in the vessel and a 1mm thick Vanadium-steel piston applied on it. The vessel was filled with a slightlyundersaturated (0.3°C) potassium alum aqueous solution with the help of a syringe.The top of the vessel was closed using silicon grease to prevent evaporation of thesolution. The vessel was then mounted on an horizontal microscope, and the stressapplied on the crystal with a dead weight through the piston. Destilled water could beadded in the vessel through the silicon grease in order to increase the degree ofundersaturation during the experiment. As a consequence of the very small volume of
the vessel (~200 mm3), the solution could not be stirred. The experiments were filmedwith the help of a digital colour video camera connected to a computer, using the NIH-image software.
3.3.2) Experimental observations.
Fig. 3.17 shows different time sequences of the in-situ experiment ISKAL1. The bulkapplied stress was held constant at 2.8 MPa, corresponding to up to 10 MPa on bothcompressive sides of the hole (Table 3.2). A-type grooves formed mostly at the rim ofthe hole and propagated outwards. Isolated A-type grooves also formed further awayfrom the hole (arrows in Fig. 3.17). As already observed in some of the experimentscarried out with the other experimental set up, the grooves developed in an orientationperpendicular to the local maximum compressive stress, especially on bothcompressive sides of the hole. After three days (t =71.25 hr), a fracture formed on theleft side of the hole in the crystal ISKAL1. This fracture formed as a consequence of adecrease in the crystal cross section due to dissolution. This fracture event led withinone hour to a 50% increase in the number of the A-type grooves. Several A-typegrooves joined together while propagating. Fig. 3.18 shows such a situation. The uppergroove (arrow) propagated horizontally, but after five hours it changed its direction to~30° to move towards a lower groove, with which it joined after 15 hours. A-typegrooves also moved independently of the other grooves in the vertical direction. Fig.3.19 shows such a movement. The groove moved upwards with an average velocity of
4 µm.hr-1. Horizontal propagation velocities up to 100 µm.hr-1 and vertical velocities
up to 10 µm.hr-1 were observed in the other in-situ experiments.
The effect of varying the stress on the development of the A-type grooves wasinvestigated in experiment ISKAL5. The absence of stirring of the aqueous solutionresulted in an influence of gravity, and convection occurred when destilled water was
Chapter 3 Effect of stress on surface microstructures. 7. November 2000 48
added in the vessel during the experiment. This resulted in the dissolution of the crystalat the upper part and precipitation of the dissolved material at lower part of the crystalsurface. The first time sequence shown on Fig. 3.20 illustrates a situation wheredestilled water had just been added. A-type grooves that had formed before the additionof destilled water, were filled up and smoothed out by precipitation of materialdissolved at the upper part of the crystal. By increasing at t = t0 the bulk applied stressfrom 3 to 4.7 MPa, corresponding to about 14 MPa on both compressive sides of thehole, the grooves could be "activated" again and developed very fast on bothcompressive sides of the hole. At t = t0 + 4.5 hr, the bulk applied stress was increased to6.7 MPa (up to 21 MPa on the compressive sides of the hole), what led to the formationof new A-type grooves, especially on the right side of the hole. The average wavelengthof the grooves decreased from ~35 µm to ~30 µm. At t = t0 + 24 hr, some grooves
started developing in a direction parallel to the bulk applied stress (arrow in Fig. 3.20).A further increase in the bulk stress to 7.1 MPa (up to 23 MPa on the compressive sidesof the hole) at t = t0 + 72 hr caused fracturing of the crystal and further development ofgrooves in the direction parallel to the bulk applied stress. This led to the formation of adissolution groove network and to a cataclastic deformation of the crystal surface. It isinteresting to note that this process resulted in a decrease in the number of horizontallyoriented A-type grooves. At t = t0 + 72 hr, the wavelength of the grooves was ~70 µm.
3.3.3) Discussion of in-situ results.
The most important information obtained from the in situ experiments is that the A-type grooves did not only propagate laterally perpendicular to the maximumcompressive stress direction, but could also move over the crystal surface, vertically(Fig. 3.19) or towards other grooves (Fig. 3.18). These movements suggest that the A-type groove-development was affected by local stress heterogeneities, possibly due tothe presence on the surface of crystal defects or impurities. It may also suggest theinfluence of far field effects on the development of A-type grooves. The development ofB-type grooves, which are surface energy-induced structures, in A-type grooves, whichare stress-induced structures (see Paragraph 3.2.2.1), depends on the stress intensityand may need to overcome a "critical" stress value (it is why the A-type groovesdevelop preferentially on both compressive sides of the hole). It could be that, bydissolution of the crystal surface in the undersaturated solution, internal crystal defectscame to the surface and caused a stress concentration around them, thus inducing avariation with time in the position of the sites where this "critical" stress was reached,what could be responsible of the apparent movement of the grooves. The very fastformation of new A-type grooves after fracturing of the crystal (Fig. 3.17) shows thatthe development of the grooves reacts very quickly to a sudden variation of the surfacestress distribution.
The last time sequence from the experiment ISKAL5 shown on Fig. 3.20 shows surfacestructures very similar to those observed after the experiment 59KAL9 (Fig. 3.9). A-type dissolution grooves started developing parallel to the direction of the bulk appliedstress at σb = 6.7 MPa (corresponding to 21 MPa on both sides left and right of thehole). As the crystal fractured, at σb = 7.1 MPa (corresponding to about 23 MPa on
Chapter 3 Effect of stress on surface microstructures. 7. November 2000 49
both sides of the hole), this suggests that the development of A-type grooves parallel tothe direction of the bulk applied stress only occurred near the limit of brittle failurestrength of the crystal. Microcracking of the crystal surface may occur under such highstress conditions and lead to enhanced dissolution in directions that are no more stress-controlled. This is turn may lead to a cataclastic deformation of the crystal.
We have so far suggested that A-type grooves developed from B-type grooves, that hadformed by the dissolution in the undersaturated solution of the crystal surface alongPBC-directions (see Paragraph 3.2.1.1). However, A-type grooves were also observedin situ to develop in saturated solution. Experiment ISKAL4 was carried out on acrystal on which scratches were intentionally made to get a rough surface. A concavitycorresponding to half a 2 mm diameter hole was made on one side of the crystal (Fig.3.21). Once the sample was placed under stress in the saturated solution, A-typegrooves developed from the scratches at the rim of the concavity, i.e. where the stresswas the highest. Hence, it appeared that as soon as the crystal surface was rough, itbecame unstable under stress (this is the Grinfeld instability, see Paragraph 3.2.2.1) andinduced the formation of A-type grooves. The undersaturation of the aqueous solutiononly played the role of a driving force for the roughening of the surface. When thecrystal surface showed no roughness at all and was crystallographically stable (i.e.exactly parallel to a low index crystallographic plane), as was the case for theexperiment ISKAL6 (Table 3.2), no dissolution grooves developed, in saturated nor inundersaturated solution.
3.4) Theoretical approach.
A very important observation is that A-type grooves only developed in the higheststressed regions of the crystals. If the crystals did not fracture, these grooves developedon both compressive sides of the hole, and nowhere else. There was no intermediatestate between the fine B-type grooves observed on stress-free crystals and the wide A-type grooves observed on stressed crystals. We already suggested that the formation ofA-type grooves may occur once a critical stress is reached. At this critical stress, thesurface energy-induced B-type grooves caused the crystal surface to become unstable.The grooves developed in A-type grooves to reduce the non-homogeneous surfacestress distribution (Timoshenko, 1949), and grew until their wavelength was inequilibrium with the aqueous solution for the local conditions of stress and surfaceenergy on the crystal surface. What defines this equilibrium wavelength, and whatdefines the critical stress at which the grooves start growing? The model developed byHeidug & Leroy (1994) and Leroy & Heidug (1994) and described in Chapter 1analyses the stability of a wavy perturbation on a stressed surface, as a function of thestress, the surface energy and the local curvature of the surface. We will in thisparagraph try to apply this model to the experiments carried out in this thesis andcompare the theoretical predictions to the obtained experimental results.
Chapter 3 Effect of stress on surface microstructures. 7. November 2000 50
3.4.1) Estimation of the equilibrium configuration.
Some differences exist between the theoretical conditions considered by Heidug &Leroy (1994) and Leroy & Heidug (1994) and our experimental conditions.
Firstly, the conditions of stress we used were not hydrostatic. We had a differential stress. In their model, the applied stress is hydrostatic at infinity. However, a differential stress also exists in their model at the hole boundary, due to the difference between normal stress and tangential stress, and is written as σdiff = 2σ∞ +2p -2γ/R , where σ∞ is the hydrostatic stress applied at infinity, p is the fluid pressure, γ is the surface tension and R is the hole radius. In our case, the bulk stress applied on the crystal was much bigger than the fluid pressure and the surface energy term, so that we can consider σdiff = 2σ∞ = 2σ‘ , where σ‘ is the effective stress. Another problem is
that under non-hydrostatic stress, the circular cylindrical pore geometry ceases to be an equilibrium geometry, so that the linear stability analysis used for the calculation of the equilibrium shape of the hole can not be directly applied. However, the flattening of the hole observed in our experiments was slight, with a vertical to horizontal radius ratio always around 0.9.
Secondly, their model considers the fluid phase as saturated, in equilibrium with astress-free solid matrix. Our experiments, however, were carried out in anundersaturated solution, so that none of the solid or fluid phases were inthermodynamic equilibrium. However, this second consideration has only an effect onthe chemical potential of the fluid and causes no change in the formulation of thedriving force (equation 1.1), and no change in the formulation of the equilibriumwavelength (equation 1.5). The undersaturation plays in our experiments only the roleof the driving force for the roughening of the crystal surface, i.e. it induces theformation of the wavy perturbation on the initial flat surface.
Finally, we need also to note in their model that the kinetics of growth and dissolutionof the surface are assumed to be controlled by surface reactions. Van der Hoek et al.(1983) have shown that the dissolution of K-alum is strongly influenced by surfaceprocesses at low undersaturation (up to ~2°C, in their case the undersaturation wasobtained by increasing the solution temperature). At high undersaturation, they foundthat volume diffusion is the dominant process. All our experiments were carried out atan undersaturation lower than 2°C (see Table 3.1), so that the assumption of a surfacereactions controlled process is valid.
Let us now estimate how the surface of the stressed crystals would evolve accordinglyto the model of Heidug & Leroy (1994) and Leroy & Heidug (1994).
We have seen that as the surface of the crystals used in our experiments was unstable,the crystals dissolved along low index crystallographic faces to get a lower surfaceenergy. This process gave to the surface a "wavy" aspect, which can be considered asthe "sinusoidal disturbance" of the model. Although the exact values of some of theparameters involved are not known for K-alum, let us calculate what will be thedominant wavenumber under the stress conditions used in the experiments.
Chapter 3 Effect of stress on surface microstructures. 7. November 2000 51
According to van der Hoek et al. (1983), the surface energy of K-alum is a little bitlarger than its edge free energy, which they found to be 0.01 Pa.m. We will use thevalue of γ = 0.05 Pa.m calculated from the Nielsen-Söhnel empirical relationship(Nielsen & Söhnel, 1971). For the Poisson ratio, we will take the average value of ν =0.25. Under these considerations, with a pore radius R = 0.001 m, an effective stress σ= 7.5 MPa (corresponding to a differential stress of 15 MPa, i.e. five times the bulkapplied stress, see Chapter 2) and a Young modulus E = 20 GPa, the equation (1.5)gives a wavenumber ξ = 211. Dividing the perimeter of the pore by ξ , we get thewavelength of the equilibrium configuration δ = 30 µm, what means an A-type groovewidth of 15 µm. This value is in quite good agreement with the distance separating theA-type grooves observed on both sides of the stressed holes.
3.4.2) Influence of small variations in the parameters.
The grooves that developed on both sides of the hole in our experiments developed on aflat surface (except those that propagated into the hole), so with R = ∞ . As thewavelength of the equilibrium configuration is obtained by dividing the perimeter ofthe hole by the wavenumber, the pore radius has no influence on the calculation (thesurface energy term is much smaller than the effective stress). We can thus also applythe theory of Heidug & Leroy (1994) and Leroy & Heidug (1994) to flat surfaces.
Variation of the Poisson ratio causes no significant change. An increase in the surfaceenergy from γ = 0.05 Pa.m to γ = 0.08 Pa.m increases the width of the equilibriumgrooves from δ = 15 µm to δ = 24 µm. An increase in the value of the stress from 7.5MPa to 10 MPa, on the contrary, decreases this wavelength from δ = 15 µm to δ = 8µm. This illustrates very well the opposite effect of surface energy and stress. Thesurface energy always tends to flatten the surface of the sample.
3.4.3) Relation between stress and A-type groove size.
Fig. 3.22 shows the variation of the distance between A-type grooves with anestimation of the stress in the regions of the crystals where they formed. The estimationof the stress was calculated by dividing the bulk load by the section of the crystal wherethe grooves formed, at the end of the experiments. In spite of a wide dispersion in thedata, the tendency for {111} and {100} faces is a decrease in the wavelength withincreasing stress. This is in agreement with the model of Heidug & Leroy (1994) andLeroy & Heidug (1994). The {110} face shows a variation of the size of the grooveswith the stress that is much less pronounced than for the other faces. However, thedispersion in the data does not allow the definition of a variation trend for this face.This difference in behaviour between the {110} face and the other two ones is alsoreflected in the dependence of the wavelength of the grooves with the degree ofundersaturation (Fig. 3.23). The smallest grooves were also observed on this face. This
Chapter 3 Effect of stress on surface microstructures. 7. November 2000 52
result, and the observation that the <110> directions seem more affected by the stress(see Paragraph 3.2.2.3), suggests an influence of the surface energy.
3.5) Conclusions.
In this chapter, the effect of an applied compressive stress on the surfacemicrostructures of potassium alum single crystals in contact with an aqueouspotassium alum solution was investigated. We found that the roughness of the crystalsurface played a key role, in the way that it caused a non-homogeneous elastic straindistribution on the surface, the strain being higher in concavities than on convexities.This roughness needed to be periodic, i.e. to have a characteristic wavelength. Theroughness could be induced by dissolution of the crystals in undersaturated solutionalong low index crystallographic faces (thus forming B-type grooves), or byintentionally made scratches on the surface. In both cases, the non-homogeneoussurface stress distribution led to an enhanced dissolution in the concavities and to asubsequent increase in the wavelength of the roughness. This was characterised by thedevelopment on the crystal surface of wide and deep dissolution grooves (A-typegrooves) perpendicular to the maximum compressive stress direction. The observedstress-induced evolution of the surface microstructures could be described quiteaccurately with the theoretical model of Heidug & Leroy (1994) and Leroy & Heidug(1994). The instability caused by the non-homogeneous surface stress distribution iscorrected by the growth of the roughness until a stable wavelength is reached, forwhich the crystal surface is in equilibrium with the aqueous solution under the localstress conditions. This stable configuration may hold as long as the stress stays in therange given by the equations (1.6) (see Chapter 1).
We noted that A-type grooves never formed in the tension regions, i.e. above and belowthe hole (see Fig. 3.6, to compare with the FLAC simulation of Fig. 2.7). This may bedue to the fact that the stress there is about three times lower than on both sides left andright of the hole, so that the critical stress for the development of A-type grooves isnever reached there.
We also observed an influence of the surface tension on the size of the A-type grooveswhich, for a given degree of undersaturation, are bigger on {100} faces than on {110}faces (Fig. 3.22 and 3.23). This influence of crystallography on the behaviour ofstressed solid-fluid interface was also observed by Ristic et al. (1997) in growthexperiments. These authors found on potassium alum single crystals subjected totensile stress in oversaturated solution that the growth rate of both {100} and {110}faces was strongly affected by the stress, while the one of the {111} faces showedalmost no change. We found that A-type grooves developed mostly along <110>crystallographic directions, although these are the most abundant low index directions.
For experiments carried out under high stress, near the brittle failure strength, A-typegrooves were observed to develop along all the PBC- directions and no more onlyalong the PBC-direction that was oriented perpendicular to the maximum compressivestress direction. This process may lead to cataclastic deformation of the crystal.
Chapter 3 Effect of stress on surface microstructures. 7. November 2000 53
We have reported in this chapter on a strong effect of the stress on the microstructuralevolution of a crystal-solution interface. The effect observed was a pure elastic effect.Now what can be the effect of stress on the dissolution rate of crystals?
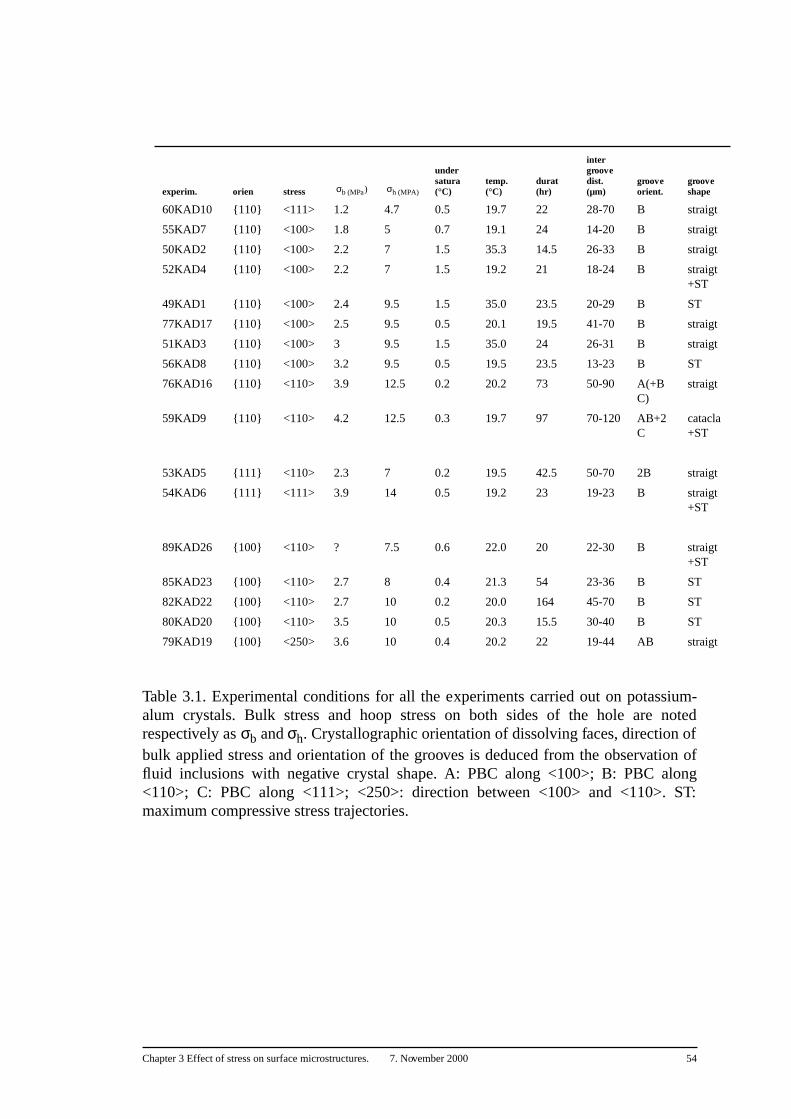
Chapter 3 Effect of stress on surface microstructures. 7. November 2000 54
Table 3.1. Experimental conditions for all the experiments carried out on potassium-alum crystals. Bulk stress and hoop stress on both sides of the hole are notedrespectively as σb and σh. Crystallographic orientation of dissolving faces, direction ofbulk applied stress and orientation of the grooves is deduced from the observation offluid inclusions with negative crystal shape. A: PBC along <100>; B: PBC along<110>; C: PBC along <111>; <250>: direction between <100> and <110>. ST:maximum compressive stress trajectories.
experim. orien stress σb (MPa) σh (MPA)
undersatura (°C)
temp. (°C)
durat (hr)
intergroovedist. (µm)
grooveorient.
grooveshape
60KAD10 {110} <111> 1.2 4.7 0.5 19.7 22 28-70 B straigt
55KAD7 {110} <100> 1.8 5 0.7 19.1 24 14-20 B straigt
50KAD2 {110} <100> 2.2 7 1.5 35.3 14.5 26-33 B straigt
52KAD4 {110} <100> 2.2 7 1.5 19.2 21 18-24 B straigt+ST
49KAD1 {110} <100> 2.4 9.5 1.5 35.0 23.5 20-29 B ST
77KAD17 {110} <100> 2.5 9.5 0.5 20.1 19.5 41-70 B straigt
51KAD3 {110} <100> 3 9.5 1.5 35.0 24 26-31 B straigt
56KAD8 {110} <100> 3.2 9.5 0.5 19.5 23.5 13-23 B ST
76KAD16 {110} <110> 3.9 12.5 0.2 20.2 73 50-90 A(+BC)
straigt
59KAD9 {110} <110> 4.2 12.5 0.3 19.7 97 70-120 AB+2C
catacla+ST
53KAD5 {111} <110> 2.3 7 0.2 19.5 42.5 50-70 2B straigt
54KAD6 {111} <111> 3.9 14 0.5 19.2 23 19-23 B straigt+ST
89KAD26 {100} <110> ? 7.5 0.6 22.0 20 22-30 B straigt+ST
85KAD23 {100} <110> 2.7 8 0.4 21.3 54 23-36 B ST
82KAD22 {100} <110> 2.7 10 0.2 20.0 164 45-70 B ST
80KAD20 {100} <110> 3.5 10 0.5 20.3 15.5 30-40 B ST
79KAD19 {100} <250> 3.6 10 0.4 20.2 22 19-44 AB straigt
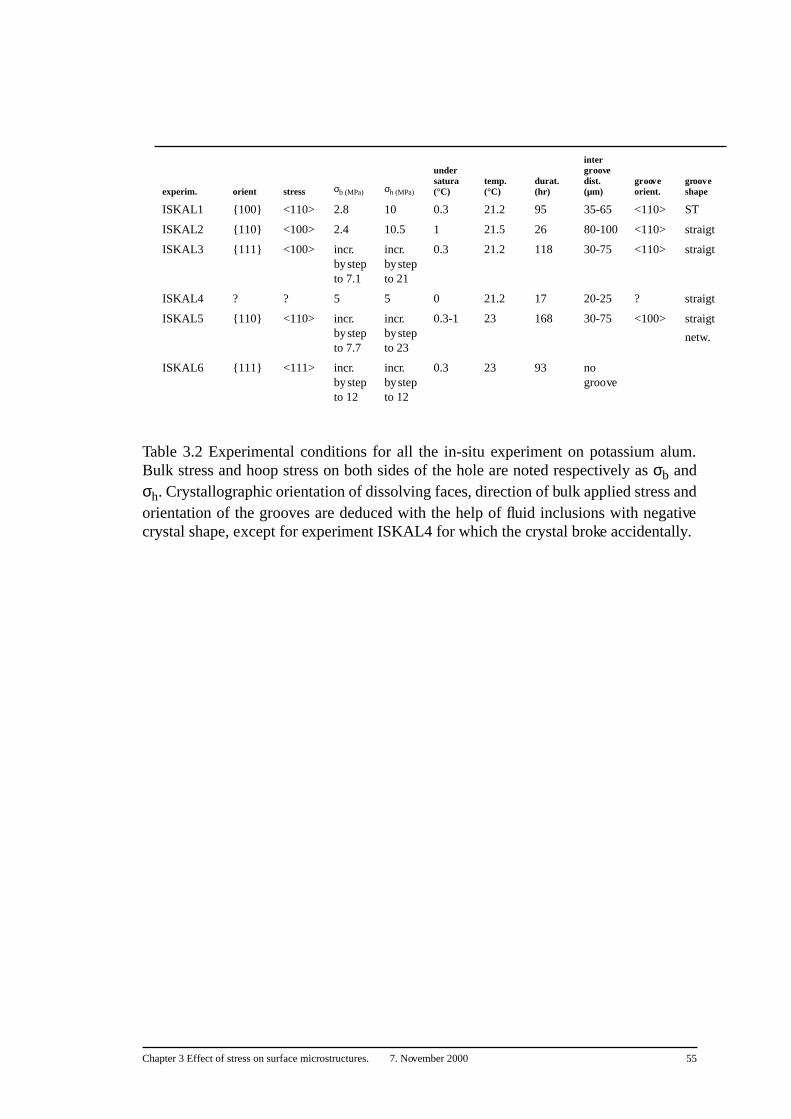
Chapter 3 Effect of stress on surface microstructures. 7. November 2000 55
Table 3.2 Experimental conditions for all the in-situ experiment on potassium alum.Bulk stress and hoop stress on both sides of the hole are noted respectively as σb andσh. Crystallographic orientation of dissolving faces, direction of bulk applied stress andorientation of the grooves are deduced with the help of fluid inclusions with negativecrystal shape, except for experiment ISKAL4 for which the crystal broke accidentally.
experim. orient stress σb (MPa) σh (MPa)
undersatura (°C)
temp. (°C)
durat. (hr)
intergroovedist. (µm)
grooveorient.
groove shape
ISKAL1 {100} <110> 2.8 10 0.3 21.2 95 35-65 <110> ST
ISKAL2 {110} <100> 2.4 10.5 1 21.5 26 80-100 <110> straigt
ISKAL3 {111} <100> incr. by step to 7.1
incr. by step to 21
0.3 21.2 118 30-75 <110> straigt
ISKAL4 ? ? 5 5 0 21.2 17 20-25 ? straigt
ISKAL5 {110} <110> incr. by step to 7.7
incr. by step to 23
0.3-1 23 168 30-75 <100> straigt
netw.
ISKAL6 {111} <111> incr. by step to 12
incr. by step to 12
0.3 23 93 no groove
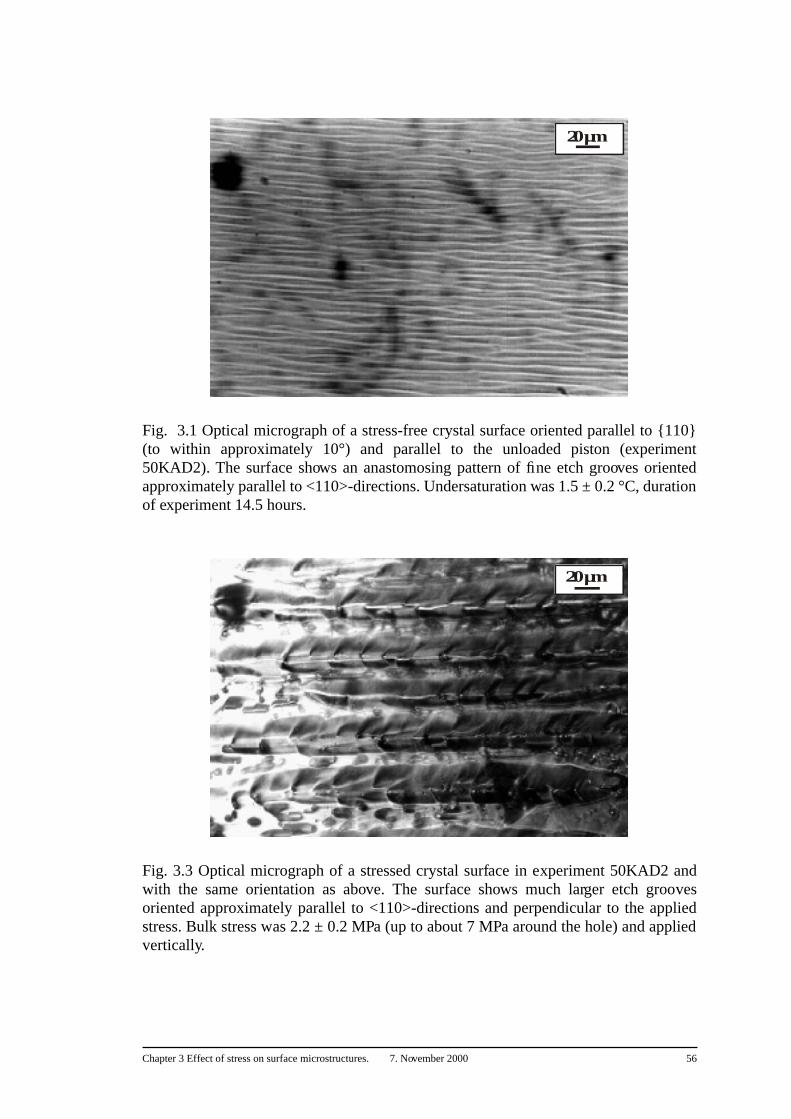
Chapter 3 Effect of stress on surface microstructures. 7. November 2000 56
Fig. 3.1 Optical micrograph of a stress-free crystal surface oriented parallel to {110}(to within approximately 10°) and parallel to the unloaded piston (experiment50KAD2). The surface shows an anastomosing pattern of fine etch grooves orientedapproximately parallel to <110>-directions. Undersaturation was 1.5 ± 0.2 °C, durationof experiment 14.5 hours.
Fig. 3.3 Optical micrograph of a stressed crystal surface in experiment 50KAD2 andwith the same orientation as above. The surface shows much larger etch groovesoriented approximately parallel to <110>-directions and perpendicular to the appliedstress. Bulk stress was 2.2 ± 0.2 MPa (up to about 7 MPa around the hole) and appliedvertically.
20 µm
20 µm
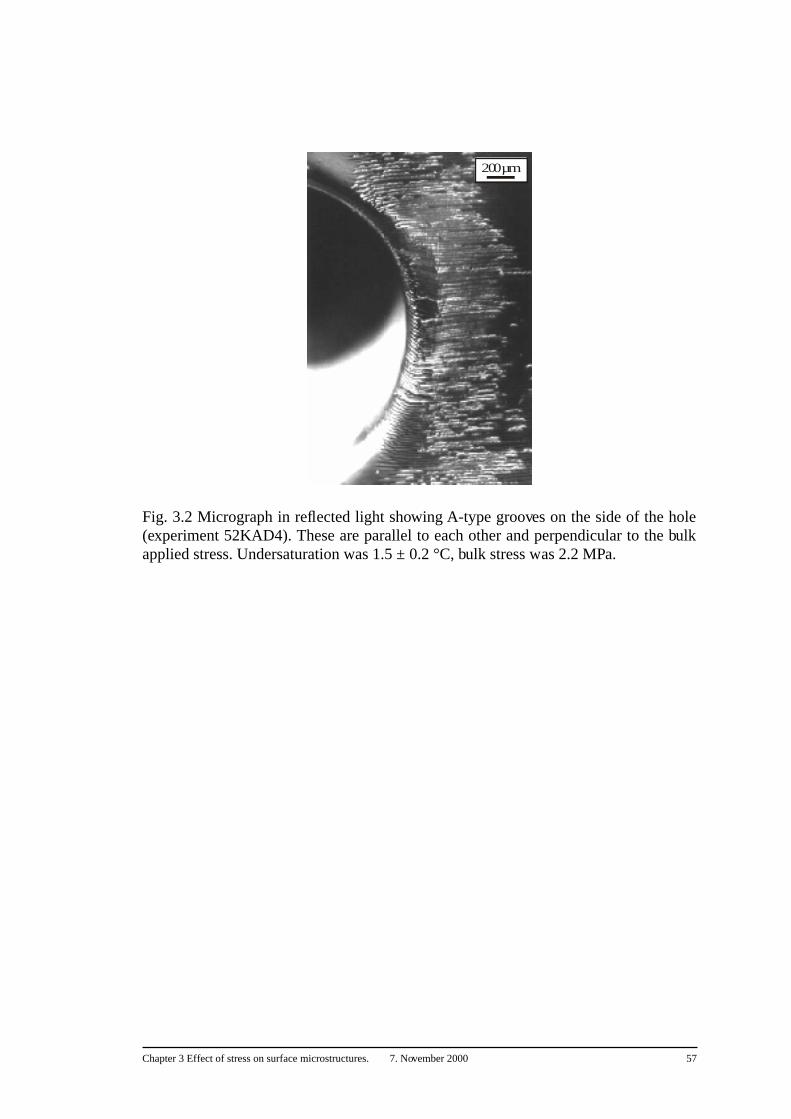
Chapter 3 Effect of stress on surface microstructures. 7. November 2000 57
Fig. 3.2 Micrograph in reflected light showing A-type grooves on the side of the hole(experiment 52KAD4). These are parallel to each other and perpendicular to the bulkapplied stress. Undersaturation was 1.5 ± 0.2 °C, bulk stress was 2.2 MPa.
200 µm
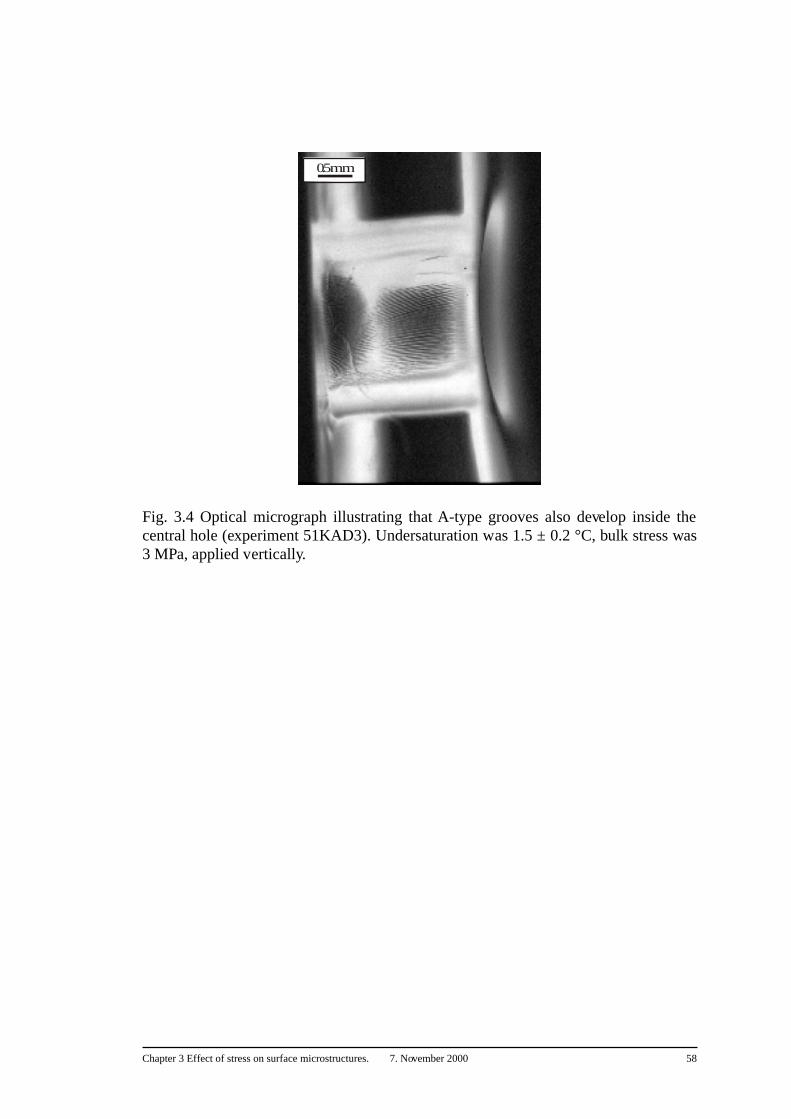
Chapter 3 Effect of stress on surface microstructures. 7. November 2000 58
Fig. 3.4 Optical micrograph illustrating that A-type grooves also develop inside thecentral hole (experiment 51KAD3). Undersaturation was 1.5 ± 0.2 °C, bulk stress was3 MPa, applied vertically.
0.5 mm
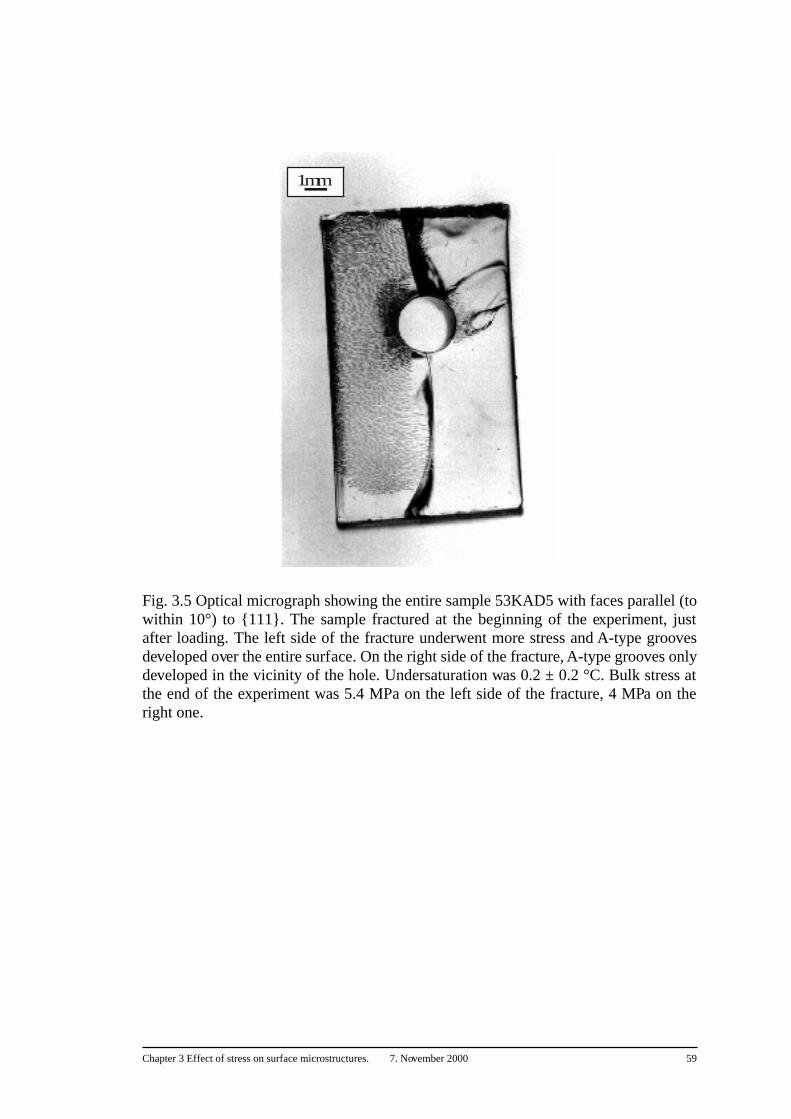
Chapter 3 Effect of stress on surface microstructures. 7. November 2000 59
Fig. 3.5 Optical micrograph showing the entire sample 53KAD5 with faces parallel (towithin 10°) to {111}. The sample fractured at the beginning of the experiment, justafter loading. The left side of the fracture underwent more stress and A-type groovesdeveloped over the entire surface. On the right side of the fracture, A-type grooves onlydeveloped in the vicinity of the hole. Undersaturation was 0.2 ± 0.2 °C. Bulk stress atthe end of the experiment was 5.4 MPa on the left side of the fracture, 4 MPa on theright one.
1 mm
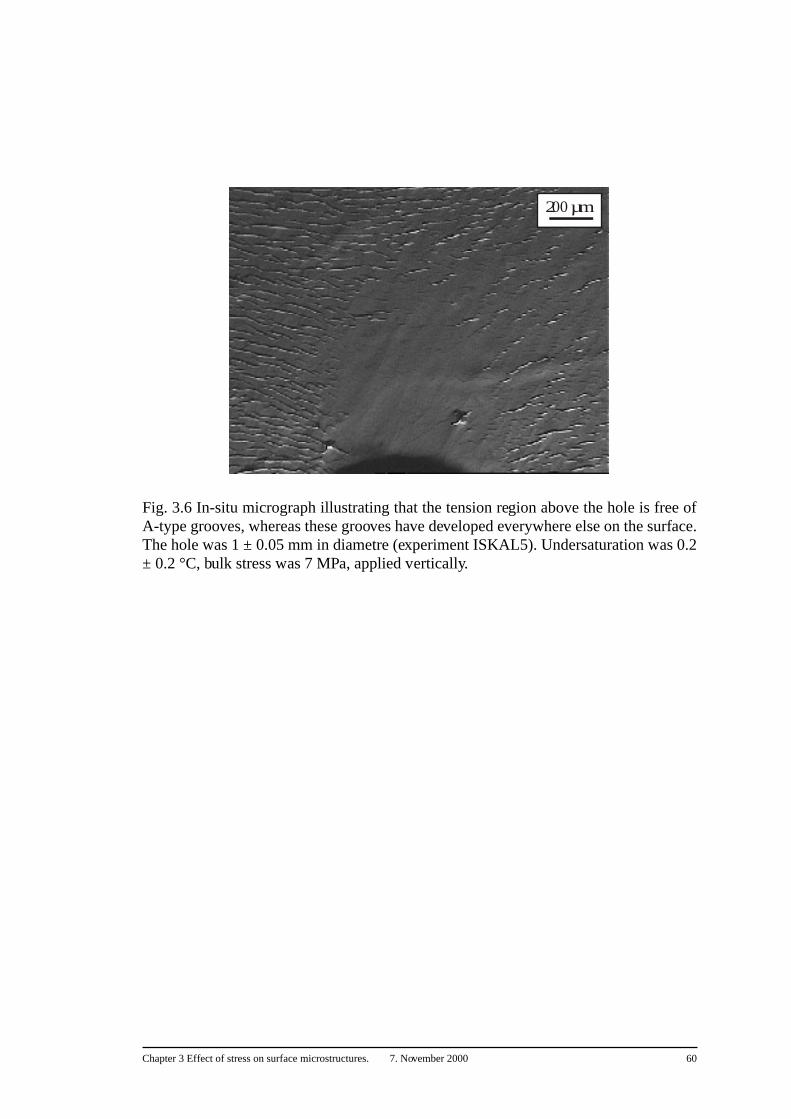
Chapter 3 Effect of stress on surface microstructures. 7. November 2000 60
Fig. 3.6 In-situ micrograph illustrating that the tension region above the hole is free ofA-type grooves, whereas these grooves have developed everywhere else on the surface.The hole was 1 ± 0.05 mm in diametre (experiment ISKAL5). Undersaturation was 0.2± 0.2 °C, bulk stress was 7 MPa, applied vertically.
200 µm
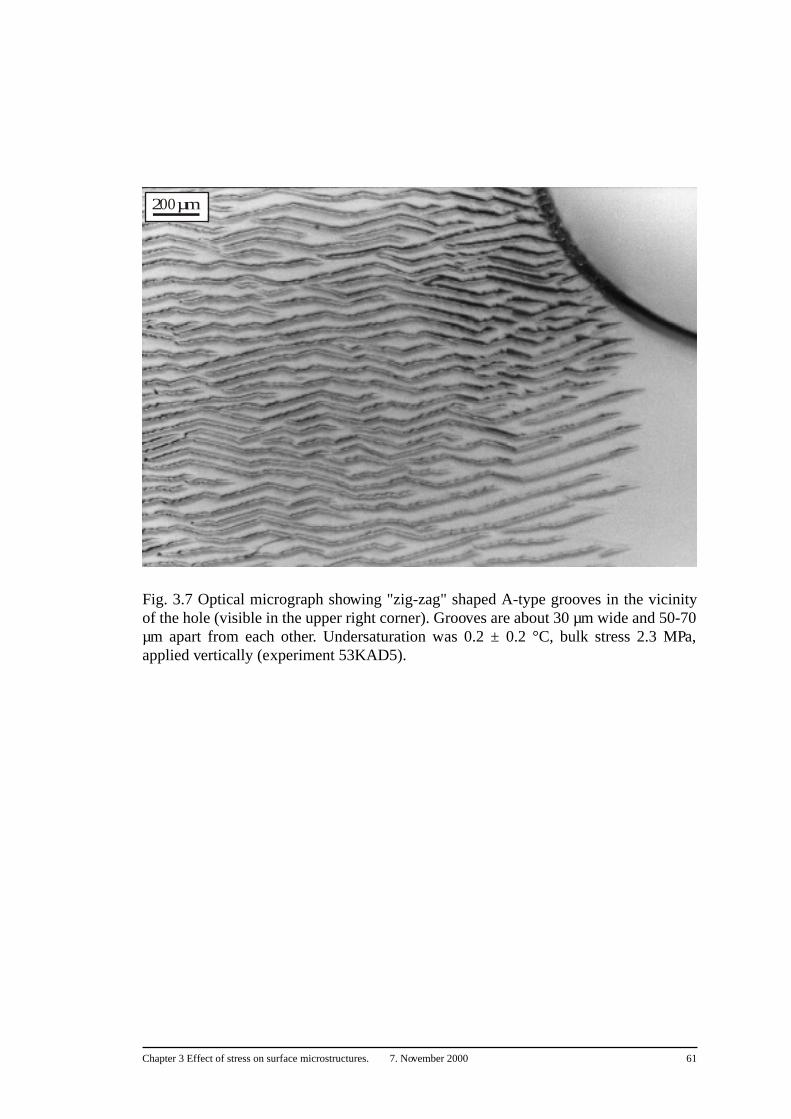
Chapter 3 Effect of stress on surface microstructures. 7. November 2000 61
Fig. 3.7 Optical micrograph showing "zig-zag" shaped A-type grooves in the vicinityof the hole (visible in the upper right corner). Grooves are about 30 µm wide and 50-70µm apart from each other. Undersaturation was 0.2 ± 0.2 °C, bulk stress 2.3 MPa,applied vertically (experiment 53KAD5).
200 µm
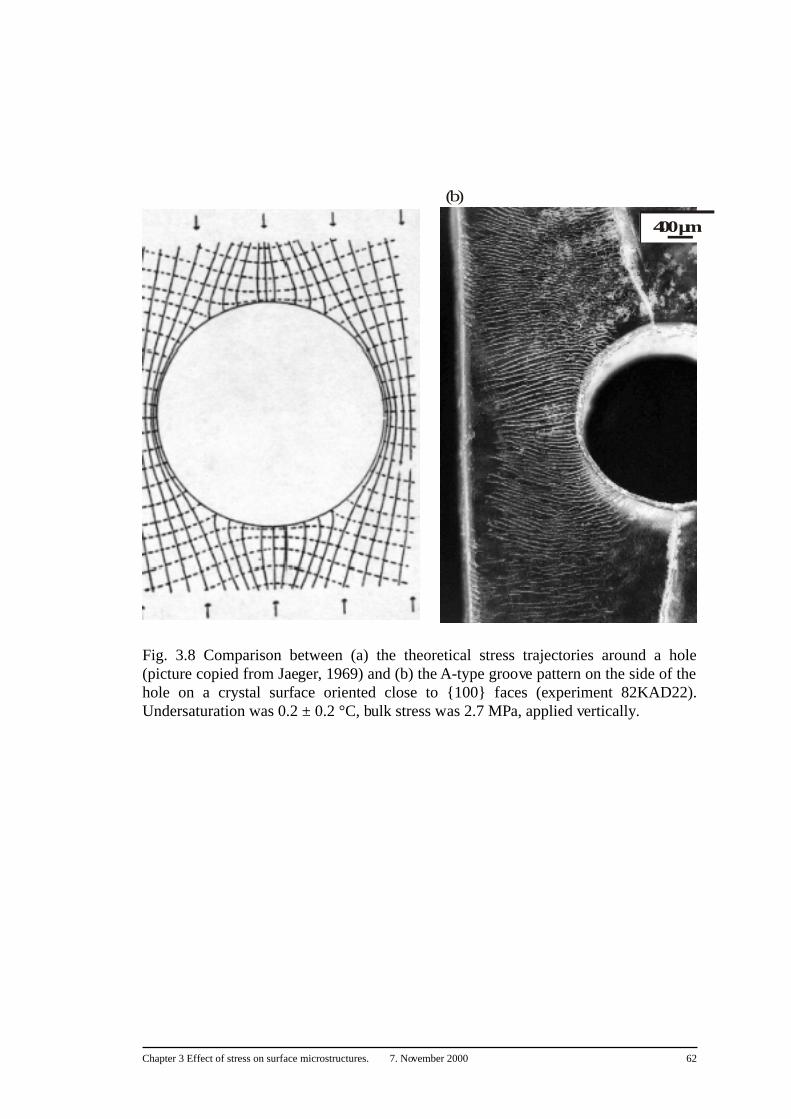
Chapter 3 Effect of stress on surface microstructures. 7. November 2000 62
Fig. 3.8 Comparison between (a) the theoretical stress trajectories around a hole(picture copied from Jaeger, 1969) and (b) the A-type groove pattern on the side of thehole on a crystal surface oriented close to {100} faces (experiment 82KAD22).Undersaturation was 0.2 ± 0.2 °C, bulk stress was 2.7 MPa, applied vertically.
400 µm
(b)
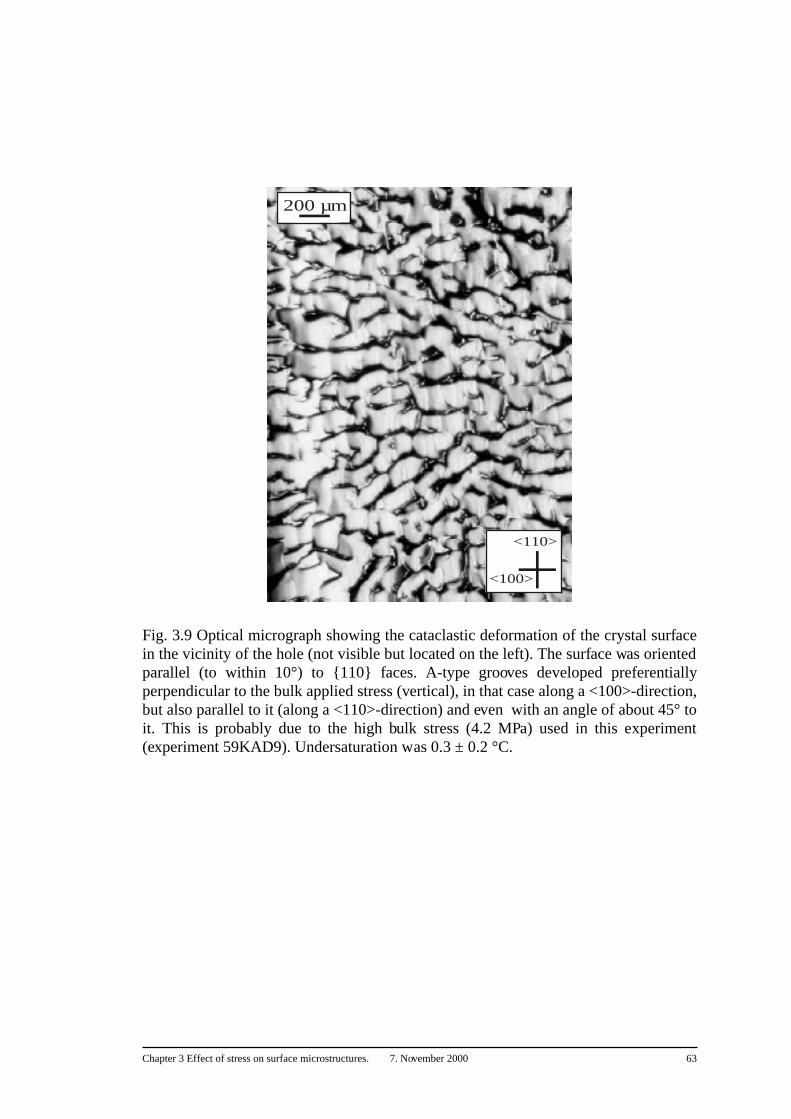
Chapter 3 Effect of stress on surface microstructures. 7. November 2000 63
Fig. 3.9 Optical micrograph showing the cataclastic deformation of the crystal surfacein the vicinity of the hole (not visible but located on the left). The surface was orientedparallel (to within 10°) to {110} faces. A-type grooves developed preferentiallyperpendicular to the bulk applied stress (vertical), in that case along a <100>-direction,but also parallel to it (along a <110>-direction) and even with an angle of about 45° toit. This is probably due to the high bulk stress (4.2 MPa) used in this experiment(experiment 59KAD9). Undersaturation was 0.3 ± 0.2 °C.
<110>
<100>
200 µm
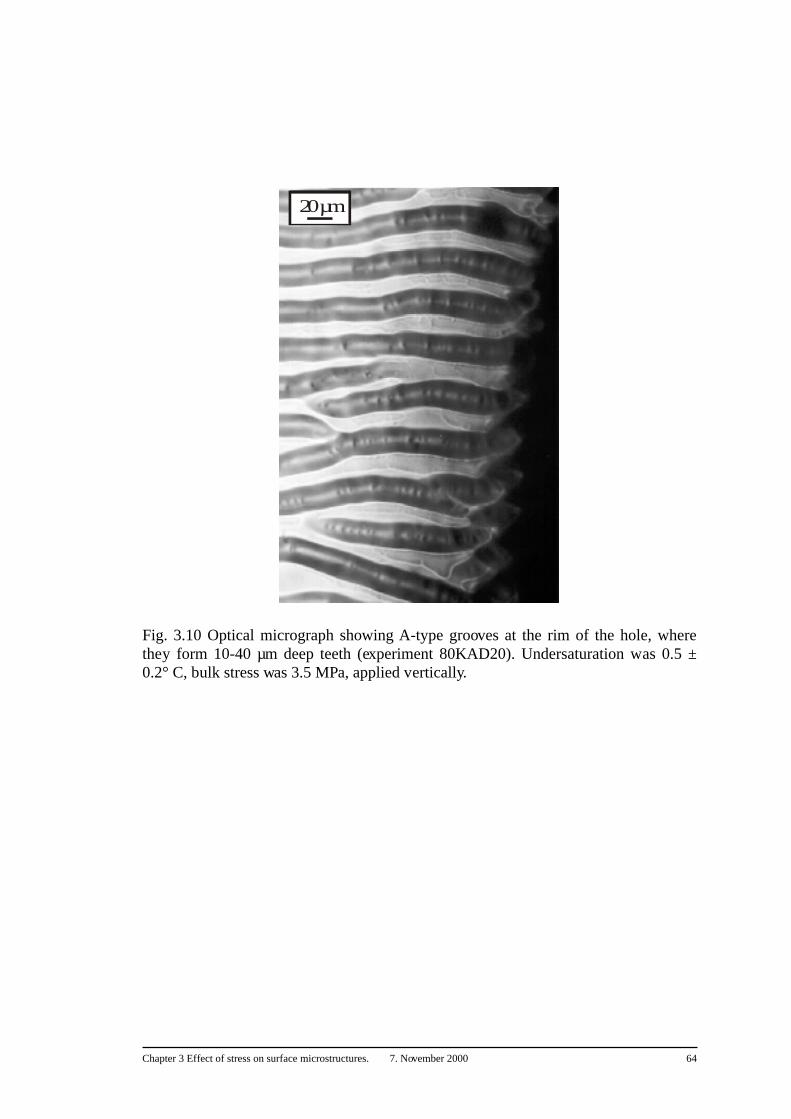
Chapter 3 Effect of stress on surface microstructures. 7. November 2000 64
Fig. 3.10 Optical micrograph showing A-type grooves at the rim of the hole, wherethey form 10-40 µm deep teeth (experiment 80KAD20). Undersaturation was 0.5 ±0.2° C, bulk stress was 3.5 MPa, applied vertically.
20 µm
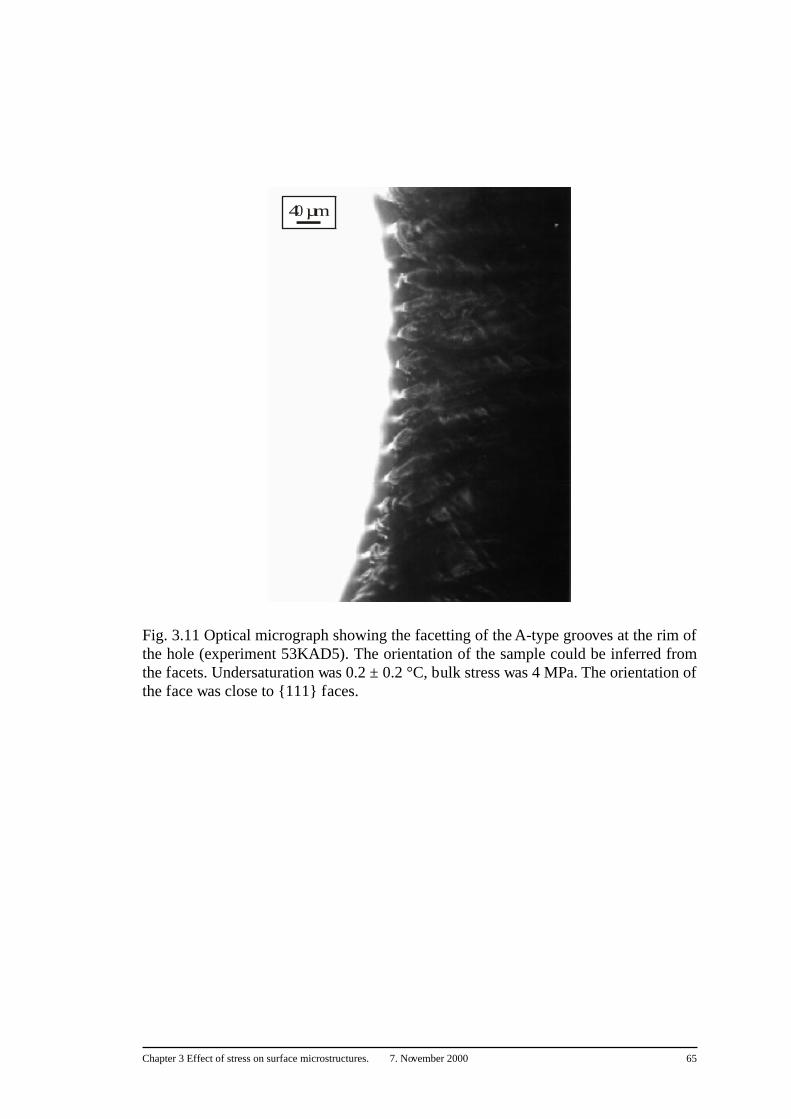
Chapter 3 Effect of stress on surface microstructures. 7. November 2000 65
Fig. 3.11 Optical micrograph showing the facetting of the A-type grooves at the rim ofthe hole (experiment 53KAD5). The orientation of the sample could be inferred fromthe facets. Undersaturation was 0.2 ± 0.2 °C, bulk stress was 4 MPa. The orientation ofthe face was close to {111} faces.
40 µm
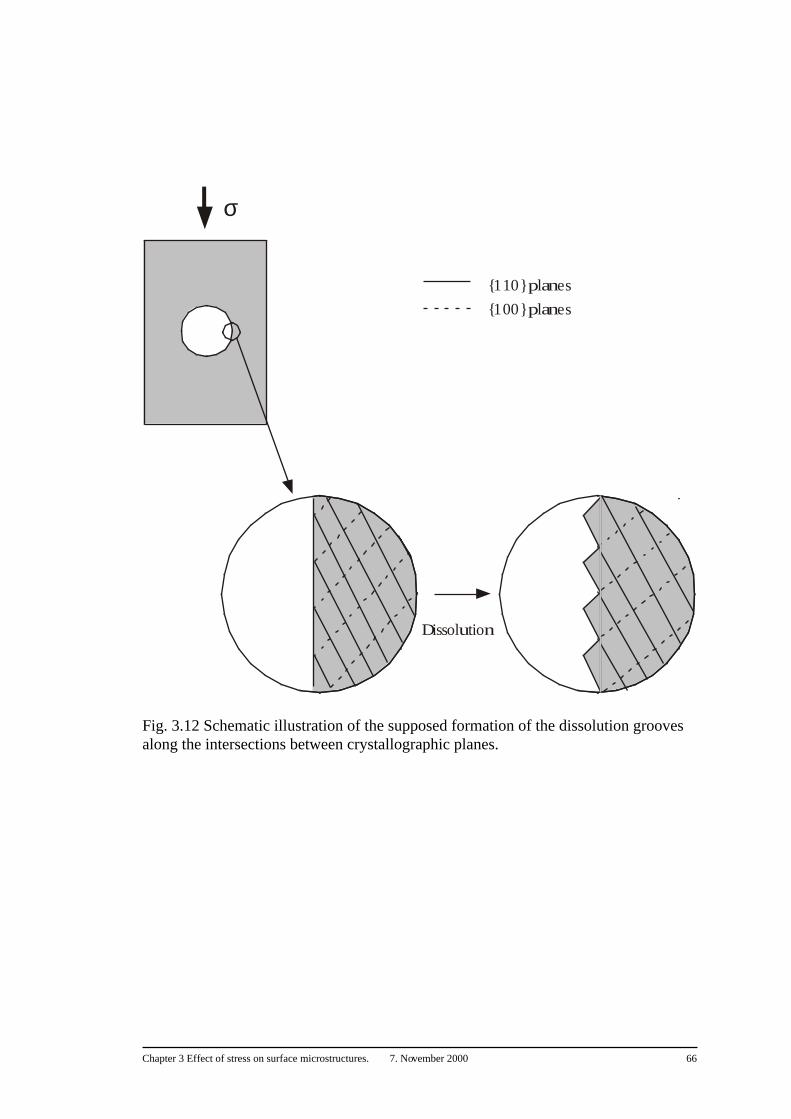
Chapter 3 Effect of stress on surface microstructures. 7. November 2000 66
Fig. 3.12 Schematic illustration of the supposed formation of the dissolution grooves along the intersections between crystallographic planes.
σ
{110} planes
{100} planes
Dissolution
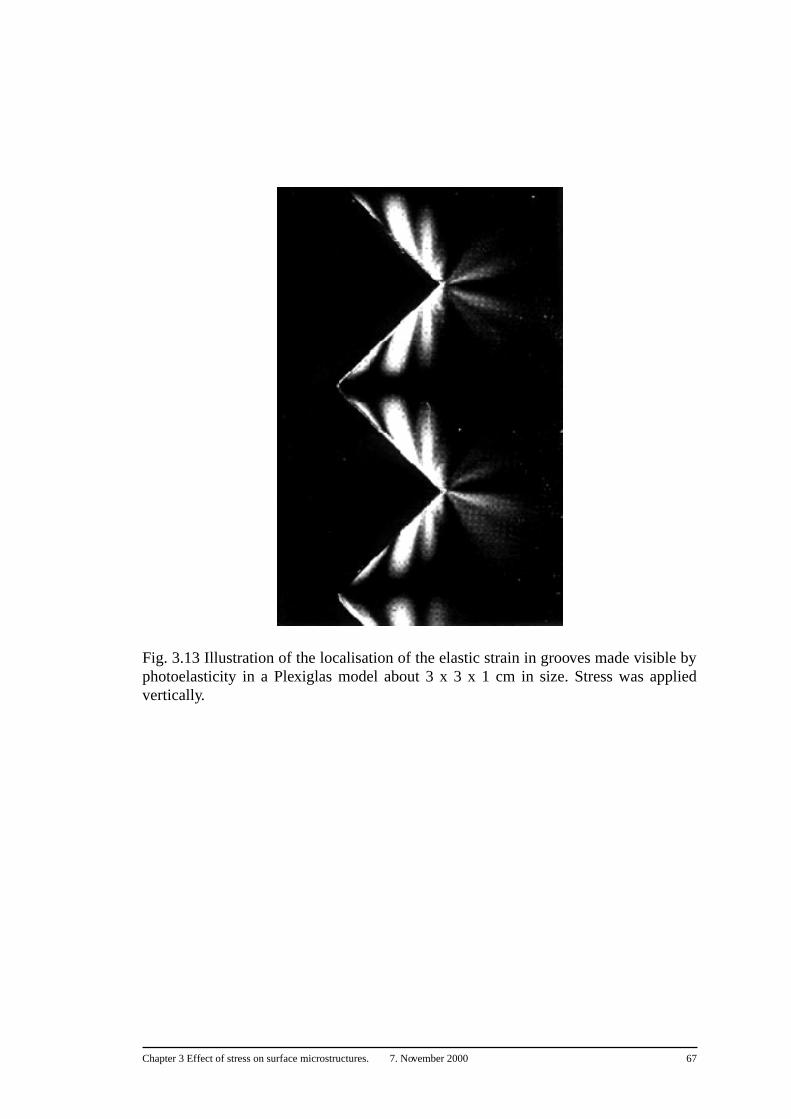
Chapter 3 Effect of stress on surface microstructures. 7. November 2000 67
Fig. 3.13 Illustration of the localisation of the elastic strain in grooves made visible byphotoelasticity in a Plexiglas model about 3 x 3 x 1 cm in size. Stress was appliedvertically.
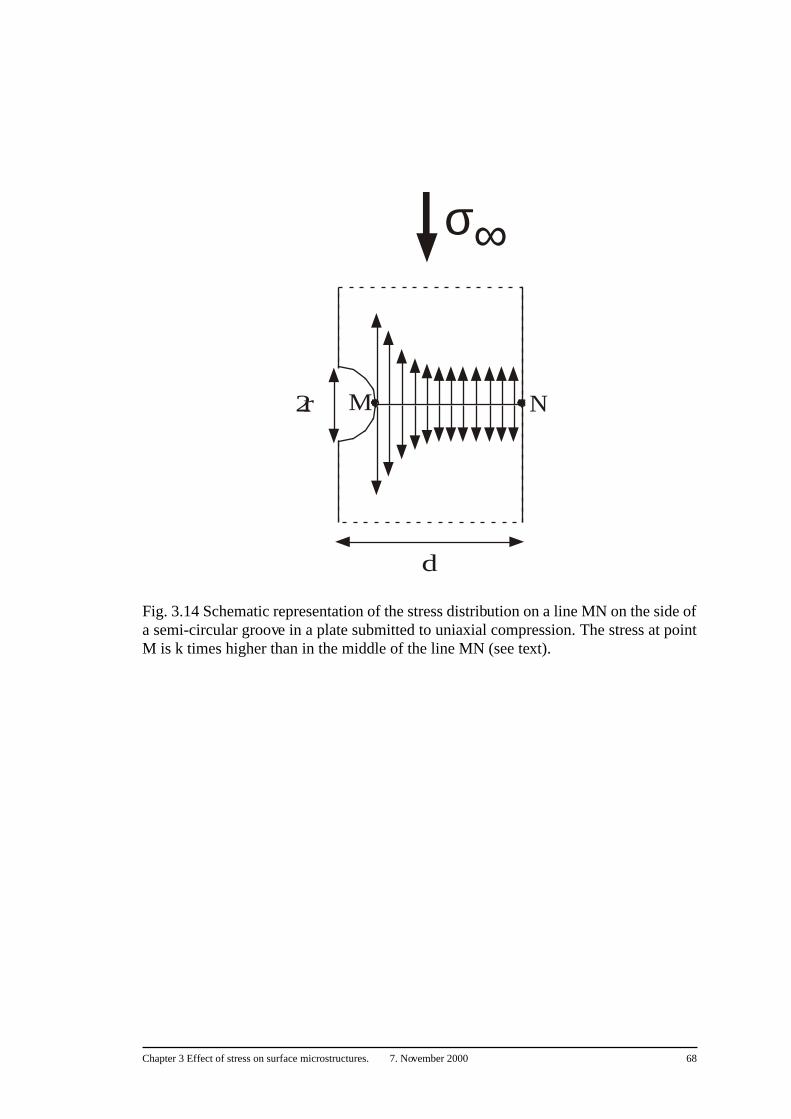
Chapter 3 Effect of stress on surface microstructures. 7. November 2000 68
Fig. 3.14 Schematic representation of the stress distribution on a line MN on the side ofa semi-circular groove in a plate submitted to uniaxial compression. The stress at pointM is k times higher than in the middle of the line MN (see text).
σ∞
2r
d
NM
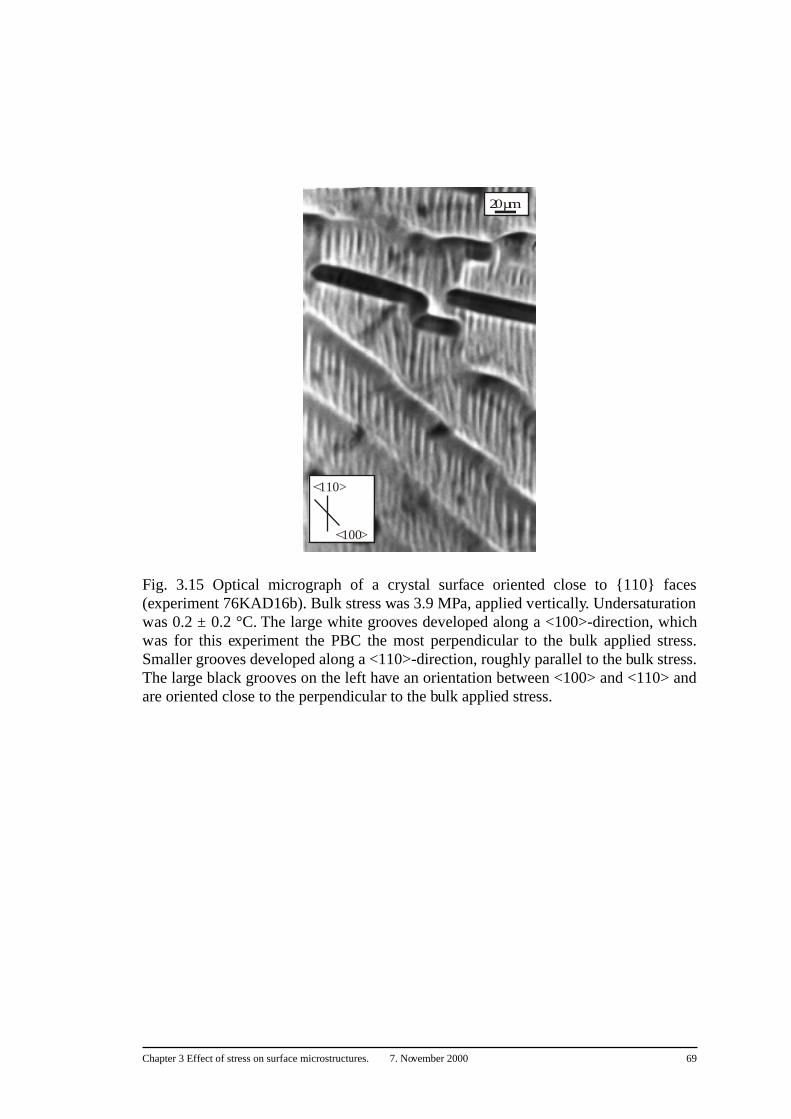
Chapter 3 Effect of stress on surface microstructures. 7. November 2000 69
Fig. 3.15 Optical micrograph of a crystal surface oriented close to {110} faces(experiment 76KAD16b). Bulk stress was 3.9 MPa, applied vertically. Undersaturationwas 0.2 ± 0.2 °C. The large white grooves developed along a <100>-direction, whichwas for this experiment the PBC the most perpendicular to the bulk applied stress.Smaller grooves developed along a <110>-direction, roughly parallel to the bulk stress.The large black grooves on the left have an orientation between <100> and <110> andare oriented close to the perpendicular to the bulk applied stress.
20 µm
<110>
<100>
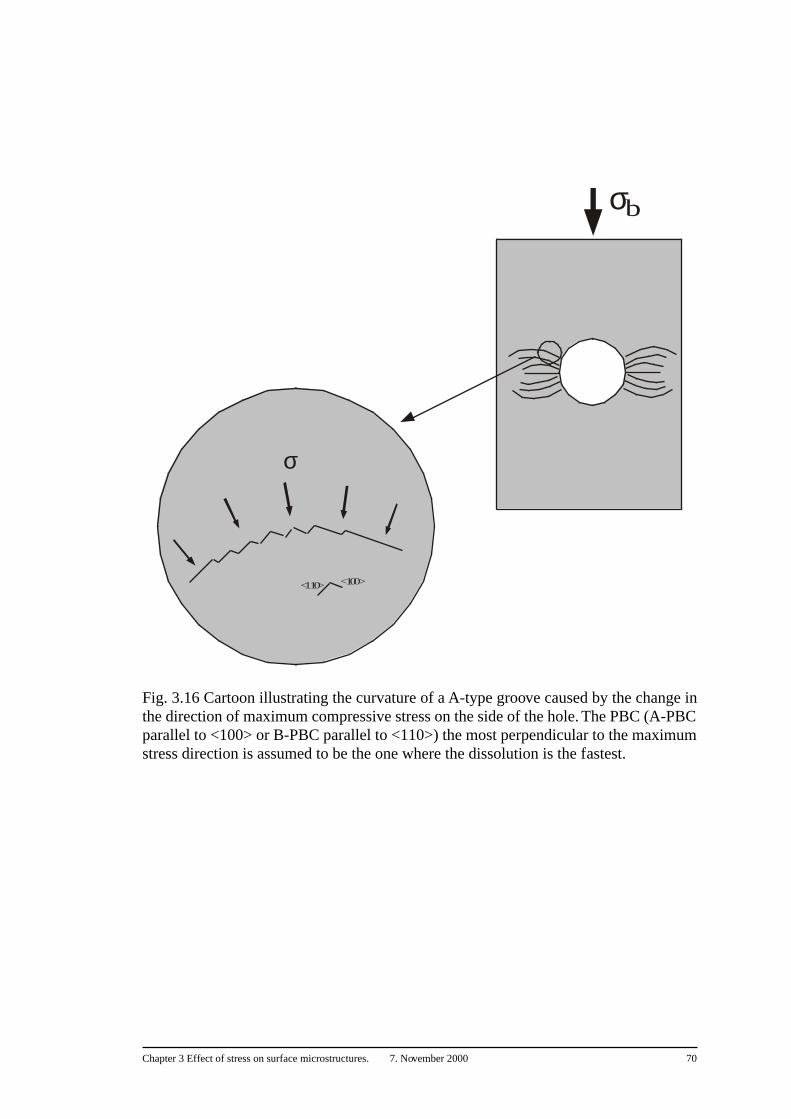
Chapter 3 Effect of stress on surface microstructures. 7. November 2000 70
Fig. 3.16 Cartoon illustrating the curvature of a A-type groove caused by the change inthe direction of maximum compressive stress on the side of the hole. The PBC (A-PBCparallel to <100> or B-PBC parallel to <110>) the most perpendicular to the maximumstress direction is assumed to be the one where the dissolution is the fastest.
σ
<100><110>
σb
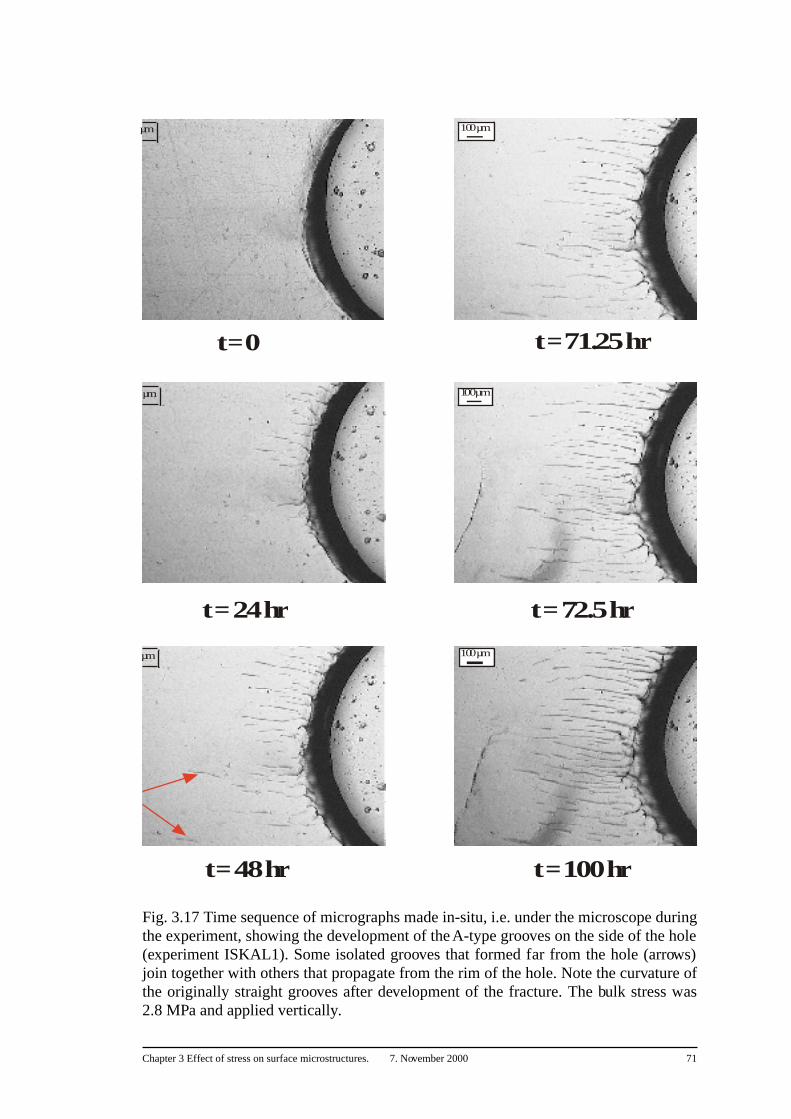
Chapter 3 Effect of stress on surface microstructures. 7. November 2000 71
Fig. 3.17 Time sequence of micrographs made in-situ, i.e. under the microscope duringthe experiment, showing the development of the A-type grooves on the side of the hole(experiment ISKAL1). Some isolated grooves that formed far from the hole (arrows)join together with others that propagate from the rim of the hole. Note the curvature ofthe originally straight grooves after development of the fracture. The bulk stress was2.8 MPa and applied vertically.
100 µm
100 µm
t = 71.25 hr
t = 72.5 hr
µm
t = 0
µm
t = 24 hr
µm
t = 48 hr
100 µm
t = 100 hr
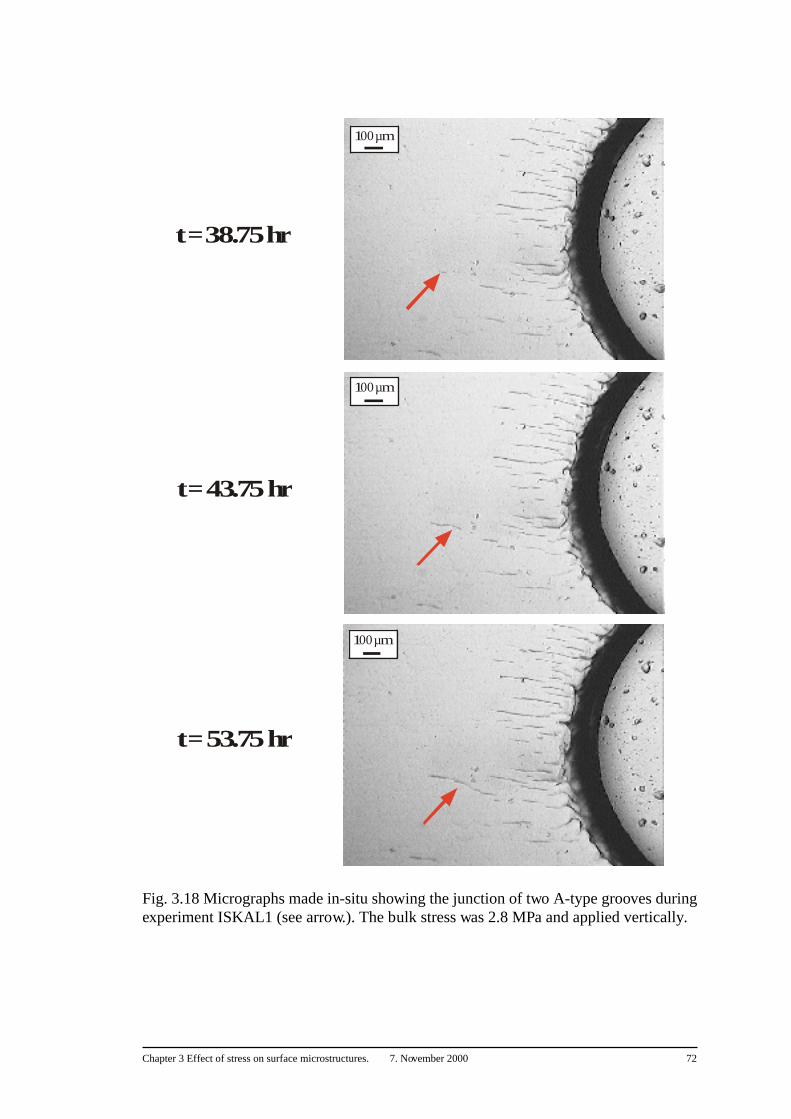
Chapter 3 Effect of stress on surface microstructures. 7. November 2000 72
Fig. 3.18 Micrographs made in-situ showing the junction of two A-type grooves duringexperiment ISKAL1 (see arrow.). The bulk stress was 2.8 MPa and applied vertically.
100 µm
100 µm
100 µm
t = 53.75 hr
t = 43.75 hr
t = 38.75 hr
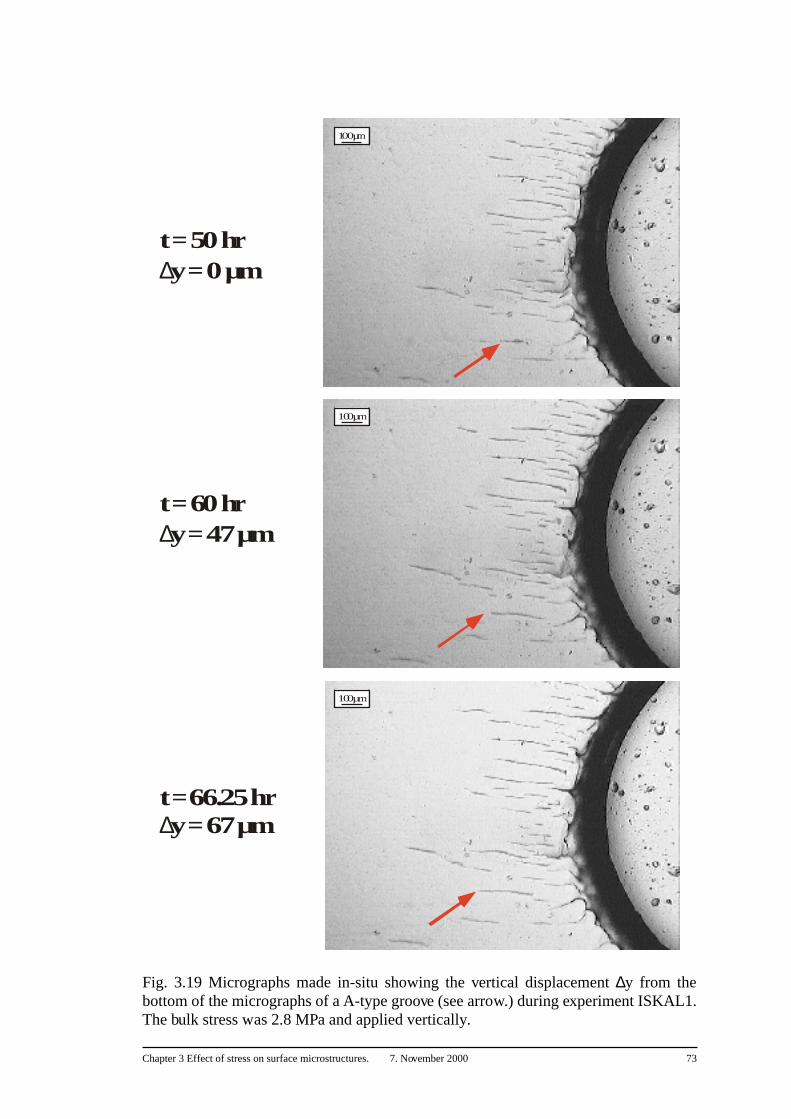
Chapter 3 Effect of stress on surface microstructures. 7. November 2000 73
Fig. 3.19 Micrographs made in-situ showing the vertical displacement ∆y from thebottom of the micrographs of a A-type groove (see arrow.) during experiment ISKAL1.The bulk stress was 2.8 MPa and applied vertically.
100 µm
100 µm
100 µm
t = 50 hr∆y = 0 µm
t = 60 hr∆y = 47 µm
t = 66.25 hr∆y = 67 µm
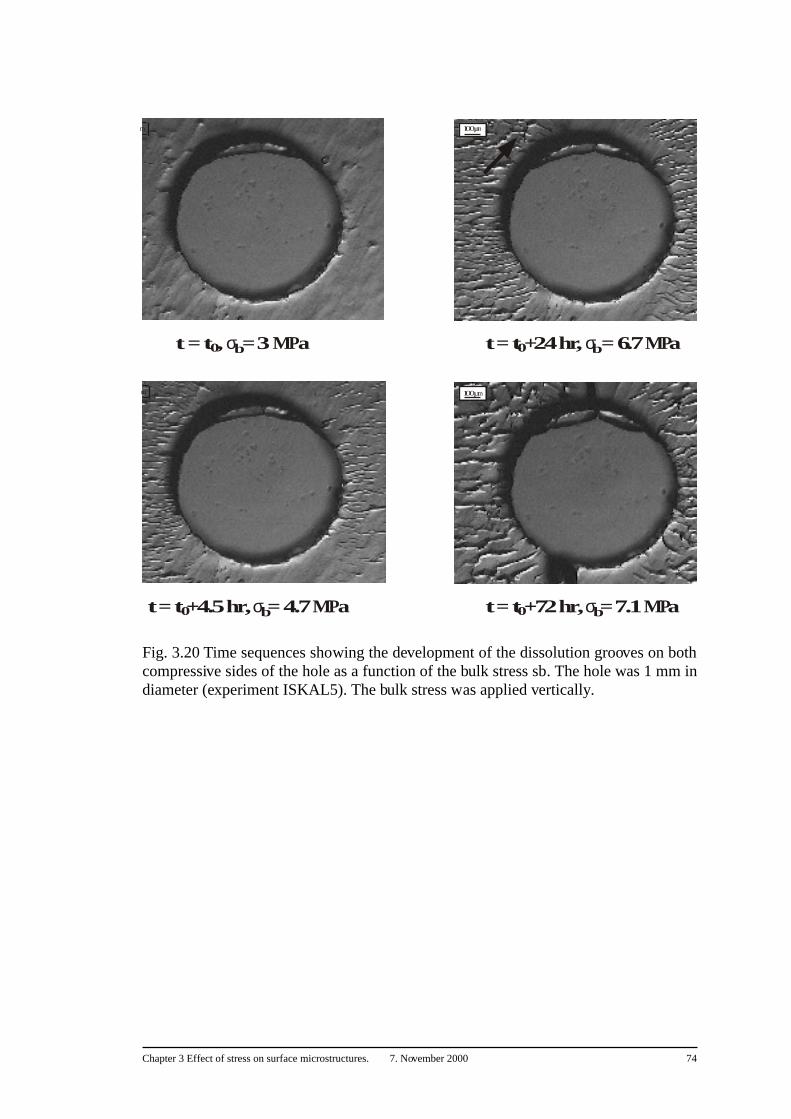
Chapter 3 Effect of stress on surface microstructures. 7. November 2000 74
Fig. 3.20 Time sequences showing the development of the dissolution grooves on bothcompressive sides of the hole as a function of the bulk stress sb. The hole was 1 mm indiameter (experiment ISKAL5). The bulk stress was applied vertically.
t = t0, σb = 3 MPa
m
t = t0+4.5 hr, σb = 4.7 MPa
m
t = t0+24 hr, σb = 6.7 MPa
t = t0+72 hr, σb = 7.1 MPa
100 µm
100 µm
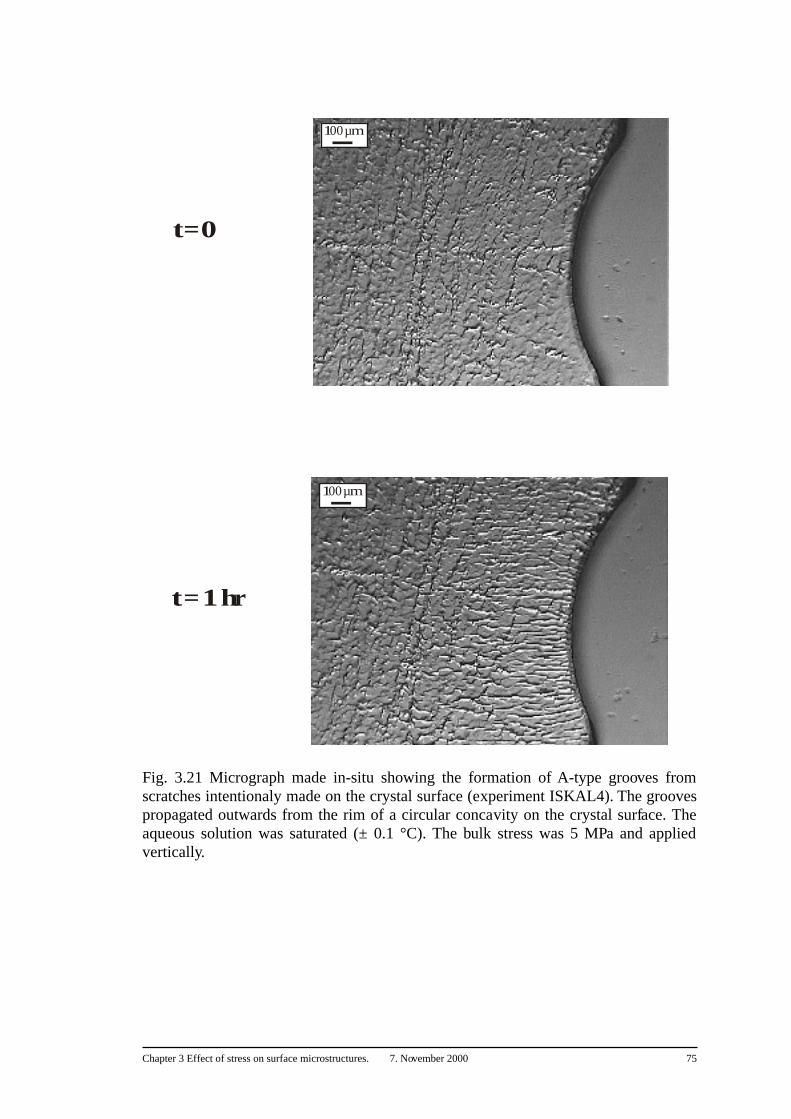
Chapter 3 Effect of stress on surface microstructures. 7. November 2000 75
Fig. 3.21 Micrograph made in-situ showing the formation of A-type grooves fromscratches intentionaly made on the crystal surface (experiment ISKAL4). The groovespropagated outwards from the rim of a circular concavity on the crystal surface. Theaqueous solution was saturated (± 0.1 °C). The bulk stress was 5 MPa and appliedvertically.
100 µm
t = 0
t = 1 hr
100 µm
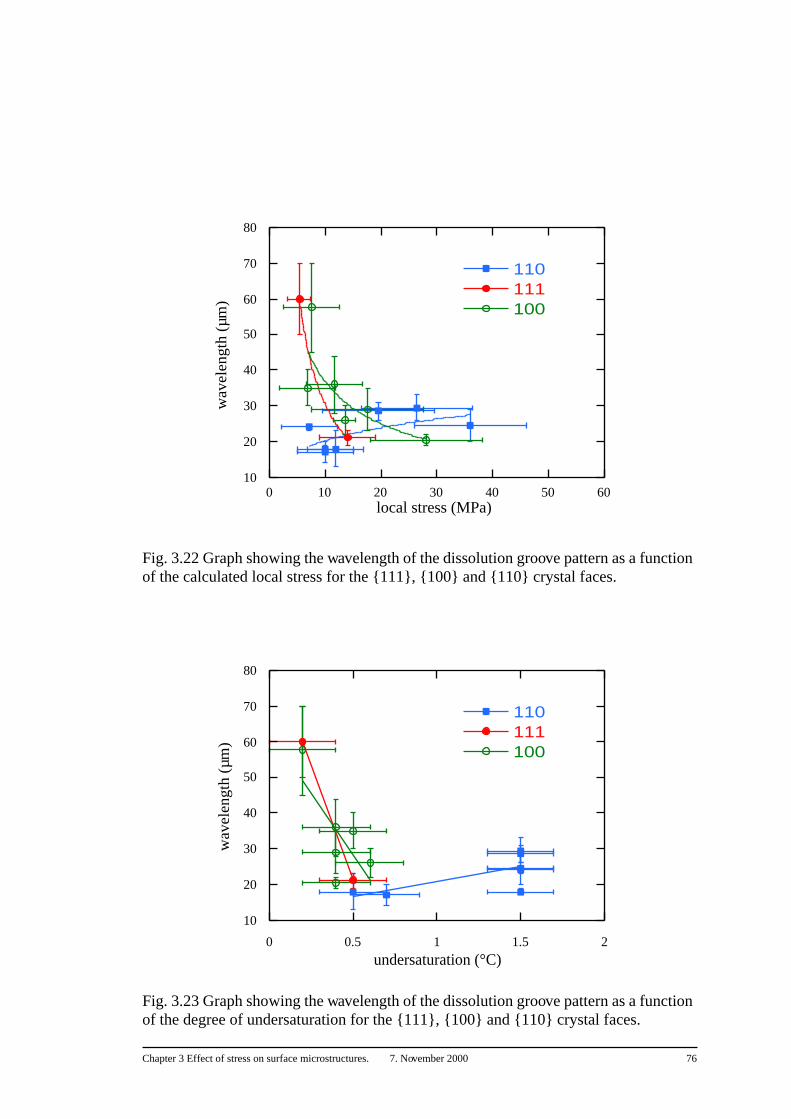
Chapter 3 Effect of stress on surface microstructures. 7. November 2000 76
Fig. 3.22 Graph showing the wavelength of the dissolution groove pattern as a function of the calculated local stress for the {111}, {100} and {110} crystal faces.
Fig. 3.23 Graph showing the wavelength of the dissolution groove pattern as a function of the degree of undersaturation for the {111}, {100} and {110} crystal faces.
10
20
30
40
50
60
70
80
0 10 20 30 40 50 60
110111100
wav
elen
gth
(µm
)
local stress (MPa)
10
20
30
40
50
60
70
80
0 0.5 1 1.5 2
110111100
wav
elen
gth
(µm
)
undersaturation (°C)
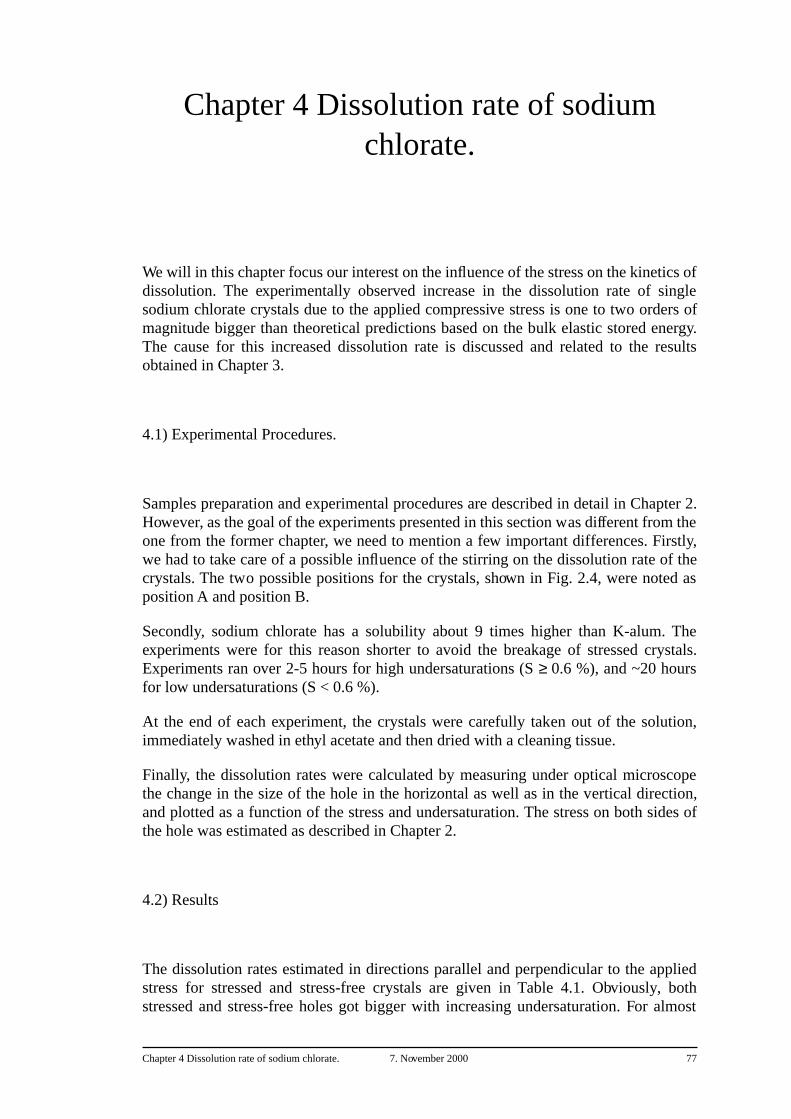
Chapter 4 Dissolution rate of sodium chlorate. 7. November 2000 77
Chapter 4 Dissolution rate of sodium chlorate.
We will in this chapter focus our interest on the influence of the stress on the kinetics ofdissolution. The experimentally observed increase in the dissolution rate of singlesodium chlorate crystals due to the applied compressive stress is one to two orders ofmagnitude bigger than theoretical predictions based on the bulk elastic stored energy.The cause for this increased dissolution rate is discussed and related to the resultsobtained in Chapter 3.
4.1) Experimental Procedures.
Samples preparation and experimental procedures are described in detail in Chapter 2.However, as the goal of the experiments presented in this section was different from theone from the former chapter, we need to mention a few important differences. Firstly,we had to take care of a possible influence of the stirring on the dissolution rate of thecrystals. The two possible positions for the crystals, shown in Fig. 2.4, were noted asposition A and position B.
Secondly, sodium chlorate has a solubility about 9 times higher than K-alum. Theexperiments were for this reason shorter to avoid the breakage of stressed crystals.Experiments ran over 2-5 hours for high undersaturations (S ≥ 0.6 %), and ~20 hoursfor low undersaturations (S < 0.6 %).
At the end of each experiment, the crystals were carefully taken out of the solution,immediately washed in ethyl acetate and then dried with a cleaning tissue.
Finally, the dissolution rates were calculated by measuring under optical microscopethe change in the size of the hole in the horizontal as well as in the vertical direction,and plotted as a function of the stress and undersaturation. The stress on both sides ofthe hole was estimated as described in Chapter 2.
4.2) Results
The dissolution rates estimated in directions parallel and perpendicular to the appliedstress for stressed and stress-free crystals are given in Table 4.1. Obviously, bothstressed and stress-free holes got bigger with increasing undersaturation. For almost
Chapter 4 Dissolution rate of sodium chlorate. 7. November 2000 78
every experiment, the highest dissolution rates were measured in the horizontaldirection. This was the case for stressed crystals as well as for stress-free ones. Theaverage vertical to horizontal dissolution rates ratio was 0.89 for stress-free crystalsand 0.87 for stressed ones. The cross section of the holes at the end of the experimentswas elliptical, with the longest axis in the horizontal and the shortest in the verticaldirection. Along the axis of the holes, no variation in shape was observed. Materialdissolved also from the sides of the crystals (Fig. 4.1).
We found that crystals placed at position A dissolved faster than those placed atposition B. This was true for stressed and stress-free crystals. The difference indissolution rates between both positions increased with increasing undersaturation,reaching ~30% at an undersaturation of 2.4% (Fig. 4.2). For a given position and agiven undersaturation, stressed crystals were found to dissolve faster than stress-freeones. This was true for the direction perpendicular, as well as for the direction parallelto the applied stress (Table 4.1). The dissolution rate increased linearly with increasingstress (Fig. 4.3). For a given position and a given stress, the stress effect on thedissolution rate increased with increasing undersaturation. The increase in dissolutionrate due to a bulk stress σb = 3.8 ± 0.3 MPa, corresponding to σh = 10.5 ± 1 MPa onboth sides of the hole, as a function of the undersaturation, is shown in Fig. 4.4. At anundersaturation of 2.4 %, the stressed crystal dissolved ~1.25 times faster than thestress-free crystal.
4.3) Discussion
The data show good agreement between the dissolution rates for the stress-free crystalsand dissolution rate values on stress-free sodium chlorate crystals published in theliterature (Fig. 4.5). The wide dispersion in the data from Kitamura et al. (1982)illustrates the strong dependence of the dissolution rate on experimental conditions. Aslight difference between the distances from positions A and B to the stirrer, or a slightasymmetry of the paddle, may be responsible of the difference in dissolution ratesbetween both positions observed in our experiments. Crystals placed in position A mayhave undergone a stronger flow than those placed in position B, and dissolved faster.For a given position, however, stressed crystals dissolved faster than stress-free ones.The increased dissolution rate due to the stress was bigger with increasingundersaturation, and varied linearly with the stress.
Theoretically, the increase in dissolution rate due to the increase in bulk stored elasticenergy should be much smaller than our experimental results, and should beproportional to the square of the stress. Let us estimate how much would thedissolution rate at the compressive sides of the hole theoretically increase by increasingthe stress on the crystal by 3 MPa in a solution undersaturated to 2.4% at a temperatureof 23 °C?
Chapter 4 Dissolution rate of sodium chlorate. 7. November 2000 79
Assuming linear elastic (i.e. hookean) behaviour, the increase in stored elastic energy∆Uelastic due to increasing the differential stress by an amount of ∆σ is given byequation (4.1):
where E is the Young modulus and the molar volume. For sodium chlorate, E is 43.67
GPa and Vm is 4.3 × 10⁻⁵ m3.mol-1. For a differential stress of 3 MPa on the entire
crystal, the differential stress on both compressive sides at the periphery of the holeshould be ~15 MPa (considering a perfect symmetrical crystal), corresponding to an
increase in stored elastic energy of ~0.1J.mol-1.
The driving force induced by the undersaturation is given by equation (4.2):
where R is the gas constant, T is the absolute temperature, C is the concentration ofthe solution and C0 is the saturation concentration. C, C0, and S = ( C0-C /C0 ) werecalculated using the solubility equation for sodium chlorate given in Chapter 2.
The driving force for dissolution at an undersaturation of 2.4% and a temperature of 23
°C would then correspond to ~ 60 J.mol-1, i.e. ~ 600 times the driving force due to the
elastic distortion (~ 0.1 J.mol-1). A driving force for dissolution of ~0.1 J.mol-1 wouldbe provided by an undersaturation of only 0.005%.
Assuming a linear variation of dissolution rate as a function of undersaturation for
stress-free crystals (Fig. 4.2), a driving force of ~0.1 J.mol-1 would correspond to an
increase in the dissolution rate of the order of 1 mm.hr-1. Experimentally, however, thedissolution rate of a crystal submitted to a bulk stress of 3 MPa at an undersaturation of
2.4% (see Table 4.1, experiment 100CHLO20) was 162.9 µm.hr-1, while the
dissolution rate of a stress-free crystal at the same undersaturation was 120 µm.hr-1.This means an increase in dissolution rate 43 times bigger than theoretically predicted.The effect of the stress on the dissolution rate for each of the experiments was found tobe one to two orders of magnitude higher than theoretically predicted.
Our results do not allow to correlate the variation in stress around the hole to theobserved difference between vertical and horizontal dissolution rates. Indeed, althoughthe stressed holes are bigger, the stress-free holes showed after experiment an averagedegree of ellipticity equal to the stressed ones. This means that the ellipticity developedby the stressed holes is not a crystal plastic effect, because the stress-free holes show
∆Uelastic
∆σ( )2Vm
2E-----------------------=
∆µ RTC0
C------ln=
Chapter 4 Dissolution rate of sodium chlorate. 7. November 2000 80
the same shape. Moreover, the length of the crystals was measured before and aftereach experiment with a precision of 0.01 mm. None of the stressed samples appearedto have been shortened to within the measurement resolution. The ellipticity developedby the holes was also observed by Bosworth (1981), who attributed this effect to astratification of the solution concentration due to gravity. This may also have happenedin our experiments, due to a too slow stirring. It is thus wiser in our case to considerpreferentially horizontal dissolution rates, as done in Fig. 4.2-4.5.
The increase in dissolution rate observed on the stressed crystals is then a purely elasticeffect. No crystal plastic deformation occurred. This result supports the resultsobtained by Ristíc et al. (1997b). They found that the growth rate of {100} faces of apotassium alum crystal elastically stressed in tension under 0.1 MPa and at anoversaturation of 6.47% was 1.2 times slower than when the crystal was left stress-free.The growth of some crystal faces could even be stopped by the application of a strongtensile stress. These authors suggested that elastic strain could affect the way thegrowth centres develop and propagate. Our results support this idea and suggest thatthis could be also the case for dissolution centres. This may be understood byconsidering that, during dissolution (or growth), the crystal surface does not stay flatbut roughens. Concavities on the surface develop at sites of high surface energy, suchas dislocation outcrops, impurities or fluid inclusions (for growth, convexities developby the formation of growth hillocks). This leads for crystals placed under stress to anon-homogeneous elastic strain distribution on the surface, the strain being higher inthe concavities. The results obtained in this work and described in Chapter 3 show theimportance of the rugosity of a stressed crystal surface on the dissolution process. Wethink that due to the high elastic strain concentration, the velocity of the dissolutionsteps in the concavities is increased, causing an increase in the dissolution rate. Withincreasing undersaturation, the number of high surface energy sites activated asdissolution centres might increase, such as was experimentally demonstrated forpotassium alum by Van der Hoek et al. (1983). The effect of the stress on thedissolution rate might therefore be stronger.
The observed linear dependence of the dissolution rate on the stress may be explainedby considering the mobility of the dissolving particles. The velocity of a solid-fluidinterface can be described as the product of two terms, the first corresponding to thekinetically driven instability term (related to the mobility), and the secondcorresponding to the energetically driven instability or "driving force" term (Barvosa-Carter et al., 1998). Recent studies on the behaviour of stressed interfaces betweencrystalline and amorphous silicon have shown that the mobility depends on the stress,such that the kinetically driven instability linearly depends on the stress (Aziz et al.,1991; Barvosa-Carter et al., 1998). The "driving force" term, on the other hand, variesas the square of the stress through the increase in the bulk stored elastic energy(equation 4.1). Yu & Suo (2000) have demonstrated theoretically that the effect of thestress on the mobility, and thus the linear dependence on stress of the surface reactionsvelocity, increases with increasing driving force. The strong effect of the stress on thedissolution rate observed in our experiments suggests that the occurring driving forcefor dissolution could be much higher than theoretically predicted and strongly affectthe mobility of the dissolving particles.
Chapter 4 Dissolution rate of sodium chlorate. 7. November 2000 81
4.4) Conclusion
Our results show that mechanically induced compressive elastic strain can significantlyaffect the dissolution rate of crystals in solution. The application of compressive stressduring the dissolution of single sodium chlorate crystals increases their dissolution rateby one to two orders of magnitude more than theoretically due to the increase in bulkstored elastic energy. Now, the effect of the stress on the dissolution rate depends on thedegree of undersaturation. We suggest that by increasing the degree of undersaturation,the number of surface defects activated as dissolution centres is increased, what leadsto an increase in the non-homogeneity of the stress distribution on the surface. Thedissolution is enhanced at the dissolution centres, where the elastic strain is the highest,and the dissolution rate of the entire crystal is increased. The linear increase of thedissolution rate with the stress is interpreted as an effect of the stress on the mobility ofthe dissolving particles at the interface.
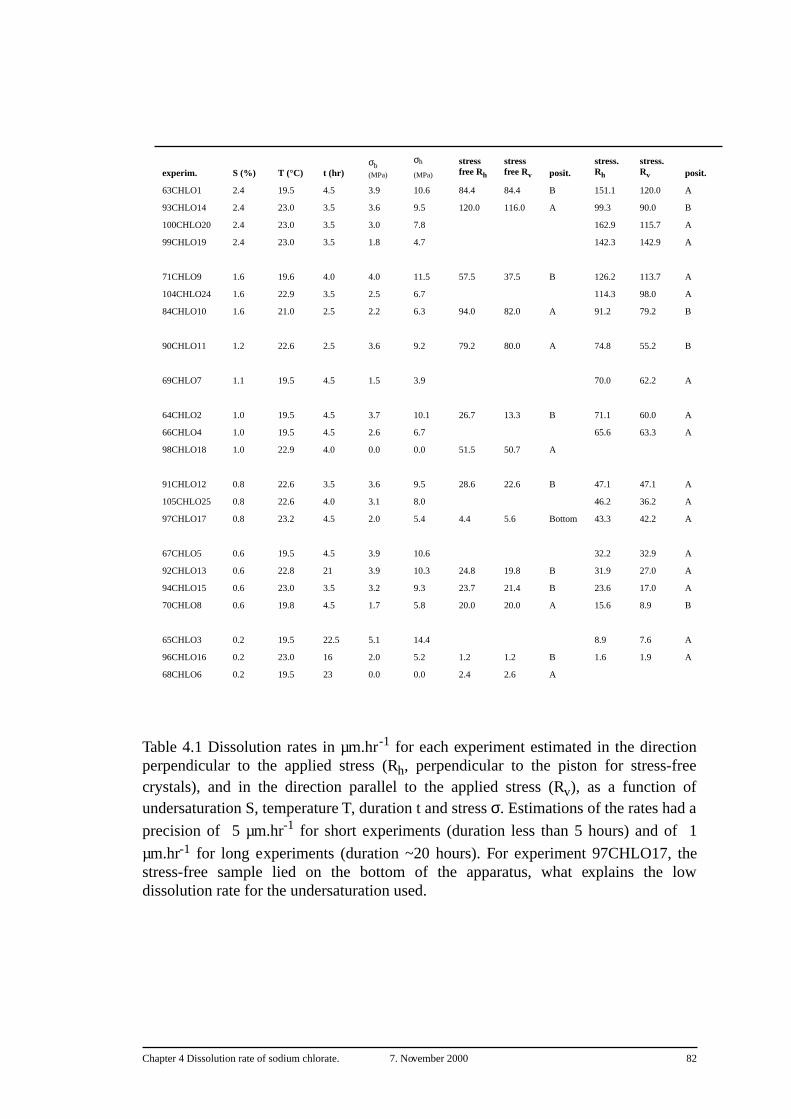
Chapter 4 Dissolution rate of sodium chlorate. 7. November 2000 82
Table 4.1 Dissolution rates in µm.hr-1 for each experiment estimated in the directionperpendicular to the applied stress (Rh, perpendicular to the piston for stress-freecrystals), and in the direction parallel to the applied stress (Rv), as a function ofundersaturation S, temperature T, duration t and stress σ. Estimations of the rates had a
precision of 5 µm.hr-1 for short experiments (duration less than 5 hours) and of 1
µm.hr-1 for long experiments (duration ~20 hours). For experiment 97CHLO17, thestress-free sample lied on the bottom of the apparatus, what explains the lowdissolution rate for the undersaturation used.
experim. S (%) T (°C) t (hr)σb (MPa)
σh
(MPa)
stress free Rh
stress free Rv posit.
stress.Rh
stress.Rv posit.
63CHLO1 2.4 19.5 4.5 3.9 10.6 84.4 84.4 B 151.1 120.0 A
93CHLO14 2.4 23.0 3.5 3.6 9.5 120.0 116.0 A 99.3 90.0 B
100CHLO20 2.4 23.0 3.5 3.0 7.8 162.9 115.7 A
99CHLO19 2.4 23.0 3.5 1.8 4.7 142.3 142.9 A
71CHLO9 1.6 19.6 4.0 4.0 11.5 57.5 37.5 B 126.2 113.7 A
104CHLO24 1.6 22.9 3.5 2.5 6.7 114.3 98.0 A
84CHLO10 1.6 21.0 2.5 2.2 6.3 94.0 82.0 A 91.2 79.2 B
90CHLO11 1.2 22.6 2.5 3.6 9.2 79.2 80.0 A 74.8 55.2 B
69CHLO7 1.1 19.5 4.5 1.5 3.9 70.0 62.2 A
64CHLO2 1.0 19.5 4.5 3.7 10.1 26.7 13.3 B 71.1 60.0 A
66CHLO4 1.0 19.5 4.5 2.6 6.7 65.6 63.3 A
98CHLO18 1.0 22.9 4.0 0.0 0.0 51.5 50.7 A
91CHLO12 0.8 22.6 3.5 3.6 9.5 28.6 22.6 B 47.1 47.1 A
105CHLO25 0.8 22.6 4.0 3.1 8.0 46.2 36.2 A
97CHLO17 0.8 23.2 4.5 2.0 5.4 4.4 5.6 Bottom 43.3 42.2 A
67CHLO5 0.6 19.5 4.5 3.9 10.6 32.2 32.9 A
92CHLO13 0.6 22.8 21 3.9 10.3 24.8 19.8 B 31.9 27.0 A
94CHLO15 0.6 23.0 3.5 3.2 9.3 23.7 21.4 B 23.6 17.0 A
70CHLO8 0.6 19.8 4.5 1.7 5.8 20.0 20.0 A 15.6 8.9 B
65CHLO3 0.2 19.5 22.5 5.1 14.4 8.9 7.6 A
96CHLO16 0.2 23.0 16 2.0 5.2 1.2 1.2 B 1.6 1.9 A
68CHLO6 0.2 19.5 23 0.0 0.0 2.4 2.6 A
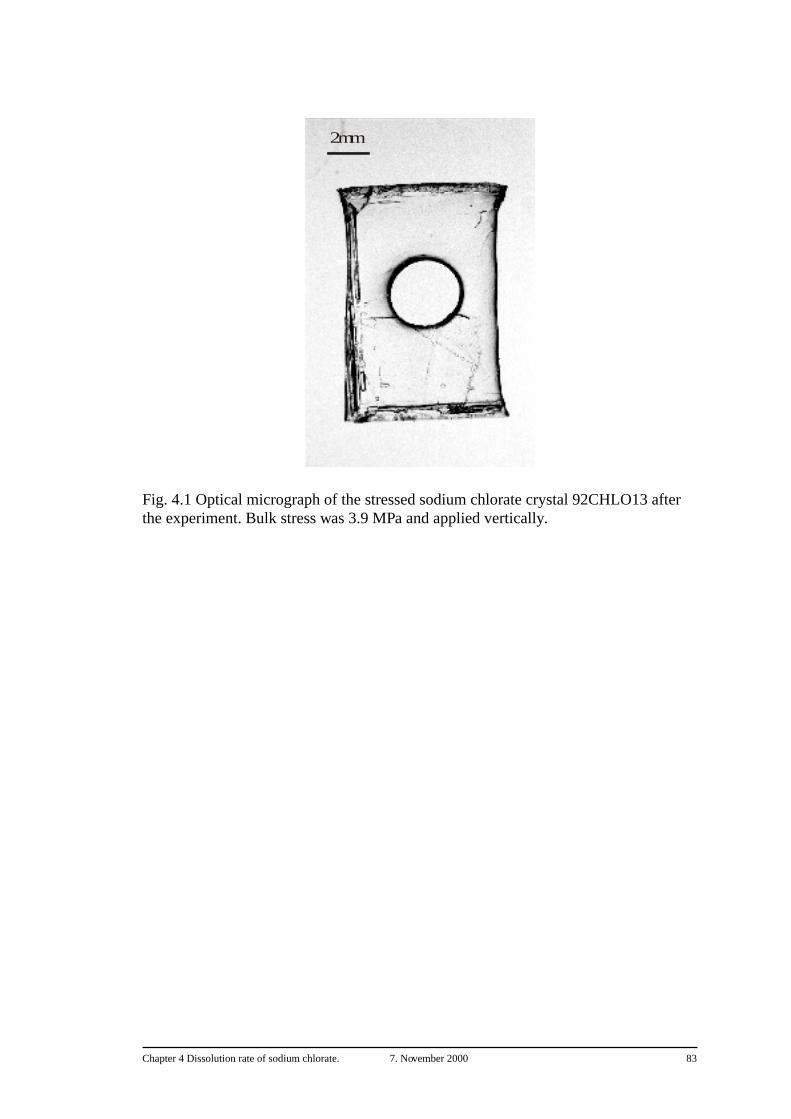
Chapter 4 Dissolution rate of sodium chlorate. 7. November 2000 83
Fig. 4.1 Optical micrograph of the stressed sodium chlorate crystal 92CHLO13 after the experiment. Bulk stress was 3.9 MPa and applied vertically.
2 mm
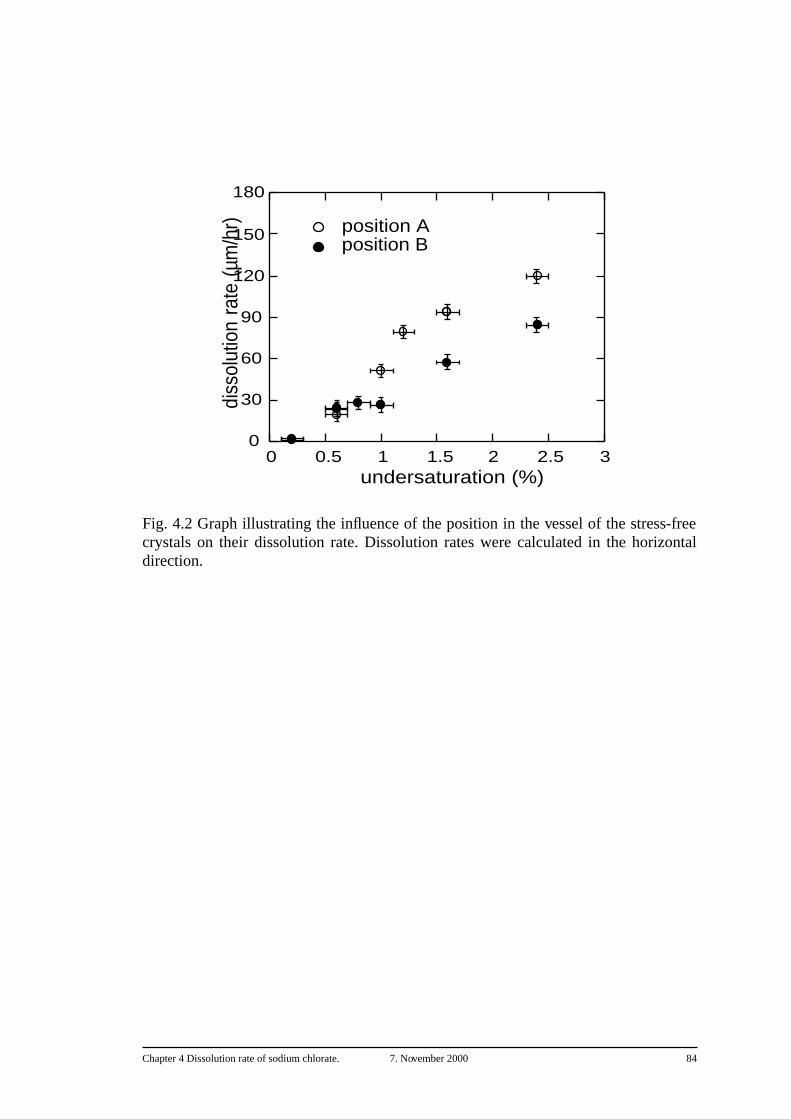
Chapter 4 Dissolution rate of sodium chlorate. 7. November 2000 84
Fig. 4.2 Graph illustrating the influence of the position in the vessel of the stress-freecrystals on their dissolution rate. Dissolution rates were calculated in the horizontaldirection.
0
30
60
90
120
150
180
0 0.5 1 1.5 2 2.5 3
position Aposition B
diss
olut
ion
rate
(µm
/hr)
undersaturation (%)
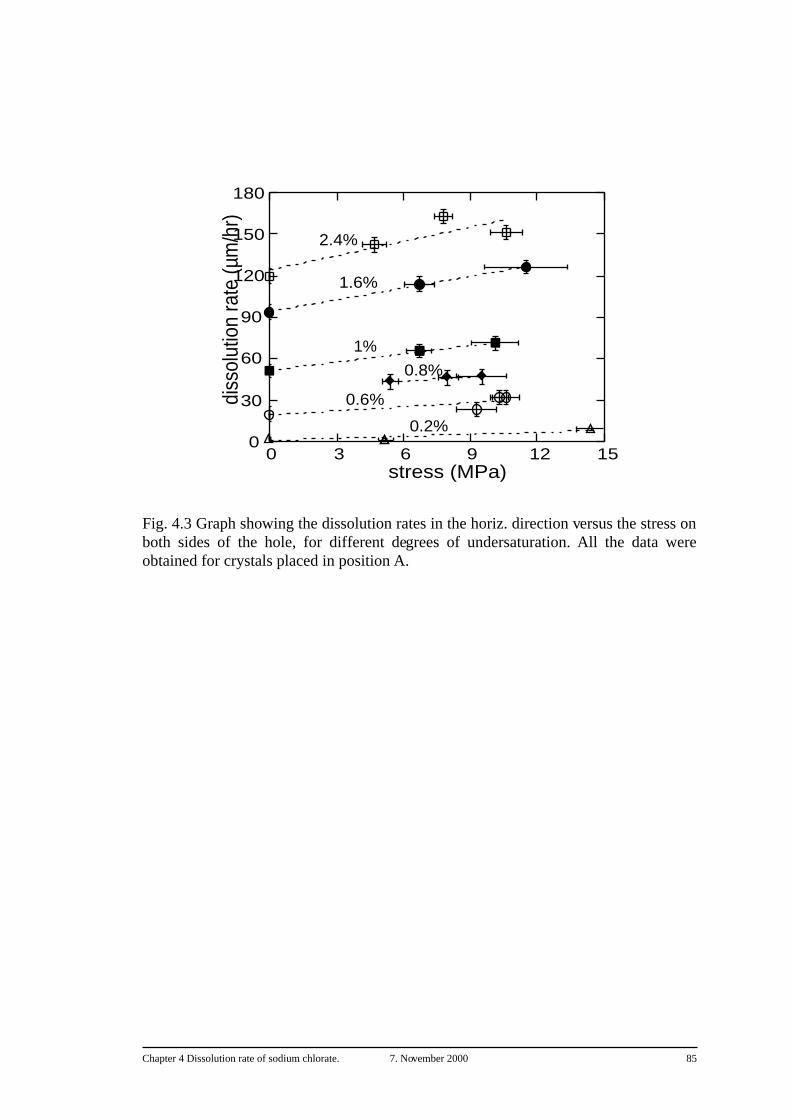
Chapter 4 Dissolution rate of sodium chlorate. 7. November 2000 85
Fig. 4.3 Graph showing the dissolution rates in the horiz. direction versus the stress onboth sides of the hole, for different degrees of undersaturation. All the data wereobtained for crystals placed in position A.
0
30
60
90
120
150
180
0 3 6 9 12 15
diss
olut
ion
rate
(µm
/hr)
stress (MPa)
2.4%
1.6%
1%
0.8%
0.6%
0.2%
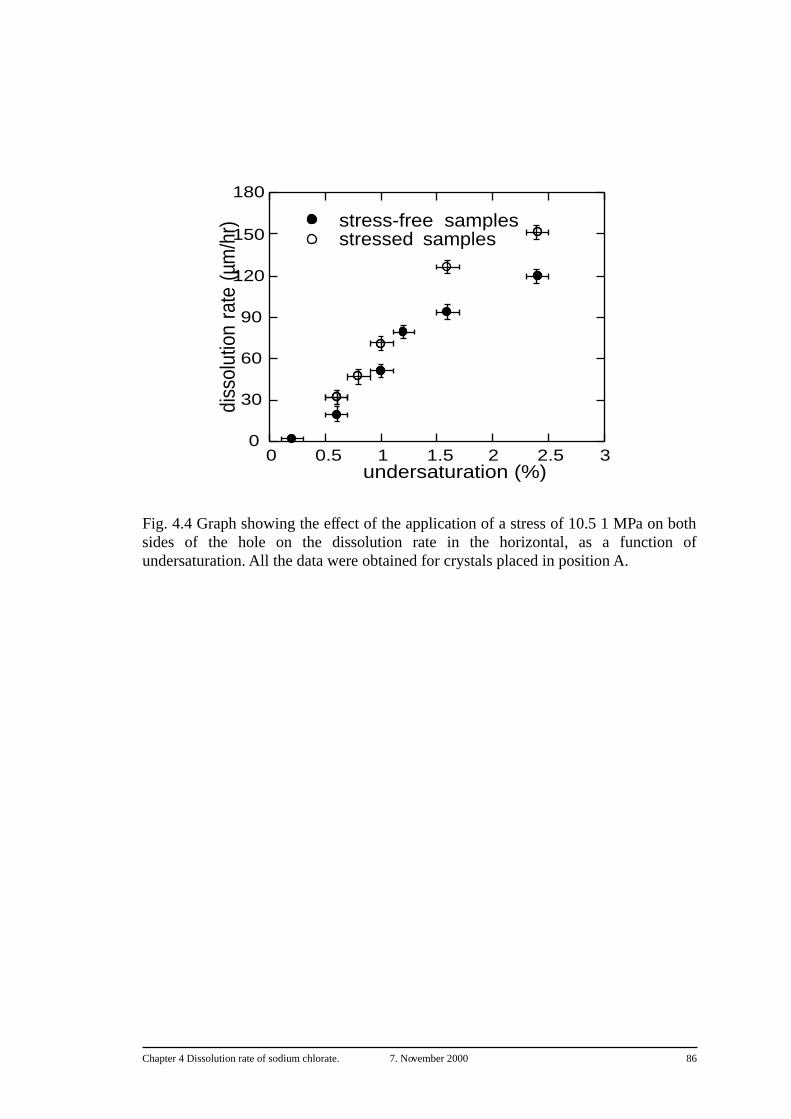
Chapter 4 Dissolution rate of sodium chlorate. 7. November 2000 86
Fig. 4.4 Graph showing the effect of the application of a stress of 10.5 1 MPa on bothsides of the hole on the dissolution rate in the horizontal, as a function ofundersaturation. All the data were obtained for crystals placed in position A.
0
30
60
90
120
150
180
0 0.5 1 1.5 2 2.5 3
stress-free samplesstressed samples
diss
olut
ion
rate
(µm
/hr)
undersaturation (%)
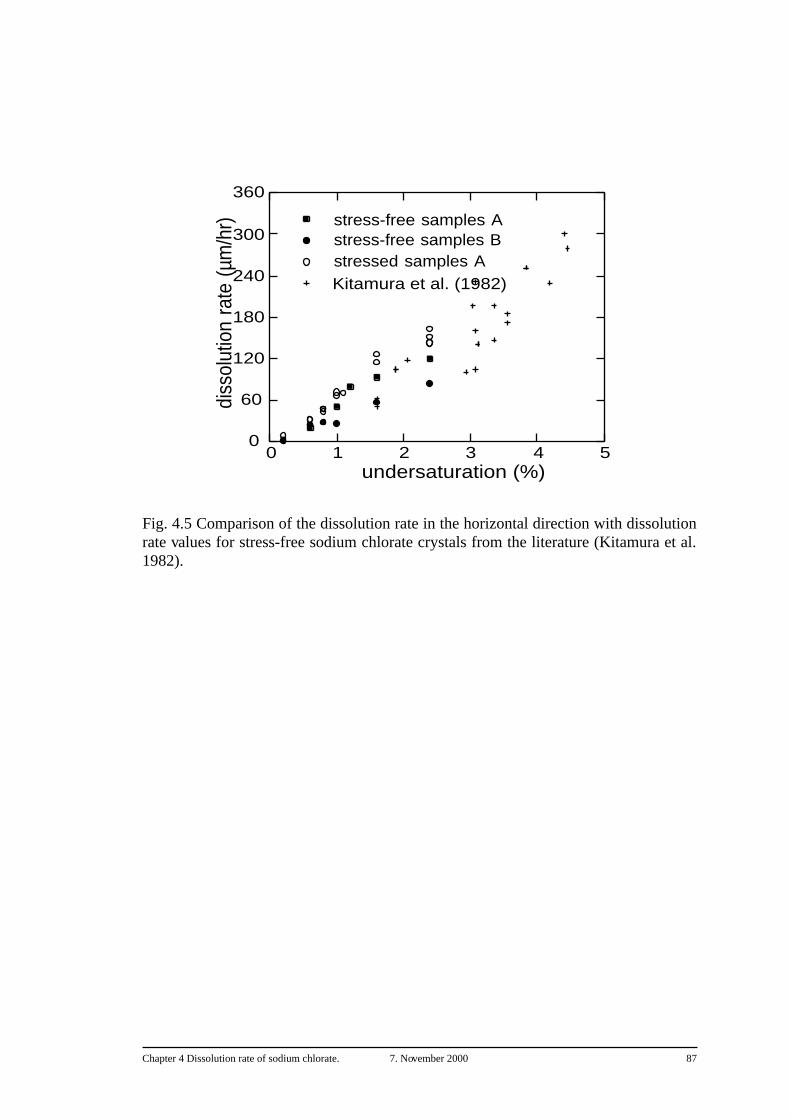
Chapter 4 Dissolution rate of sodium chlorate. 7. November 2000 87
Fig. 4.5 Comparison of the dissolution rate in the horizontal direction with dissolutionrate values for stress-free sodium chlorate crystals from the literature (Kitamura et al.1982).
0
60
120
180
240
300
360
0 1 2 3 4 5
stress-free samples A
Kitamura et al. (1982)
stress-free samples Bstressed samples A
diss
olut
ion
rate
(µm
/hr)
undersaturation (%)
Chapter 5 Effect of stress on growth processes. 7. November 2000 88
Chapter 5 Effect of stress on growth processes.
We have seen in chapters 3 and 4 that the dissolution processes and the dissolution rateof elastic/brittle crystals were strongly affected by the stress, and we may expect also astrong effect of the stress on the growth processes. Ristíc et al. (1997b) have shown thatthe growth rate of potassium alum single crystals could be strongly decreased by theapplication of stress. They found that the growth rate of {100} faces of a potassiumalum crystal stressed in tension at 0.1 MPa and at an oversaturation of 6.47% was
decreased from 2.2 µm.min-1 to 1.8 µm.min-1. The growth of {100} and {110} facescould even be stopped by the application of a higher tensile stress. Ristíc et al. (1997b)suggested that the stress could have affected the way the growth centres developed andpropagated. The experimental observations we made and presented in Chapter 3 andChapter 4 support this idea. The dissolution sites on the crystal surface caused theroughening of the surface, what led to a non-homogeneous stress distribution and anenhanced dissolution in the concavities. We present in this chapter the results of growthexperiments carried out on potassium alum and potassium dihydrogen phosphate(KDP) single crystals under differential compressive stress.
5.1) Starting materials and sample preparation.
5.1.1) Potassium dihydrogen phosphate.
Potassium Dihydrogen Phosphate (KDP; KH2PO4), has a tetragonal symmetry, andbelongs to the space group I42d (Dam & van Enckevort, 1981). It has a solubility of 1.8
mol.l-1 water at 25°C (Gmelins Handbuch, 1970). Crystals grown in aqueous solutionby slow cooling typically show four prismatic {100} faces bounded along the C-axisby two pyramidal sectors formed each by four {110} faces (Fig. 5.1). Large singleKDP crystals are often tapered. In this case the transition zone between pyramidal andprismatic sectors shows intermediate higher index facets (Dam & van Enckevort,1981). Growth of KDP crystals is characterised by a "dead area", corresponding to arange of oversaturation (from 0 to about 4°C) for which the growth rate of the prismaticfaces is equal or very close to zero (Batyreva et al., 1981). In this range ofoversaturation, the crystals grow only along the C-axis and develop the pyramidalsectors. KDP does not deform plastically at temperatures below 110 °C. In this rangeof temperature, it can support about 100 MPa, a value above which it breaks (Chan HaiGuin et al., 1980).
Chapter 5 Effect of stress on growth processes. 7. November 2000 89
Right-angled samples were cut from bigger KDP crystals (Fig. 5.1) grown in aqueoussolution by slow cooling of the solution temperature. This operation was done using adiamond cutting machine (Isomet, Buehler) and using volatile oil (Shell S4919) as alubricant. The samples were then polished using polishing paper (mesh sizes 600, 800,1000 and 1200), again with volatile oil as a lubricant, to finally get crystals about 4 × 4× 10 mm in size. The polished faces of the samples were very close (to within a fewdegrees) to either {100}, {001} or {110} crystallographic faces. No holes were drilledin the crystals, but triangular cuts, using a razor blade (Fig. 5.2). This was done in orderto increase the stress at the cuts. The stress distribution around such cuts can be veryeasily seen with a photoelasticity experiment carried out on a Plexiglas sample with asimilar geometry (see Fig. 3.13).
5.1.2) Potassium alum.
Potassium alum (KAl[SO4]2.12H2O) is a cubic salt, and belongs to the space group
Th6. It has a solubility of 0.3 mol.l-1 water at 25°C (Van der Hoek et al. 1983, Ullmann
Handbook 1986). Crystals have an octahedral habit typically bounded by {111}, {100}and {110} faces (Fig. 2.1). Growth of potassium alum crystals has been extensivelystudied. The growth rates of the three principal, low index crystallographic faces weremeasured (e.g. Lacmann & Tanneberger 1995, Ristíc et al. 1996). The growth rate of{111} faces was found to be constant. The {110} and {100} faces, however, werecharacterised by a period of constant growth rate during about one hour, after whichtheir growth rates decreased progressively (Ristíc et al., 1996). For steady state growth(i.e. during the first hour), {110} faces showed the faster growth rate, followed by the{100} faces and finally the {111} faces.
Right-angled potassium alum samples, about 4 × 4 × 10 mm in size, were cut frombigger, commercially available crystals (from ALVA GmbH, Germany) and preparedusing the same method as for the KDP samples. One or two triangular cuts, about 1-2mm wide and 0.5-1 mm deep, were made on at least one of the faces of each sample, asdone for the KDP samples. The orientation of the potassium alum crystals were definedafter each experiment with the help of the euhedral growth morphology.
5.1.3) Preparation of the saturated aqueous solutions.
Saturated solutions of potassium alum and KDP were prepared by dissolving indestilled water a slight excess quantity of crystal (potassium alum from Merck 101047"zur analyse", KDP from 104871 "krist. reinst") for a given saturation temperature. Thesolution was heated for a few hours to one days to a few degrees above the saturationtemperature until all the material had dissolved. The solution was then cooled down tothe saturation temperature in the experimental vessel, and small crystal weresubmerged in it to absorb the oversaturation. The solution was left under these
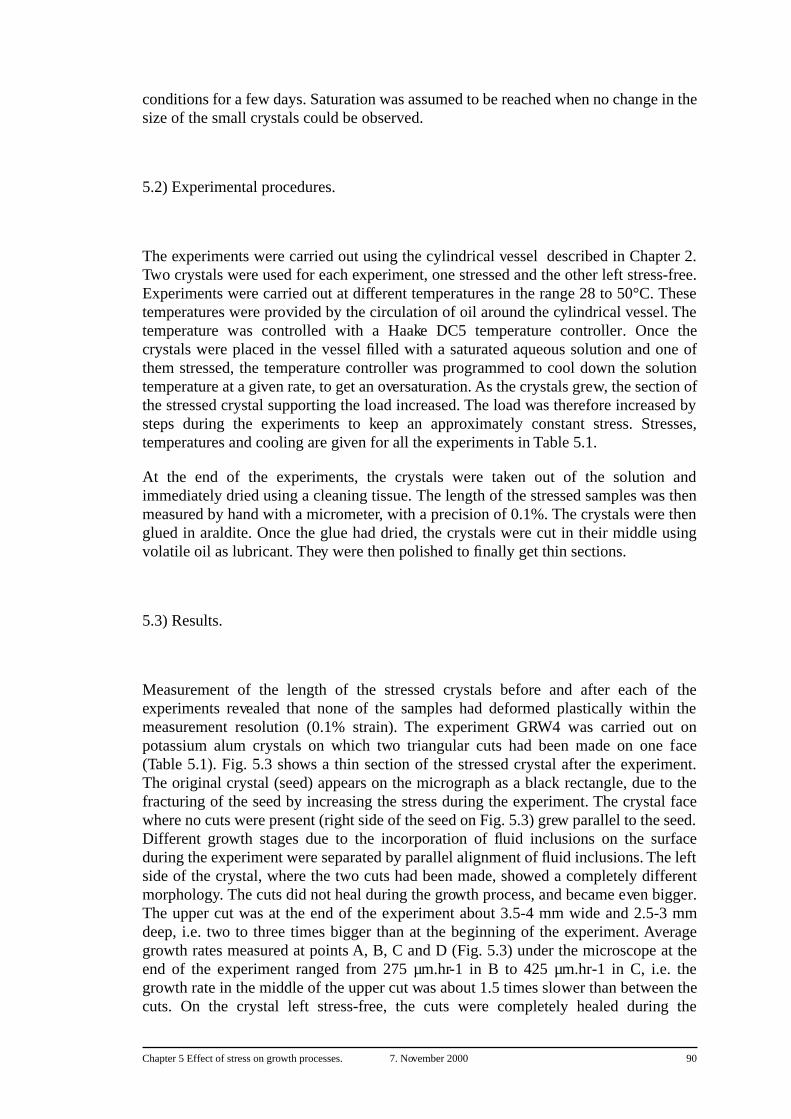
Chapter 5 Effect of stress on growth processes. 7. November 2000 90
conditions for a few days. Saturation was assumed to be reached when no change in thesize of the small crystals could be observed.
5.2) Experimental procedures.
The experiments were carried out using the cylindrical vessel described in Chapter 2.Two crystals were used for each experiment, one stressed and the other left stress-free.Experiments were carried out at different temperatures in the range 28 to 50°C. Thesetemperatures were provided by the circulation of oil around the cylindrical vessel. Thetemperature was controlled with a Haake DC5 temperature controller. Once thecrystals were placed in the vessel filled with a saturated aqueous solution and one ofthem stressed, the temperature controller was programmed to cool down the solutiontemperature at a given rate, to get an oversaturation. As the crystals grew, the section ofthe stressed crystal supporting the load increased. The load was therefore increased bysteps during the experiments to keep an approximately constant stress. Stresses,temperatures and cooling are given for all the experiments in Table 5.1.
At the end of the experiments, the crystals were taken out of the solution andimmediately dried using a cleaning tissue. The length of the stressed samples was thenmeasured by hand with a micrometer, with a precision of 0.1%. The crystals were thenglued in araldite. Once the glue had dried, the crystals were cut in their middle usingvolatile oil as lubricant. They were then polished to finally get thin sections.
5.3) Results.
Measurement of the length of the stressed crystals before and after each of theexperiments revealed that none of the samples had deformed plastically within themeasurement resolution (0.1% strain). The experiment GRW4 was carried out onpotassium alum crystals on which two triangular cuts had been made on one face(Table 5.1). Fig. 5.3 shows a thin section of the stressed crystal after the experiment.The original crystal (seed) appears on the micrograph as a black rectangle, due to thefracturing of the seed by increasing the stress during the experiment. The crystal facewhere no cuts were present (right side of the seed on Fig. 5.3) grew parallel to the seed.Different growth stages due to the incorporation of fluid inclusions on the surfaceduring the experiment were separated by parallel alignment of fluid inclusions. The leftside of the crystal, where the two cuts had been made, showed a completely differentmorphology. The cuts did not heal during the growth process, and became even bigger.The upper cut was at the end of the experiment about 3.5-4 mm wide and 2.5-3 mmdeep, i.e. two to three times bigger than at the beginning of the experiment. Averagegrowth rates measured at points A, B, C and D (Fig. 5.3) under the microscope at theend of the experiment ranged from 275 µm.hr-1 in B to 425 µm.hr-1 in C, i.e. thegrowth rate in the middle of the upper cut was about 1.5 times slower than between thecuts. On the crystal left stress-free, the cuts were completely healed during the
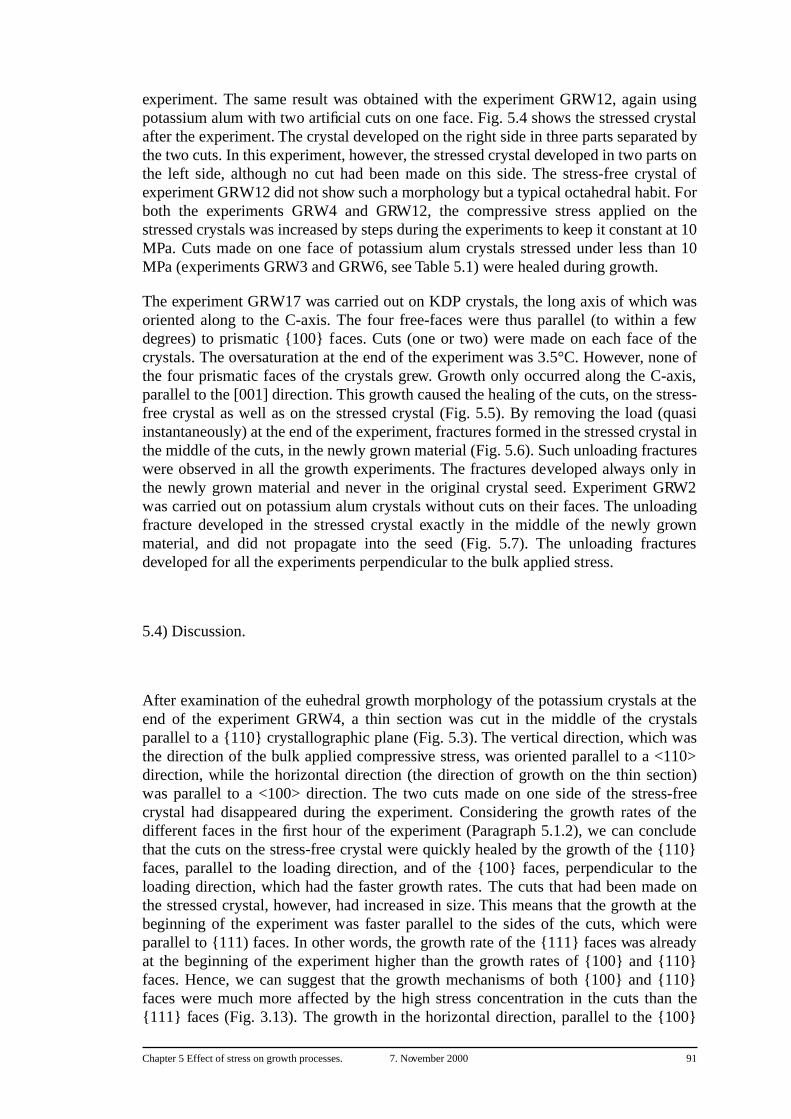
Chapter 5 Effect of stress on growth processes. 7. November 2000 91
experiment. The same result was obtained with the experiment GRW12, again usingpotassium alum with two artificial cuts on one face. Fig. 5.4 shows the stressed crystalafter the experiment. The crystal developed on the right side in three parts separated bythe two cuts. In this experiment, however, the stressed crystal developed in two parts onthe left side, although no cut had been made on this side. The stress-free crystal ofexperiment GRW12 did not show such a morphology but a typical octahedral habit. Forboth the experiments GRW4 and GRW12, the compressive stress applied on thestressed crystals was increased by steps during the experiments to keep it constant at 10MPa. Cuts made on one face of potassium alum crystals stressed under less than 10MPa (experiments GRW3 and GRW6, see Table 5.1) were healed during growth.
The experiment GRW17 was carried out on KDP crystals, the long axis of which wasoriented along to the C-axis. The four free-faces were thus parallel (to within a fewdegrees) to prismatic {100} faces. Cuts (one or two) were made on each face of thecrystals. The oversaturation at the end of the experiment was 3.5°C. However, none ofthe four prismatic faces of the crystals grew. Growth only occurred along the C-axis,parallel to the [001] direction. This growth caused the healing of the cuts, on the stress-free crystal as well as on the stressed crystal (Fig. 5.5). By removing the load (quasiinstantaneously) at the end of the experiment, fractures formed in the stressed crystal inthe middle of the cuts, in the newly grown material (Fig. 5.6). Such unloading fractureswere observed in all the growth experiments. The fractures developed always only inthe newly grown material and never in the original crystal seed. Experiment GRW2was carried out on potassium alum crystals without cuts on their faces. The unloadingfracture developed in the stressed crystal exactly in the middle of the newly grownmaterial, and did not propagate into the seed (Fig. 5.7). The unloading fracturesdeveloped for all the experiments perpendicular to the bulk applied stress.
5.4) Discussion.
After examination of the euhedral growth morphology of the potassium crystals at theend of the experiment GRW4, a thin section was cut in the middle of the crystalsparallel to a {110} crystallographic plane (Fig. 5.3). The vertical direction, which wasthe direction of the bulk applied compressive stress, was oriented parallel to a <110>direction, while the horizontal direction (the direction of growth on the thin section)was parallel to a <100> direction. The two cuts made on one side of the stress-freecrystal had disappeared during the experiment. Considering the growth rates of thedifferent faces in the first hour of the experiment (Paragraph 5.1.2), we can concludethat the cuts on the stress-free crystal were quickly healed by the growth of the {110}faces, parallel to the loading direction, and of the {100} faces, perpendicular to theloading direction, which had the faster growth rates. The cuts that had been made onthe stressed crystal, however, had increased in size. This means that the growth at thebeginning of the experiment was faster parallel to the sides of the cuts, which wereparallel to {111) faces. In other words, the growth rate of the {111} faces was alreadyat the beginning of the experiment higher than the growth rates of {100} and {110}faces. Hence, we can suggest that the growth mechanisms of both {100} and {110}faces were much more affected by the high stress concentration in the cuts than the{111} faces (Fig. 3.13). The growth in the horizontal direction, parallel to the {100}
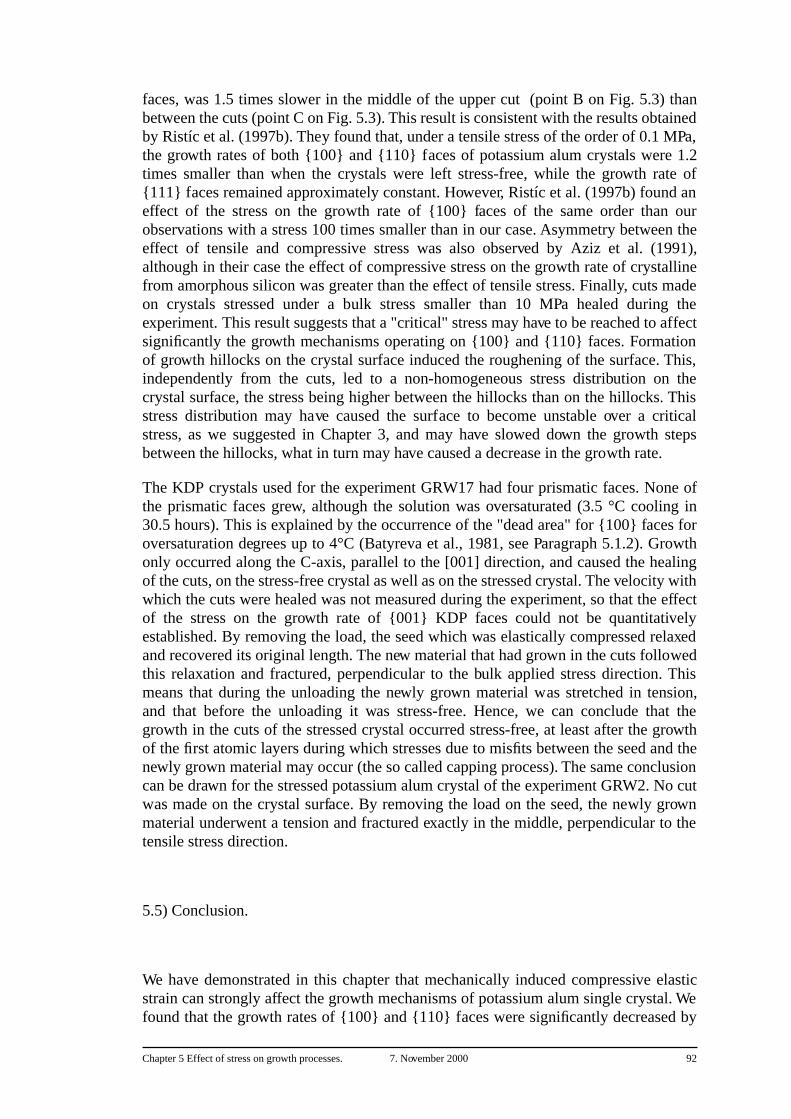
Chapter 5 Effect of stress on growth processes. 7. November 2000 92
faces, was 1.5 times slower in the middle of the upper cut (point B on Fig. 5.3) thanbetween the cuts (point C on Fig. 5.3). This result is consistent with the results obtainedby Ristíc et al. (1997b). They found that, under a tensile stress of the order of 0.1 MPa,the growth rates of both {100} and {110} faces of potassium alum crystals were 1.2times smaller than when the crystals were left stress-free, while the growth rate of{111} faces remained approximately constant. However, Ristíc et al. (1997b) found aneffect of the stress on the growth rate of {100} faces of the same order than ourobservations with a stress 100 times smaller than in our case. Asymmetry between theeffect of tensile and compressive stress was also observed by Aziz et al. (1991),although in their case the effect of compressive stress on the growth rate of crystallinefrom amorphous silicon was greater than the effect of tensile stress. Finally, cuts madeon crystals stressed under a bulk stress smaller than 10 MPa healed during theexperiment. This result suggests that a "critical" stress may have to be reached to affectsignificantly the growth mechanisms operating on {100} and {110} faces. Formationof growth hillocks on the crystal surface induced the roughening of the surface. This,independently from the cuts, led to a non-homogeneous stress distribution on thecrystal surface, the stress being higher between the hillocks than on the hillocks. Thisstress distribution may have caused the surface to become unstable over a criticalstress, as we suggested in Chapter 3, and may have slowed down the growth stepsbetween the hillocks, what in turn may have caused a decrease in the growth rate.
The KDP crystals used for the experiment GRW17 had four prismatic faces. None ofthe prismatic faces grew, although the solution was oversaturated (3.5 °C cooling in30.5 hours). This is explained by the occurrence of the "dead area" for {100} faces foroversaturation degrees up to 4°C (Batyreva et al., 1981, see Paragraph 5.1.2). Growthonly occurred along the C-axis, parallel to the [001] direction, and caused the healingof the cuts, on the stress-free crystal as well as on the stressed crystal. The velocity withwhich the cuts were healed was not measured during the experiment, so that the effectof the stress on the growth rate of {001} KDP faces could not be quantitativelyestablished. By removing the load, the seed which was elastically compressed relaxedand recovered its original length. The new material that had grown in the cuts followedthis relaxation and fractured, perpendicular to the bulk applied stress direction. Thismeans that during the unloading the newly grown material was stretched in tension,and that before the unloading it was stress-free. Hence, we can conclude that thegrowth in the cuts of the stressed crystal occurred stress-free, at least after the growthof the first atomic layers during which stresses due to misfits between the seed and thenewly grown material may occur (the so called capping process). The same conclusioncan be drawn for the stressed potassium alum crystal of the experiment GRW2. No cutwas made on the crystal surface. By removing the load on the seed, the newly grownmaterial underwent a tension and fractured exactly in the middle, perpendicular to thetensile stress direction.
5.5) Conclusion.
We have demonstrated in this chapter that mechanically induced compressive elasticstrain can strongly affect the growth mechanisms of potassium alum single crystal. Wefound that the growth rates of {100} and {110} faces were significantly decreased by
Chapter 5 Effect of stress on growth processes. 7. November 2000 93
compressive stress, in agreement with the observations made by Ristíc et al. (1997b)under tensile stress. We suggest that the non-homogeneous elastic strain distribution onthe surface of the stressed crystals decreased the growth step velocity between thegrowth hillocks, i.e. where the strain was the highest. This in turn caused a decrease inthe growth rate. This interpretation is consistent with the suggestions made in Chapter3 and Chapter 4, and reflects the importance that the roughness of the crystal surfacemay have on the growth and dissolution processes. We also showed that the overgrowthon the crystal seed occurred stress-free, at least after the formation of the first atomiclayers.
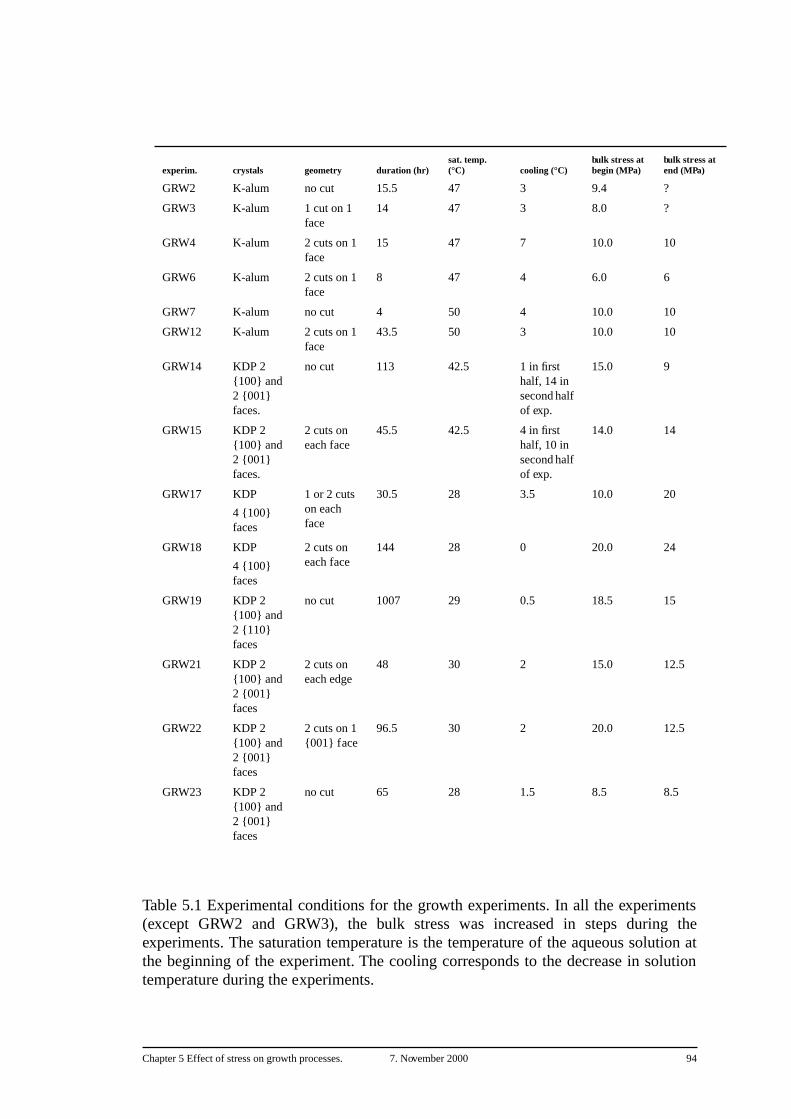
Chapter 5 Effect of stress on growth processes. 7. November 2000 94
Table 5.1 Experimental conditions for the growth experiments. In all the experiments(except GRW2 and GRW3), the bulk stress was increased in steps during theexperiments. The saturation temperature is the temperature of the aqueous solution atthe beginning of the experiment. The cooling corresponds to the decrease in solutiontemperature during the experiments.
experim. crystals geometry duration (hr)sat. temp. (°C) cooling (°C)
bulk stress at begin (MPa)
bulk stress at end (MPa)
GRW2 K-alum no cut 15.5 47 3 9.4 ?
GRW3 K-alum 1 cut on 1 face
14 47 3 8.0 ?
GRW4 K-alum 2 cuts on 1 face
15 47 7 10.0 10
GRW6 K-alum 2 cuts on 1 face
8 47 4 6.0 6
GRW7 K-alum no cut 4 50 4 10.0 10
GRW12 K-alum 2 cuts on 1 face
43.5 50 3 10.0 10
GRW14 KDP 2 {100} and 2 {001} faces.
no cut 113 42.5 1 in first half, 14 in second half of exp.
15.0 9
GRW15 KDP 2 {100} and 2 {001} faces.
2 cuts on each face
45.5 42.5 4 in first half, 10 in second half of exp.
14.0 14
GRW17 KDP
4 {100} faces
1 or 2 cuts on each face
30.5 28 3.5 10.0 20
GRW18 KDP
4 {100} faces
2 cuts on each face
144 28 0 20.0 24
GRW19 KDP 2 {100} and 2 {110} faces
no cut 1007 29 0.5 18.5 15
GRW21 KDP 2 {100} and 2 {001} faces
2 cuts on each edge
48 30 2 15.0 12.5
GRW22 KDP 2 {100} and 2 {001} faces
2 cuts on 1 {001} face
96.5 30 2 20.0 12.5
GRW23 KDP 2 {100} and 2 {001} faces
no cut 65 28 1.5 8.5 8.5
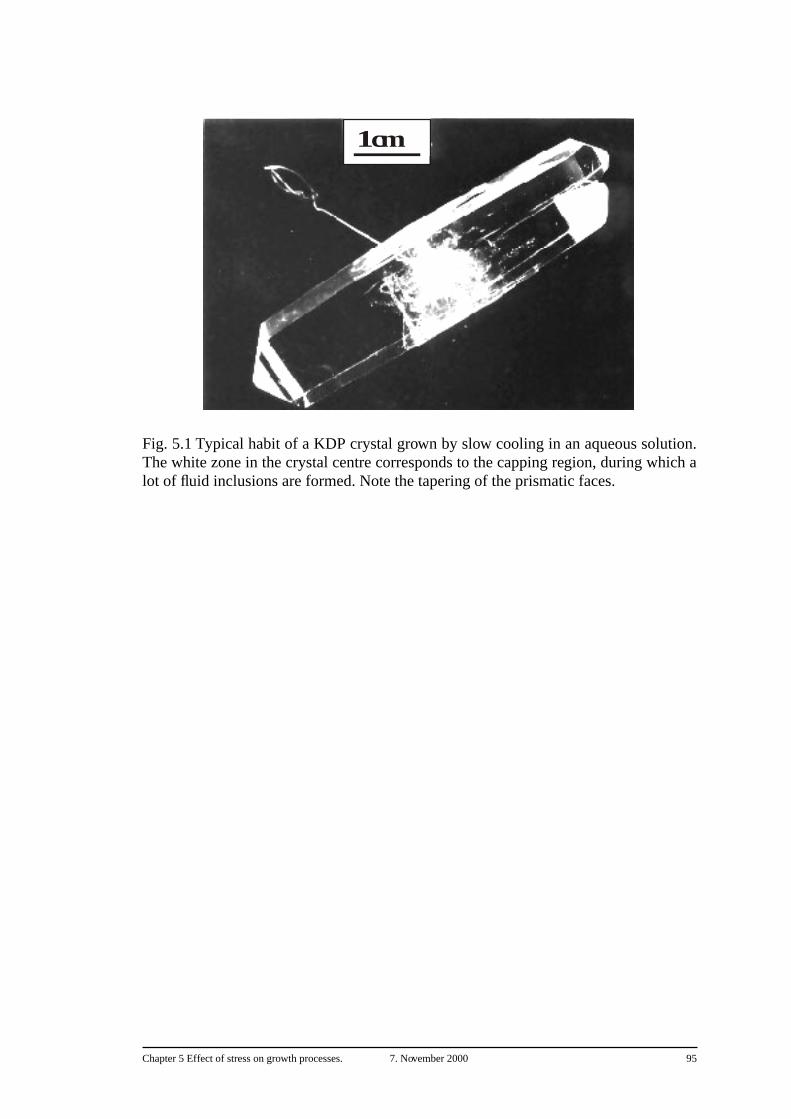
Chapter 5 Effect of stress on growth processes. 7. November 2000 95
Fig. 5.1 Typical habit of a KDP crystal grown by slow cooling in an aqueous solution.The white zone in the crystal centre corresponds to the capping region, during which alot of fluid inclusions are formed. Note the tapering of the prismatic faces.
1 cm
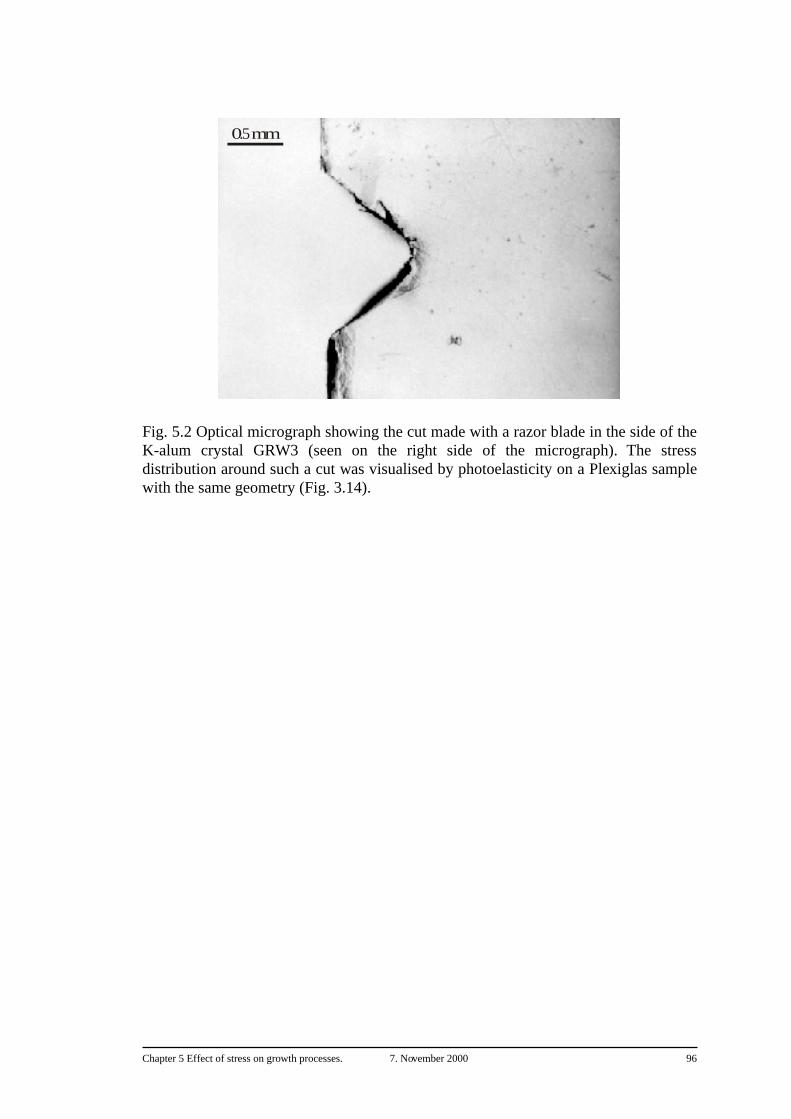
Chapter 5 Effect of stress on growth processes. 7. November 2000 96
Fig. 5.2 Optical micrograph showing the cut made with a razor blade in the side of theK-alum crystal GRW3 (seen on the right side of the micrograph). The stressdistribution around such a cut was visualised by photoelasticity on a Plexiglas samplewith the same geometry (Fig. 3.14).
0.5 mm
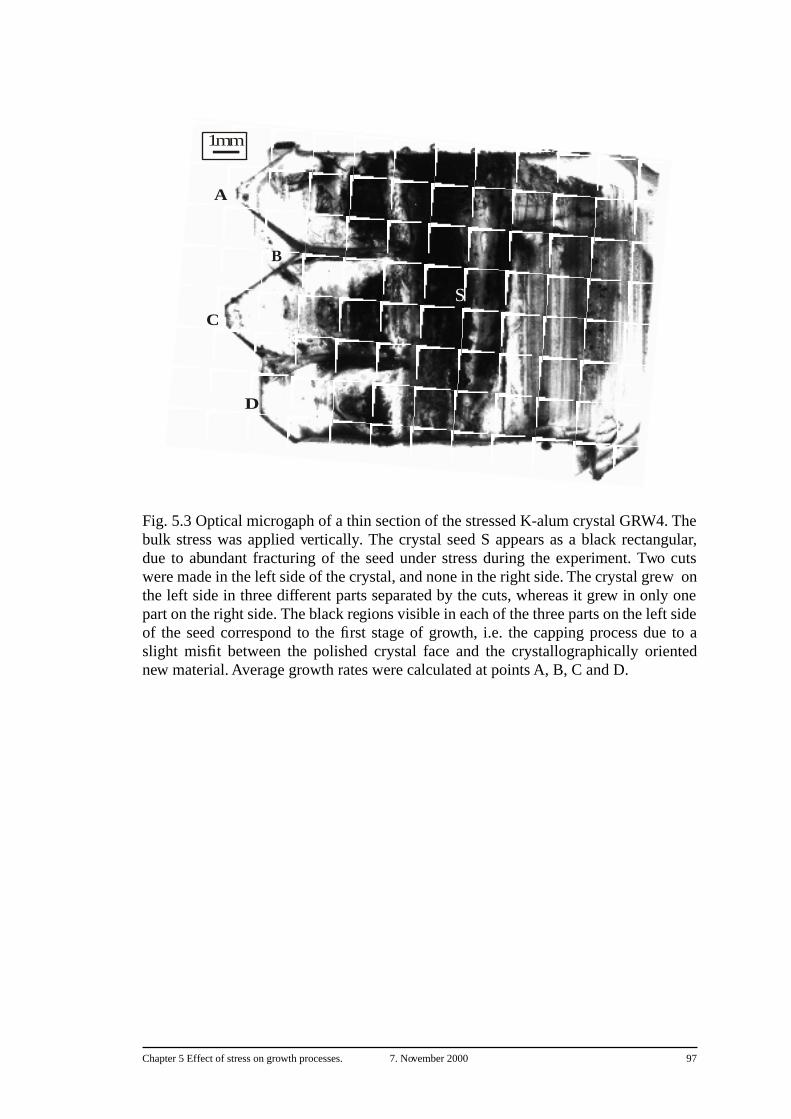
Chapter 5 Effect of stress on growth processes. 7. November 2000 97
Fig. 5.3 Optical microgaph of a thin section of the stressed K-alum crystal GRW4. Thebulk stress was applied vertically. The crystal seed S appears as a black rectangular,due to abundant fracturing of the seed under stress during the experiment. Two cutswere made in the left side of the crystal, and none in the right side. The crystal grew onthe left side in three different parts separated by the cuts, whereas it grew in only onepart on the right side. The black regions visible in each of the three parts on the left sideof the seed correspond to the first stage of growth, i.e. the capping process due to aslight misfit between the polished crystal face and the crystallographically orientednew material. Average growth rates were calculated at points A, B, C and D.
S
1 mm
A
B
C
D
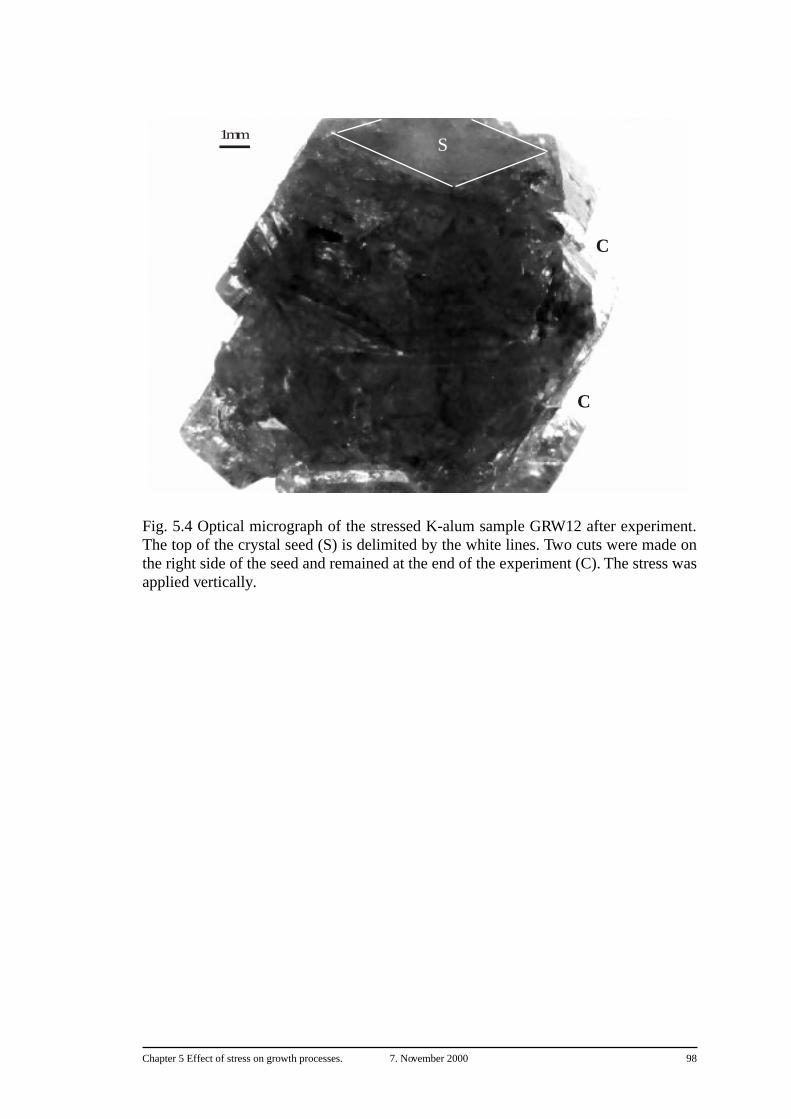
Chapter 5 Effect of stress on growth processes. 7. November 2000 98
Fig. 5.4 Optical micrograph of the stressed K-alum sample GRW12 after experiment.The top of the crystal seed (S) is delimited by the white lines. Two cuts were made onthe right side of the seed and remained at the end of the experiment (C). The stress wasapplied vertically.
S1 mm
C
C
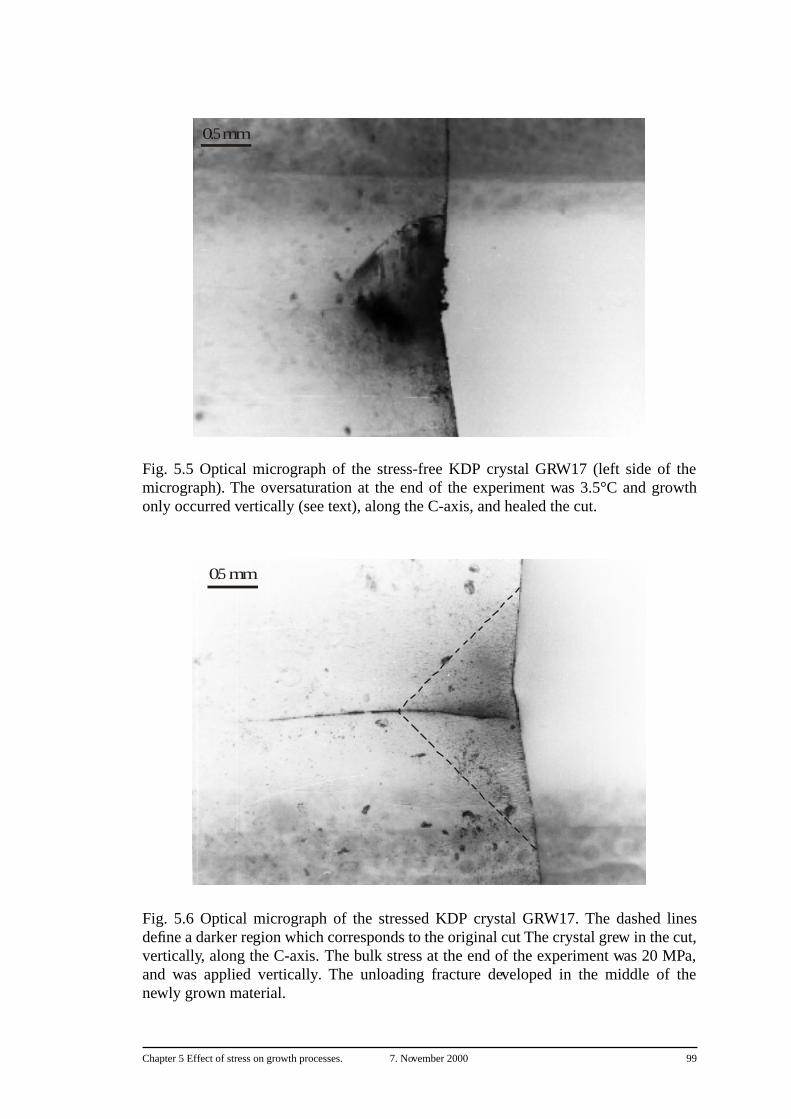
Chapter 5 Effect of stress on growth processes. 7. November 2000 99
Fig. 5.5 Optical micrograph of the stress-free KDP crystal GRW17 (left side of themicrograph). The oversaturation at the end of the experiment was 3.5°C and growthonly occurred vertically (see text), along the C-axis, and healed the cut.
Fig. 5.6 Optical micrograph of the stressed KDP crystal GRW17. The dashed linesdefine a darker region which corresponds to the original cut The crystal grew in the cut,vertically, along the C-axis. The bulk stress at the end of the experiment was 20 MPa,and was applied vertically. The unloading fracture developed in the middle of thenewly grown material.
0.5 mm
0.5 mm
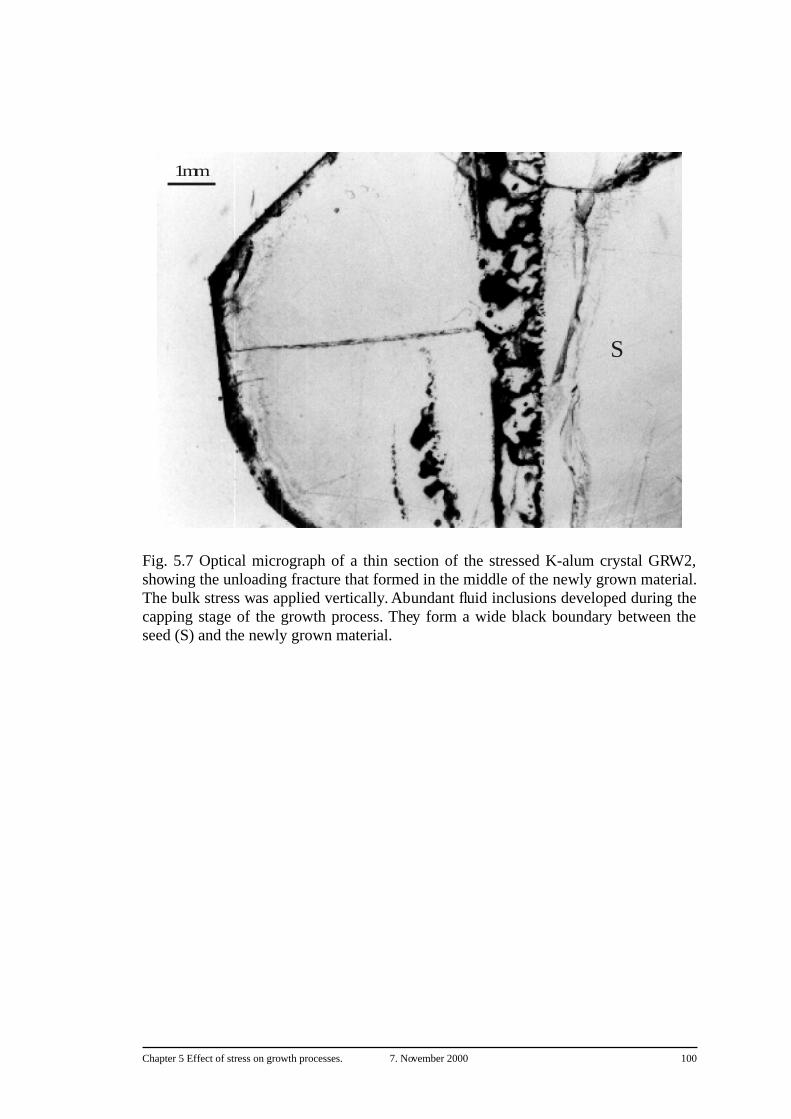
Chapter 5 Effect of stress on growth processes. 7. November 2000 100
Fig. 5.7 Optical micrograph of a thin section of the stressed K-alum crystal GRW2,showing the unloading fracture that formed in the middle of the newly grown material.The bulk stress was applied vertically. Abundant fluid inclusions developed during thecapping stage of the growth process. They form a wide black boundary between theseed (S) and the newly grown material.
S
1 mm
Chapter 6 Summary and conclusions. 7. November 2000 101
Chapter 6 Summary and conclusions.
This PhD thesis has been undertaken with the goal to investigate the role ofmechanically induced elastic strain on pressure solution processes. At geologicalrealistic stresses, differences in elastic strain energy are much smaller than differencesin crystal plastic strain energy or differences in grain boundary surface normal stressand, for this reason, are commonly neglected as a possible driving force for pressuresolution (Paterson, 1973; Shimizu, 1995). The experiments on the effect ofmechanically induced elastic strain on the dissolution and growth mechanisms inaqueous solution were carried out on elastic/brittle crystals of potassium alum, sodiumchlorate and potassium dihydrogen phosphate (KDP). These crystals were used asanalogues to rock-forming minerals such as quartz to make experimental investigationon the effect of elastic strain easier with low P-T conditions. It was found that, incontrast to what is commonly thought, mechanically induced elastic strain can stronglyaffect the dissolution and growth behaviour of crystals in aqueous solution, muchstronger than theoretically expected on the basis of the increase in bulk stored elasticstrain energy. The following observations were made:
1) The microstructure of stressed potassium alum crystal surfaces was strongly affectedby the elastic strain if the surfaces were rough. This roughness was caused by surfaceenergy-controlled dissolution, along periodic bond chain (PBC) directions, in theslightly undersaturated solution, and consisted of fine etch grooves (referred to in thisthesis as B-type grooves). It only occurred if the crystal surfaces were slightlymisoriented with respect to low index crystallographic faces (Herring, 1951). Thisroughness was mathematically described as a geometrical sinusoidal perturbation, witha characteristic wavelength, on an initially flat surface. For a crystal surface underdifferential stress, this perturbation led to a strongly non-homogeneous elastic straindistribution on the surface. The elastic strain was high in concavities ("valleys"), andsmall on convexities ("crests", see Fig. 3.13). Above a critical stress, the stress gradientbetween the crests and the valleys led to the instability of the crystal surface (the socalled Grinfeld instability, Grinfeld 1986). The dissolution in the valleys was stronglyenhanced and a new steady state structure developed, characterised by wide and deepdissolution grooves (further referred to as A-type grooves), oriented perpendicular tothe bulk applied stress. The grooves grew until an equilibrium wavelength was reached.This equilibrium wavelength appeared to be a function of the local surface stress, of thesurface energy and of the degree of undersaturation. For potassium alum, theequilibrium wavelength ranged from 20 to 80 µm, and decreased with increasing stressand increasing undersaturation. This microstructural evolution of a stressed crystalsurface in contact with an aqueous solution was consistent with the theoretical modelfrom Heidug & Leroy (1994) and Leroy & Heidug (1994).
A-type grooves developed always perpendicular to the local maximum compressivestress trajectories on the crystal surface, i.e. perpendicular to the direction of the
Chapter 6 Summary and conclusions. 7. November 2000 102
maximum compressive stress gradient between the crests and the valleys. The grooveswere straight far from the central hole, and curved near the hole. However, when thecrystals were stressed near their brittle failure strength, A-type grooves developed inseveral other directions as well (may be due to the formation of microfractures), evenin an orientation parallel to the direction of the maximum compressive stress. In someexperiments, this led to the formation of a network of dissolution grooves and to adecomposition of the crystal surface in many small parts. It was assumed that forlonger experiments this process could have led to cataclastic deformation of the entirecrystal. In all experiments, the orientation of the A- as well as B-type grooves was alsocrystallographically controlled, i.e. the grooves developed parallel to the PBC-directions of the crystal. The PBC-direction the most perpendicular to the localmaximum compressive stress trajectories was the one along which the groovespreferentially developed.
A-type grooves were also observed to develop on the surfaces of stressed crystals heldin saturated solution when scratches were intentionally made on the crystal surface. Onthe contrary, such grooves were never observed on perfectly flat, original low indexcrystal surfaces.
2) The dissolution of sodium chlorate single crystals appeared to be strongly enhancedby the stress. The faces of the crystals were parallel (to within a few degrees) to lowindex crystallographic planes, and no optically visible dissolution grooves developed.However, the dissolution rate of the stressed crystals was increased by one to twoorders of magnitude more than expected on the basis of the increase in bulk storedelastic energy. The dissolution rate of the stressed crystals increased linearly withincreasing stress. The increased dissolution rate was higher with increasingundersaturation. It was suggested that a non-homogeneous stress distributiondeveloped around dissolution pits formed at high surface energy sites on the crystalsurface (for example at screw dislocation outcrops or around impurities, i.e. where thedissolution preferentially occurred). The high elastic strain at the dissolution pits wouldhave led to an increase in the velocity of the dissolution steps, what in turn caused anincreased surface dissolution rate. The higher the undersaturation, the higher thenumber of structural surface defects that were activated as dissolution centres, as wasdemonstrated for potassium alum by Van der Hoek et al. (1983). Therefore the effect ofthe stress on the dissolution rate was increased with increasing undersaturation. Thelinear dependence of the dissolution rate on the stress was interpreted as due to a stress-dependent mobility of the dissolving particles (Barvosa-Carter et al., 1998).
3) The growth rate of both {100} and {110} faces of potassium alum crystals wasstrongly decreased under compressive stress. This result was consistent with theobservations made by Ristíc et al. (1997b) who observed a decrease in the growth rateof these faces on crystals stressed in tension. It was suggested that a non-homogeneouselastic strain distribution would develop on the crystal surface due to the formation ofgrowth hillocks. This could have led to a decrease in the velocity of the growth stepsbetween the hillocks, i.e. where the elastic strain was the highest. This in turn wouldhave led to the observed decrease of the growth rates.
Chapter 6 Summary and conclusions. 7. November 2000 103
It appears from these different observations that the influence of the elastic strain on thebehaviour of stressed crystals in solution strongly depends on the roughness of thecrystal surface. This roughness leads to a non-homogeneous elastic strain distributionon the crystal surface. The surface is no more in equilibrium with the aqueous solution,and the dissolution is enhanced where the elastic strain concentration is the highest, i.e.in the concavities of the surface.
For a periodic roughness, caused for example by a surface energy-induced dissolution(see point 1 above), the non-homogeneous elastic strain distribution causes thedevelopment of a the solid/fluid interface microstructure completely different of that ofa stress-free interface, with a strong increase in the amplitude and wavelength of theroughness. One may expect such a stress-induced microstructural evolution also tooccur on rock-forming minerals in contact with an undersaturated fluid. For example,for a typical rock-forming mineral such as quartz, solving equation (1.5) with a Youngmodulus E ~ 50 GPa, a surface energy γ ~ 0.5 Pa.m and a Poisson ratio ν = 0.25 wouldgive an equilibrium wavelength of 17 µm for an effective stress σ = 50 MPa, and of 4µm for an effective stress σ = 100 MPa. Such a roughness would be able tosignificantly affect the diffusion of the dissolving material along the mineral/fluidinterface. The observations on potassium alum crystals (see again point 1 above) weremade on free crystal surfaces oriented parallel to the bulk applied stress direction, i.e.surfaces for which only tangential stresses and no normal stresses play a role.Geological situations of high tangential stresses may be found for example in shearzones, where the migration of over- or undersaturated fluids through rocks may causethe roughening of the surfaces of the minerals, and hence induce a strong effect of thestress on the surface microstructures. The observations made on potassium alum arethus of prime important for the understanding of pressure solution mechanisms,particularly for the island-channel grain boundary model (Raj, 1982; Spiers &Schutjens, 1990; Gratz, 1991). The observation of grooves moving over the surfaceshows that the position of islands and channels may change in time, depending on theevolution of the surface stress distribution. A dynamic island-channel model wasalready suggested (e.g. Spiers & Schutjens, 1990) but never actually observed.Development of periodic wide and deep dissolution grooves on the surfaces of mineralsmay lead to an increase in the permeability of the rocks by increasing the channel/island area ratio at grain boundaries, and hence to an increase in the effective diffusionrate of the dissolved material along the grain boundaries. This would lead to anincreased pressure solution rate. The crystallographic orientation of the grooves, thedependence of the size of the equilibrium wavelength of the surface roughness on thecrystallographic orientation suggest that pressure solution might depend on thecrystallographic orientation, as was already suggested by Den Brok (1998).
For a non periodic roughness, caused by preferential dissolution at screw dislocationoutcrops or at structural surface defects, or caused by the development of growthhillocks, the non-homogeneous elastic strain distribution affects the propagation of thedissolution or growth steps. The strong increase in the dissolution rate of sodiumchlorate crystals with increasing stress and the decrease in the growth rate of {110} and{100} faces of potassium alum crystals (see points 2 and 3 above) may strongly affectpressure solution rate, especially when new grains with well formed crystallographicsurfaces developed, for example, along grain boundaries by cataclastic deformation of
Chapter 6 Summary and conclusions. 7. November 2000 104
older grains and may be present along grain boundaries. Formation of new grains withwell formed crystallographic surfaces was observed following the cataclasticdeformation of sodium chlorate aggregates.
The experimental effect of the elastic strain observed in this thesis may have seriousconsequences for the understanding of dissolution and growth processes in naturalrocks, notably under metamorphic conditions where interstitial fluids may readily beover- or undersaturated with respect to the neighbouring mineral phases. This effectappears much too strong to be neglected in modelling pressure solution phenomena.The recent progresses made in non-equilibrium thermodynamics applied to geologicalproblems (Heidug & Leroy, 1994; Leroy & Heidug, 1994; Yang & Srolovitz, 1994)gives the necessary tools to incorporate the effect of elastic strain energy in themodelling of pressure solution mechanisms. However, a more systematic confrontationbetween theoretical models and experimental observations is needed in order toquantify more precisely the influence of the elastic strain. An accurate relation betweenthe equilibrium wavelength of the dissolution grooves and the stress may, for example,help in determining paleo-stress.
References 7. November 2000 105
References
Aziz,M.J., Sabin,P.C. and Lu,G.Q.(1991): The activation strain tensor: non-hydrostaticstress effects on crystal growth kinetics. Phys. Rev. B 44, p. 9812-9816
Barvosa-Carter,W., Aziz,M.J., Gray,L.J. and Kaplan,T.(1998): Kinetically drivengrowth instability in stressed solids. Phys. Rev. Lett. 81[7], p. 1445-1448
Batyreva,I.A., Bespalov,V.I., Bredikhin,V.I., Galushkina,G.L., Ershov,V.P.,Katsman,V.I., Kuznetsov,S.P., Lavrov,L.A., Novikov,M.A. and Shvetsova,N.R.(1981):Growth and investigation of optical single crystals for high power laser systems. J.Cryst. Growth 52, p. 832-836
Bosworth,W.(1981): Strain-induced preferential dissolution of halite. Tektonophysics,78, p. 509-525
Buckley,H.E.(1958): Crystal growth. 4th edition. John Wiley & Sons, inc. New York
Chan Hai Guin, Katrich,M.D., Savinkov,A.I., and Shaskolskaya,M.P.(1980): Plasticstrain and dislocation structure of the KDP group crystals. Kristall und technik 15, p.479-488
Correns,C.W.(1949): Growth and dissolution of crystals under linear pressure.Discuss.Faraday Soc., 5, p. 267-271
Dam,B. and van Enckevort,W.J.P.(1981): On the formation of etch grooves aroundstress fields due to inhomogeneous impurity distribution in KH2PO4 single crystals. J.Cryst. Growth 51, p. 607-623
De Meer,S. and Spiers,C.J.(1995): Creep of wet gypsum aggregates under hydrostaticloading conditions. Tectonophysics 245, p. 171-183
References 7. November 2000 106
De Meer,S. and Spiers,C.J.(1999): Influence of pore-fluid salinity on pressure solutioncreep in gypsum. Tectonophysics 308, p. 311-330
Den Brok,S.W.J.(1992): An experimental investigation into the effect of water on theductile behaviour of quartz rocks. Geologica Ultraiectina 95, 178pp.
Den Brok,S.W.J.(1998): Effect of microcracking on pressure solution strain rate: TheGratz grain-boundary model. Geology 26 [10], p. 915-918
Den Brok,S.W.J., Zahid,M. and Passchier,C.W.(1998): Cataclastic solution creep ofvery soluble brittle salt as a rock analog. Earth Planet. Sci. Lett. 163, p. 83-95
Den Brok,S.W.J., Zahid,M. and Passchier,C.W.(1999a): Pressure solution compactionof NaClO3 and implications for pressure solution in NaCl. Tectonophysics 307, p.297-312
Den Brok,S.W.J., Zahid,M. and Passchier,C.W.(1999b): Stress induced grain boundarymigration in very soluble brittle salt. J. Struct. Geol. 21, p. 147-151
Den Brok,S.W.J. and Melisa,G.(1999): Pressure solution indentation experiments onK-Alum crystals. Abstract volume of the International conference on "DeformationMechanisms, Rheology and Microstructures" held in Neustadt an der Weinstrasse,Germany, 22-24 March
Den Brok,S.W.J. and Melisa,G.(2000): An experimental example of chemical reactiondriven solution transfer creep. Abstract for EGS XXV General Assembly, Nice, France,25-29 April
Elias,B.P. and Hajash,A.Jr.(1992): Changes in quartz solubility and porosity due toeffective stress: an experimental investigation of pressure solution. Geology 20, p.451-454
References 7. November 2000 107
Elliot,D.(1973): Diffusion flow laws in metamorphic rocks. Bull. Geol. Soc. Am. 84, p.2645-64
Engelder,T.(1982): A natural example of the simultaneous operation of free-facedissolution and pressure-solution. Geochim. Cosmochim. Acta 46, p. 69-74
Gal,D. and Nur,A.(1998): Elastic strain energy as a control in the evolution ofasymmetric pressure-solution contacts. Geology 26(7), p. 663-665
Gal,D., Nur,A. and Aharonov,E.(1998): Stability analysis of a pressure-solutionsurface. Geophys. Res. Lett. 25(8), p. 1237-1240
Gibbs,J.W.(1878): On the equilibrium of heterogeneous substances. Trans. Conn.Acad. 3, p.343-524 (Reprinted in The Scientific Papers of J. Willard Gibbs, vol.1,Longmans, Green, Toronto, Ont. 1906; reprinted by Dover, Mineola, N.Y., 1961)
Gmelins Handbuch der anorganischen Chemie (1970), 8 Aufl., Systemnr. 21
Weinheim/Bergstr. (sodium chlorate)
Gmelins Handbuch der anorganischen Chemie (1970), 8 Aufl., Systemnr. 22
Weinheim/Bergstr. (KDP)
Gmelins Handbuch der anorganischen Chemie (1970), 8 Aufl., Systemnr. 35
Weinheim/Bergstr. (potassium alum)
Gratier,J.P.(1993): Experimental pressure solution of halite by an indenter technique.Geophys. Res. Lett. 20(15), p. 1647-1650
Gratier,J.P. and Guiguet,R.(1986): Experimental pressure solution-deposition on quartzgrains: the crucial effect of the nature of the fluid. J. Struct. Geol. 8, p. 845-856
References 7. November 2000 108
Gratz,A.J.(1991): Solution-transfer compaction of quartzites: Progress toward a ratelaw. Geology 19, p. 901-904
Grinfel'd,M.A.(1986): Instability of the separation boundary between a non-hydrostatically stressed elastic body and a melt. Sov. Phys. Dokl. 31 [10], p. 831-834
Guzzetta,G.(1984): Kinematics of stylolite formation and physics of the pressure-solution process. Tectonophysics 101, p. 383-394
Hartman,P.(1987): Modern PBC theory. In Morphology of crystals, Terrapub, Tokyo
Haussühl,S.(1961): Kristallographie der Alaune I. Z. Kristall., 116, p. 371-405
Heidug,W.K. and Leroy,Y.M.(1994): Geometrical evolution of stressed and curvedsolid-fluid phase boundaries. 1. Transformation kinetics. J. Geophys. Res. 99(B1), p.505-515
Heimann,R.B.(1975): Auflösung von Kristallen. Springer-Verlag publications
Herring,C.(1951): Some theorems on the free energies of crystal surfaces. Phys. Rev.82(1), p. 87-93
Hickman,S.H. and Evans,B.(1991): Experimental pressure solution in halite: the effectof grain/interphase boundary structure. J. Geol.Soc.London 148, p. 549-560
Jaeger, J. C.(1969): Elasticity, Fracture and Flow, Chapman and Hall,
London, 268 p.
Kamb,W.B.(1959): Theory of preferred orientation developed by crystallization understress. J. Geol. 67, p. 153-170
References 7. November 2000 109
Kern,R.(1955): Influence du milieu de croissance sur la correspondance entremorphologie et structure cristalline. Interaction du cristal et du solvant, résultatsexpérimentaux (II). Bull. soc. franc. miner. cryst. 78, p. 497-520
Kitamura,M., Kouchi,A., Hosoya,S. and Sunagawa,I.(1982): Growth and dissolution ofNaClO3 crystal in aqueous solution. Mineral. J. 11(3), p. 119-137
Lacmann,R. and Tanneberger,U.(1995): Growth rate dispersion of single potassiumalum crystals. J. Cryst. Growth 147, p. 194-199
Lehner,F.K. and Bataille,J.(1984): Nonequilibrium thermodynamics of pressuresolution. Pure Appl. Geophys. 122, p. 53-85
Lehner,F.K.(1995): A model of intergranular pressure solution in open systems.Tectonophysics 245, p. 153-170
Leroy,Y.M. and Heidug,W.K.(1994): Geometrical evolution of stressed and curvedsolid-fluid phase boundaries. 2. Stability of cylindrical pores. J. Geophys. Res. 99(B1),p. 517-530
Lipson,H. and Beevers,C.A.(1935): The crystal structure of the alums. Proc.Roy.Soc.,A148, p. 664-680
Lipson,H.(1935): The relations between the alum structures. Proc.Roy.Soc., A151,p.347-356
Martin,B., Röller,K. and Stöckhert,B.(1999): Low-stress pressure solution experimentson halite single crystals. Tectonophysics 308, p. 299-310
Nielsen,A.E. and Söhnel,O.(1971): Interfacial tensions electrolyte crystal-aqueoussolution from nucleation data. J. Cryst. Growth 11, p. 233-242
Ostapenko,G.T.(1968): Recrystallization of minerals under stress. GeochemistryIntern. 6, p. 183-186
References 7. November 2000 110
Ostapenko,G.T.(1975): Theories of local and absolute chemicals potential, theirexperimental testing and application of the phase rule to the systems withnonhydrostatically stressed solid phases. Geochemistry Intern., p. 126-135
Passchier,C.W. and Trouw,R.A.J.(1996): Microtectonics, Springer Verlag, Berlin
Paterson,M.S.(1973): Nonhydrostatic thermodynamics and its geological applications.Rev. Geophys. Space Phys. 11, p. 355-389
Raj,R.(1982): Creep in polycrystalline aggregates by matter transport through a liquidphase. J. Geophys. Res. 87(B6), p. 4731-4739
Raj,R. and Chyung,C.K.(1981): Solution precipitation creep in glass ceramics. ActaMetall. 29, p. 159-166
Riecke,E.(1912): Zur Erniedrigung des Schmelzpunktes durch einseitigen Zug oderDruck, Zentralbl. Mineral. Geol. Palaeontol. Teil 3, p. 97-104
Ristic,R.I., Sherwood,J.N. and Shripathi,T.(1997b): The influence of tensile strain onthe growth of crystals of potash alum and sodium nitrate. J. cryst. growth 179, p. 194-204
Ristic,R.I., Shekunov,B. and Sherwood,J.N.(1996): Long and short period growth ratevariations in potash alum crystals. J. Cryst. Growth 160, p. 330-336
Ristic,R.I., Shekunov,B.Y. and Sherwood,J.N.(1997a): The influence of synchrotronradiation-induced strain on the growth and dissolution of brittle and ductile materials.J. cryst. growth 179, p. 205-212
Ristic,R.I., Sherwood,J.N. and Wojciechowski,K.(1993): Morphology and growthkinetics of large sodium chlorate crystals grown in the presence and absence of sodiumdithionate impurity. J. Phys. Chem. 97(41), p. 10774-10782
References 7. November 2000 111
Robin,P.Y.F.(1978): Pressure solution at grain to grain contacts. Geochim. Cosmochim.Acta 42[9], p. 1383-1398
Russel,G.A.(1935): Crystal growth and solution under local stress. Amer.Mineral., 20,p. 733-737
Rutter,E.H.(1976): The kinetics of rock deformation by pressure solution. Phil. Trans.R. Soc. London A283, p. 203-219
Rutter,E.H.(1983): Pressure solution in Nature, theory and experiment. J. Geol. Soc.London 140, p. 725-740
Rutter,E.H. and Wanten,P.H. (2000): Experimental study of the compaction ofphyllosilicate-bearing sand at elevated temperature and with controlled pore waterpressure. J. Sedim. Res. A 70 [1], p. 107-116
Schubnikow,A. and Brunowsky,B.(1931): Über die Natur der Vizinalflächen desOktaeders des Aluminiumalauns: Z. Kristall. Mineral. 77, p. 337-352
Schutjens,P.M.T.M.(1991): Experimental compaction of quartz sand at low effectivestress and temperature conditions. J. Geol. Soc. London 148, p. 527-539
Schwarz,S. and Stöckhert,B.(1996): Pressure solution in siliclastic HP-LTmetamorphic rocks-constraints on the state of the stress in deep levels of accretionarycomplexes. Tectonophysics 255, p. 203-209
Shimizu,I.(1995): Kinetics of pressure solution creep in quartz: theoreticalconsiderations. Tectonophysics 245, p. 121-134
Sorby,J.C.(1863): Über Kalkstein-Geschiebe mit Eindrucken. Neues Jahrb. Mineral.Geol. Palaeontol., p. 801-807
References 7. November 2000 112
Spiers,C.J., Urai,J.L., Lister,G.S., Boland,J.N. and Zwart,H.J.(1986): The influence offluid-rock interaction on the rheology of salt rock. EUR 10399 EN, Office for OfficialPublications of the European Communities, Luxembourg
Spiers,C.J. and Schutjens,P.M.T.M.(1990): Densification of crystalline aggregates byfluid-phase diffusional creep. In: D.J. Barber and P.G. Meredith (Editors), Deformationprocesses in minerals, ceramics and rocks. Unwin Hyman, London, Chapter 12, p. 334-353
Spiers,C.J. and Brzesowsky,R.H.(1993): Densification behaviour of wet granular salt:theory versus experiment. Seventh symposium on salt 1, p. 83-92
Sprunt,E.S. and Nur,A.(1977a): Destruction of porosity through pressure solution.Geophysics 42, p. 726-741
Sprunt,E.S. and Nur,A.(1977b): Experimental study of the effects of stress on solutionrate. J. Geophys. Res. 82(20), p. 3013-3022
Srolovitz,D.J.(1989): On the stability of surfaces of stressed solids. Acta Metall. 37, p.621-625
Szurgot,M.(1995): Chiral etch pits on sodium chlorate crystals. Cryst. Res. Technol.30, p. 621-628
Tada,R. and Siever,R.(1986): Experimental knife-edge pressure solution of halite.Geochim. Cosmochim. Acta 50, p. 29-36
Tada,R. and Siever,R.(1989): Pressure solution during diagenesis. Ann. Rev. of Earthand Planet. Sci. 17, p. 89-118
Thompson,J.(1862): On crystallization and liquefaction, as influenced by stressestending to change of form in the crystals. Proc. Roy. Soc. London 11, p. 473-481
References 7. November 2000 113
Timoshenko,S.P.(1949): Strength of materials PartII. Advanced theory and problems.2nd ed., D. van Nostrand Company, inc., p. 319-320 (pp.510)
Timoshenko,S.P. and Goodier,J.N.(1970): Theory of elasticity. 3rd ed., McGraw-Hill,New York
Ullmann's encyclopedia of industrial chemistry (1985), 5th edition, Vol. A1
Urai,J.L., Spiers,C.J., Zwart,H.J. and Lister, G.S.(1986): Weakening of rock salt bywater during long-term creep. Nature 324, p. 554-557
Van der Hoek,B., van Enckevort,W.J.P. and van der Linden,W.H.(1983): Dissolutionkinetics and etch pit studies of potassium aluminium sulphate. J. Cryst. Growth 61, p.181-193
Viswanathan,R.(1966): Elastic contants of soldium chlorate single crystals by pulse-echo method. J. Appl. Phys. 37, p. 884-888
Weyl,P.K.(1959): Pressure solution and the force of crystallisation. Aphenomenological theory. J. Geophys. Res. 64, p. 2001-2025
Wilke,K.Th.(1988): Kristall Züchtung. New edition by Bohm,J. Verlag Harri Deutshpublications, Frankfurt/Main
Yang, W.H. and Srolovitz,D.J.(1994): Surface morphology evolution in stressed solids:surface diffusion controlled crack initiation. J. Mech. Phys. Solids 42, p. 1551-1574
Yu,H.H. and Suo,Z.(2000): Stress-dependent surface reactions and implications for astress measurement technique. J. Appl. Phys. 87[3], p. 1211-1218
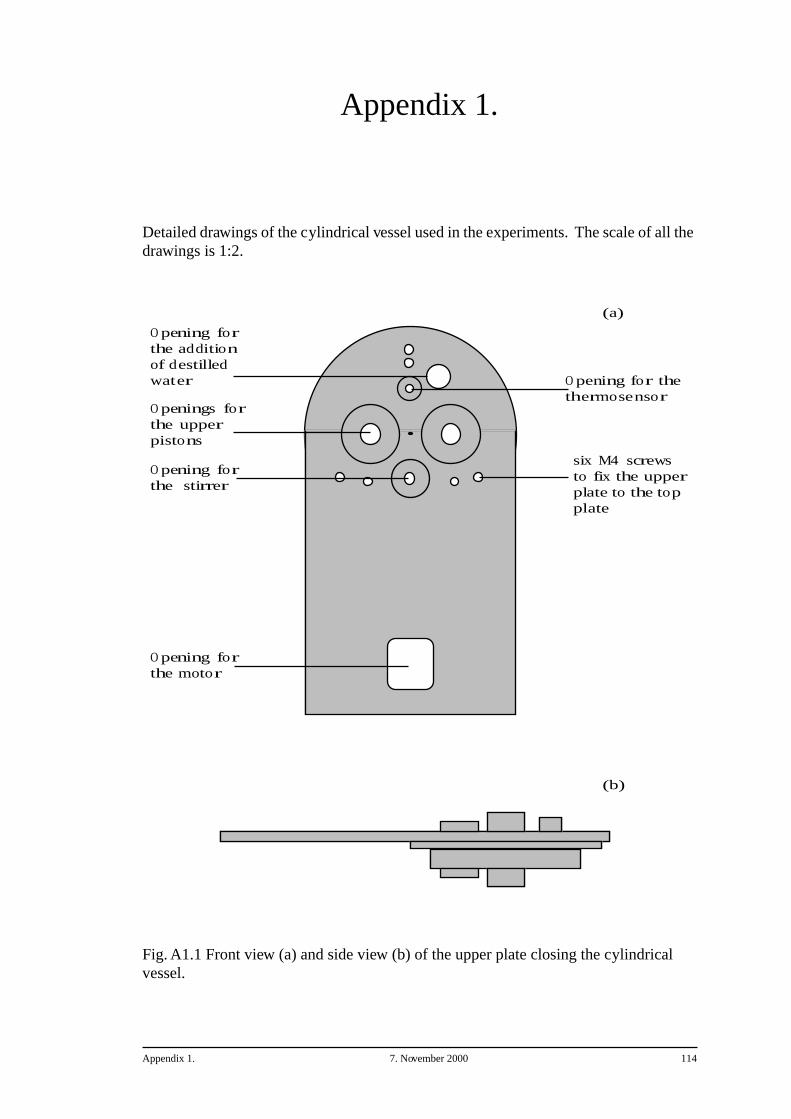
Appendix 1. 7. November 2000 114
Appendix 1.
Detailed drawings of the cylindrical vessel used in the experiments. The scale of all the drawings is 1:2.
Fig. A1.1 Front view (a) and side view (b) of the upper plate closing the cylindrical vessel.
O pening forthe motor
O pening forthe stirrer
O penings forthe upperpistons
O pening forthe additionof destilledwater O pening for the
thermosensor
six M4 screwsto fix the upperplate to the topplate
(a)
(b)
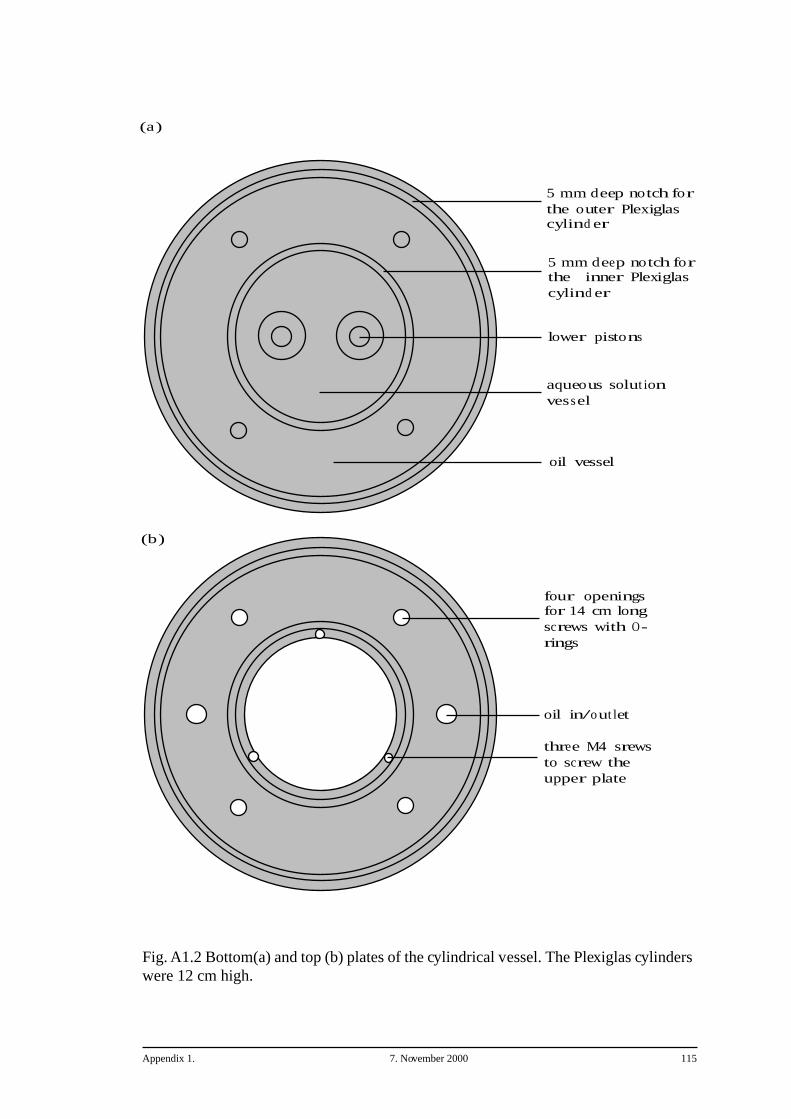
Appendix 1. 7. November 2000 115
Fig. A1.2 Bottom(a) and top (b) plates of the cylindrical vessel. The Plexiglas cylinders were 12 cm high.
5 mm deep notch forthe outer Plexiglascylind er
5 mm deep notch forthe inner Plexiglascylind er
lower pistons
aqueous solut ionvessel
oil vessel
oil in/out let
four openingsfor 14 cm longscrews with O-rings
three M4 srewsto screw theupper plate
(a)
(b)
Lebenslauf 7. November 2000 116
Lebenslauf
Name: Jacques MOREL
Wohnort:129, route de la Pointe de Mousterlin
F-29170 Fouesnant, Frankreich
Staatsangehörigkeit: französisch
21/09/74 geboren in Quimper, département Finistère, Frankreich
06/1991 Baccalauréat C (Mathématiques et Physique), Quimper
06/1993 DEUG A (Mathématiques, Physiques et Informatiques) option
physique, Université de Bretagne Occidentale, Brest, Frankreich
06/1994 Licence de physique, Université de Bretagne Occidentale, Brest,
Frankreich
06/1995 Maîtrise de physique, Université de Bretagne Occidentale, Brest,
Frankreich
06/1996 DEA Physique et Chimie de la Terre, EOPG Strasbourg, Frankreich
11/1996-11/2000 Doktorarbeit in Geologie, Institut für Geowissenschaften,Johannes
Gutenberg-Universität Mainz, Deutschland

Lebenslauf 7. November 2000 117