fracture-matrix interface area contacted by in- jected
TRANSCRIPT
1
Fracture-Matrix Interface Area Contacted by In-
jected Fluid as a Function of Average Saturation,
Mechanical Aperture and Counter-Current Imbibi-
tion
Philipp LANG1,2
, Stephan MATTHÄI1
1 Department of Petroleum Engineering, University of Leoben, Austria;
2 phi-
Abstract
Capillary fluid transfer between fractures and water-wet siliclastic rock is a vital contributor to
achieving significant recovery from waterfloods in naturally fractured reservoirs where the rock
matrix contains most of the hydrocarbon volume, but the fractures provide for the fluid path-
ways. This transfer, however, is restricted to the subset of fractures that is actually reached by the
injected water.
Using discrete fracture network models and control volume finite element simulation, we find
that the fracture surface area contacted by the injected water, Af,sw, is a function not only of the
average saturation but strongly depends on rock properties and flow velocity. Conventional dual-
continua approaches fail to account for this non-linear behavior, thus introducing an error to the
quantification of fluid exchange.
Introduction
Conventional thinking on numerical simulation of naturally fractured reservoirs (NFR) is
subdued by multi-continua approaches. Fractures and matrix are treated as independent entities
with their interaction being captured by so called transfer functions. Flow due to viscous pressure
gradients may either occur in both, matrix and fractures (dual permeability), or only within the
fractured domain (dual porosity). Based on a statistical network description, usually restricted to
density and permeability of fractures, an effective permeability is averaged across grid blocks
and a storage capacity is assigned (Warren and Root, 1963; Kazemi et al., 1976). This averaging
of permeability over cells with an extent of up to a couple of hundred meters in diameter
implicitly assumes the applicability of a representative elementary volume (REV).
Recent literature, however, strongly indicates that such a REV with respect to flow behavior
does not exist (Bonnet et al., 2001; Paluszny et al., 2007; Matthäi et al, 2009). The non-uniform
but much rather fractal nature of fractures rock matrix with respect to conductivity,
geometry/orientation and density along with the tendency to occur in sets demands for different
means of accommodation. In Nelson Type II fractured reservoirs, the porous rock matrix acts as
hydrocarbon storage whereas the fracture network provides for phase transport due to a viscous
gradient (Nelson, 1982). Recovery in such a reservoir is controlled by the ability to drain oil to
the fracture flow system from its adjacent matrix by means of capillary forces (fracture-matrix
transfer, FMT). This exchange of phases is caused by the preference of the matrix to the water
phase as opposed to the oil phase, being initially saturated with the latter. In case of water wet
rock, the injected wetting fluid will imbibe the matrix through the fracture surface area. This
exchange between phases is conventionally accommodated for by means of the above-mentioned
Philipp LANG, Stephan MATTHÄI
2
transfer function. Naturally, this transfer only occurs at that fraction of the surface which actually
is in contact with the injected fluid. This contacted area, however, is assumed to be constant by
the dual-porosity approach.
We developed a CSMP++ based numerical simulator using a control volume finite element
scheme (Geiger et al., 2003; Paluszny et al., 2007; Matthäi et al., 2009) to take a closer look at
the nature of the portion of total fracture area that is contacted by injected fluid, Af,sw. It is shown
that it strongly depends on matrix properties and fracture flow velocity, obeying a non-linear
behavior. This dependence reveals a significant simplification in dual continua models, where
the average grid block saturation is considered to be the lone factor of how much contact area
allows for phase transfer. As a result, the total volume exchanged between fracture and rock
domain is liekly to be underestimated.
The numerical reservoir simulator is presented which allows us to run discrete fracture network
(DFN) models by using an exponential transfer function (Unsal et al., 2009). Fracture traits are
computed accounting for geometry and subsurface stress regime. Simulation setups reflect
quarters of a five-spot well pattern and fractured reservoir geometries of meso-scale size (i.e. up
to 300m in diameter). Well pairs with constant rate and pressure condition, for the injector and
producer respectively, cover a range of flow velocities. The effects of fracture-matrix transfer on
flow within single fractures and the ensemble fracture networks are illustrated.
Methodology
Using the CSMP++ library, a control volume finite element (CVFE, Geiger et al., 2003) based
simulator within the C++ programming language was developed. Flow phenomena accounted for
in this simulator include viscous displacement, capillary spreading within the fractures and
transfer of phases between fracture and adjacent matrix. Multiphase flow is restricted to a water-
oil system as found in undersaturated reservoirs. The numerical solution technique of choice was
IMPIMS, referring to the sequential implicit solution of both pressure and saturation. Simulation
models base on DFN geometries and a finite element discretization. Each fracture’s permeability
is computed accounting for internal fluid pressure and relative stress state. While flow through
the network is simulated using the above approach, an exchange of phases between the fractures
and what we call the ‘virtual matrix’ is imposed by means of a non-linear transfer function that
acts as source/sink in the transport equation (Unsal et al., 2009). This is done in an effort to
account for counter-current imbibition during e.g. waterflooding of an oil saturated water-wet
fractured reservoir. The area of fracture elements in contact with the displacing phase is
calculated and output versus the amount of injected volume.
Parameter Unit Value Discretization
a (fracture aperture) m 5.0 x 10⁻⁴ to 1.0 x 10⁻² Piecewise constant
k (fracture permeability) m2 1.0 x 10⁻⁸ to 1.0 x 10⁻¹⁵ Piecewise constant
km (matrix permeability) m2 1.0 x 10⁻⁸ to 1.0 x 10⁻¹⁵ Piecewise constant
kr,w (fracture relative permeability water) - 0.0 to 1.0 x 10¹⁰ Piecewise constant
kr,nw (fracture relative permeability oil) - 0.0 to 1.0 x 10¹⁰ Piecewise constant
Sw (water saturation) - 0.0 to 1.0 Nodal property
μo (oil density) Kg m-3 800.0 Nodal property
μw (water density) Kg m-3 1000.0 Nodal property
Fracture-Matrix Interface Area Contacted by Injected Fluid
3
ρo (oil viscosity) Pa sec 0.005 Nodal property
ρw (water viscosity) Pa sec 0.001 Nodal property
So,r (oil residual saturation) - 0.0 Piecewise constant
Sw,r (water residual saturation) - 0.0 Piecewise constant
So.i (oil initial saturation) - 1.0 Piecewise constant
pf (fracture fluid pressure) Pa 0.0 to 1.0 x 10⁸ Nodal property
σn (fracture element normal stress) N m-2 tbd Piecewise constant
τ (fracture element shear stress) N m-2 tbd Piecewise constant
qfmt (fracture matrix transfer source) m3 m-3 sec-1 tbd Piecewise constant
fw (fractional flow water) - 0.0 to 1.0 x 10¹⁰ NA
λo (oil phase mobility) - tbd Piecewise constant
λw (water phase mobility) - tbd Piecewise constant
λt (total mobility) - tbd Piecewise constant
pcm (matrix capillary pressure) Pa tbd Piecewise constant
pcf (fracture capillary pressure) Pa tbd Piecewise constant
Af (fracture surface area) m2 tbd NA
Af,sw (Af contacted by injected fluid) % tbd NA
Table 1: Simulation variables as used in the CSMP++ CVFE DFN simulator for a two phase system
(wetting phase water, non-wetting phase oil)
Simulation Models
Any reservoir simulation workflow starts out with an adequate geometrical representation of the
domain of interest. Using computer aided tools, a more or less detailed model is generated based
on a thorough characterization of the geology at hand. In the case of natural fractures, this is far
from being trivial due to a number of reasons:
The fracture surface to thickness aspect ratio is extremely large (fracture aperture in the
range of micrometers, reservoir extend in the range of kilometers)
Fractures might displace adjacent layers due to lateral movement (shear displacement)
Focus of flow inside the fractures due to their likely high permeability
Especially in Nelson reservoirs of Type II and higher, interconnected fractures constitute the
dominant flow paths, and capturing the flow phenomena within them provides major insight into
the dynamic nature of such a reservoir. The approach of choice (DFN) is to model the fractures
only and consider the matrix to be a mere virtual accommodator of hydrocarbons, with a transfer
function capturing fluid exchange between the domains. This might be considered an equivalent
to the dual porosity approach, but we considered it superior in both, its predictive and illustrative
capabilities for fractured reservoir behavior due to the explicit modeling of fracture geometry.
Philipp LANG, Stephan MATTHÄI
4
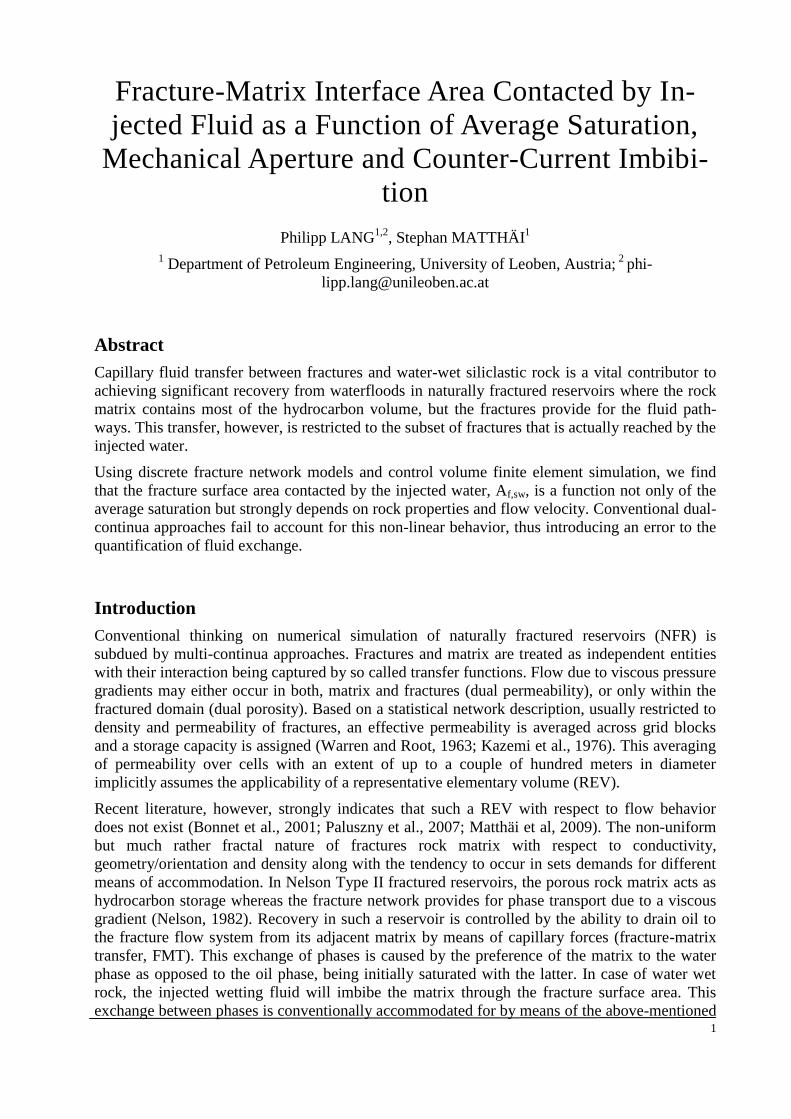
Figure 1: Discrete Fracture Network (DFN) model finite element discretization.
The geological model of the fracture network is consequently discretized in space using lower
dimensional (planar) finite elements in 3D (Figure 1). The advantages of a discrete fracture
network representation start with the ability to retain the major flow paths in a geometrically
proper manner. Orientation and size of fractures are accounted for. Compared to discrete fracture
discrete matrix models (DFM), mesh element count is reduced by one to two orders of
magnitude (Unsal et al., 2009) and the meshing procedure itself spares a lot of complexity.
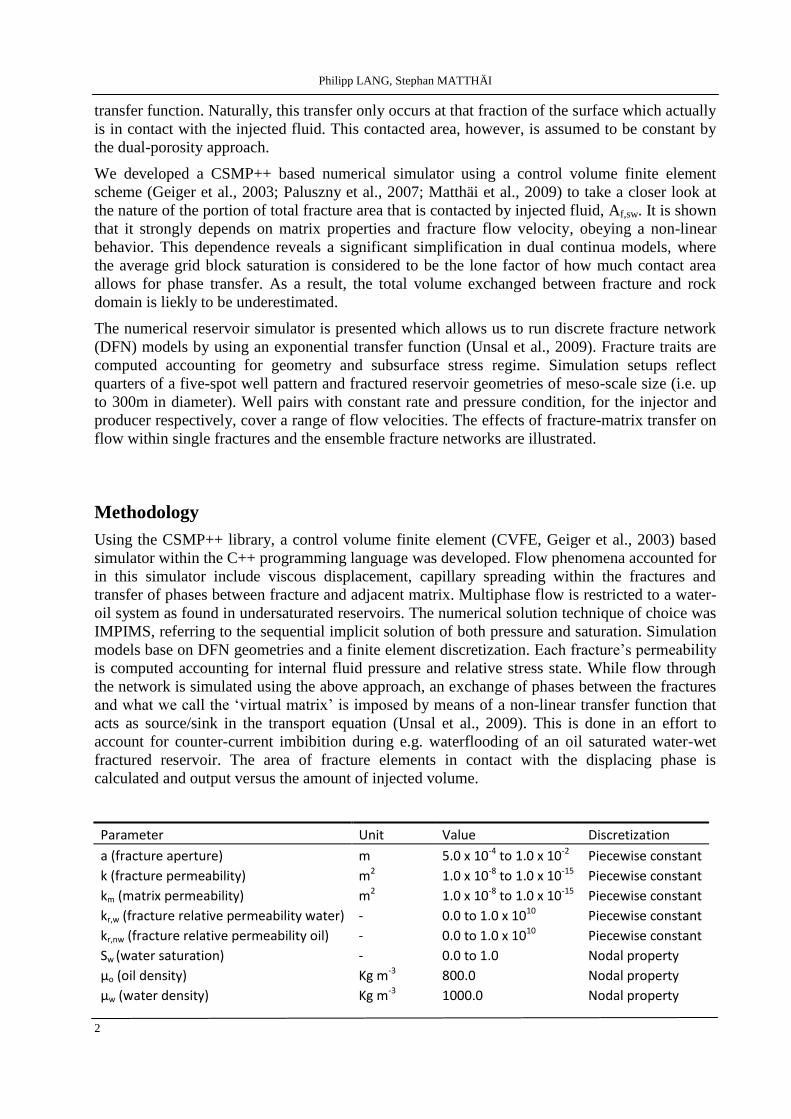
Simulation Setup
A quarter of an inverted five-spot pattern (Figure 2) is used as simulation setup. An injector-
producer pair at opposing edges in the cube shaped meso-scale reservoir models provides for
through-flow. Constant rate boundary conditions represented the water injecting well, whereas
the producers were set to constant pressure.
Figure 2: Inverted Five-Spot Pattern; simulation setups used represent a quarter (shaded),
featuring an injector-producer pair. The extent of the diagonal of the models is between 125 and
500 m.
Fracture-Matrix Interface Area Contacted by Injected Fluid
5
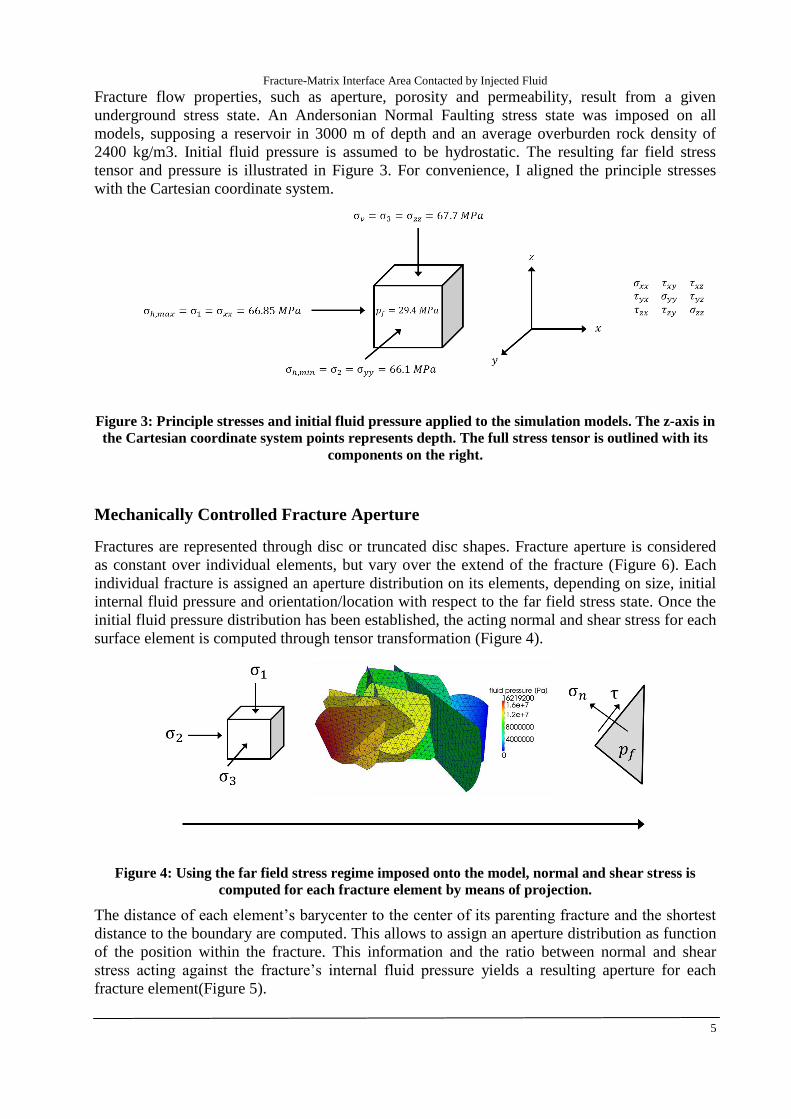
Fracture flow properties, such as aperture, porosity and permeability, result from a given
underground stress state. An Andersonian Normal Faulting stress state was imposed on all
models, supposing a reservoir in 3000 m of depth and an average overburden rock density of
2400 kg/m3. Initial fluid pressure is assumed to be hydrostatic. The resulting far field stress
tensor and pressure is illustrated in Figure 3. For convenience, I aligned the principle stresses
with the Cartesian coordinate system.
Figure 3: Principle stresses and initial fluid pressure applied to the simulation models. The z-axis in
the Cartesian coordinate system points represents depth. The full stress tensor is outlined with its
components on the right.
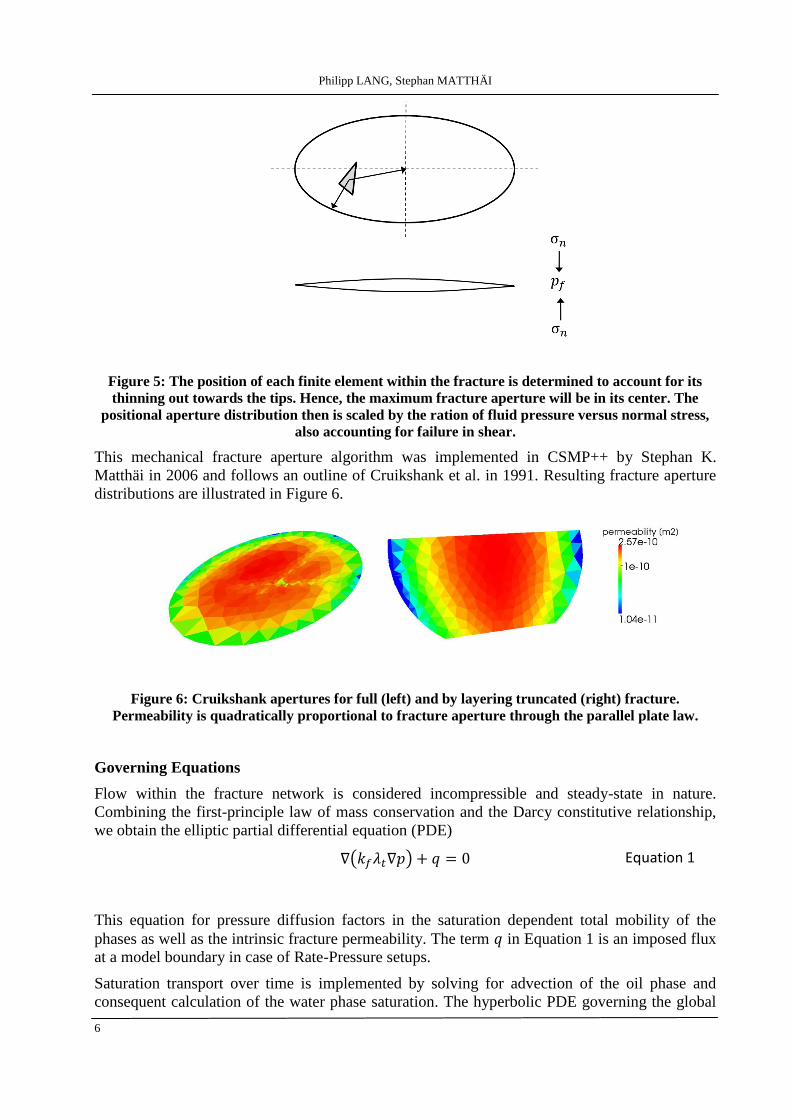
Mechanically Controlled Fracture Aperture
Fractures are represented through disc or truncated disc shapes. Fracture aperture is considered
as constant over individual elements, but vary over the extend of the fracture (Figure 6). Each
individual fracture is assigned an aperture distribution on its elements, depending on size, initial
internal fluid pressure and orientation/location with respect to the far field stress state. Once the
initial fluid pressure distribution has been established, the acting normal and shear stress for each
surface element is computed through tensor transformation (Figure 4).
Figure 4: Using the far field stress regime imposed onto the model, normal and shear stress is
computed for each fracture element by means of projection.
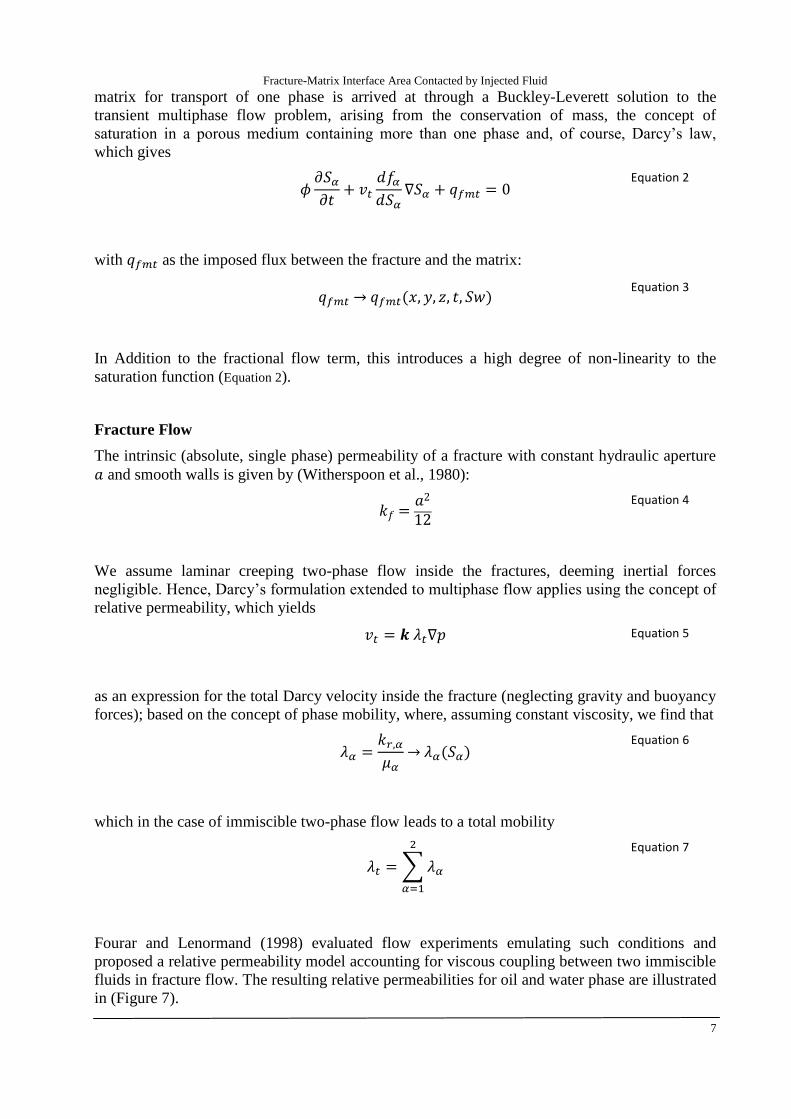
The distance of each element’s barycenter to the center of its parenting fracture and the shortest
distance to the boundary are computed. This allows to assign an aperture distribution as function
of the position within the fracture. This information and the ratio between normal and shear
stress acting against the fracture’s internal fluid pressure yields a resulting aperture for each
fracture element(Figure 5).
Philipp LANG, Stephan MATTHÄI
6
Figure 5: The position of each finite element within the fracture is determined to account for its
thinning out towards the tips. Hence, the maximum fracture aperture will be in its center. The
positional aperture distribution then is scaled by the ration of fluid pressure versus normal stress,
also accounting for failure in shear.
This mechanical fracture aperture algorithm was implemented in CSMP++ by Stephan K.
Matthäi in 2006 and follows an outline of Cruikshank et al. in 1991. Resulting fracture aperture
distributions are illustrated in Figure 6.
Figure 6: Cruikshank apertures for full (left) and by layering truncated (right) fracture.
Permeability is quadratically proportional to fracture aperture through the parallel plate law.
Governing Equations
Flow within the fracture network is considered incompressible and steady-state in nature.
Combining the first-principle law of mass conservation and the Darcy constitutive relationship,
we obtain the elliptic partial differential equation (PDE)
Equation 1
This equation for pressure diffusion factors in the saturation dependent total mobility of the
phases as well as the intrinsic fracture permeability. The term in Equation 1 is an imposed flux
at a model boundary in case of Rate-Pressure setups.
Saturation transport over time is implemented by solving for advection of the oil phase and
consequent calculation of the water phase saturation. The hyperbolic PDE governing the global
Fracture-Matrix Interface Area Contacted by Injected Fluid
7
matrix for transport of one phase is arrived at through a Buckley-Leverett solution to the
transient multiphase flow problem, arising from the conservation of mass, the concept of
saturation in a porous medium containing more than one phase and, of course, Darcy’s law,
which gives
Equation 2
with as the imposed flux between the fracture and the matrix:
Equation 3
In Addition to the fractional flow term, this introduces a high degree of non-linearity to the
saturation function (Equation 2).
Fracture Flow
The intrinsic (absolute, single phase) permeability of a fracture with constant hydraulic aperture
and smooth walls is given by (Witherspoon et al., 1980):
Equation 4
We assume laminar creeping two-phase flow inside the fractures, deeming inertial forces
negligible. Hence, Darcy’s formulation extended to multiphase flow applies using the concept of
relative permeability, which yields
Equation 5
as an expression for the total Darcy velocity inside the fracture (neglecting gravity and buoyancy
forces); based on the concept of phase mobility, where, assuming constant viscosity, we find that
Equation 6
which in the case of immiscible two-phase flow leads to a total mobility
Equation 7
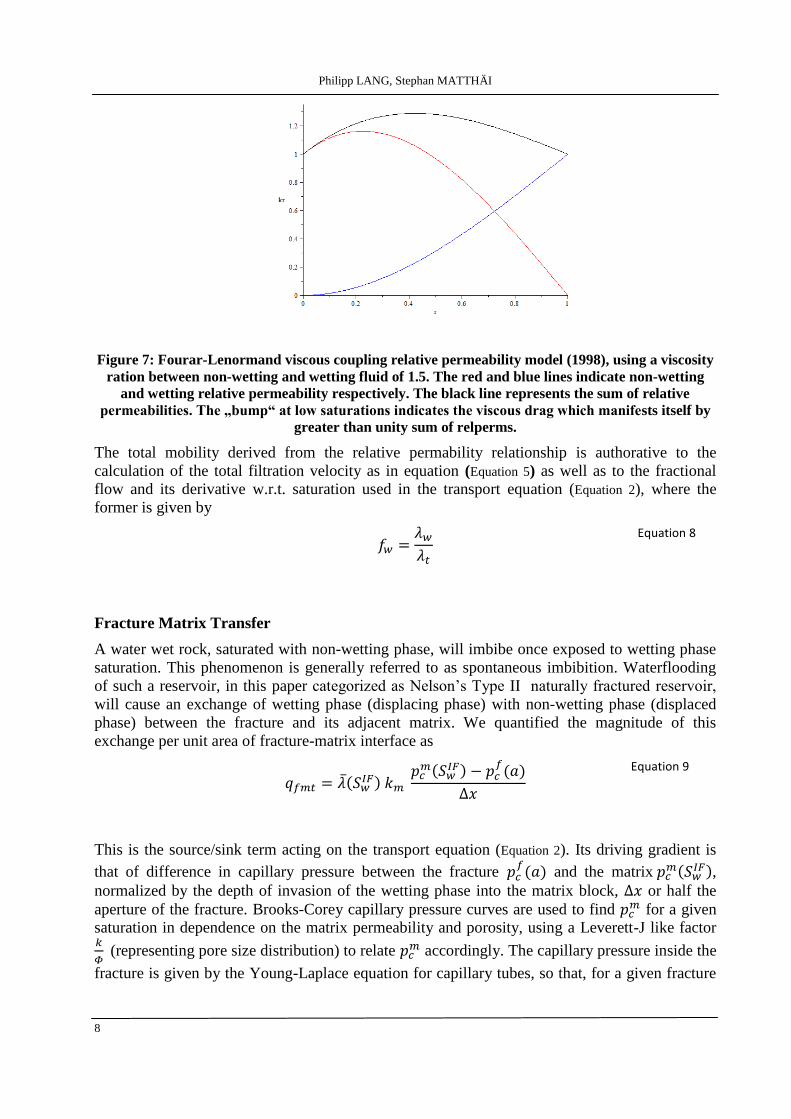
Fourar and Lenormand (1998) evaluated flow experiments emulating such conditions and
proposed a relative permeability model accounting for viscous coupling between two immiscible
fluids in fracture flow. The resulting relative permeabilities for oil and water phase are illustrated
in (Figure 7).
Philipp LANG, Stephan MATTHÄI
8
Figure 7: Fourar-Lenormand viscous coupling relative permeability model (1998), using a viscosity
ration between non-wetting and wetting fluid of 1.5. The red and blue lines indicate non-wetting
and wetting relative permeability respectively. The black line represents the sum of relative
permeabilities. The „bump“ at low saturations indicates the viscous drag which manifests itself by
greater than unity sum of relperms.
The total mobility derived from the relative permability relationship is authorative to the
calculation of the total filtration velocity as in equation (Equation 5) as well as to the fractional
flow and its derivative w.r.t. saturation used in the transport equation (Equation 2), where the
former is given by
Equation 8
Fracture Matrix Transfer
A water wet rock, saturated with non-wetting phase, will imbibe once exposed to wetting phase
saturation. This phenomenon is generally referred to as spontaneous imbibition. Waterflooding
of such a reservoir, in this paper categorized as Nelson’s Type II naturally fractured reservoir,
will cause an exchange of wetting phase (displacing phase) with non-wetting phase (displaced
phase) between the fracture and its adjacent matrix. We quantified the magnitude of this
exchange per unit area of fracture-matrix interface as
Equation 9
This is the source/sink term acting on the transport equation (Equation 2). Its driving gradient is
that of difference in capillary pressure between the fracture and the matrix
,
normalized by the depth of invasion of the wetting phase into the matrix block, or half the
aperture of the fracture. Brooks-Corey capillary pressure curves are used to find for a given
saturation in dependence on the matrix permeability and porosity, using a Leverett-J like factor
(representing pore size distribution) to relate
accordingly. The capillary pressure inside the
fracture is given by the Young-Laplace equation for capillary tubes, so that, for a given fracture
Fracture-Matrix Interface Area Contacted by Injected Fluid
9
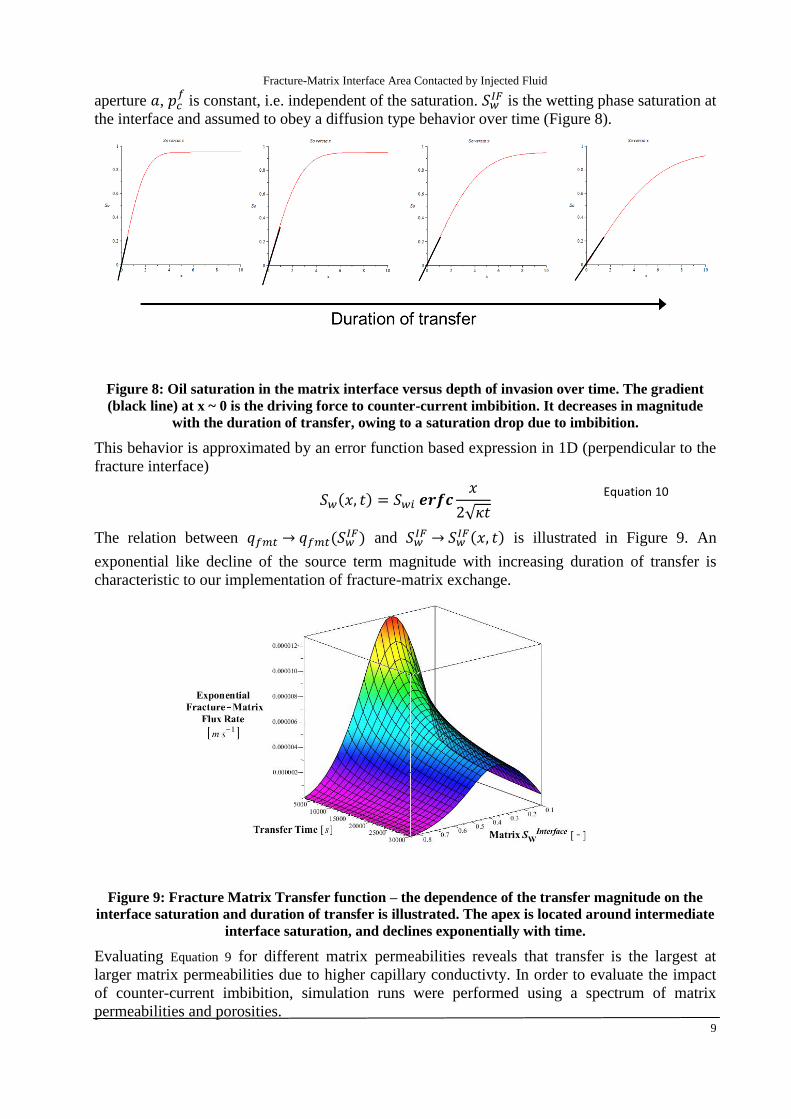
aperture , is constant, i.e. independent of the saturation.
is the wetting phase saturation at
the interface and assumed to obey a diffusion type behavior over time (Figure 8).
Figure 8: Oil saturation in the matrix interface versus depth of invasion over time. The gradient
(black line) at x ~ 0 is the driving force to counter-current imbibition. It decreases in magnitude
with the duration of transfer, owing to a saturation drop due to imbibition.
This behavior is approximated by an error function based expression in 1D (perpendicular to the
fracture interface)
Equation 10
The relation between and
is illustrated in Figure 9. An
exponential like decline of the source term magnitude with increasing duration of transfer is
characteristic to our implementation of fracture-matrix exchange.
Figure 9: Fracture Matrix Transfer function – the dependence of the transfer magnitude on the
interface saturation and duration of transfer is illustrated. The apex is located around intermediate
interface saturation, and declines exponentially with time.
Evaluating Equation 9 for different matrix permeabilities reveals that transfer is the largest at
larger matrix permeabilities due to higher capillary conductivty. In order to evaluate the impact
of counter-current imbibition, simulation runs were performed using a spectrum of matrix
permeabilities and porosities.
Philipp LANG, Stephan MATTHÄI
10
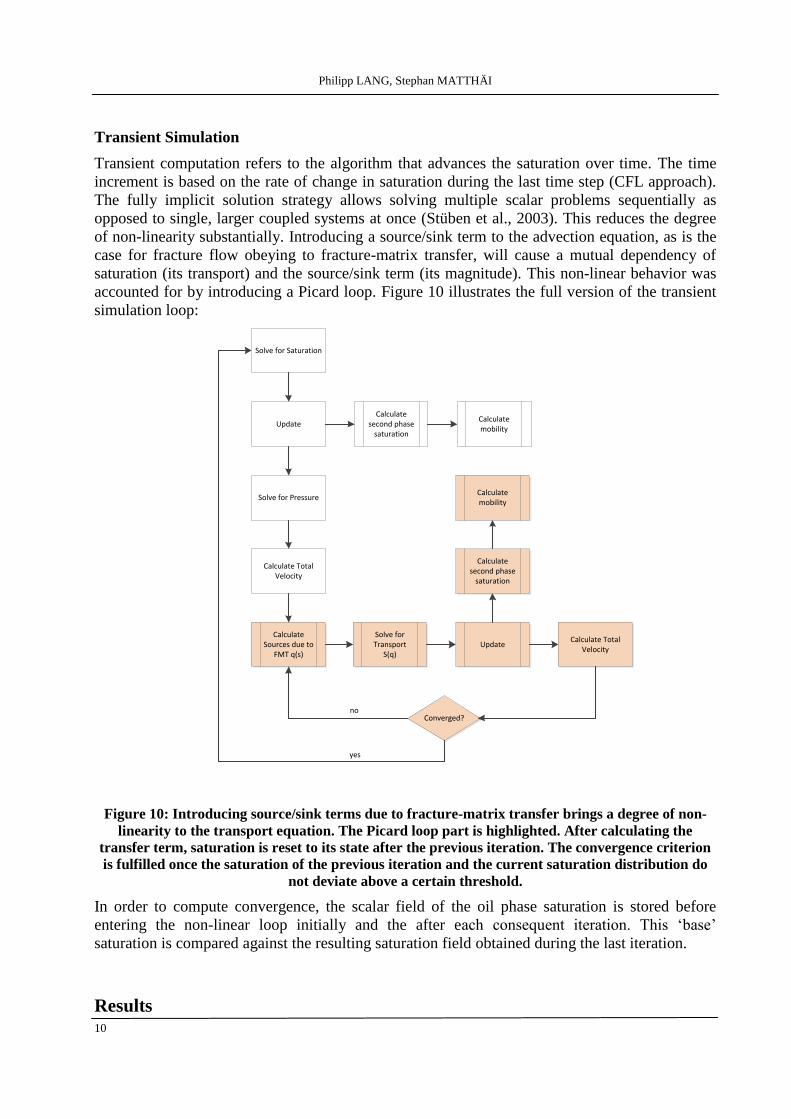
Transient Simulation
Transient computation refers to the algorithm that advances the saturation over time. The time
increment is based on the rate of change in saturation during the last time step (CFL approach).
The fully implicit solution strategy allows solving multiple scalar problems sequentially as
opposed to single, larger coupled systems at once (Stüben et al., 2003). This reduces the degree
of non-linearity substantially. Introducing a source/sink term to the advection equation, as is the
case for fracture flow obeying to fracture-matrix transfer, will cause a mutual dependency of
saturation (its transport) and the source/sink term (its magnitude). This non-linear behavior was
accounted for by introducing a Picard loop. Figure 10 illustrates the full version of the transient
simulation loop:
Solve for Pressure
Solve for Saturation
UpdateCalculate
second phase saturation
Calculate mobility
Calculate Total Velocity
Calculate Sources due to
FMT q(s)
Solve for Transport
S(q)Update
Calculate Total Velocity
Converged?no
yes
Calculate second phase
saturation
Calculate mobility
Figure 10: Introducing source/sink terms due to fracture-matrix transfer brings a degree of non-
linearity to the transport equation. The Picard loop part is highlighted. After calculating the
transfer term, saturation is reset to its state after the previous iteration. The convergence criterion
is fulfilled once the saturation of the previous iteration and the current saturation distribution do
not deviate above a certain threshold.
In order to compute convergence, the scalar field of the oil phase saturation is stored before
entering the non-linear loop initially and the after each consequent iteration. This ‘base’
saturation is compared against the resulting saturation field obtained during the last iteration.
Results
Fracture-Matrix Interface Area Contacted by Injected Fluid
11
Various simulation runs were performed using a variety of combinations of injection rates and
matrix properties (i.e. rock conductivity). In general, fracture-matrix transfer leads to a
retardation of the advancing front, counteracting the driving viscous gradient. The average
injected fluid saturation behind the displacing front is decreased. For small, poorly
interconnected fractures this may even cause the displacing fluid to stall and not further
penetrate. This causes flow to focus on multiple scales (Figure 11):
Towards the center of single joints on the fracture scale
On percolating fracture pathways consisting out of large, favorable oriented joints on the
reservoir scale
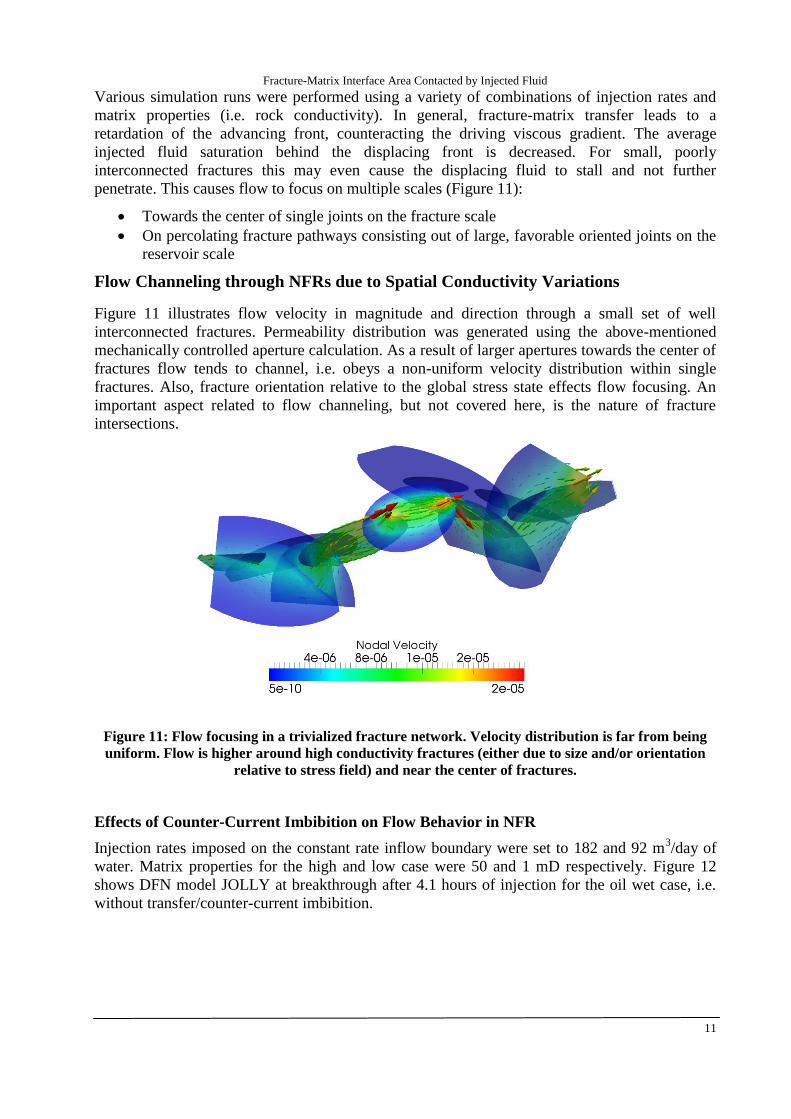
Flow Channeling through NFRs due to Spatial Conductivity Variations
Figure 11 illustrates flow velocity in magnitude and direction through a small set of well
interconnected fractures. Permeability distribution was generated using the above-mentioned
mechanically controlled aperture calculation. As a result of larger apertures towards the center of
fractures flow tends to channel, i.e. obeys a non-uniform velocity distribution within single
fractures. Also, fracture orientation relative to the global stress state effects flow focusing. An
important aspect related to flow channeling, but not covered here, is the nature of fracture
intersections.
Figure 11: Flow focusing in a trivialized fracture network. Velocity distribution is far from being
uniform. Flow is higher around high conductivity fractures (either due to size and/or orientation
relative to stress field) and near the center of fractures.
Effects of Counter-Current Imbibition on Flow Behavior in NFR
Injection rates imposed on the constant rate inflow boundary were set to 182 and 92 m3/day of
water. Matrix properties for the high and low case were 50 and 1 mD respectively. Figure 12
shows DFN model JOLLY at breakthrough after 4.1 hours of injection for the oil wet case, i.e.
without transfer/counter-current imbibition.
Philipp LANG, Stephan MATTHÄI
12
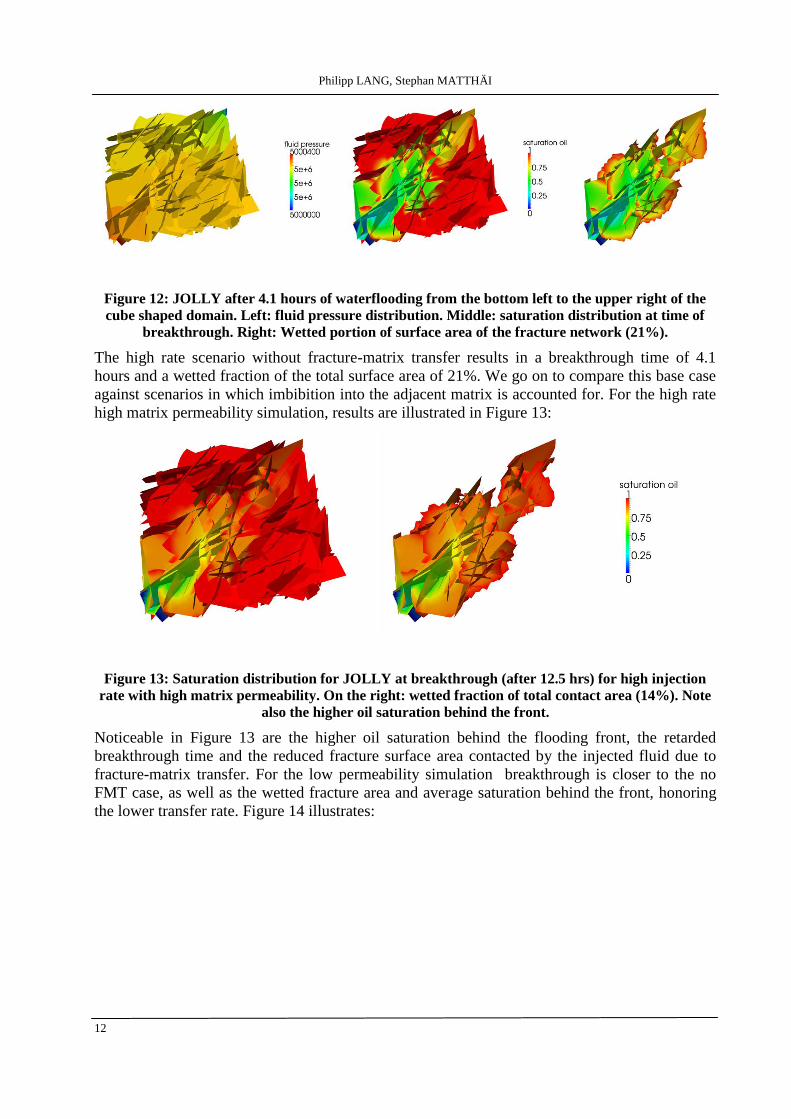
Figure 12: JOLLY after 4.1 hours of waterflooding from the bottom left to the upper right of the
cube shaped domain. Left: fluid pressure distribution. Middle: saturation distribution at time of
breakthrough. Right: Wetted portion of surface area of the fracture network (21%).
The high rate scenario without fracture-matrix transfer results in a breakthrough time of 4.1
hours and a wetted fraction of the total surface area of 21%. We go on to compare this base case
against scenarios in which imbibition into the adjacent matrix is accounted for. For the high rate
high matrix permeability simulation, results are illustrated in Figure 13:
Figure 13: Saturation distribution for JOLLY at breakthrough (after 12.5 hrs) for high injection
rate with high matrix permeability. On the right: wetted fraction of total contact area (14%). Note
also the higher oil saturation behind the front.
Noticeable in Figure 13 are the higher oil saturation behind the flooding front, the retarded
breakthrough time and the reduced fracture surface area contacted by the injected fluid due to
fracture-matrix transfer. For the low permeability simulation breakthrough is closer to the no
FMT case, as well as the wetted fracture area and average saturation behind the front, honoring
the lower transfer rate. Figure 14 illustrates:
Fracture-Matrix Interface Area Contacted by Injected Fluid
13
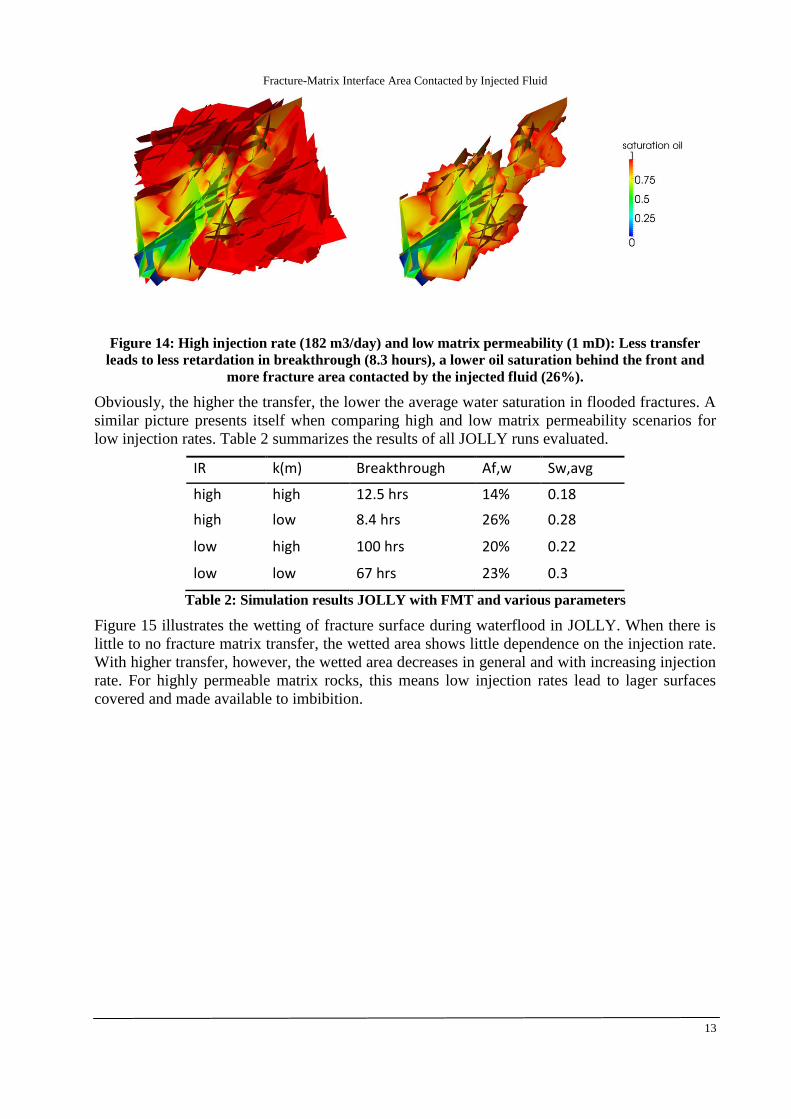
Figure 14: High injection rate (182 m3/day) and low matrix permeability (1 mD): Less transfer
leads to less retardation in breakthrough (8.3 hours), a lower oil saturation behind the front and
more fracture area contacted by the injected fluid (26%).
Obviously, the higher the transfer, the lower the average water saturation in flooded fractures. A
similar picture presents itself when comparing high and low matrix permeability scenarios for
low injection rates. Table 2 summarizes the results of all JOLLY runs evaluated.
IR k(m) Breakthrough Af,w Sw,avg
high high 12.5 hrs 14% 0.18
high low 8.4 hrs 26% 0.28
low high 100 hrs 20% 0.22
low low 67 hrs 23% 0.3
Table 2: Simulation results JOLLY with FMT and various parameters
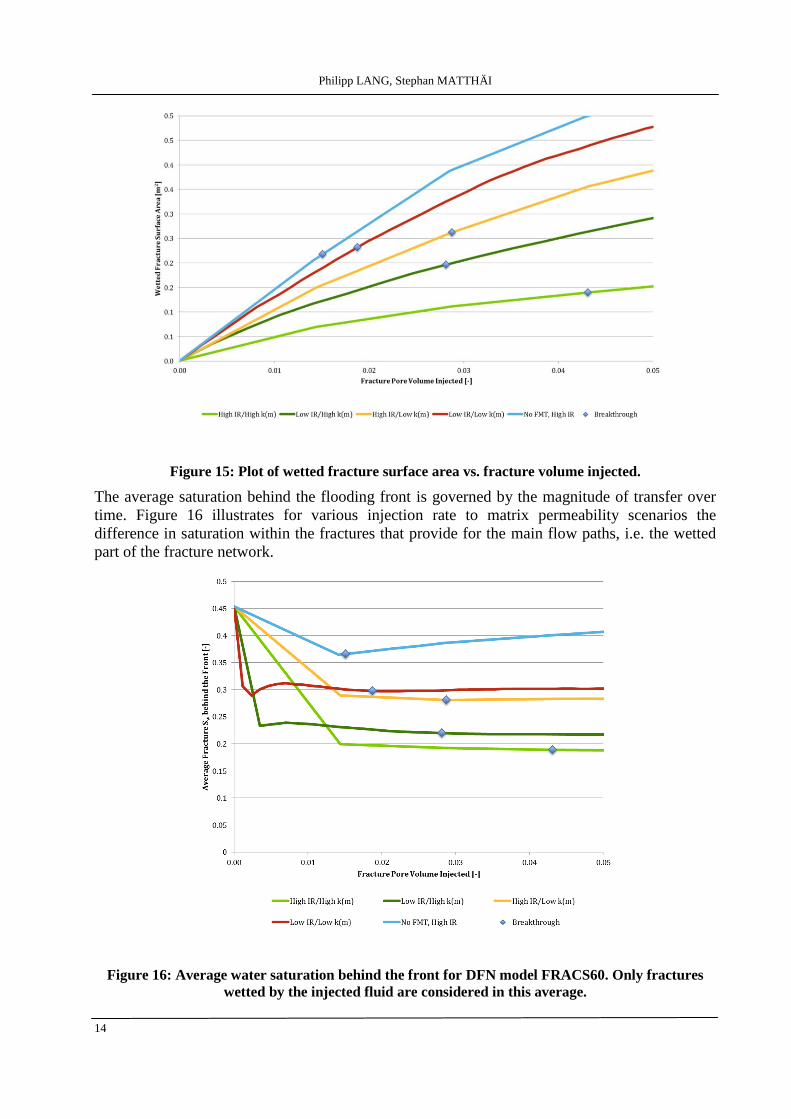
Figure 15 illustrates the wetting of fracture surface during waterflood in JOLLY. When there is
little to no fracture matrix transfer, the wetted area shows little dependence on the injection rate.
With higher transfer, however, the wetted area decreases in general and with increasing injection
rate. For highly permeable matrix rocks, this means low injection rates lead to lager surfaces
covered and made available to imbibition.
Philipp LANG, Stephan MATTHÄI
14
Figure 15: Plot of wetted fracture surface area vs. fracture volume injected.
The average saturation behind the flooding front is governed by the magnitude of transfer over
time. Figure 16 illustrates for various injection rate to matrix permeability scenarios the
difference in saturation within the fractures that provide for the main flow paths, i.e. the wetted
part of the fracture network.
Figure 16: Average water saturation behind the front for DFN model FRACS60. Only fractures
wetted by the injected fluid are considered in this average.
Fracture-Matrix Interface Area Contacted by Injected Fluid
15
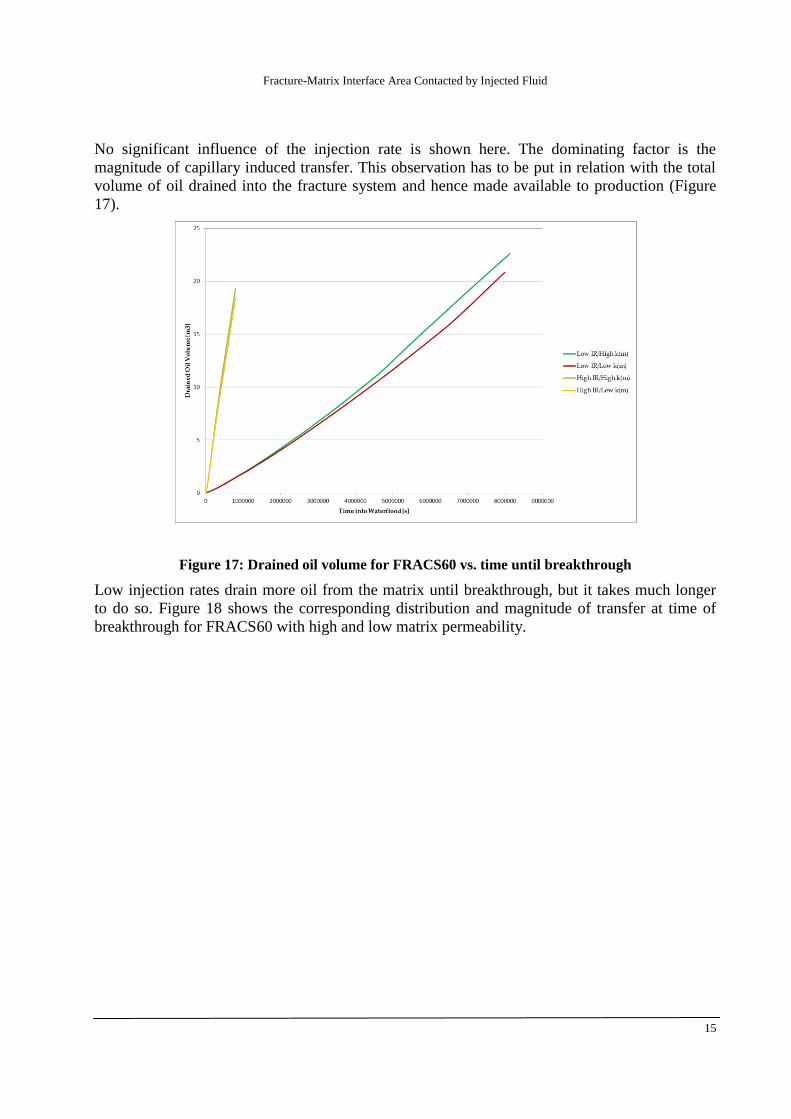
No significant influence of the injection rate is shown here. The dominating factor is the
magnitude of capillary induced transfer. This observation has to be put in relation with the total
volume of oil drained into the fracture system and hence made available to production (Figure
17).
Figure 17: Drained oil volume for FRACS60 vs. time until breakthrough
Low injection rates drain more oil from the matrix until breakthrough, but it takes much longer
to do so. Figure 18 shows the corresponding distribution and magnitude of transfer at time of
breakthrough for FRACS60 with high and low matrix permeability.
Philipp LANG, Stephan MATTHÄI
16
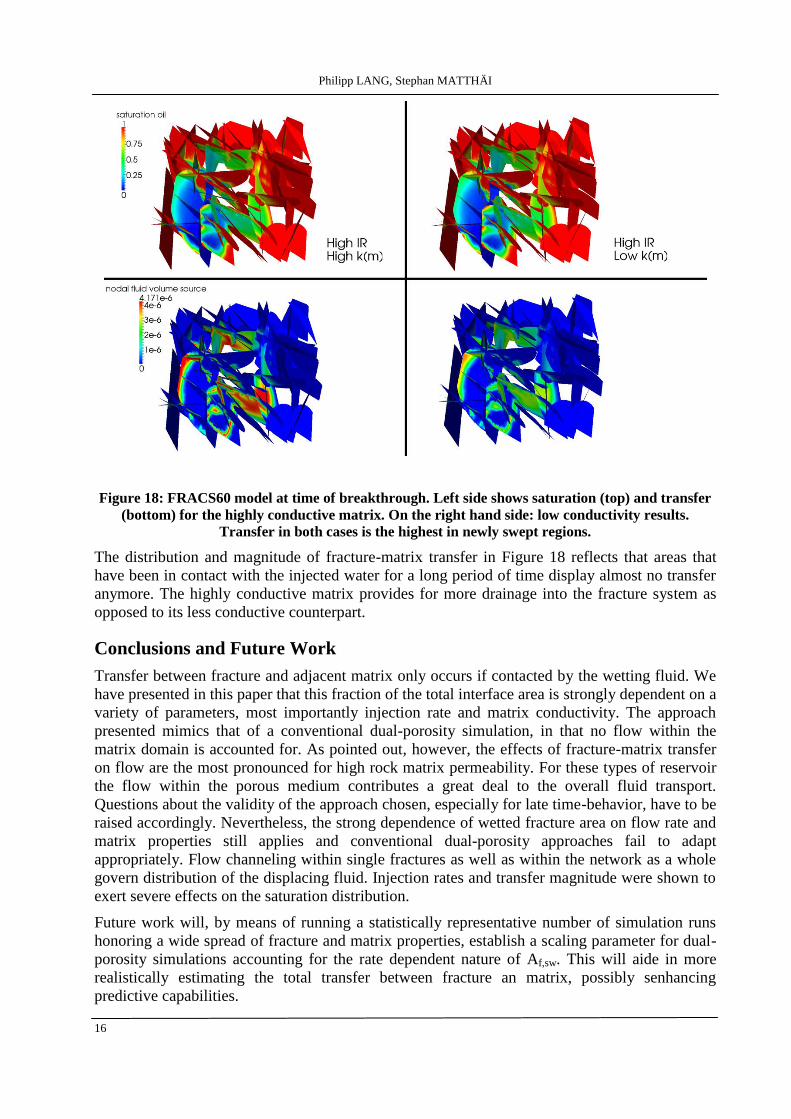
Figure 18: FRACS60 model at time of breakthrough. Left side shows saturation (top) and transfer
(bottom) for the highly conductive matrix. On the right hand side: low conductivity results.
Transfer in both cases is the highest in newly swept regions.
The distribution and magnitude of fracture-matrix transfer in Figure 18 reflects that areas that
have been in contact with the injected water for a long period of time display almost no transfer
anymore. The highly conductive matrix provides for more drainage into the fracture system as
opposed to its less conductive counterpart.
Conclusions and Future Work
Transfer between fracture and adjacent matrix only occurs if contacted by the wetting fluid. We
have presented in this paper that this fraction of the total interface area is strongly dependent on a
variety of parameters, most importantly injection rate and matrix conductivity. The approach
presented mimics that of a conventional dual-porosity simulation, in that no flow within the
matrix domain is accounted for. As pointed out, however, the effects of fracture-matrix transfer
on flow are the most pronounced for high rock matrix permeability. For these types of reservoir
the flow within the porous medium contributes a great deal to the overall fluid transport.
Questions about the validity of the approach chosen, especially for late time-behavior, have to be
raised accordingly. Nevertheless, the strong dependence of wetted fracture area on flow rate and
matrix properties still applies and conventional dual-porosity approaches fail to adapt
appropriately. Flow channeling within single fractures as well as within the network as a whole
govern distribution of the displacing fluid. Injection rates and transfer magnitude were shown to
exert severe effects on the saturation distribution.
Future work will, by means of running a statistically representative number of simulation runs
honoring a wide spread of fracture and matrix properties, establish a scaling parameter for dual-
porosity simulations accounting for the rate dependent nature of Af,sw. This will aide in more
realistically estimating the total transfer between fracture an matrix, possibly senhancing
predictive capabilities.
Fracture-Matrix Interface Area Contacted by Injected Fluid
17
References
Warren, J.E. and Root, P.J.: (1963), The Behavior of Naturally Fractured Reservoirs. Soc. Pet. Eng. J., 245-44; TY-ans., AIME, 228.
Kazemi, H., Merrill, L., Porterfield, K. and Zeman, P. (1976), Numerical Simulation of Water-Oil Flow in Naturally Fractured Reservoirs. Soc. Pet. Eng. J. , 317-26; Trans., AIME, 261. Nelson, R.A. (1982), An Approach to Evaluating Fractured Reservoirs. Journal of Petroleum Technology, 34(9), 2167-2170. Cruikshank, K. M., Zhao, G., & Johnson, A. M. (1991). “Analysis of minor fractures asso-ciated with joints and faulted joints. Journal of Structural Geology, 13(8), 865–886. Elsevier. Bonnet, E., O. Bour, N. E. Odling, P. Davy, I. Main, P. Cowie, and B. Berkowitz. 2001. “Scal-ing of Fracture Systems in Geological Media.” Reviews of Geophysics 39 (3): 347-383. Geiger, S., Matthäi, S. K., Roberts, S., & Zoppou, C. (2003). Combining finite volume and finite element methods to simulate fluid flow in geologic media. ANZIAM Journal, 44(April), 180-201. Stüben, K.; Delaney, P.; Chmakov, S. (2003): Algebraic Multigrid (AMG) for Ground Water Flow and Oil Reservoir Simulation. Proceedings of the Conference “MODFLOW and More 2003: Understanding through Modeling”, International Ground Water Modeling Center (IGWMC), Colorado School of Mines. Golden, Colorado, Sept 17-19, 2003. Paluszny, A., Matthäi, S. K., & Hohmeyer, M. (2007). Hybrid finite element-finite volume discretization of complex geologic structures and a new simulation workflow demonstrated on fractured rocks. Geofluids, 7(2), 186-208. Z.N. Flynn, R.J. Pine (2007): Fracture Characterisation Determined By Numerical Modelling Analyses, Proceedings of 11th ISRM Congress, July 9 - 13, 2007 , Lisbon, Portugal Matthäi, S. K., Nick, H. M., Pain, C., & Neuweiler, I. (2009). Simulation of Solute Transport Through Fractured Rock: A Higher-Order Accurate Finite-Element Finite-Volume Method Permitting Large Time Steps. Transport in Porous Media. Unsal, E., Matthäi, S. K., & Blunt, M. J. (2009). Simulation of multiphase flow in fractured reservoirs using a fracture-only model with transfer functions. Computers & Geosciences.