tactile illusory movement: effects of spatio-temporal ... · tactile illusory movement: effects of...
TRANSCRIPT
Tactile illusory movement: Effects of spatio-temporal stimulus
characteristics on the integrative processing of saltatory and successively
activated stimulus patterns
Inauguraldissertation
zur Erlangung des akademischen Grades eines
Doktors der Sozialwissenschaften
der Universität Mannheim
vorgelegt von
Dipl.-Psych. Anja Schwab

Fakultät für Sozialwissenschaften der Universität Mannheim
Dekan: Prof. Dr. Josef Brüderl
Referent: Prof. Dr. Rupert Hölzl
Koreferent: Prof. Dr. Roger Cholewiak
Tag der Disputation: 18.07.2008
Preface
I
Preface
This dissertation emerged at the Spatial Orientation Systems Department at the Navel
Aerospace Medical Research Laboratory (NAMRL), located at Navel Air Station in
Pensacola, Florida, USA. Here, vibrotactile interfaces like the Tactile Situation Awareness
System (TSAS) are developed and evaluated. Based on vibrotactile cues, TSAS provides
information about an aircraft’s attitude or threat to the pilot, and thus maintains an operator’s
situational awareness. As a member of the German Scientist Exchange Program of the
German Armed Forces, I worked as a Research Assistant at NAMRL and was able to collect
data for my thesis. Angus H. Rupert, Captain in the US Navy Medical Service Corps, and
Head of the Spatial Orientation Systems Department and Roger W. Cholewiak, Ph.D.,
Director of the Cutaneous Communication Laboratory at Princeton University supervised the
experiments at NAMRL and at Princeton. The experiments were supported by ONR Grant No
#N0001401WX20204 to NAMRL and the Intergovernmental Personnel Agreement
N6645200MD00012 to Princeton University and were approved by the Committee for the
Protection of Human subjects.
In order to generate percepts of movement, two tactile illusions were examined:
Successive activation to produce a phi-like motion and saltation. Tactile movement can be
used for example as a directional vector in tactile displays.
But the experiments were not only conducted for practical purposes, sensory illusions are
of particular interest as they expand our knowledge of human perception in that they help to
clarify disparities between physical stimuli and the psychophysiologically measured
sensations they evoke. Thus, the tactile illusions used in our experiment may aid in studying
the integration of spatio-temporal stimuli into percepts of continuous motion.
At the University of Mannheim, the saltatory phenomenon is used to asses dynamic
changes in somatosensory maps due to spatio-temporal repetitive stimulation. The results of
these studies are discussed in connection with the investigation of chronic pain and other
disorders possibly related to deranged “body maps”. Professor Rupert Hölzl, Professor for
Clinical Psychology and director of the Otto Selz Institute and the dedicated Laboratory of
Clinical Psychophysiology agreed to supervise my dissertation at the University of
Mannheim.
Part of this thesis has been published: The study to determine vibrotactile thresholds on
the torso was published in Perception & Psychophysics 2004, a summary of the results of
Preface
II
Experiment 2 was presented as poster at the Psychonomic Society Meeting, Vancouver,
Canada, in 2003.
I would like to thank all colleagues at the University of Mannheim and NAMRL, who
supported my work: First of all Prof. Rupert Hölzl and Prof. Roger W. Cholewiak, for their
patience, their ongoing encouragement, and the technical and scientific steering of my thesis.
Also CAPT USN Angus Rupert, who made this research project possible at his department.
Kristy Beede, not only assisted me in recruiting and testing subjects, she also became a friend
outside the Research Laboratory. I would also like to thank the whole NAMRL staff and
CAPT MC USN Anderson, Commanding Officer at NAMRL, who were very supportive and
made my stay in Pensacola an interesting and very pleasant one. Sincere thanks are given to
my subjects, who participated in my studies.
Dr. Annette Stolle, who also studied saltation at the University of Mannheim was a
valuable dialog partner, and I would like to thank her for the time she spend with me,
discussing the contents of my thesis. Additionally I would like to thank Dr. Dieter Kleinböhl
and Dr. Andreas Möltner for their helpful statistical advice and Dipl.-Psych. Jörg Trojan for
his helpful suggestions, as well as the Laboratory Stuff for their administrative support.
Last, but not least, I want to thank my husband, who was always understandingly,
encouraged me and provided any practical and emotional support, he could.
Augsburg, January 08
Anja Schwab
Abstract - Zusammenfassung
III
Abstract
Saltation and apparent movement are related phenomena: Both generate illusory stimuli in-
between the actually activated stimulus sites. This dissertation examines spatio-temporal
stimulus parameters where both phenomena create equivalent percepts. In these cases it is
assumed that cortical representations adapt identically to the properties of both stimulus
patterns – saltation and apparent movement. Furthermore it is tested whether repetitive
stimulation results in plastic changes of the cortical map and related perceptual changes.
Another focus lies on the integration of the stimulus patterns over both body halves. We used
varying numbers of vibrotactile point stimuli that were presented on a horizontal array around
the trunk.
In two pilot studies and three main studies with a total of 139 subjects we reached the
following conclusions: In accordance with neural network models stimuli presented close
together in time are expected to belong together. Therefore both stimulus patterns generate
indistinguishable percepts at short interstimulus intervals (<100 ms); the same applies for
short stimulus durations (<50 ms). Increasing the number of tactors – and thus decreasing
inter-tactor distance – tends to improve the integration of both stimulus patterns into a percept
of continuous movement. Vibration frequency affects the quality of illusory movement as
well as the similarity of both patterns. Further studies exploring the spatial resolution of low-
and high-frequency vibrotactile stimulus patterns on hairy skin are needed to clearly explain
this result. An effect of repetitive stimulation on the comparability of both stimulus patterns
could not be found – presumably because plastic changes in the cortical map of body sites like
the trunk – which are less innervated and rarely used to explore the environment compared to
the fingers – might require more stimulus repetitions. Crossing the body midline impairs
comparability of both stimulus patterns, however in the majority of cases saltation and
apparent movement generate indiscriminable percepts when presented unilaterally or
bilaterally indicating that integration of spatio-temporal stimuli occurred over the body
midline – yet interstimulus intervals might differ due to interhemispheric transmission time.
The results of this dissertation shed further light on the processing of spatio-temporal stimuli
and might also be used in the design of tactile torso displays.
Abstract - Zusammenfassung
IV
Zusammenfassung
Saltation und takile Scheinbewegung sind verwandte Phänomene, da beide illusorische Reize
zwischen physikalischen Reizpunkten generieren. Diese Dissertation untersucht die
Ausprägungen der spatio-temporalen Reizmerkmale, bei denen beide Phänomene als
identisch wahrgenommen werden. In diesen Fällen wird eine identische Anpassung der
zerebralen Repräsentation an die beiden taktilen Reizmuster - Saltation und Scheinbewegung
- angenommen. Darüber hinaus wird getestet ob eine wiederholte Reizdarbietung eine
Veränderung der kortikalen Karte und damit perzeptiver Korrelate nach sich zieht. Die
Integration der Reizmuster über beide Körperhälften ist ein weiterer Fokus dieser Arbeit.
Stimuli waren punktuelle Vibrationsreize, die in unterschiedlicher Anzahl auf einer horizontal
um den Rumpf verlaufenden Stimulus-Matrix vorgegeben wurden.
In zwei Pilot- und drei Hauptstudien mit insgesamt 139 Versuchspersonen wurden folgende
Ergebnisse erhoben: Im Einklang mit neuronalen Netzwerk-Modellen werden Stimuli, die in
engem zeitlichen Abstand präsentiert werden als zusammenhängend wahrgenommen, beide
taktilen Reizmuster generieren daher nicht unterscheidbare Perzepte bei kurzen Interstimulus-
Intervallen (<100ms); gleiches gilt für eine kurze Stimulusdauer (<50ms). Eine Erhöhung der
Anzahl der Reizgeber – und damit eine Verkürzung der Reizdistanz - verbessert tendenziell
ebenfalls die Integration der beiden Reizmuster zu einer glatten Scheinbewegung. Die
Vibrationsfrequenz beeinflusst die Qualität der Scheinbewegung und damit auch die
Vergleichbarkeit der Reizmuster. Weitere Studien zur räumlichen Auflösung hoch- und
niedrigfrequenter taktiler Reizmuster auf haariger Haut sind nötig, um dieses Ergebnis
eindeutig erklären zu können. Ein Effekt repetitiver Stimulation auf die Vergleichbarkeit der
Reizmuster konnte nicht nachgewiesen werden – vermutlich weil plastische Veränderungen
der kortikalen Karte bei Körperregionen wie dem Rumpf – die weniger sensibel innerviert
und seltener im täglichen Gebrauch genutzt werden wie z.B. Finger - mehrere
Reizwiederholungen erfordern. Das Überqueren der Köpermitte beeinträchtigt zwar die
Vergleichbarkeit der Reizmuster, jedoch generieren Saltation und Scheinbewegung sowohl
bei unilateraler wie bei bilateraler Darbietung überzufällig oft identische Perzepte, so dass von
einer Integration spatio-temporaler Reizmuster auch über die Körpermitte hinweg
ausgegangen werden kann – evtl. jedoch bei unterschiedlichen Interstimulus-Intervallen
aufgrund der interhemisphärischen Übertragungszeit bei bilateralen Reizen.
Die Ergebnisse dieser Dissertation leisten einen Beitrag zur Erklärung der Verarbeitung von
spatio-temporalen Reizmustern und tragen auch zur Entwicklung taktiler Displays bei.

Contents
V
Contents
Preface .............................................................................................................................. I
Abstract – Zusammenfassung ..................................................................................... III
Contents........................................................................................................................... V
Index of Tables ............................................................................................................. XI
Index of Figures ......................................................................................................... XIII
Index of Abbreviations...............................................................................................XVI
1 Importance of spatio-temporal illusions ...........................................................1
2 Perception of vibratory stimuli ..........................................................................5
2.1 Cutaneous mechanoreceptors....................................................................5
2.2 Spatio-temporal variables affecting vibration perception .........................7
2.3 Processing of tactile stimuli and dynamic adaptation of somatosensory
cortex to spatio-temporal characteristics of tactile stimulation...............10
3 Tactile illusions: Saltation and apparent movement.........................................15
3.1 Saltation...................................................................................................15
3.1.1 Spatio-temporal characteristics of cutaneous saltation ...........................16
3.1.2 Explanatory approaches for the saltatory phenomenon ..........................23
3.1.3 Saltation in other senses ..........................................................................24
3.2 Apparent movement ................................................................................28
3.2.1 Spatio-temporal characteristics of tactile apparent movement ...............28
3.2.2 Explanation approaches for tactile apparent movement .........................34

Contents
VI
3.2.3 Apparent movement in other senses........................................................36
3.3 Differences between saltation and apparent motion ...............................40
3.4 Similarities between saltation and apparent motion................................41
4 Content of the dissertation ..................................................................................43
5 Aim of the study and hypothesis .........................................................................45
6 General methods...................................................................................................59
6.1 Subjects ...................................................................................................59
6.2 Apparatus ................................................................................................59
6.3 Vibrotactile stimuli..................................................................................63
6.4 Experimental procedure ..........................................................................66
6.5 Overview of experimental designs..........................................................68
6.5.1 Independent variables..............................................................................68
6.5.2 Dependent variables ................................................................................70
6.6 Measures..................................................................................................71
6.7 Statistical analysis ...................................................................................72
7 Calibration Study: Determination of vibrotactile thresholds on the torso .....74
7.1 Subjects ...................................................................................................74
7.2 Apparatus ................................................................................................75
7.3 Tactile stimuli..........................................................................................76
7.4 Procedure.................................................................................................77
7.5 Results and discussion.............................................................................80
8 Pilot Study 1: Identification of the direction of tactile movement around
the torso.................................................................................................................85
8.1 Subjects ...................................................................................................86
8.2 Tactile stimuli..........................................................................................87
Contents
VII
8.3 Apparatus ................................................................................................88
8.4 Procedure.................................................................................................88
8.5 Results .....................................................................................................89
8.6 Discussion ...............................................................................................91
9 Pilot Study 2: Limits of spatio-temporal integration dependent on the
number of stimuli delivered to a stimulus location in the saltatory
paradigm ...............................................................................................................93
9.1 Subjects ...................................................................................................96
9.2 Tactile stimuli..........................................................................................96
9.3 Apparatus ................................................................................................98
9.4 Procedure.................................................................................................99
9.5 Results ...................................................................................................100
9.6 Discussion .............................................................................................107
10 Experiment 1: Integration of different spatio-temporal stimulus patterns
into a percept of continuous motion measured by quality judgments ..........112
10.1 Method ..................................................................................................113
10.2 Results ...................................................................................................116
10.2.1 Temporal effects....................................................................................116
10.2.2. Effect of vibration frequency ................................................................141
10.2.3 Spatial effects ........................................................................................142
10.3 Summary and discussion.......................................................................147
11 Experiment 2: Discrimination between successively activated and
saltatory stimulus patterns ................................................................................153
11.1 Method ..................................................................................................155
11.2 Results (“same-different”).....................................................................157
11.2.1 Temporal effects....................................................................................159
11.2.2 Spatial effect..........................................................................................163
11.2.3 Effect of frequency................................................................................164

Contents
VIII
11.2.4 Effect of repetitive stimulation..............................................................166
11.3 Results (“Which is best”) ................................................................................167
11.3.1 Temporal effects....................................................................................169
11.3.2 Spatial effect..........................................................................................172
11.3.3 Effect of frequency................................................................................173
11.3.4 Effect of repetitive stimulation..............................................................173
11.4 Summary and discussion.......................................................................174
12 Experiment 3: Different stimulus onset locations and their effects on
tactile movement crossing the body midline ....................................................179
12.1 Method ..................................................................................................180
12.2 Results ...................................................................................................184
12.2.1 Effect of position of the 7-tactor array ..................................................184
12.2.2 Temporal effects....................................................................................191
12.3 Summary and discussion.......................................................................206
13 General summary and discussion .....................................................................210
References ....................................................................................................................221
Annex
A Voluntary Consent Form...................................................................................240
B Medical Questionnaire ......................................................................................242
C Quality Descriptions..........................................................................................245
D Experimenter Script Pilot Study 1: Identification of the direction of tactile
movement around the torso ...............................................................................249
Contents
IX
E Experimenter Script Pilot Study 2: Limits of spatio-temporal integration
dependent on the number of stimuli delivered to a stimulus location in the
saltatory paradigm .............................................................................................251
F Experimenter Script Experiment 1: Integration of different spatio-temporal
stimulus patterns into a percept of continuous motion measured by
quality judgments ..............................................................................................254
G Experiment 1: Median ratings for the different levels of SD dependent
on ISI .................................................................................................................257
H Experiment 1: Effect of frequency on qualitative judgments ...........................273
I Experimenter Script Experiment 2: Discrimination between successively
activated and saltatory stimulus patterns; Part 1: “same/different”
discrimination ...................................................................................................275
K Experimenter Script Experiment 2: Discrimination between successively
activated and saltatory stimulus patterns; Part 2: “Which is best”....................277
L Experiment 2: Effect of SD on subjects’ discrimination performance .............280
M Experiment 2: Effect of ISI on subjects’ discrimination performance..............282
N Experiment 2 – Part 2 (Which is best): Subjects’ preference for one stimulus
pattern................................................................................................................284
O Experiment 2 – Part 2 (Which is best): Effect of SD on subjects’ preference
for one stimulus pattern.....................................................................................286
P Experiment 2 – Part 2 (Which is best): Effect of ISI on subjects’ preference
for one stimulus pattern.....................................................................................288
Q Experimenter Script Experiment 3: Same/different discriminations
with 7-tactor arrays on different positions ........................................................290
Contents
X
R Experiment 3: Effect of SD on subjects’ discrimination performance
depending on different placements of a 7-tactor array on the torso..................292
S Experiment 3: Effect of ISI on subjects’ discrimination performance
depending on different placements of a 7-tactor array on the torso..................299
Affirmation ...............................................................................................................306
Index of Tables
XI
Index of Tables
7.1: Calibration Study: Results (χ2-values) of the Friedman Test to evaluate if
there are similar vibrotactile thresholds for each body site tested ......................82
9.1: Pilot Study 2: Results of the χ2-tests to evaluate if subjects’ preferences
were randomly distributed over the two different stimulus patterns
(saltatory versus ssuccessively activated patterns)............................................101
9.2: Pilot Study 2: Percentage of trials (accumulated over subjects) where the
successively activated patterns were preferred, dependent on the saltation
mode which was presented in the first block in the forced-choice paradigm
and subdivided into different saltation modes...................................................103
9.3: Pilot Study 2: Results of the χ2-tests to evaluate if subjects’ preferences
for successively activated stimulus patterns were equally distributed over
the seven levels of ISI .......................................................................................105
9.4: Pilot Study 2: Results of the χ2-tests to evaluate if subjects’ preferences
for successively activated stimulus patterns were equally distributed over
the seven levels of SD .......................................................................................107
10.1: Experiment 1: Results of trend test of Page for effects of ISI...........................121
10.2: Experiment 1: Results of trend test of Page for effects of SD ..........................129
10.3: Experiment 1: Results of trend test of Page for effects of duration of
movement on the ratings of straightness of movement .....................................136
10.4: Experiment 1: Results of trend test of Page for effects of duration of
movement on the ratings of perceived length of movement .............................139
10.5: Experiment 1: Conditions for the incidence of a perceived overshoot of
of length.............................................................................................................140
10.6: Experiment 1: Results of the U-test which tested if vibration frequency
(80 or 250 Hz) affects the quality ratings..........................................................141
10.7: Experiment 1: Results of the Test of Marginal Homogeneity which tested
if the number of tactors on the array and therefore the inter-tactor distance
affects the quality ratings...................................................................................143
10.8: Experiment 1: Results of the Test of Marginal Homogeneity which tested if
stimulus width affects subjects’ judgments.......................................................144
Index of Tables
XII
11.1: Experiment 2: Percentage of answers “patterns are the same” or “patterns are
different” over all subjects and trials.................................................................158
11.2: Experiment 2: Effect of stimulus width on discriminability tested with
McNemar χ2-tests ..............................................................................................164
11.3: Experiment 2: Effect of stimulus repetition on discriminability tested with
McNemar χ2-tests ..............................................................................................167
12.1: Experiment 3: Frequency of correct and incorrect answers dependent on the
position of the array...........................................................................................187
12.2: Experiment 3: Subjects’ “same” answers to same and different patterns
dependent on the position of the 7-tactor-array.................................................189
Index of Figures
XIII
Index of Figures
2.1: Vibration thresholds on the thenar eminence as a function of vibration
frequency ...............................................................................................................6
2.2: Vibratory thresholds on a number of body sites measured
by Wilska (1954)...................................................................................................9
3.1: Stimulus locations in the experiments of Eimer et al. (2005) .............................18
3.2: Fractionation data for the “reduced rabbit” with variation of the stimulus
frequency of P3 ...................................................................................................21
3.3: ISOI values for optimal apparent movement in the visual, tactual and
auditory modalities as a function of SD..............................................................37
6.1: Vibrotactile stimulator: C2-tactor .......................................................................60
6.2: Vibrotactile array: “Sweat-belt” with three rows of 12 tactors each...................62
6.3: Response device: Ten-button-keyboard ..............................................................62
6.4: Schematic representation of a successively activated stimulus pattern
consisting of 8 tactors..........................................................................................65
6.5: Schematic representation of a saltatory stimulus pattern consisting of
8 tactors ...............................................................................................................66
6.6: Overview over the independent variables and their variations ...........................70
7.1: Calibration Study: Bruel & Kjaer 4810 minishaker used as stimulator in
this study .............................................................................................................76
7.2: Calibration Study: Positioning of the contactor ..................................................78
7.3: Calibration Study: Vibrotactile thresholds for six different body sites
on the abdomen and six different frequencies.....................................................81
7.4: Calibration Study: Comparison of thresholds of three body sites
(finger, thenar, and abdomen) ............................................................................83
8.1: Pilot Study 1: Distribution of discrimination errors at different SD/ISI
combinations and stimulus patterns ....................................................................90
Index of Figures
XIV
9.1: Pilot Study 2: Visual representation of the different vibrotactile
spatiotemporal patterns .......................................................................................97
9.2: Pilot Study 2: Subjects’ preference (in percent of trials) for the successively
presented stimulus patterns dependent on the saltation mode for each
subject................................................................................................................102
9.3: Pilot Study 2: Preference for one stimulus pattern dependent on the saltatory
mode within a paired-comparison trial and the ISI level ..................................104
9.4: Pilot Study 2: Preference for one stimulus pattern dependent on the saltatory
mode within a paired-comparison trial and the SD level ..................................106
10.1: Experiment 1: The effect of ISI on the quality ratings for straightness ............117
10.2: Experiment 1: The effect of ISI on the quality ratings for smoothness ............118
10.3: Experiment 1: The effect of ISI on the quality ratings for spatial distribution .119
10.4: Experiment 1: The effect of ISI on the quality ratings for length .....................120
10.5: Experiment 1: The effect of SD on the quality ratings for straightness............125
10.6: Experiment 1: The effect of SD on the quality ratings for smoothness ............126
10.7: Experiment 1: The effect of SD on the quality ratings for spatial distribution.127
10.8: Experiment 1: The effect of SD on the quality ratings for length.....................128
10.9: Experiment 1: The scattergrams plot the medians of the ratings of straightness
dependent on the duration of movement for the two stimulus patterns, the
different numbers of tactors on the array, and the two vibration frequencies...133
10.10: Experiment 1: The scattergrams plot the medians of the ratings of the
perceived length of movement dependent on the duration of movement for
the two stimulus patterns, the different numbers of tactors on the array, and
the two vibration frequencies ............................................................................137
11.1: Experiment 2: Percentage of “same” judgments for the different stimulus
pairs and vibration frequencies..........................................................................159
11.2: Experiment 2: Effect of SD on subjects’ ability to discriminate patterns
of either the same generation mode or different generation modes correctly ...160
11.3 : Experiment 2: Effect of ISI on subjects’ ability to discriminate patterns
of either the same generation mode or different generation modes correctly ...162
11.4: Experiment 2: Percent “same” answers for same and different pairs
dependent on stimulus width and vibration frequency......................................163
Index of Figures
XV
11.5: Experiment 2: Percent “same” answers for same and different pairs
dependent on vibration frequency .....................................................................165
11.6: Experiment 2: Comparison for “same” answers for identical blocks of trials,
separated for same and different pairs and vibration frequencies .....................166
11.7: Experiment 2: Preference in percent for the successively or saltatory stimulus
pattern, when both patterns are presented in one trial and subjects have
to decide “which is best” ...................................................................................168
11.8: Experiment 2: Effect of SD on subjects’ preference for either successively
activated or saltatory stimulus patterns .............................................................169
11.9: Experiment 2: Effect of ISI on subjects’ preference for either successively
activated or saltatory stimulus patterns .............................................................171
11.10: Experiment 2: Percent preference for one stimulus pattern (saltatory or
successively activated) dependent on stimulus width and vibration frequency 173
11.11: Experiment 2: Comparison of the preferences for one stimulus pattern for
identical blocks of trials, separated for vibration frequencies...........................174
12.1: Experiment 3: Tactor sites for the span navel condition...................................182
12.2: Experiment 3: Tactor sites for the position front ..............................................183
12.3: Experiment 3: Percentage of correct discriminations as a function of
position of the array...........................................................................................185
12.4: Experiment 3: Percentage of “same” answers when different pairs–one
saltatory, one successively activated–were presented on a 7-tactor array.........186
12.5: Experiment 3: Effect of SD on subjects’ ability to discriminate patterns
of either the same generation mode or different generation modes .................192
12.6: Experiment 3: Effect of ISI on the percentage of “same” answers for
the different positions of the 7-tactor array and separated for same and
different pairs.....................................................................................................196
12.7: Experiment 3: Effect of SD and ISI on “same” answers, when only bilaterally
presented patterns on the front of the torso are included ..................................200
12.8: Experiment 3: Effect of ISI on the percentage of “same” answers for every
level of SD over all subjects and trials .............................................................202

Index of Abbreviations
XVI
Index of Abbreviations
2-AFC Two-alternatives forced-choice
AL Alignment button
df Degrees of freedom
e.g. for example
FA Fast adapting units
fMRI Functional magnetic resonance imaging
i.e. that is
ILD Interaural level difference
ISI Interstimulus interval
ISOI Interstimulus onset interval
ITD Interaural time difference
L1-3 Stimulus location 1-3
LED Light-emitting diodes
M Mean
Max. Maximum
Min. Minimum
MT Middle temporal area
N Sample size
n Number of observations
n.s. Not significant
NAMRL Naval Aerospace Medical Research Laboratory
P Significance
PC Pacinian corpuscles
p. Page
pp. Pages
P1-P3 Pulse 1-3
RA Rapidly adapting units (=fast adapting units)
SI First (primary) somatosensory cortex
SII Second (secondary) somatosensory cortex
SA Slowly adapting units
SD Stimulus duration
StdDev Standard Deviation

Index of Abbreviations
XVII
Tac/tactor Tactile vibrator
TSAS Tactile Situation Awareness System
Units of Measurement
C Celsius
cm Centimeter
cm/s Centimeter per second
dB SL Decibel sensation level
gr Gram
Hz Herz
mm Millimeter
mm/s Millimeter per second
ms Millisecond
s Second
µm Micrometer
° Degree
1 Importance of spatio-temporal illusions
1
1 Importance of spatio-temporal illusions
Von Békésy (1967) states: “In the complex system of neural and cortical processing with
inhibitory, excitatory and feedback connections it is difficult to determine, which feature in
the complex produces a sensation like illusory movement” (p. 162). Psychophysical measures
provide a non-invasive technique to describe connections between stimulus characteristics
and sensations, which in turn are supposed to correlate with network features.
With the help of tactile illusions the gap between psychophysics of perception and cortical
representation might be closed and an answer found for the question: Do topographic
representations in early somatosensory cortices map physical locations of peripheral stimuli
or rather subjective perceptions (see Chen, Friedman, & Roe, 2003) and how are those
representations correlated to spatio-temporal stimulus characteristics?
The research about tactile illusions has a long tradition: Almost a century ago, Gestalt
psychologists like Wertheimer discovered that non-moving stimuli can elicit the perception of
motion (see summary of Sarris, 1989). When two stimuli are presented successively with the
appropriate time interval and distance between the stimuli we see the shift as movement. This
compelling illusion known as apparent motion was studied first in the visual sense, but was
also found in the auditory and tactile sense.
Another class of spatio-temporal illusions employing successively delivered stimuli found
that depending on spatio-temporal stimulus characteristics, the perceived location of a
stimulus can shift towards the location of a rapidly delivered subsequent stimulus (a
phenomenon called saltation) or even merge to a single sensation (von Békésy effect).
Furthermore, it was found that the apparent spatial distance between successively presented
stimuli depends on the time interval between them (tau-effect). A parallel interaction, known
as the kappa effect, occurs when apparent temporal intervals for successively-presented
stimuli are affected by the physical distance between the sites that generated the tactile
sensations (Cohen, Hansel, & Sylvester, 1955).
Cholewiak and Collins (2000) have shown that apparent motion and saltation can both
elicit the same percepts of movement. Alike saltation, apparent movement obviously implies
the mislocalization of stimuli, as in both illusions, stimuli are not perceived, where they
physically are. To obtain the perception of smooth, uninterrupted movement, timely separated
stimuli must be integrated into a unitary percept, where illusory stimuli are perceived at
locations in-between the actually activated stimulus sites. Cholewiak and Collins (2000)
1 Importance of spatio-temporal illusions
2
conclude that “repetitive presentation of spatio-temporal stimuli … can lead to considerable
changes in cortical spatial organization” (p. 1233).
Further exploration of spatio-temporal illusions might lead to a better understanding of
these processes of cortical reorganization.
Tactile illusions help to study the connection between perception and somatotopic
cortical processing The body map for somatosensory perceptions represents neurons in the
somatosensory cortex (SI) that are activated by touching certain body parts. This map was
presumed to be a topographic map of the physical body. But new research showed that “brain
maps perception, not reality” (Chen et al., 2003) . The researchers used an illusion called
tactile funneling: When adjacent fingers are stimulated, subjects perceive a single stimulus
between the two stimulated sites. In this case only a single cortical location responded which
was situated between the areas that were responding when both fingers were stimulated (see
also Gardner & Constanzo, 1980b, 1980c). Chen et al. (2003) conclude that the pattern of
cortical activation reflects our subjective perception rather than physical stimulation.
Blankenburg, Ruff, Deichmann, Rees, and Driver (2006) found the same result when they
examined a tactile illusion called saltation (Chapter 3.1): An illusorily perceived stimulus
during the saltation condition activates exactly the same sector of the brain that would
respond if that (illusory) stimulus location had actually been touched.
Wiemer, Spengler, Joublin, Stagge, and Wacquant (1998, 2000) demonstrated that
temporal distances between stimuli are transferred into spatial distances in cortical
representation. The shorter the time interval between two stimuli, the closer the
representational distances in somatosensory cortex. Apparently, activity of the somatosensory
cortex adapts to spatio-temporal stimulus characteristics (see also Braun, Haug, Wiech, &
Birbaumer, 2001; Wang, Merzenich, Sameshima, & Jenkins, 1995).
1 Importance of spatio-temporal illusions
3
Clinical importance of tactile illusions Tactile illusions can support in detecting sensory
impairments in neurologically damaged individuals and may aid in recognizing worsening or
improvement of the sensory deficit. Clinical tests evaluating a patient’s ability to discriminate
the direction of tactile movement simulated by the successive delivery of stimuli might be
helpful to detect sensory deficits after nerve injuries and accordingly measure recovery rates
(Essick, Whitsel, Dolan, & Kelly, 1989; Johnson, Yoshioka, & Vega-Bermudez, 2000;
Szaniszlo, Essick, Kelly, Joseph, & Bredehoeft, 1998).
Two examples for the clinical relevance of tactile illusions: Temporal stimulus parameters
of visual saltation were found to differentiate between males diagnosed with chronic
schizophrenia, mixed psychiatric patients and a normal control group (Brassel, 1993). The
identification of numbers “drawn” on the skin with discrete tactile stimuli is enhanced in the
affected body-half of cervical spinal cord-injured subjects with central pain, but deteriorated
in most patients with supraspinal injuries and central pain (Gonzales, Lewis, & Weaver,
2001).
Technical implications: Vibrotactile displays Tactile displays convey information by
presenting vibrotactile stimuli to the user’s skin. Recently the interest in and the application of
tactile displays is rapidly growing, partly because the development of more complex human-
computer interfaces leads to an increasing overload of the visual and auditory information
channels. Hence, the need for an additional or alternative information channel pushed
researchers to use the sense of touch in multi-modal interfaces.
Tactile displays can either serve as Sensory Assistive devices, aiding blind or deaf people
to perceive the world around them, by translating visual or auditory information into tactile
stimuli (e.g. Tactaid II or Tactile VII for the deaf or OPTACON/TCD for the blind). Or they
are employed as information displays that convey certain information about our environment:
The skin can be used as a medium to communicate spatial information like the location or
direction of moving objects. Thus, vibrotactile displays for spatial guidance have been
developed. Examples for the successful application of relatively simple displays would be:
The Tactor Locator System (TLS) by Rochlis and Newman (2000) that presented information
about position and velocity by vibrating stimuli (called tactors) on the torso and neck and was
tested onboard the International Space Station (ISS; see also van Erp, 2007); a haptic back
display e.g. embedded in a driver’s seat as a navigation guidance system (Tan, Gray, Young,
& Traylor, 2003) or vibrotactile warning signals in automobiles to present spatial information
to drivers (Ho, Tan, & Spence, 2005). Van Erp (2007) demonstrated that a tactile navigation
1 Importance of spatio-temporal illusions
4
system in a driving simulator is superior to a visual display, since the reaction time to
navigation messages and subjects’ mental effort ratings were lower for the tactile display. In
addition, in a high workload condition, reaction time to visual stimuli in the periphery of the
visual field increased when the visual display was used, but remained constant, when the
tactile display was used, compared to a normal workload condition.
More complex displays consist of 60 or more tactors that cover the whole torso of the
user. They do not only convey simple information like direction but also map spatial
coordinates of a stimulus to a specific location on the torso. This enables for example pilots or
divers who operate many times under poor visual conditions to maintain spatial orientation or
help to navigate. An example would be the Tactile Situation Awareness System (TSAS), a
tactile array applied on the torso and limbs to provide orientation cues to the operator (Rupert,
2000). Another application under development is a vibrotactile vest to support astronauts’
orientation awareness (van Erp & van Veen, 2003).
Beyond navigation applications, tactile displays can be part of rich interaction scenarios
like pervasive computer environments. The “Aura project” at the University of Carnegie is
working on a wearable interaction device that is the user interface to any computer on campus
and also contains an array of micro tactors that provide various notifications (e.g. notification
of emails or incoming files) to the user (Gemperle, Ota, & Siewiorek, 2001).
The usefulness of tactile displays in teleoperation and virtual realities has been
demonstrated amongst others by Kontarinis and Howe (1995), who used a teleoperated hand
system that delivered vibratory stimuli to the operator’s finger tips.
In all the studies reported above, tactile displays have turned out to be an effective
component of multisensory human-machine-interfaces.
2 Perception of vibratory stimuli
5
2 Perception of vibratory stimuli
2.1 Cutaneous Mechanoreceptors The primary receptors for tactile stimuli are located in the skin and the mechanoreceptive
units in glabrous (hairless) skin can be categorized by the size of their receptive fields and
their response to static stimuli: Afferent fibres with small receptive fields are called type I,
those with large receptive fields type II. Units adapt either fast (FA) or slow (SA) to static
stimuli, i.e. they either respond just to the stimulus onset, and often at the termination (FA) or
respond during the whole stimulus duration (SA). The end organs for FAI units are Meissner
corpuscles, for FAII units Pacinian corpuscles (PC), for SAI units Merkel disks and for SAII
units Ruffini cylinders (e.g. Cholewiak & Collins, 1991; Greenspan & Bolanowski, 1996;
Martin & Jessell, 1993).
The size and form of the receptive fields may vary with indentation force of a static
stimulus, the amount of variation in field size depending on unit type. Also the type of
stimulation, e.g. lateral or vertical skin displacement changes the extent of the receptive fields
(Johansson, 1978; Vallbo, Olausson, Wessberg, & Kakuda, 1995).
Each type of mechanoreceptor responds especially to a certain aspect of the stimulus:
Pacinians are excited by vibratory high-frequency stimuli; they perceive vibrations
transmitted through an object or tool held in the hand. Ruffini cylinders respond to skin
stretch and consequently transmit information about forces acting on the hand. Merkel disks
are sensitive to edges, corners and curvatures, and therefore responsible for form and texture
perception. Meissner corpuscles have a lower spatial acuity than the SAI system; they are
responsible for the detection of surface form and texture when surface variation is too small to
activate the SAI system. They are also very sensitive to minute motion on the skin surface and
sudden changes in load force and thus provide feedback signals for grip control (Johnson et
al., 2000; Johnson, 2001; Johnson & Hsiao, 1992).
Psychophysical measures of vibrotactile sensation lead to the “four channel model of
cutaneous mechanoreception”, showing that each of the four mechanoreceptive units have
different frequency-response characteristics: The Pacinian channel (FAII) responds to
frequencies between 35 and 500 Hz, the threshold-frequency function being U-shaped. The
SAII units are operating at about the same frequency range (80-500 Hz), but at a much lower
sensitivity. FAI and SAI units both are excited by frequencies between 3 and 100 Hz (SAI
units even operate at frequencies as low as 0.4 Hz), their sensitivities are not affected by
2 Perception of vibratory stimuli
6
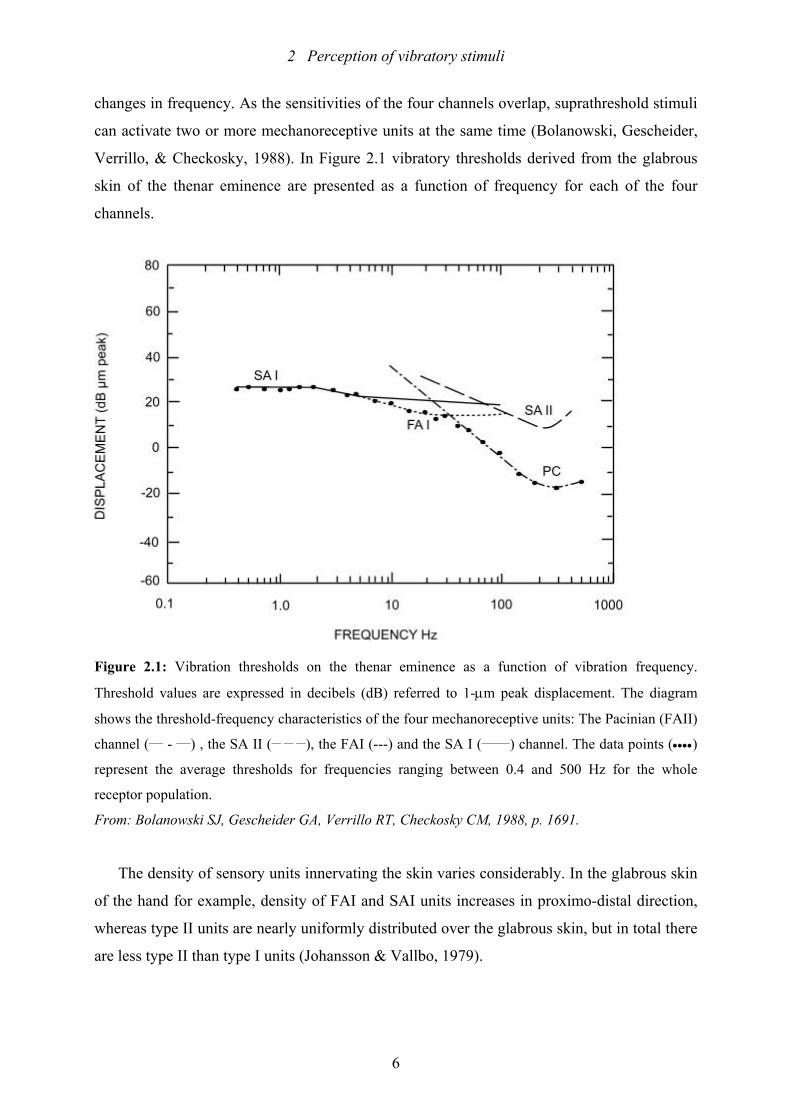
changes in frequency. As the sensitivities of the four channels overlap, suprathreshold stimuli
can activate two or more mechanoreceptive units at the same time (Bolanowski, Gescheider,
Verrillo, & Checkosky, 1988). In Figure 2.1 vibratory thresholds derived from the glabrous
skin of the thenar eminence are presented as a function of frequency for each of the four
channels.
Figure 2.1: Vibration thresholds on the thenar eminence as a function of vibration frequency.
Threshold values are expressed in decibels (dB) referred to 1-µm peak displacement. The diagram
shows the threshold-frequency characteristics of the four mechanoreceptive units: The Pacinian (FAII)
channel (___ - ___) , the SA II (__ __ __), the FAI (---) and the SA I (______) channel. The data points (••••)
represent the average thresholds for frequencies ranging between 0.4 and 500 Hz for the whole
receptor population.
From: Bolanowski SJ, Gescheider GA, Verrillo RT, Checkosky CM, 1988, p. 1691.
The density of sensory units innervating the skin varies considerably. In the glabrous skin
of the hand for example, density of FAI and SAI units increases in proximo-distal direction,
whereas type II units are nearly uniformly distributed over the glabrous skin, but in total there
are less type II than type I units (Johansson & Vallbo, 1979).
2 Perception of vibratory stimuli
7
In hairy skin, the structure of mechanoreceptors differs: Aside from slowly adapting units
(SAI and SAII, however they can not be categorized as clearly as in glabrous skin), there are
three rapidly adapting unit types: Hair units (responding to movements of individual hairs;
larger receptive fields than type I units; end organs are almost evenly, but thinly distributed),
field units (comparable to hair units, but unknown histological structure of the end organs and
more diffuse receptive field borders; they are more sensitive to skin indentation) and
Pacinian-type units (quite homologous to the Pacinian channel in glabrous skin, except they
are not sensitive to temperature changes, probably because they are located deeper in the skin
and less numerous than in glabrous skin). No rapidly adapting units with small receptive
fields were found on the hairy forearm skin. (Bolanowski, Gescheider, & Verrillo, 1994;
Greenspan & Bolanowski, 1996; Vallbo et al., 1995). In addition, there are unmyelinated
mechanoreceptive afferents in the forearm skin that respond to light tactile stimuli (Vallbo,
Olausson, Wessberg, & Norrsell, 1993). As there are only few psychophysical studies of
human hairy skin afferent fibres, “the relationship between hairy skin afferent fibres and
tactile perception is still largely unknown” (Greenspan & Bolanowski, 1996, p. 43). However,
we know that in hairy skin hair follicle receptors are responsible for the detection of low-
frequency vibratory stimuli (less than 80 Hz), and presumably the deeply located Pacinian
receptors for the detection of high-frequency stimuli (Mahns, Perkins, Sahai, Robinson, &
Rowe, 2006). Hairy skin is the type of skin that will be studied in all of the experiments in
this dissertation.
Depending on the skin site tested and the type of skin (glabrous versus hairy skin),
number and structure of receptors vary (e.g. Meissner corpuscles can only be found in
glabrous skin; there are no Pacinian corpuscles in the skin of the cheek). Thus, the skin does
not respond uniformly to tactile stimuli: Sensitivity to tactile stimuli depends on innervation
density and appearance of mechanoreceptors (Cholewiak & Collins, 1991).
2.2 Spatio-temporal variables affecting vibration perception Detection thresholds for vibratory stimuli depend on several spatio-temporal parameters like
frequency, contactor size, stimulus duration and location, and skin type (glabrous or hairy).
Thresholds are low for vibration frequencies in the range 200-300 Hz, dependent on
contactor size. For very small contactors (< 0.02 cm2) threshold is independent of frequency.
For larger contactors, low frequencies (< 40 Hz) have no effect on detection threshold, but as
2 Perception of vibratory stimuli
8
frequencies increase, threshold improves until it reaches maximum sensitivity and then
sensitivity decreases rapidly. Subjective stimulus magnitude is also affected by vibration
frequency: Higher frequencies must be presented at lower intensities (displacement in
decibels) to be perceived at the same subjective magnitude as a low-frequency stimulus
(Summers, 1992; Verrillo, 1965). Cholewiak and Collins (1991) first published a table that
summarizes these parameters, later reproduced and expanded by Greenspan and Bolanowski
(1996).
If contactor size is taken as independent variable, it appears that at the higher frequencies
(80-320 Hz) sensitivity increases with the size if the vibrating element, indicating that spatial
summation takes place. At low frequencies (<40 Hz) contactor size doesn’t affect detection
threshold, in this case, there is no spatial summation. In addition, for receptor systems
showing spatial summation (Pacinian channels) applies: The larger the contactor size, the
greater the apparent stimulus intensity, independent of stimulus frequency (Cholewiak &
Collins, 1991).
Additionally stimulus waveform also influences the detection and perception of
vibrotactile stimuli. While a sine wave is perceived as smooth, a square wave is more intense
and “sharp”, due to a square wave pulse’s rapid on- and offset and the phase-locked responses
of FAs to the periods of the stimulus waveform. Ide, Akimura, and Obata (1985) found lower
vibratory thresholds for square waves than for sine waves.
Also, the duration of the stimulation is crucial, as temporal summation – which only
works for stimuli > 40 Hz – facilitates the perception of vibrotactile stimuli (FAII and SAII ).
Here again, very small contactors (0.02 cm2) are an exception (Summers, 1992; Verrillo,
1965).
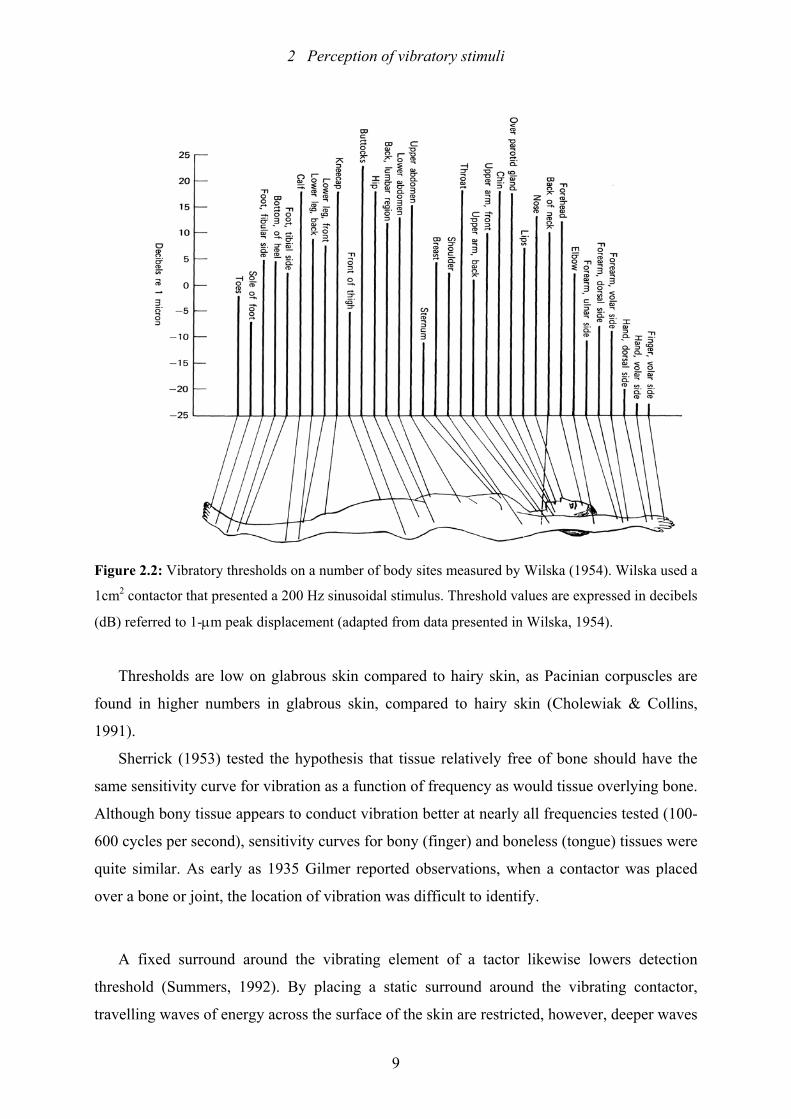
Thresholds are low on fingers and hands compared to the limbs and the trunk. Figure 2.2
shows that thresholds decrease proximodistally. It seems that vibratory threshold is correlated
with cortical representation of certain body sites. (Sherrick & Cholewiak, 1986). Body site not
only influences detection thresholds, but also the perception of changes in the subjective
magnitude (“loudness”) of the stimulus. The subjective magnitude of stimulation increases
more rapidly on lesser innervated body sites like the forearm (Summers, 1992) or the thigh
(Cholewiak, 1979). Furthermore, body site and thus innervation density correlates with the
skin’s spatial resolution: Two-point thresholds and errors of localization are both higher for
lesser innervated sites like the trunk.
2 Perception of vibratory stimuli
9
Figure 2.2: Vibratory thresholds on a number of body sites measured by Wilska (1954). Wilska used a
1cm2 contactor that presented a 200 Hz sinusoidal stimulus. Threshold values are expressed in decibels
(dB) referred to 1-µm peak displacement (adapted from data presented in Wilska, 1954).
Thresholds are low on glabrous skin compared to hairy skin, as Pacinian corpuscles are
found in higher numbers in glabrous skin, compared to hairy skin (Cholewiak & Collins,
1991).
Sherrick (1953) tested the hypothesis that tissue relatively free of bone should have the
same sensitivity curve for vibration as a function of frequency as would tissue overlying bone.
Although bony tissue appears to conduct vibration better at nearly all frequencies tested (100-
600 cycles per second), sensitivity curves for bony (finger) and boneless (tongue) tissues were
quite similar. As early as 1935 Gilmer reported observations, when a contactor was placed
over a bone or joint, the location of vibration was difficult to identify.
A fixed surround around the vibrating element of a tactor likewise lowers detection
threshold (Summers, 1992). By placing a static surround around the vibrating contactor,
travelling waves of energy across the surface of the skin are restricted, however, deeper waves
2 Perception of vibratory stimuli
10
may still continue to spread laterally. Thus, the use of a fixed surround can reduce the number
of superficial receptors stimulated (Meissner’s corpuscles, Merkel disks), but may not affect
the stimulation of receptors lying deeper in the dermis (Ruffini endings, Pacinian corpuscles)
(Cholewiak & Collins, 1991).
Skin-surface temperature can also affect threshold: FAII and SAII units show a clear
reduction of their sensitivity as well as in the frequency at which they are most sensitive at
lower temperatures (15-25°C). The other channels are only slightly affected by changes in
temperature (Bolanowski et al., 1988; Cholewiak & Collins, 1991).
The processing of temporal information can be measured by the threshold of
successiveness or by the perception of order. In the first case, two stimuli are presented close
in time and subjects are asked, if they feel one or two stimuli. If the temporal separation of the
two stimuli is greater than 5 ms, subjects are able to tell, that there were two stimuli. At a time
interval of more than 20 ms, subjects can determine, which of the stimuli occurred first
(perception of order; Sherrick & Cholewiak, 1986). Geffen, Mason, Butterworth, Mclean, and
Clark (1996) showed that bimanual simultaneity thresholds (minimum interstimulus interval
ISI at which the subjects can perceive that two stimuli have occurred separately) are higher
than unimanual thresholds: The time needed to cross hemispheres increases the ISI required
for subjects to perceive the two stimuli separately.
2.3 Processing of tactile stimuli and dynamic adaptation of somato-
sensory cortex to spatio-temporal characteristics of tactile stimulation Individual nerve fibres innervating mechanoreceptors are bundled to a single nerve trunk,
before they enter the spinal cord. A localized band of skin that is innervated by a single nerve
root from the spinal cord is called dermatome. Along the abdomen, dermatomes look like a
stack of disks, but there is considerable overlap between two adjacent dermatomes (Itomi,
Kakigi, Meada, & Hoshiyama, 2000).
After entering the spinal cord, modality specific information is conveyed over the dorsal-
column-medial-lemniscal pathway to the dorsal column nuclei, and from there to the thalamic
nuclei which projects to primary somatosensory cortex (Hsiao, Johnson & Yoshioka, 2003).
In the sensory cortex, there are two main areas where tactile information is represented:
Primary and secondary somatosensory cortex (SI, SII). Whereas area SI receives afferents
from the contralateral body site, both body halves are represented in area SII (Sherrick &
2 Perception of vibratory stimuli
11
Cholewiak, 1986; Maeda, Kakigi, Hoshiyama, & Koyama, 1999; Ruben, Schwiemann,
Deuchert, Meyer, Krause, Curio, et al., 2001). In SI of monkeys, area 3b and 1 respond to
tactile stimuli. Both areas contain separate representations of the body surface (Kaas, 1983;
Kaas, Nelson, Sur, Lin, & Merzenich, 1979). Receptive fields of SI neurons are small, they
respond to specific spatial features of the stimuli. Neurons in SII have larger receptive fields
and show more complex responses (Hsiao et al., 2003). Vibratory stimuli of different
frequencies activate spatially distinct cortical domains in SI – both, in area 3b the first
processing stage, and in area 1 the next hierarchical processing stage (Friedman, Chen & Roe,
2004). SI as well as SII show phase-locking to low- and high-frequency vibratory stimuli,
whereupon the extent of phase-locking was greater for SII neurons. Attention not only affects
neurons’ firing rates, but also the degree of synchrony of firing. SII neurons are affected
stronger by attention than SI neurons (Hsiao et al., 2003). Highly innervated areas of the body
(e.g. fingertips, lips) with small receptive fields are represented in lager cortical areas than
poorly innervated body sites (like the trunk, whose representational area is small), a principle
which is called cortical magnification (Cholewiak & Collins, 1991; Sur, Merzenich, & Kaas,
1980). Receptive fields in the cortex are larger than those in the periphery. Some cortical cells
have fields, that are sensitive to specific features (e.g. direction of moving stimuli) of the
stimulus. Even illusory sensations, like saltation are represented in corresponding patterns of
cortical activity (see Blankenburg et al., 2006).
As stated before, somatosensory topographic maps are not definite representations of the
body surface, they adapt dynamically to afferent input. Recent research has shown that
changes in the cortical representation of the body surface occur with structural changes of the
body (e.g. amputations) or with experience (Cholewiak & Collins, 1991).
Merzenich, Kaas, Wall, Nelson, Sur, and Felleman (1983) found that after cutting the
median nerve in monkeys, which provides afferent input from mechanoreceptors from the
palm of the hand and the first three digits, the cortical sites formerly activated by input from
the median nerve were now activated by stimulation of adjacent skin sites. The pioneer work
of Yang, Gallen, Schwartz, Bloom, Ramachandran, and Cobbs (1994) demonstrated that
shifts in the organization of somatosensory cortex occur also in humans. They showed that the
somatosensory maps of amputees were altered such that representations of other body parts
expanded into the cortical area once activated by the amputated body parts (see also
Rauschecker`s, 1995 work on compensatory plasticity in visually deprived cats). The cortical
2 Perception of vibratory stimuli
12
reorganisation found in amputees can be reduced by sensory discrimination training, in doing
so, phantom limb pain is also decreased (Flor, Denke, Scheafer, & Grüsser, 2001).
Long-term changes in cortical representation, i.e. adaptation to spatiotemporal stimulus
characteristics, was found after excessive tactile stimulation as the following examples
demonstrate: An enlargement of the cortical representation was found for the reading finger of
blind Braille readers (see Noppeney, Waberski, Gobbelé, & Buchner, 1999). Long-term
intensive synchronous tactile stimulation of adjacent fingers of owl monkeys resulted in
integrated representations of these fingers in SI, whereas asynchronous stimulation (stimuli
applied separately to each finger) lead to a segregation of their representations (Wang et al.,
1995). When fingers are stimulated in a fixed order, the distance between the cortical
representations of these fingers is decreased, compared to random order stimulation. These
changes in the cortical map occur within minutes and are rapidly reversible (Braun et al.,
2000; Hegner, Wiech, Preissl, & Braun, 2006). Increasing stimulus intensity increases the size
of the representational areas in SI, as well as the amount of representational overlap, when
two adjacent fingers are stimulated separately (Krause, Kurth, Ruben, Schwiemann,
Villringer, Deuchert, et al., 2001).
The dependency on cortical topography of spatio-temporal stimulus characteristics was
also researched by Wiemer et al. (1998, 2000). Not only the spatial but also the temporal
relatedness of tactile stimuli were found to influence their cortical representation: Stimuli
presented close together in time are associated and represented close to each other in
somatosensory cortex. Thus, temporal distances between successive stimuli are transformed
into representational distances. Synchronously applied stimuli are integrated (compare Wang
et al., 1995), i.e. they are represented at a single cortical location, or their representational
distance is reduced. When the interstimulus interval (ISI) exceeds 300 ms, stimuli are
segregated, i.e. they are represented at several distant cortical locations, or their
representational distance is increased. Wiemer explains these findings with wavelike shifts of
cortical activation produced by successive stimuli, leading to either shortened or lengthened
representational distances dependent on ISI . His model of cortical plasticity is able to explain
the spatio-temporal illusion called saltation (see Chapter 3.1), but does require long-term
repetitive stimulation.
However, long-term stimulation may not be necessary to induce changes in cortical
representation. Stolle (2003) showed that also short-time repetitive stimulation (single-
location or saltatory tactile stimuli) resulted in changes of the cortical topography of the
2 Perception of vibratory stimuli
13
stimulation area (forearm): The space of the stimulated area was contracted in perception after
being stimulated less than 300 times (whereas in Wiemer’s experiment a few thousands
stimuli were applied).
In their literature review, Kohn and Whitsel (2002) presented evidence, that already
within seconds, sensory stimuli can alter the response properties of neurons in SI, e.g. the
degree of phase-locking to different frequencies of sinusoidal vibratory stimuli changed
increasingly with ongoing stimulation (>0.5 s after stimulus onset).
That repetitive spatiotemporal stimulation causes representational changes in sensory
cortices, which, in turn, are correlated with subjects’ behaviour or perception was amongst
others demonstrated by Recanzone, Schreiner, and Merzenich (1993). They have shown that
changes in subjects’ behaviour due to training–in this case monkeys’ ability to discriminate
different frequencies of tones–parallel changes in the auditory cortex: Monkeys were able to
improve their difference limens by 50%, while an increase in the area of representation of the
tested frequencies in primary auditory cortex could be observed. Another proof for the
perceptual consequences of such plastic processes was found by Godde, Spengler, and Dinse
(1996) and Joublin, Spengler, Wacquant, and Dinse (1996) in the tactile sense: After 2-6
hours of pair-wise, simultaneous presentation of tactile stimuli, spatial discrimination
performance improved. Applying the same stimuli on a rat’s hind paw lead to an enlargement
of receptive fields and cortical representational areas. Similar results were found in humans,
even when subjects were instructed not to attend the stimulation (Godde, Ehrhardt, & Braun,
2003; Pleger, Dinse, Ragert, Schwenkreis, Malin, & Tegenthoff, 2001). Directly stimulating
the cortical representations of the index finger in SI from outside the brain using repetitive
transcranial magnetic stimulation, lead to the same results: Improvement of tactile
discrimination (via unattended stimulation) and enlargement of the index finger representation
in SI (Tegenthoff, Ragert, Pleger, Schwenkreis, Förster, Nicolas, et al., 2005). Joublin et al.
(1996) conclude that plastic changes “… enable higher [cortical] levels to perform a faster
and more elaborate decoding and processing of information” (p. 285).
The relationship between perceptual learning and plasticity in the topographic map was
recently demonstrated by Polley, Steinberg, and Merzenich (2006). Rats trained to attend
selectively to either frequency or intensity of an auditory stimulus, showed a correlated
expansion of the cortical areas−primary auditory cortex and higher auditory fields−that either
represented the trained frequency range or the trained intensity range. So, they proved that 1)
even in the same neural circuit, cortical maps can display plastic changes that appear to be
2 Perception of vibratory stimuli
14
independent and 2) not only the temporal proximity between a stimulus and reinforcement
(“bottom-up” factors), but also by “top-down” factors that modulate the selective processing
of stimulus features are important. (see also study of Blake, Strata, Kempter, & Merzenich,
2005: Receptive fields of owl monkey SI double in size after four weeks of training the
animals to detect patterns of taps delivered to adjacent fingers.). In humans, Noppeney et al.
(1999) showed that spatial attention can affect the representation of digits in SI in such a way
that the area of cortical representation shifted medially or laterally towards the locus of
attention (see also Braun, Haug, Wiech, & Birbaumer, 2001).
Detection or localization of tactile stimuli is facilitated when subjects direct their eyes to
the stimulated body site, even when this site is not visible or when they are allowed to move
the body part that had been touched (e.g. Halnan & Wright, 1960; Tipper, Lloyd, Shorland,
Dancer, Howard, & McGlone, 1998; Tipper, Phillips, Dancer, Lloyd, Howard, & McGlone,
2001). A possible explanation might be the existence of excitatory links between spatiotopic
maps of different sensory modalities (Lloyd, Bolanowski, Howard, & McGlone, 1999).
3 Tactile illusions: Saltation and apparent movement
15
3 Tactile illusions: Saltation and apparent movement
3.1 Saltation
The saltatory phenomenon was detected in the early 70’s in the Princeton Cutaneous
Communication Laboratory by Geldard and his colleagues. Three contactors were placed
equidistant along the forearm and five 2-ms square-wave mechanical pulses delivered to each
contactor. With appropriate timing, the effect felt was that of a series of single taps running
from the first contactor to the third–hopping like a little rabbit. Thus, the new phenomenon
was called “the rabbit” or saltation (Latin: saltare, translated into English: to jump or leap).
To study the characteristics of saltation Geldard (1975, 1982) introduced the condition
known as the “reduced rabbit”: A series of three pulses presented by two spatially separated
contactors - a first pulse (P1 which is the localizing pulse), to indicate the position of the first
locus L1. After an interstimulus interval (ISI) of at least 300 ms (800 ms in most of Geldard’s
experiments), the second pulse P2 was presented, also at L1, followed by the third pulse P3 at
the second locus L2 after an ISI of less than 300 ms. P3 was called the “attractant”, because it
appeared to attract the stimuli given at L1, causing displacement of P2, whereas P2 was called
the “attractee”, because it appeared to “jump” towards L2.
To determine the amount of mislocalization of P2 towards L2, subjects were asked to set
the ISI between P2 and P3 to the point where the saltatory leap covered a certain distance
between L1 and L2. This procedure, known as the psychophysical method of “fractionation”,
required that the observer set the ISI so that the apparent location of P2 subdivided the
apparent distance between L1 and L2 into quarters.
3 Tactile illusions: Saltation and apparent movement
16
3.1.1 Spatio-temporal characteristics of cutaneous saltation
Temporal limits The saltatory illusion depends on the interstimulus interval (ISI): At large
ISIs (>300 ms for the original 5-5-5 series of pulses with three equidistant contactors), every
pulse is felt where it was physically presented. When ISI is shortened, the pulses start to
spread from under the contactors where they were generated (named point of “exodus”). Over
a certain range of ISI the pulses are mislocalized in-between the active contactors. Further
shortening of ISI (~ 20 ms) leads to a grouping of taps at the attracting contactors (which are
the next contactors in the series), which Geldard called “coincidence”.
The relationship between ISI and the amount of mislocalization was assumed to be linear
(Geldard, 1982; Geldard & Sherrick, 1986). Individual differences alter the shape and
gradient of the “fractionation lines” (relationship between ISI and amount of displacement).
To my knowledge only one study (Cholewiak & Collins, 2000) has ever systematically
varied the stimulus duration (SD) to examine the effect of SD and the interaction between SD
and ISI (as in studies of apparent motion) on saltatory movement. SD has presumably been
considered to be of secondary importance.
Time course/stability of the saltatory phenomenon Based on Wiemer’s neural network
model Stolle (2003) hypothesized that repetitive spatiotemporal stimuli induce changes in the
cortical and consequently the perceptual representation of the body. She used the reduced
rabbit and utterly reduced rabbit (without localizing pulse) paradigms as stimulus patterns
since variations of the amount of displacement of P1 and P2 in the temporal course of the
experiment would result in shifts in the cortical topography. In fact, although subjects
received fewer than 300 trials−whereas Wiemer applied thousands of stimuli−the perceived
skin area on the forearm that was covered by the two saltatory patterns diminished, which was
interpreted as evidence of the dynamic behaviour of somatosensory maps (Stolle, 2003).
Spatial limits With the original 5-5-5 rabbit sequence and ISIs between 50 and 100 ms,
saltatory leaps of up to a distance of 150 cm were reported (Geldard, 1975), but these longer
distances require special spatial conditions.
Direction of stimulation (distal to proximal or vice versa on the arm or leg) did not appear
to be a significant variable in the production of the saltatory phenomenon. In an experiment
where the reduced rabbit was either running up or down the arm, no differences in the
fractionation data could be found (Geldard, 1975). Cholewiak and Collins (2000) compared
3 Tactile illusions: Saltation and apparent movement
17
two different vibrotactile patterns which were delivered to the back, forearm or finger: One
pattern consisted of the successive activation of each of seven tactors on a linear array and the
other one of multiple pulses at only three of the seven tactors, thus producing saltation.
Direction (proximodistally or distoproximally) of activation had no effect on subjects’
judgments of the quality of movement produced by the two stimulus patterns. Mrsic, Hölzl,
Kleinböhl, Stolle, and Tan (2004) applied the reduced rabbit paradigm on the abdomen either
upwards or downwards along the longitudinal body axis and asked their subjects to indicate
the position of the displaced stimulus by pointing to it. The error of localization is influenced
amongst others by the position of the limb in relation to the trunk and by anatomical anchor
points like the joints such as the wrist or elbow (Cholewiak & Collins, 2003; Stolle, 2003).
Mrsic et al. (2004) avoided those effects by using the trunk as test site and arranging the
stimuli along the longitudinal body axis (so that the navel couldn’t serve as anchor point – see
Cholewiak, Brill, & Schwab, 2004). In this case, the amount of mislocalization of P2 did
depend on the direction of the stimulus pattern–displacement of P2 was greater for the
“downwards” direction, suggesting that the network in primary somatosensory cortex is
anisotropic. The different findings reported above might be due to the different measurement
methods used in these studies: Fractionation, quality judgments and localization.
Therefore, the question of the influence of direction on the saltatory effect can not be
conclusively answered today–more studies involving other directions and different body areas
are needed. One of our pilot studies therefore examined if direction of movement around the
torso–either produced by saltatory or successively presented stimulus patterns–can be
discriminated correctly and reliably. If so, we will drop direction of movement from further
consideration.
Saltatory areas The paradigm of the reduced rabbit was used to explore the extent of
saltatory jumping, the so-called saltatory area, i.e. the maximal physical distance between L1
and L2 where saltation still occurs.
Size and shape of the saltatory area vary with the body site being tested: On the thigh and
forearm, the saltatory area has an ovoid shape, the distance between L1 and L2 where
saltatory jumping can be observed, is longer in the longitudinal direction than in the
transverse direction (Geldard, 1982; Geldard & Sherrick, 1983). The palm and index finger
show an almost round shape of the saltatory area. (Geldard & Sherrick, 1983, 1986).
According to Cholewiak (1999) the size of the saltatory area appears to be negatively
correlated with its area of cortical representation: The larger the area of somatosensory cortex
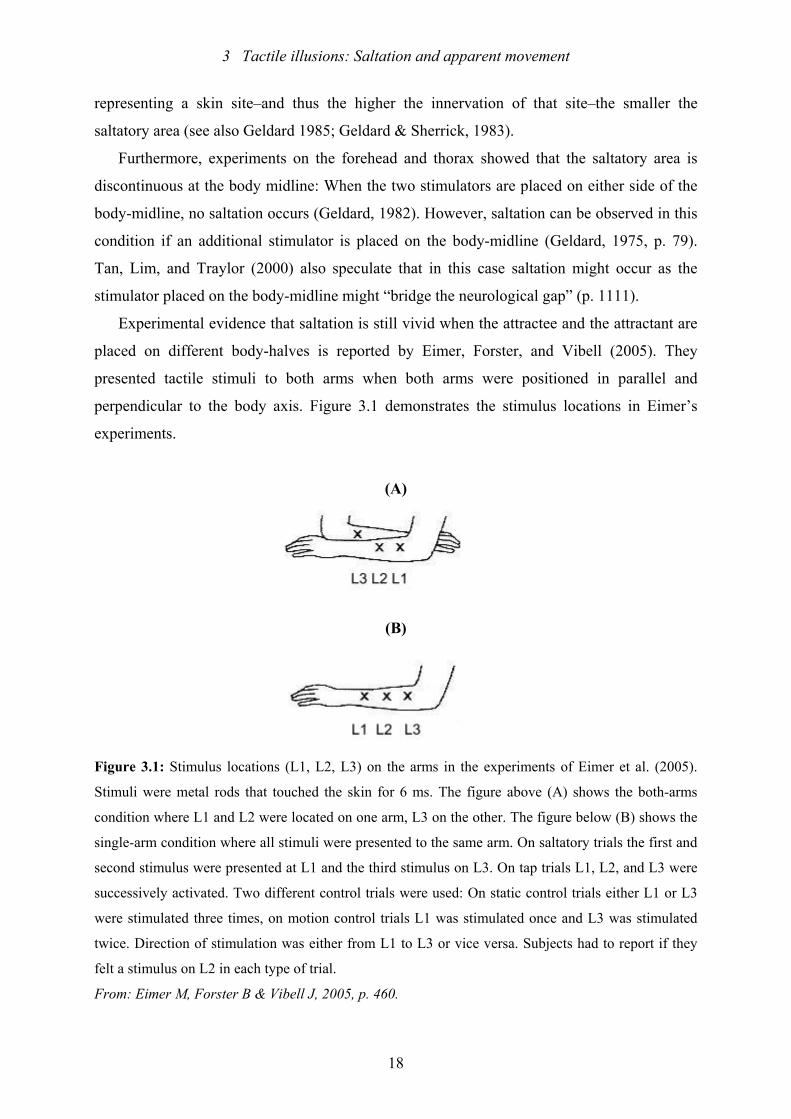
3 Tactile illusions: Saltation and apparent movement
18
representing a skin site–and thus the higher the innervation of that site–the smaller the
saltatory area (see also Geldard 1985; Geldard & Sherrick, 1983).
Furthermore, experiments on the forehead and thorax showed that the saltatory area is
discontinuous at the body midline: When the two stimulators are placed on either side of the
body-midline, no saltation occurs (Geldard, 1982). However, saltation can be observed in this
condition if an additional stimulator is placed on the body-midline (Geldard, 1975, p. 79).
Tan, Lim, and Traylor (2000) also speculate that in this case saltation might occur as the
stimulator placed on the body-midline might “bridge the neurological gap” (p. 1111).
Experimental evidence that saltation is still vivid when the attractee and the attractant are
placed on different body-halves is reported by Eimer, Forster, and Vibell (2005). They
presented tactile stimuli to both arms when both arms were positioned in parallel and
perpendicular to the body axis. Figure 3.1 demonstrates the stimulus locations in Eimer’s
experiments.
(A)
(B)
Figure 3.1: Stimulus locations (L1, L2, L3) on the arms in the experiments of Eimer et al. (2005).
Stimuli were metal rods that touched the skin for 6 ms. The figure above (A) shows the both-arms
condition where L1 and L2 were located on one arm, L3 on the other. The figure below (B) shows the
single-arm condition where all stimuli were presented to the same arm. On saltatory trials the first and
second stimulus were presented at L1 and the third stimulus on L3. On tap trials L1, L2, and L3 were
successively activated. Two different control trials were used: On static control trials either L1 or L3
were stimulated three times, on motion control trials L1 was stimulated once and L3 was stimulated
twice. Direction of stimulation was either from L1 to L3 or vice versa. Subjects had to report if they
felt a stimulus on L2 in each type of trial.
From: Eimer M, Forster B & Vibell J, 2005, p. 460.
3 Tactile illusions: Saltation and apparent movement
19
Stimulus locations L1, L2, L3 were either activated sequentially (one stimulus per
location, referred to as tap trial) or two stimuli were presented at L1 and one stimulus at L3
(referred to as rabbit trial). Stimuli were delivered in both directions (L1→L3 or L3→L1). In
“static control trials” either L1 or L3 were successively stimulated three times. In “motion
control trials” one stimulus was delivered to L1 and two stimuli to L3 (or vice versa). The
latter type of control trial was introduced to eliminate a response bias due to stationary (static
control trial) versus moving (moving control trial) stimulus patterns. ISI was set to 100 or 300
ms, SD to 6 ms.
Subjects were instructed to focus on the middle location (L2) and report whether or not
they had felt a stimulus at that location in the different types of trials. For trials starting at L1
illusory stimuli at L2 were reported more often on rabbit trials than on motion control trials.
But when the rabbit trials started at L3 a mislocalized stimulus could not be perceived more
frequently on the other arm compared to control trials.
Eimer et al. (2005) concluded that although the rabbit failed to jump across arms, a
stimulus presented on one body-half can be attracted by a subsequent stimulus presented on
the other body-half and thus produce the illusion of saltation. According to Eimer et al. (2005)
this result suggests that saltation should be generated in higher order somatosensory areas,
because in primary somatosensory cortex, SI, only the contralateral body-half is represented
and only few connections to the opposite hemisphere exist. Indeed, Maldjian, Gottschalk,
Patel, Pincus, Detre, and Alsop (1999) have shown that besides SI, SII seems to be the region
processing some tactile patterns.
The size of the saltatory area depends also on the number of stimuli delivered to L1 in the
reduced rabbit paradigm: When the single P2 pulse was replaced by several pulses, the extent
of the saltatory area increased. The distance of saltatory jumping was found to be a parabolic
function of the number of P2 pulses (Geldard, 1982).
Although Geldard and Sherrick (1986) argue that P1 and P3 are localized “within the
normal error radius” (p. 91) there are indices, that P3 can also be mislocalized: When they
created an experimental setting where the rabbit hopped in both directions at the same time
(Geldard & Sherrick, 1972), there was the impression “that the taps extend beyond the
terminal contactor” (p. 178). Thus when more than two stimulus sites are involved there
seems to be an “overshoot” of saltatory jumping. In our experiments we will test whether
length of saltatory movement varies dependent on spatio-temporal stimulus characteristics.
3 Tactile illusions: Saltation and apparent movement
20
Cholewiak (1999) reanalyzed the data of various experiments involving spatio-temporal
illusions like saltation to investigate spatio-temporal interactions. He showed that the smaller
the time difference between P2 and P3, the smaller the extent of the sensation, i.e. the more
the two stimulus locations L1 and L2 attract each other, so that one can assume, the attraction
also involves P3.
Trojan, Kleinböhl, Stolle, Andersen, Hölzl, and Arendt-Nielsen (2006; using thermal
stimuli) showed that the perceived length of a saltatory stimulus pattern (reduced rabbit
paradigm) varies with the test site on the forearm: Length decreased from distal to proximal
sites, which was explained by differences in the cortical magnification factor.
The experiments of Kilgard and Merzenich (1995; see paragraph “Attention”) also
indicate that, dependent on the subjects’ focus of attention, the perceived location of P3 may
vary.
Number of pulses Up to about 16 pulses per contactor can be delivered to produce saltation.
But with increasing number of contactors, ISI must decrease to obtain evenly distributed taps
(Geldard, 1982).
Waveform/frequency For his first experiments Geldard (1982) used square wave pulses that
produce sharp and bright taps. However, the saltatory phenomenon also emerged when
rounded waves were used–and thus the hypothesis that saltation only occurs when square
wave pulses are used while phi movement is only produced by sine waves could be disproved.
To examine the effect of stimulus frequency, Cholewiak (reported by Geldard, 1982) used
haversine waves for P3 of six different frequencies: 30, 60, 120, 250, 500, and 1000 Hz. The
frequencies of P1 and P2 were kept constant at 500 Hz. Although the perception of low-
frequency stimuli differs from high-frequency stimuli–low-frequent stimuli appear to be dull
whereas high-frequent stimuli produce bright, sharp taps–saltatory leaping occurred with all
frequencies as Figure 3.2 shows. Although it seems that low-frequency stimuli produce
“fractionation lines” that are steeper than those of high-frequency stimuli. That means that
low-frequency stimuli seem to need higher ISIs to produce evenly distributed saltatory jumps
than high-frequency stimuli. Unfortunately Geldard doesn’t provide any information about
the statistical significance of the interaction between stimulus frequency and ISI, and didn’t
vary the stimulus frequencies for all three stimuli.
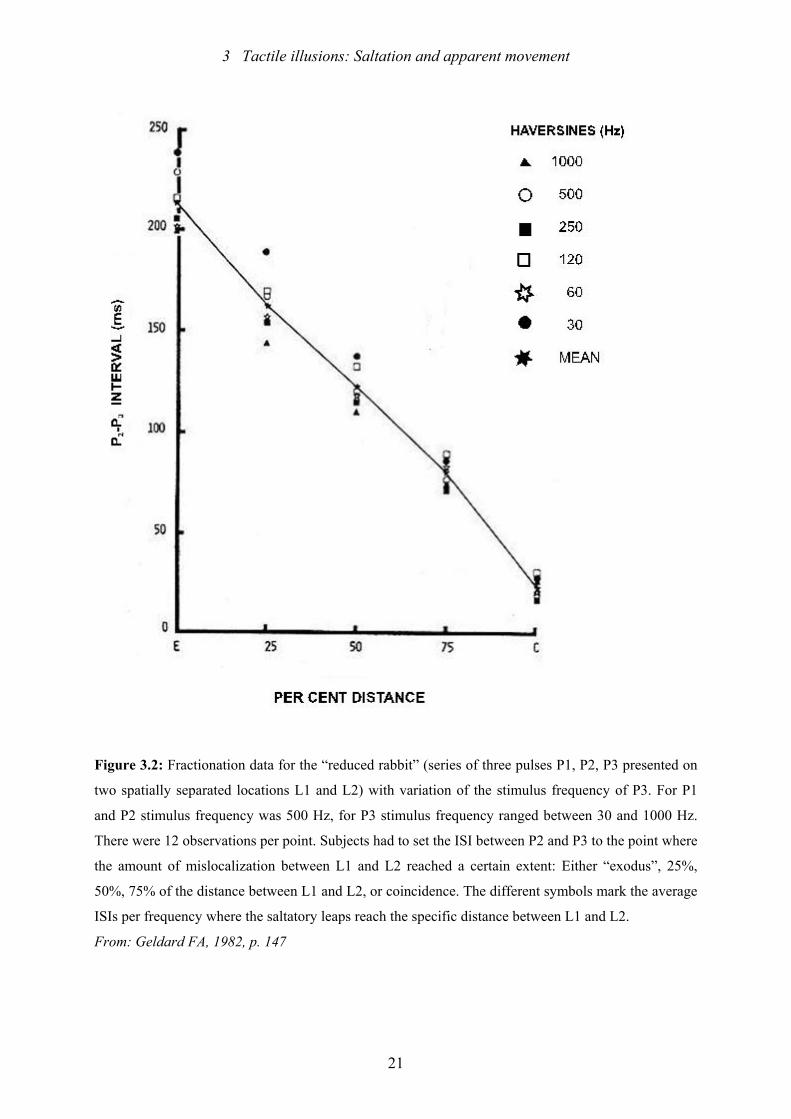
3 Tactile illusions: Saltation and apparent movement
21
Figure 3.2: Fractionation data for the “reduced rabbit” (series of three pulses P1, P2, P3 presented on
two spatially separated locations L1 and L2) with variation of the stimulus frequency of P3. For P1
and P2 stimulus frequency was 500 Hz, for P3 stimulus frequency ranged between 30 and 1000 Hz.
There were 12 observations per point. Subjects had to set the ISI between P2 and P3 to the point where
the amount of mislocalization between L1 and L2 reached a certain extent: Either “exodus”, 25%,
50%, 75% of the distance between L1 and L2, or coincidence. The different symbols mark the average
ISIs per frequency where the saltatory leaps reach the specific distance between L1 and L2.
From: Geldard FA, 1982, p. 147
3 Tactile illusions: Saltation and apparent movement
22
One question about saltation left unanswered is how varying stimulus frequency at all
stimulus sites alters the perception of saltation. We will address this question in our
experiments.
Attention Attention influences the perception of the mislocalized stimulus, but the extent to
which saltation is biased by attention is not completely clear.
To study attentional contributions, Kilgard and Merzenich (1995) added a fourth stimulus
to the reduced rabbit paradigm: A second localizing stimulus that was separated in time from
the two saltation stimuli (P2 and P3). They found that P2 and P3 attracted each other, i.e. the
perceived distance between the two stimuli decreased with decreasing ISI. As subjects were
instructed to concentrate either on the proximal or distal region of the forearm, where the
stimuli were applied, the perceived locations of P2 and P3 shifted towards the attended
direction although the perceived distance between P2 and P3 remained unaltered. Kilgard and
Merzenich (1995) conclude that the perceived distance between P2 and P3 depends on ISI
whereas the perceived location of P2 and P3 is determined by attention.
However, Eimer et al. (2005) state that “saltation cannot be explained solely in terms of
attentional bias” (p. 462). In their experiment–already described before (see also Figure 3.1)–
they delivered tactile stimuli to three locations on either one or two arms and asked subjects to
attend only to the middle location (L2).
If attention would have exerted a comparable spatial bias on rabbit and (static and motion)
control trials, then similar response patterns should have been evoked. But, in fact, the
perceptual reports differed considerably: In rabbit trials an illusory stimulus was reported
significantly more often at L2 than in both types of control trials.
The difference between the two studies is that Kilgard and Merzenich (1995) focus on the
effect of attention on the localization of the displaced stimuli, whereas Eimer et al. (2005)
measure only the presence or absence of a mislocalized stimulus at a certain distance between
L1 and L3. In Eimer’s experiments attention might have had a different influence on saltation
and the control stimulus patterns. Because they did not vary the attended region it remains
unclear if the location of illusory stimuli in saltation and control patterns would have shifted
in the same way towards the attended region.
3 Tactile illusions: Saltation and apparent movement
23
Additional issues that have been studied in saltation, such as variation of stimulus
intensity or mode of stimulation (electrocutaneous or thermal stimulation), are not discussed
here, because they were not experimental variables in the following experiments.
3.1.2 Explanatory approaches for the saltatory phenomenon
There are a number of arguments for the hypothesis that central mechanisms are responsible
for the saltatory effect. These can be listed as follows:
1. Experimental evidence was found that wave propagation in the skin or peripheral
mechanisms (receptive fields, peripheral nerve branches) could not explain the saltatory effect
(see Geldard, 1982).
2. When the area between L1 and L2 was anesthetized, a mislocalized stimulus could still
be perceived in that area (Geldard, 1982; Geldard & Sherrick, 1986). This is a strong
argument against a peripheral origin of the saltatory phenomenon.
3. Saltation also occurs in vision and audition (see Chapter 3.3).
According to Wiemer’s (1998) neural network model, the topography of somatosensory
maps adapt dynamically to the time course of stimulation (see also Chapter 1). He argues that
temporal distances between successive stimuli are transformed into spatial distances in
somatosensory cortex. These temporal distances may be used to alter cortical representations
due to shifts of cortical activation: An incoming stimulus produces a wave-like activation in
primary sensory cortex. A second stimulus generates a forward activation, that causes a shift
in activation towards the prevailing wave front when the ISI between the two activated stimuli
is small (<300 ms). In this case both stimuli are integrated, i.e. the spatial distance between
cortical activities caused by the two stimuli decreases. This might in turn influence the
perception of the location of P2: For short ISIs (<300 ms), integration of P2 and P3 takes
place, the distance between P2 and P3 thus decreases.
Whereas Wiemer based his assumptions on experiments where a few thousand stimulus
repetitions were applied to cause changes in the cortical representation of spatio-temporal
stimuli, Stolle (2003) showed that a few hundred stimulus replications are sufficient. The
perceived extent of the stimulated skin area on the forearm decreased over these repetitions.
Stolle reasoned that these perceptual changes point to alterations in the cortical representation
of the stimulated area in somatosensory cortex.
3 Tactile illusions: Saltation and apparent movement
24
Blankenburg et al. (2006) used functional magnetic resonance imaging (fMRI) to test
whether activities in somatosensory cortex (presumably area 1 of SI) represent the physical
location of saltatory stimuli (multiple stimuli at each of three locations) or the perceived
(illusory) location. He found that activation in contralateral SI was somatotopically
corresponding to the illusory stimulus location and even the level of activation didn’t differ
from veridical stimulation.
3.1.3 Saltation in other senses
Systematic mislocalizations of stimuli dependent on ISI also take place in vision and audition.
Audition In one of the first experiments addressing auditory saltation Sherrick (cited in
Geldard, 1975) required subjects to discriminate between sequentially presented clicks along
an array of seven equally spaced loudspeakers on an arc that span 45 degree to the left to 45
degree to the right front side of the body with either one click to each or multiple clicks to
some of the seven loudspeakers. The larger the number of clicks on one loudspeaker the more
correct discriminations were obtained.
Bremer, Pittenger, Warren and Jenkins (1977) used the original rabbit paradigm–multiple
pulses at three locations–and judgments of equal spatial distribution of the displaced stimuli
to demonstrate the dependence of the saltatory phenomenon on ISI in the auditory sense.
Fractionation data display a linear relationship between ISI and the amount of mislocalization,
like in touch (Geldard, 1975, 1982).
When stimuli are delivered via headphones, they need to be presented binaurally with sub-
millisecond interaural time difference (ITD; Shore, Hall & Klein, 1998) or with an interaural
level difference (ILD; Phillips & Hall, 2001) to produce the saltatory illusion. (Note: Dichotic
clicks, separated by short ITDs are perceived as being lateralized to the side of the first click.
Shore et al. (1998) presented eight dichotic clicks, the first four having an ITD to favour the
right ear and the last four having an ITD to favour the left ear and vice versa. When dichotic
clicks are presented with a certain ILD, i.e. with different loudness, the click is localized
towards the ear where the louder click is presented). For dichotic stimuli, saltation is vivid in
the ISI range of 30-150 ms (Phillips & Hall 2001; Phillips, Hall, Boehnke, & Rutherford,
2002; Shore et al., 1998). A quite similar time interval (50-150 ms) was reported by Bremer et
3 Tactile illusions: Saltation and apparent movement
25
al. (1977) who used speakers arranged on a horizontal array (the middle speaker in the sagittal
plane of the subject, the outer speakers 24° to either side of the sagittal plane) to present the
clicks or by Hari (1995) who demonstrated saltation with binaural clicks (half left-ear, half
right-ear leading) at ISIs between 30 and 120 ms. This time interval is much smaller than the
corresponding interval in touch (20-300 ms) and vision (0-300 ms). It should be noted though,
that Geldard (1975) reports a much larger range of ISI where saltation was observed: ~50-420
ms. The difference might derive from the fact that Sherrick (in Geldard, 1975) presented the
auditory stimuli on the left body-halve only whereas in the other experiments trains of clicks
were presented either on a horizontal array that span the body-midline (Bremer et al. 1977) or
binaurally with certain ITDs or ILDs which resulted in clicks, moving from one body-side to
the other (Phillips & Hall 2001; Shore et al. 1998; note that Sherrick also used a speaker array
that extended across the front of the body, but in this experimental setting, the ISIs he used for
creating saltation only ranged between 25 and 80 ms). Another difference between Sherrick’s
experiments and those performed by others is the response paradigm: While Sherrick used the
method of fractionation other experimenters (Bremer et al., 1977; Phillips & Hall 2001; Shore
et al., 1998) used ratings of evenness or continuity of motion produced by the displaced
stimuli to verify the saltatory effect. Yet, it is noteworthy, that auditory saltation travels across
the body-midline (however at lower ISIs), in touch and in vision, it does not. Phillips and Hall
(2001) try to explain this finding with the existence of large populations of neurons in the
forebrain auditory system that have spatial receptive fields that span the left and right sensory
hemifields and thus span the complete area between the motion endpoints. But as long as the
level of processing which is responsible for producing auditory saltation is not investigated
further (e.g. saltatory areas have not been determined yet in the auditory sense) this
explanation remains theoretical.
Another psychophysical measure of saltation that we modified slightly to use in one of our
experiments, was introduced by Kidd and Hogben (2004): They elicited the saltatory illusion
by trains of dichotic clicks with an ITD of 0.8 ms–four clicks favouring the left ear and four
clicks favouring the right ear (but note that the temporal intervals are much shorter than those
used in other studies of saltation). Subjects had to compare these saltatory stimuli against
“real” motion stimuli that were generated by dichotic clicks with linear varying ITDs (-0.8 to
0.8 ms) and had to decide in a paired-comparison paradigm whether they perceived saltatory
or “real” movement. Discrimination performance was found to depend on ISI, with the
highest percentage of correct discriminations reached at the highest ISI (120 ms). Other
studies, using quality ratings of motion confirmed that when ISI is small–less than 50 ms–the
3 Tactile illusions: Saltation and apparent movement
26
quality ratings for saltatory and continuous motion are nearly similar (Boehnke & Philips,
2005; Philips et al., 2002).
As in touch, the number of stimuli delivered to one location has an effect on the
perception of saltation: The more stimuli (2-5 clicks produced by speakers) were delivered to
each location, the less uniform was the distribution of clicks (Bremer et al., 1977). In
addition, with increasing number of stimuli per location, the ISI needed to create the saltatory
illusion decreases: Shore et al. (1998) report an ISI of about 105 ms as the largest number that
can evoke saltation with 8-click trains, Phillips et al. (2002) report an ISI of about 120 ms for
6-click trains.
Direction of stimulation doesn’t seem to be crucial for generating the saltatory illusion in
audition: Saltation occurred in the horizontal plane (e.g. Phillips et al., 2002) as well as in the
vertical midsagittal plane (Boehnke & Phillips, 2005). The range of ISI that was required to
produce saltation was about the same for stimuli that moved up or down the vertical
midsagittal plane or the horizontal plane. The fact that illusory saltatory motion can be
produced in the vertical and azimuthal plane is important, because localization in the two
cases is based on different processes: Stimuli in the azimuthal plane can be localized by
differences in interaural time or interaural level differences. Stimuli in the midsagittal plane
cannot be localized using those stimulus cues, a much more complicated process of analysing
differences in the spectral content of the stimuli is involved here (see Boehnke & Phillips,
2005).
Summarizing these results, it seems that auditory saltation needs a spatial representation
of stimuli either generated by binaural stimulus information (based on interaural time or
interaural level differences) or monaural spatial information (Boehnke & Phillips, 2005;
Phillips & Hall, 2001; Phillips et al., 2002).
But new research has shown that saltation even occurs in pitch perception, a non-spatial
dimension, and follows the same regularities: The saltatory illusion was stronger for stimuli
presented closely in time (short ISIs) and at small spectral distances, i.e. more similar
frequencies, which can be seen as an analogue to smaller spatial distances (Getzmann, 2007).
The mechanisms underlying auditory saltation are still not completely clear. Both, low-
level and central-level explanations, as well as cognitive approaches (perceptual grouping)
have been discussed (e.g. Boehnke & Phillips, 2005; Getzmann, 2007; Phillips et al., 2002).
3 Tactile illusions: Saltation and apparent movement
27
Vision Unfortunately there are very few publications about visual saltation (e.g. Brassel,
1993; Geldard, 1975, 1976; Lockhead, Johnson, & Gold, 1980). In early experiments LEDs
(light-emitting diodes) that were arranged horizontally and emitted brief flashes of light were
used as visual stimuli.
A precondition for the saltatory phenomenon in vision is that the visual stimuli do not fall
at or near the fovea (Geldard, 1975, 1976). Only when they fall on the peripheral retina,
saltation can be observed, presumably because of the high spatial resolution of the fovea.
The relationship between ISI and amount of mislocalization proved to be curvilinear. The
gradient of the fractionation lines varies with the degree of eccentricity of fixation: The
further away from the fovea the light spots are projected, the larger the range of ISI where
saltation occurs. At ISIs close to 300 ms, when stimuli fall 40° from the fovea, stimuli are
perceived at their veridical position–the same temporal limit for saltation as in touch
(Geldard, 1976). SDs up to 100 ms were feasible to create the saltatory illusion.
Separation of stimuli is also an important variable: Saltatory leaping was observed for
visual angles up to 25°. In this case, stimuli were horizontally disposed slits, arranged one
upon the other. When size of jump and distance in-between stimuli were expressed in terms of
visual angle, a bell-shaped curve described the relationship between those two variables
(Geldard, 1976).
Limited saltatory areas could also be found in vision: Saltation did not cross the body
midline, like in touch (Geldard, 1975, 1976): When both stimuli were presented on the
vertical axis, one on one side of the body, the other one on the other side, saltatory leaping
across the midline of the visual field could not be observed.
When the two visual stimuli (light spots) span the blind spot of the eye, a displaced
stimuli can still be perceived in-between them (Geldard & Sherrick, 1986; Lockhead et al.,
1980). This was analogous to the experiments in which saltatory leaps could be observed in
an anesthetized skin area. Because these experiments provide evidence that receptors are not
required at the site at which the illusory stimulus is perceived, a peripheral origin of the
saltatory phenomenon can be excluded.
Another proof for the central seat of the saltatory phenomenon was seen in the fact that
saltation could be observed when P2 fell on one retina and P3 on the corresponding field of
the other (Geldard & Sherrick, 1983).
Brassel (1993) showed that the range of ISI in which visual saltation occurs is
significantly higher for chronic male schizophrenics (350-500 ms) compared to mixed
psychiatric patients (150-320 ms) and a normal control group (60-320 ms). Also, repetitive
3 Tactile illusions: Saltation and apparent movement
28
stimulation (rapid flickering) at L2 lead to an increase of ISI where saltation was perceived in
the normal control group whereas in the mixed psychiatric group 46% and in the
schizophrenics group 63% didn’t to show a corresponding change. This difference was
significantly related to memory impairments in the two psychiatric groups. Theses results not
only support the assumption that central mechanisms are responsible for the saltatory
phenomenon, but also recommend the use of saltation as a model to diagnose psychiatric
disorders and study neuronal timing in humans.
A specific characteristic of saltation in vision is what Geldard (1976) calls the “dip”:
When saltatory stimulus patterns were observed over a longer period of time (10 minutes),
after about a minute of repetitive exposure, the amount of displacement of P2 suddenly
declined and afterwards increased again to approximately the initial level. To this day, the
“dip” lacks an explanation and has not been found in cutaneous or auditory saltation.
Experiments have been conducted to test the hypothesis that light or dark adaptation
processes might account for the “dip”, but without a definite outcome.
3.2 Apparent movement
Apparent movement is an illusion that can be found in the visual, auditory, and tactile sensory
system. The illusion of continuous movement when two or more stimuli separated in space
are activated sequentially was first described in vision and is known as the “phi
phenomenon”. At appropriate spatial and temporal intervals sequentially presented stimuli
seem to merge to a continuous, uninterrupted sensation of apparent motion (e.g. Burtt, 1917b;
Kirman, 1974a, 1974b; Sherrick & Rogers, 1966).
3.2.1 Spatio-temporal characteristics of tactile apparent movement
One of the first studies on apparent tactual movement was carried out by Benussi (1916; see
Burtt, 1917b), who varied spatio-temporal stimulus parameters to obtain “pure” movement.
But in contrast to the visual system, in the tactual system, early studies, using point stimuli,
failed to produce continuous movement, only partial movement could be observed (see
summary in Sherrick, 1968a). Later studies that used vibrotactile stimuli were successful in
producing good haptic movement. The different stimuli–point stimuli versus vibrotactile
3 Tactile illusions: Saltation and apparent movement
29
stimuli–excite different mechanoreceptors which display different capabilities of spatial
resolution: Whereas especially PC receptors respond to vibration, but do not provide useful
spatial information, RA and SAI receptors are excited by dynamic skin deformation
respectively sustained indentation and display a sharp isomorphic representation of tactile
patterns (Johansson, 1978; Hsiao et al., 2003). It is likely that mechanoreceptors, activated by
point stimuli, prevent single stimuli from melting together to a percept of uninterrupted
movement, because of their ability to resolve fine spatial detail. In addition, vibration
produces travelling waves deep in the dermis and epidermis, where PCs are located, that may
activate distant receptors, and thus enable punctate stimuli to merge.
Temporal limits Sherrick (1966, 1968) found a linear relationship between stimulus duration
(SD) and interstimulus onset interval1 (ISOI, which is the time between the onset of the first
and the onset of the second stimulus) when he asked subjects to adjust ISOI to a value where
continuous, uninterrupted movement between two vibrating stimuli was perceived–at least for
stimulus durations greater than 25 ms. For longer SDs (>100 ms) more temporal overlap in
the activation of successive stimulators is required.2
Other studies with two stimulators–using a different response paradigm (categorization of
movement from “movement was impressive and continuous” to “no movement at all”;
Kirman, 1974a, 1974b)–showed that as ISOI was increased, movement judgments increased
to a maximum value and then decreased (except for very short SDs <10 ms). However, this
interaction between the number of stimuli and ISOI disappeared, when more than two stimuli
were used (Kirman, 1974a).
When SD was increased, better movement judgments were obtained, the ISOI value for
optimal apparent movement shifted to higher values (Kirman, 1974a, 1974b, 1975), and the
ISOI range where uninterrupted movement was perceived became wider (Kirman, 1983;
Szaniszlo et al., 1998). Thus, a significant interaction between SD and ISOI was found by
Kirman (1974a, 1975). The impact of SD is stronger for two-stimulus patterns than for
multiple-stimulus patterns (Szaniszlo et al., 1998). Sherrick and Rogers (1966) generated
percepts of continuous movement with SDs up to 400 ms, but, according to Kirman (1974b)
the impression of apparent movement reaches its maximum degree at SDs < 200 ms, which is
the highest SD value used in most experiments.
1 In contrast to saltation experiments, most researchers used ISOI instead of ISI as a temporal variable in studies on apparent movement, as temporal overlap was thought to affect apparent motion. 2 ISOI (interval between stimulus onsets) is the addition of SD (stimulus duration) and ISI (interval between the end of the first and start of the second interval); if ISI instead of ISOI would be plotted against SD, a negative relationship would emerge: As SD increases, ISI that produces optimal apparent movement decreases.
3 Tactile illusions: Saltation and apparent movement
30
Optimal ISOI values vary in the experiments reported above. These variations are
presumably due to differences in the tactile stimuli used: Different contactor sizes, square
wave or sinusoidal pulses and different test sites–although the latter variable only exerts a
minor influence due to Sherrick (1968).
When only two vibrating probes were activated, percepts of good apparent motion
decrease when the velocity of movement was increased (Szaniszlo et al., 1998). But when
additional stimuli were applied–and thus the total path length was increased–velocity of
movement didn’t affect the quality of motion.
The velocity of movement also exerts an influence on the perception of straightness and
length of a line that was produced by a moving stylus on the forearm (Langford, Hall &
Monty, 1973): When the rate of movement was decreased, deviation from a straight line
increased, i.e. the line felt more curvy and bent; in addition, reported length of the line
decreased, as rate of movement increased. Langford et al. (1973) tried to explain this finding
with inhibitory processes: Stimuli with a rapid onset might inhibit laterally spreading
stimulation and thus feel more centralized, that is straighter and shorter.
Test site/direction The optimal ISOI for “best” apparent movement varied only marginally
with the body site being tested: Thigh, forearm, back, stomach, fingertip or palm of the hand
(Sherrick, 1968a).
Direction of apparent movement didn’t have an effect on the quality or temporal
parameters for good apparent movement (Sherrick, 1968a). There appears to be only one
study, that examined, if tactile apparent movement crosses the body-midline without being
degraded: Sherrick (1968b) found that movement qualitatively declined, when stimuli were
presented bilaterally (on both forearms), but the relation between SD and ISOI remained
constant, compared to unilateral stimulation. Sparks (1979) notes that when apparent
movement crossed the abdominal midline, directional sensitivity decreased. However, he
didn’t vary systematically the positioning of the electrotactile array, this result was detected
rather accidentally, when he varied inter-stimulus spacing.
Number of stimuli/distance between stimuli Percepts of motion can be generated with only
two stimulators. When Sherrick (1968a) varied the distance in-between two vibrating stimuli
from 12 to 40 cm, the ISOI value for continuous movement didn’t change, although, the
movement was faint in the middle of the trajectory when the distance increased. Szaniszlo et
al. (1998) using vibrating probes on the face, spaced 0.4-2.5 cm apart found the same result:
3 Tactile illusions: Saltation and apparent movement
31
The distance in-between two successively activated stimuli does not affect goodness of
motion or the range of ISOI where good motion was obtained. In contrast, Burtt (1917b),
using two point stimuli, found that the longer the temporal interval between stimuli, the
greater the distance in-between stimuli must be to get the impression of uninterrupted
movement. Maybe the type of stimuli used in these experiments, point stimuli (Burtt, 1917b)
versus vibrating stimuli (Sherrick, 1968a; Szaniszlo et al., 1998) accounts for the different
findings.
Increasing the number of stimuli resulted in better movement judgments (Kirman, 1974a,
1975). In addition, an interaction between the number of stimuli and ISOI was found: When
more stimuli were used, then ISOI has to be decreased to obtain continuous movement
(Kirman, 1975, 1983). Szaniszlo found the same result, but only when he kept the total path
length constant and varied only the number of stimuli. When he varied the path length by
applying more stimuli, the range of ISOI values where good movement was perceived
remained unaltered. In this case, the amount of temporal overlap between multiple
successively activated stimuli proved to be more crucial than when only two stimuli were
activated, especially for longer SDs (>50 ms). Another contradictory result was reported by
Sherrick (1968): Adding stimuli increases the range of ISOI where good apparent movement
can be obtained. SD however did not interact with the number of stimuli, except for very short
stimulus durations (< 35 ms; Szaniszlo et al., 1998; see also Kirman, 1975).
In these studies, the distance in-between stimuli was confounded with the number of
stimuli: It was therefore not possible to determine if the increasing number of stimuli or the
simultaneous decrease of the interstimulator spacing accounted for the better movement
judgments. But Kirman (1975) assumes that, as earlier studies (Sherrick & Rogers, 1966)
didn’t show an effect of interstimulator spacing on the optimal ISOI value for apparent
movement, it is more likely that the number of stimuli is responsible for the enhancement of
movement judgments.
Stimulus frequency In Sherrick’s experiment (Sherrick, 1968a), subjects had to adjust the
ISOI to produce “best” (meaning the longest uninterrupted) tactual movement between two
vibrotactile stimuli that were delivered to the distal thigh with a stimulus duration of 200 ms.
Variation of stimulus frequency (60, 150, and 250 Hz) had no effect on the quality of
movement or the optimal ISOI value for obtaining “best” movement.
3 Tactile illusions: Saltation and apparent movement
32
Direction discrimination Direction discrimination (that is the capability to differentiate
between opposing directions of stimuli moving across the skin) is known to be influenced by
the type of stimulus used in an experiment: Stimuli may vary in the amount they stretch and
translate the skin. They either move naturally or movement is simulated by presenting stimuli
successively (Essick, 1998). We will now concentrate on the latter type of stimuli, as this type
will be used in our experiments.
Subjects’ ability to discriminate the direction of a moving tactile stimulus depends
primarily on the number of pulses, not on the spatial or temporal dimensions–interstimulus
spacing, path length or interstimulus interval–of the stimulus pattern (Gardner & Sklar, 1994).
Discrimination accuracy increases with increasing number of pulses delivered by an
OPTACON3 stimulator and reaches near-perfect performance, when eight or more stimuli are
sequentially activated. When only two pulses are presented, discrimination performance is
random, irrespective of interstimulus spacing (1.2 – 4.8 mm in Gardner’s experiments; note
that 4.8 mm exceeds any threshold measure for tactile spatial acuity; ISOI was 20 ms).
Consequently, it does not seem to matter whether overlapping or distinct groups of cutaneous
afferents are excited. Rather, the number of activated mechanoreceptors and thus the amount
of information transferred is critical (Essick, 1998). Gardner and Sklar (1994) conclude that
“direction discrimination is not simply a matter of point localization on the skin, but rather
appears to involve the integration of a spatiotemporal sequence, in which additional inputs
improve the accuracy of performance” (p. 2426).
According to Essick (1998), the width of a stimulus affects direction discrimination:
Discriminability was poorer for stimuli that are wider in the direction of motion. Additionally,
for wider stimuli, faster velocities are needed to reach the same discrimination performance,
as for narrower stimuli. The width of a stimulus perpendicular to the direction of motion is
also crucial for direction discrimination. Sparks (1979) showed that when the
electrocutaneous stimuli he was testing consisted of rows of four electrodes, one above the
other, discrimination performance was better than when stimuli consisted of a single
electrode.
ISOI has only a minor effect on direction discrimination (direction discrimination for an
ISOI of 20 ms is somewhat better than discrimination for an ISOI of 40 ms or 10 ms).
Velocity or duration of movement didn’t affect discriminability. But, in Gardner’s and Sklar’s
3 The OPTACON is a tactile array that serves as sensory substitution aid for blind and deaf people. It consists of 144 vibrating probes, arranged in a matrix of 6 columns and 24 rows (size of the array: 11 x 26 mm). Text or speech can be translated into vibrating patterns that are presented to the finger.
3 Tactile illusions: Saltation and apparent movement
33
experiment (1994) path length, stimulus timing and spacing were varied simultaneously.
When the number of stimuli and interstimulus spacing are held constant, and only ISOI is
varied, duration of movement influences direction discrimination in such a way that percent
correct discriminations increased with increasing duration of movement (increasing ISOI)
(Sparks, 1979). Essick (1998) found an inverted U-shaped function between directional
sensitivity and stimulus velocity. When investigating the threshold length for direction
discrimination with a dense-array stimulator (built from two OPTACON arrays) Essick
(1998) found that “direction was discriminated, when the product of the length of skin
traversed and the duration of stimulation attained a criterion” (p. 45). The different results
reported above might be due to the different experimental settings (number of pulses
delivered to each contactor, test site, experimental variables to be varied, e.g. varying only
ISOI or also the distance in-between contactors).
The site of skin tested is also crucial for direction discrimination: There is a strong
positive correlation between innervation density and discriminability on the forearm (Gardner
& Sklar, 1994). On less-well innervated test sites like the abdomen more stimulators (and thus
more activated receptor units) are required for better direction discrimination (see also Sparks,
1979). These findings suggest that there is a topographical pattern of variations in directional
sensitivity – as it is for vibratory thresholds (see Figure 2.2) or error of localization – that is
correlated to innervation density and cortical representation of skin areas (see e.g. Essick &
Whitsel’s, 1985 results for natural moving stimuli).
Directional sensitivity is independent of the orientation of motion. Sparks (1979) used a
tactile display that consisted of rows of several electrodes that were placed on the skin in an
either horizontal or vertical direction. Discrimination performance was found to be nearly
identical for both orientations. Note that electrocutaneous stimuli may activate all neurons in
range of the contactor, whereas mechanical stimuli used in other studies excite predominantly
specific populations of mechanoreceptors, depending on stimulus features like type of stimuli
or stimulus frequency. In particular the use of bipolar current–like in Spark’s study–produces
sensations difficult to localize, as cathodic (negative) current excites axons parallel to the skin
surface and thus suggests to the brain that the mechanoreceptor at the end of the axon has
been stimulated. Thus the veridical point of electrocutaneous stimulation may differ from the
locus of sensation (Kajimoto, Kawakami, Maeda, & Tachi, 2001), which is usually not true
for mechanical stimulation.
3 Tactile illusions: Saltation and apparent movement
34
3.2.2 Explanatory approaches for tactile apparent movement
Responses of cutaneous mechanoreceptors to tactile apparent motion When movement is
simulated by successive activation of stimuli (bar patterns produced by OPTACON) on
glabrous primate skin, rapidly adapting afferents (RA) and Pacinian corpuscles are excited,
but slowly adapting afferents are not. About 25% of RAs show responses that are observed in
only one specific direction of motion. PCs encode the direction of motion mainly by changing
their receptive field size. Receptive field boundaries of RAs and most PCs shift in the
direction of motion, indicating facilitation of receptor potentials between adjacent receptive
fields. Essick (1998) suggests that information about the direction of a moving stimulus is
largely transferred by the number and sequence of sequentially activated stimuli, as other
aspects like variations in discharge intensities and patterns due to changes in direction only
play a negligible role4.
Total spike output of RAs and PCs doesn’t vary significantly with speed of motion (30-
120 mm/s), but their firing rates increase with faster velocities of movement (Gardner &
Palmer, 1989a; see also Essick & Edin, 1995, using a brush stimulus). Receptor units of
different skin types–glabrous versus hairy skin–are variably responsive to changes in the
speed of a natural moving object (brush): Mechanoreceptors innervating hairy skin appeared
to be more responsive than those innervating glabrous skin (Essick & Edin, 1995), although
the experimenters suppose that this might also be due to differences in skin compliance. Hair
follicle afferents, which are sensitive to hair movement (Greenspan & Bolanowski, 1996)
appear to be jointly responsible for the detection of motion (Hamalainen, Warren, & Gardner,
1985), and they also display different response rates to different directions of natural
movement (Greenspan, 1992; Vallbo et al., 1995).
The width of a stimulus (here: number of activated rows on the OPTACON) is encoded
by RAs total spike output, i.e. wider stimuli lead to an increase in the duration of firing
(Gardner & Palmer, 1989b). The same is true for PCs, but, in contrast to RAs, 50 % of PCs
summate responses when wider stimuli are presented. Stimulus spacing (<5 mm) of a moving
bar pattern also accounts for total spike output of RAs: Widely spaced bars evoke stronger
responses (more spikes per sweep) than closely spaced bars and furthermore activate a larger
population of RAs. PCs on the other hand show only little change in the number of spikes per
4 Note that we only discuss apparent motion produced by successive stimuli here. In case of natural moving stimuli, we would have to consider also the role of SA II units, because they show a directional sensitivity to lateral skin stretch in their discharge pattern (Johansson, 1978; Johnson et al., 2001).
3 Tactile illusions: Saltation and apparent movement
35
sweep when stimulus spacing is varied; thus they fail to differentiate spatial details of the
stimulus pattern.
Responses of somatosensory cortical neurons to tactile apparent motion According to
Gardner, Palmer, Hämäläinen, and Warren (1992; see also Gardner & Palmer, 1989a), who
used OPTACON stimuli on the glabrous skin of the monkey hand, the temporal frequency of
stimulation defines the cortical firing patterns (note: Cortical neurons show a much stronger
dependency on stimulus frequency than cutaneous mechanoreceptors): Low-frequency stimuli
produce more spikes per sweep and are tightly locked to the stimulus pulses, meaning bursts
of impulses and silent intervals in cortical neurons reflect the interstimulus intervals of the
OPTACON stimuli. Low-frequency stimuli (25 Hz → ISOI of 40 ms → velocity of 30 mm/s)
thus feel more punctuate. High-frequency stimuli (100 Hz → ISOI of 10 ms → velocity of
120 mm/s) on the other hand produce more uninterrupted, smooth movement, because cortical
neurons fire more continuously at lower, weakly modulated firing rates. Here, cortical
responses to consecutive stimuli seem to merge. Also, there seems to exist a central
mechanism that reduces firing rates of RAs and PCs when successive stimuli are presented at
high velocities.
Receptive field size of cortical neurons also varies with temporal frequency: The
dimensions of the receptive field was found to expand with slower velocity of stimulation
(Gardner & Palmer, 1989a). The reduction of firing rates and the contraction of receptive
fields at smaller ISIs (higher velocities), brought Gardner and Palmer (1989a) to the
assumption that a time-dependent inhibitory process (strong inhibition at short ISIs), links
successive stimuli and leads to the perception of continuous apparent motion.
Discriminating the direction of natural moving stimuli In primary somatosensory cortex
SI (mostly in areas 3b and 1), there are direction-sensitive neurons which signal the direction
of movement by their excitatory responses (Constanzo & Gardner, 1980; Essick & Whitsel,
1985; Whitsel, Ropollo, & Werner, 1972). They have quite large receptive fields–often
covering the entire hand or arm–on glabrous and hairy skin and their response properties are
alike on both types of skin. They also encode the width of the stimulus, most of them showing
stronger responses to broad edges than to narrow edges. Velocity of movement has only little
effect on the mean firing rates of direction-sensitive neurons (Costanzo & Gardner, 1980;
stimuli were metal or plastic edges that were moved over the skin of the forearm or hand).
Directional sensitivity seems to be best for velocities between 1 and 30 cm/s. One class of
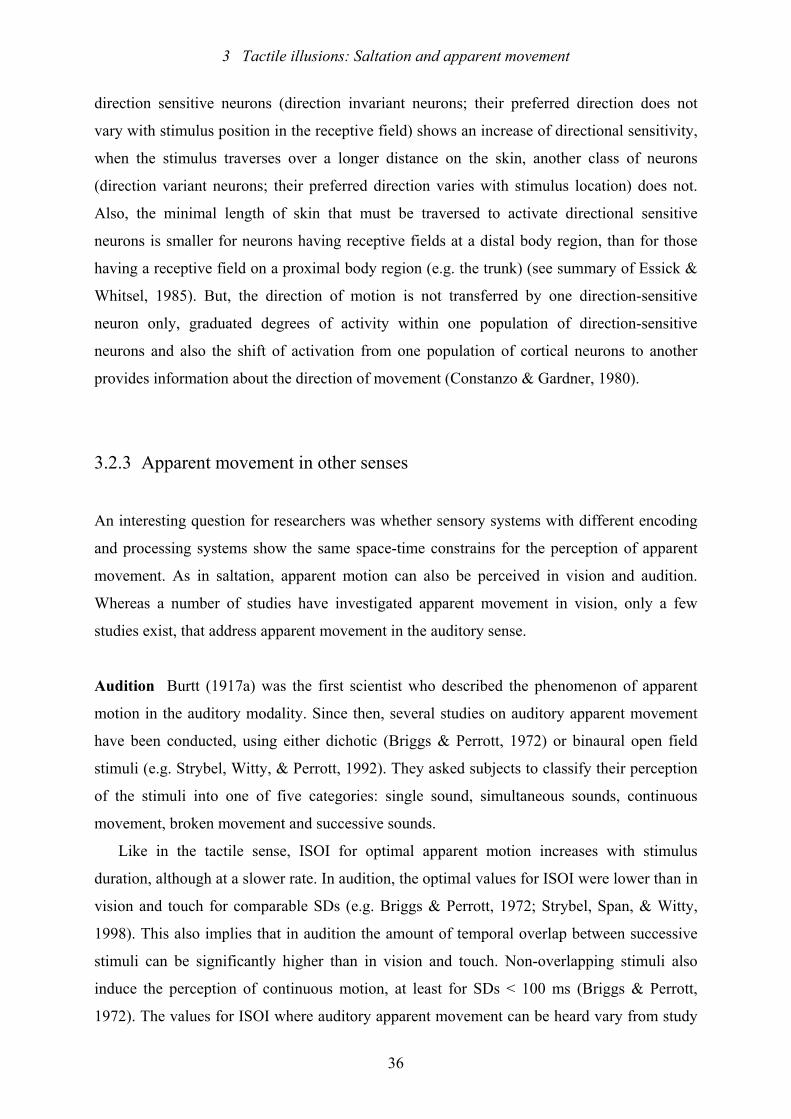
3 Tactile illusions: Saltation and apparent movement
36
direction sensitive neurons (direction invariant neurons; their preferred direction does not
vary with stimulus position in the receptive field) shows an increase of directional sensitivity,
when the stimulus traverses over a longer distance on the skin, another class of neurons
(direction variant neurons; their preferred direction varies with stimulus location) does not.
Also, the minimal length of skin that must be traversed to activate directional sensitive
neurons is smaller for neurons having receptive fields at a distal body region, than for those
having a receptive field on a proximal body region (e.g. the trunk) (see summary of Essick &
Whitsel, 1985). But, the direction of motion is not transferred by one direction-sensitive
neuron only, graduated degrees of activity within one population of direction-sensitive
neurons and also the shift of activation from one population of cortical neurons to another
provides information about the direction of movement (Constanzo & Gardner, 1980).
3.2.3 Apparent movement in other senses
An interesting question for researchers was whether sensory systems with different encoding
and processing systems show the same space-time constrains for the perception of apparent
movement. As in saltation, apparent motion can also be perceived in vision and audition.
Whereas a number of studies have investigated apparent movement in vision, only a few
studies exist, that address apparent movement in the auditory sense.
Audition Burtt (1917a) was the first scientist who described the phenomenon of apparent
motion in the auditory modality. Since then, several studies on auditory apparent movement
have been conducted, using either dichotic (Briggs & Perrott, 1972) or binaural open field
stimuli (e.g. Strybel, Witty, & Perrott, 1992). They asked subjects to classify their perception
of the stimuli into one of five categories: single sound, simultaneous sounds, continuous
movement, broken movement and successive sounds.
Like in the tactile sense, ISOI for optimal apparent motion increases with stimulus
duration, although at a slower rate. In audition, the optimal values for ISOI were lower than in
vision and touch for comparable SDs (e.g. Briggs & Perrott, 1972; Strybel, Span, & Witty,
1998). This also implies that in audition the amount of temporal overlap between successive
stimuli can be significantly higher than in vision and touch. Non-overlapping stimuli also
induce the perception of continuous motion, at least for SDs < 100 ms (Briggs & Perrott,
1972). The values for ISOI where auditory apparent movement can be heard vary from study
3 Tactile illusions: Saltation and apparent movement
37
to study, but are in the range of 20-100 ms (depending on SD) for monaural and binaural
listening conditions (Strybel & Neale, 1994). Figure 3.3 plots apparent motion in the visual,
tactual, and auditory sense as a function of ISOI and SD (here called signal duration). Optimal
values for ISOI decrease with smaller SDs in all three senses, but the functions for the visual
and tactile senses are much steeper than in the auditory sense.
Figure 3.3: ISOI values for optimal apparent movement in the visual, tactual and auditory modalities
as a function of SD. The data for visual apparent movement originate from Neuhau’s (1938)
experiment, those for tactual apparent movement from Sherrick’s (1968) experiment and those for
auditory apparent movement from Briggs’ and Perrott’s (1972) experiment.
From: Briggs & Perrott, 1972, p. 90.
Longer SDs produce more frequent reports of continuous motion, just as in touch. SDs
optimal for apparent motion differ in the auditory and visual sense. There seems to be a
minimum SD (approx. 25 ms; Strybel et al., 1998) to generate apparent movement in audition.
This minimum SD value is not affected by the spatial separation between the auditory stimuli.
In vision, the minimum SD value for apparent motion can be as low as 5 ms (Strybel et al.,
1992). The number of sound sources (two or three) did not affect the perception of continuous
motion nor were any interactions with temporal variables found (Strybel & Neale, 1994).
The distance between two auditory stimuli does not affect the quality of motion, nor the
ISOI range where continuous motion can be perceived (for auditory separations between 6
and 160 degrees and ISOIs between 20 ms and 45 ms; Strybel & Vatakis, 2004), equivalent to
3 Tactile illusions: Saltation and apparent movement
38
touch, but different to visual movement, where the spatial separation between two stimuli
determines the range of ISOIs where continuous motion can be generated (Strybel, Manligas,
& Perrott, 1989; Strybel et al., 1992; Strybel & Vatakis, 2004). Whereas in vision there is a
narrow limit for the spatial separation between two stimuli where motion can be perceived,
this limit is much wider for the auditory sense; auditory stimuli can be separated from 2.5° up
to 160° (Strybel et al., 1992; Strybel & Neale, 1994). This is true for binaural listening
conditions. For monaural listening conditions, the quality of motion decreases with increasing
interstimulus distance (Strybel et al., 1989), and continuous motion can only be heard with
separations from 10° to 80° (Strybel & Neale, 1994).
The order of stimulus presentation (left to right or vice versa) does not affect the quality of
perceived movement nor directional sensitivity (Strybel et al., 1989). Apparent motion can be
heard in the horizontal as well as in the midsagittal plane (Strybel et al., 1998). This is also
true in touch.
Discriminability of the direction of motion is independent of ISOI when the distance
between stimuli exceeds the minimum audible angle (that means the minimum distance where
subjects are able to discriminate between the locus of two sounds; Briggs & Perrott, 1972). In
vision, discrimination of direction of motion is affected by distance and ISOI (see review in
Strybel & Vatakis, 2004). In contrast to previous research, Strybel & Vatakis (2004) showed
that SD and ISOI affected direction discriminability in the same way in the visual and
auditory sense. In touch, the effect of ISOI is ambiguous, depending strongly on the type of
stimulus used. Lakatos and Shepard (1997) who compared direction discriminability in the
visual, tactile and auditory sense found that in all three senses the critical ISOI needed to
discriminate direction increased with interstimulus spacing, although the slope of the function
varied between the senses. In touch, ISOI increases fastest, compared to the other two senses.
Direction discriminability does not vary with the distance (>10°) between two
successively presented stimuli for binaural listening. For monaural listening, direction
discrimination barely exceeds chance for separations up to 40° centered about the body
midline (Strybel et al., 1989).When more sound sources are involved (three instead of two),
discrimination performance increases (Strybel & Neale, 1994). Discrimination performance
also depends on the plane of separation: Direction was more frequently determined correctly,
when the auditory stimuli were presented horizontally (Strybel & Neale, 1994).
3 Tactile illusions: Saltation and apparent movement
39
Vision The first study on apparent motion in vision was carried out by Wertheimer 1912. He
used simple figures that were presented successively to produce the perception of apparent
movement in vision. Korte investigated in 1915 the correlations between optimal apparent
movement and stimulus duration, interstimulus interval, distance in-between stimuli and
stimulus magnitude. The resulting relationships between those variables are known as
“Korte’s laws” (see summary of Burtt, 1917b or Sherrick, 1968a).
According to Gardner et al. (1992) the major difference between apparent motion in touch
and vision is the ISI at which successively presented stimuli merge to the percept of
continuous motion: In vision the ISI is smaller than 160 ms, in touch it has to be lower than
20 ms. Apart from this fact, visual stimuli that are perceived as distinct events produce
cortical responses in striate cortex and middle temporal cortex that are similar to those from
cortical neurons in SI. Spatially, apparent motion was reported up to 7° of visual angle spatial
separation (at proper timing parameters) and the illusion is still vivid when it crosses the
body-midline (Naikar & Corballis, 1996).
One explanation for apparent movement is provided by Ramachandran and Anstis (1986):
The visual system looks for “correspondence” in successive pictures, i.e., the brain compares
the pictures, and when they differ only slightly, the illusion of motion can be generated. In
contrast to the previous view that presumes that the brain compares each element of the
pictures, Ramachandran and Anstis (1986) believe that the illusion of motion is created in
earlier stages of visual processing and only salient features of the pictures are compared.
Another way of facilitating the comparison is to look for perceptions that also occur in the
real world, e.g. to assume that moving objects usually continue their path linearly instead of
suddenly changing their direction.
Recent research (e.g. Kaneoke, Bundou, Koyama, Suzuki, & Kakigi, 1997; Kawakami,
Kaneoke, & Kakigi, 2000; Muckli, Kriegeskorte, Lanfermann, Zanella, Singer, & Goebel,
2002; Zhou, Zhou, Rao, Wang, Meng, Chen, et al., 2003) found a cortical region in the human
brain that was activated by apparent as well as real motion (middle temporal area MT/V5),
although response latencies differ for real and apparent motion. It seems that long-range
apparent motion activates additional cortical areas, compared to short-range apparent motion
(implying smaller displacement, usually less than 0.25° of visual angle, and faster alteration
of successive stimuli in contrast to long-range apparent motion) (Zhou et al., 2003). Larsen,
Kyllingsbæk, Law, and Bundesen (2005) conclude from their experiments, that MT is always
3 Tactile illusions: Saltation and apparent movement
40
activated when stimuli are successively presented, whether or not they are connected by
apparent motion. The filling-in process that generates percepts of uninterrupted movement
“occurs in the network of visual areas with which MT is reciprocally connected rather than
occurring in MT itself” (Larsen et al., 2005, p. 1069). This notion is supported by an
experiment, where Larsen, Madsen, Lund, and Bundesen (2006) showed that the pattern of
activity in primary visual cortex (area V1), is similar for real and apparent motion; during
apparent motion, the gaps between activated sites are filled-in with activation. This filling-in
process occurs in lower visual areas (like V1), in connection with feedback from higher-level
areas. Effects of attention on shifts in activation and the magnitude of responses in MT have
been demonstrated by various authors (see summary of Greenlee, 2000).
3.3 Differences between saltation and apparent motion
Saltation produces mislocalized taps whereas phi-movement appears to be a ”gray ghost”
(Geldard, 1982; p. 139). Geldard (1975, p. 33) calls the saltation phenomenon a “Ding an
sich”, meaning that saltation produces discrete taps and can therefore never be confused with
apparent motion. Thus, saltation and Phi-movement differ in regard to their qualitative
appearance: Whereas saltation produces mislocalized taps at distinct locations on the skin,
phi is perceived as uniform and unbroken movement (Geldard & Sherrick, 1986). However,
Geldard (1982) reports that saltation and apparent movement can co-exist in perception given
the appropriate spatio-temporal stimulus parameters (ISI between 50 and 100 ms); both
illusory patterns can be compared directly by shifting one’s attention from location to
movement in the pattern. To my knowledge, in no study about apparent movement was the
occurrence of saltation reported, probably because the response paradigm didn’t allow
subjects to give an account of mislocalizations of stimuli, rather they had to concentrate on
the “goodness” of motion.
A second difference is that Phi movement can cross the body-midline at properly chosen
ISIs (<= 100 ms), but saltation never does, as experiments e.g. on the forehead show. Geldard
and Sherrick (1986) reason that “it seems clear that the neural mechanism responsible for phi
is not the one that causes saltation” (p. 94). Additionally, in apparent movement an
interaction between SD and ISI can be found (e.g. Sherrick & Rogers, 1966), that hasn’t been
3 Tactile illusions: Saltation and apparent movement
41
reported in saltation previously. Finally, saltation requires repetitive stimulation of a stimulus
location, whereas apparent motion can be produced by one stimulus at each location.
3.4 Similarities between saltation and apparent motion
Temporally, saltation occurs at ISIs between 20 and 300 ms, varying a little with the saltatory
paradigm used (multiple rabbit, reduced rabbit,…). Apparent movement is perceived at timely
separations between 60 and 200 ms. Consequently the temporal range for the appearance of
both tactile illusions is quite similar.
Both illusions are not limited to one sense alone, they both appear as well in the tactile, as
in the auditory and visual sense. It can thus be presumed, there are similar processing
mechanisms.
In one experiment Geldard (1975) varied the saltatory paradigm by delivering two stimuli
to each of three contactors that were placed on the right arm. On the left arm, six contactors
were arranged over the same distance and activated sequentially. Timing parameters were
identical for both arrangements. When subjects had to compare the two patterns that were
alternately presented, they judged them to be equivalent. The same result was found by
Cholewiak and Collins (2000) in a more comprehensive study: Quality judgments of tactile
movement–either presented by successive activation of seven tactors or by saltation–along a
linear array on the finger, forearm, and back showed, that both stimulus patterns produce
equal sensations. With body site, direction of movement (proximodistally or distoproximally),
stimulus patterns (successive activation versus saltation), SD, and ISI being the independent
variables in this experiment, only very few significant differences in the mean quality
judgments could be found between the two stimulus patterns. Only temporal stimulus
parameters (SD/ISI) had an effect on quality judgments, with only few exceptions, the other
variables did not.
These findings suggest, that–at least for arrays containing more than three activated sites–,
the two different stimulus patterns lead to similar percepts. It seems that our perception fills
in missing stimuli to create the percept of continuous motion, no matter whether each
stimulus site is activated once or multiple times.
3 Tactile illusions: Saltation and apparent movement
42
The saltatory phenomenon is not clearly distinguished from apparent movement,
mislocalization and another spatio-temporal illusion called tau-effect (see Chapter 1): The
presentation of two physically presented stimuli in quick succession is the basis of “synthetic”
or apparent movement. Depending on the time interval between two stimuli mislocalizations
occur, there might be a connection to the false estimation of tactual distance (“tau”-effect).
Although the phenomenal appearance of saltation and apparent motion might differ, both
illusions require the temporal integration of spatial location.
“One question to be faced in considering saltatory phenomena is that of the difference
between saltation and the movement illusion” (Geldard, 1982; pp. 136).
4 Content of the dissertation
43
4 Content of the dissertation Whereas saltation comprises the mislocalization of stimuli, apparent movement creates the
perception of continuous motion. Cholewiak and Collins (2000) could show that by using
tactile arrays containing several stimulus sites, appropriately chosen temporal stimulus
parameters lead to equivalent percepts of motion. The two different stimulus patterns
apparently pass through the same integration process, that fills in missing stimulus spots to
induce the percept of uninterrupted motion.
The following experiments are an expansion of the work of Cholewiak and Collins
(2000). By concentrating on one test site only (the trunk) and varying additional stimulus
characteristics (such as vibration frequency), we wanted to test which stimulus characteristics
best elicit the illusory percept of movement when two stimuli are either successively
presented (apparent motion) or presented as saltatory patterns.
There are a number of reasons why it is important to expand the study on the arm to
include the abdomen. There are important differences between the two sites. For example, the
trunk is less sensitive (higher vibratory threshold; see Figure 2.2; also less accurate point
localization and higher two-point threshold; Schiffman, 1996), it has many types of
underlying tissue (including ribs, spine, gut, and fat, which affect the travelling waves
produced by a vibrating stimulus; see Békésy, 1967), and its two sides are represented
separately in the two hemispheres of the brain.
Since a tactile array on the trunk can span both body halves, we can test whether tactile
patterns presented in the saltatory mode cross the body-midline like successively presented
stimulus patterns are assumed to do.
The results might shed further light on the processing of spatio-temporal stimuli. When
two different stimulus patterns produce equal sensations, this might be a psychophysical
indication of equal cortical representations of both patterns (compare experiments of
Blankenburg et al., 2006; Chen et al., 2003) as well as the functional relevance of cortical
topographic maps (maps correlated with perception).
The results will also be beneficial for the design of tactile torso displays (see Chapter 1).
Torso displays have the advantage, that an operator can still use both hands and has
unrestricted freedom of movement. In addition, the torso is known to provide a frame of
4 Content of the dissertation
44
reference for orientation and mobility – where the torso points is the direction in which we are
travelling, unlike the head or other more mobile body parts. There is also experimental
evidence from studies with patients with hemineglect that the trunk midline serves as physical
anchor for the identification of the body’s position with respect to external objects (Karnath,
Schenkel & Fischer, 1991).
5 Aim of the study and hypothesis
45
5 Aim of the study and hypothesis
The aim of this study is to investigate the parameters of the integration of spatio-temporal
tactile stimulus patterns into a unitary (illusory) percept of continuous motion. For this
purpose we use two different stimulus patterns: First, we successively stimulate each of a
number of test sites around the torso to elicit a percept of apparent motion, a stimulus pattern
that we will consequently call “successive activation”. Second, we create saltation by
delivering multiple stimuli to every second test site. In this case, displacement of a stimulus
towards the subsequent stimulus dependent on ISI is expected (Geldard, 1975). However,
Geldard (1982) and in more detail Cholewiak and Collins (2000) could demonstrate that
saltation can as well produce a sensation equivalent to the illusion of apparent motion, which
might show that the different stimulus patterns undergo the same integration process and
produce comparable representations in somatosensory cortex. If we find similarities in the
parameters within which the two phenomena (saltation and apparent motion) occur, these
would suggest that the dynamics of perceptual organization could be associated with a
common underlying mechanism, possibly located in somatosensory cortex. This study is an
expansion of the work of Cholewiak and Collins (2000) and is based on Wiemer’s neural
network model (1998, 2000) that states that somatosensory cortex adapts dynamically to
spatio-temporal stimulus characteristics and which is in line with Chen et al.’s (2003) and
Blankenburg et al.’s (2006) observations that illusory percepts are somatotopically
represented in cortex as an outcome of such plastic changes within neural networks. As
possible perceptual correlates of dynamic changes, we will measure judgments of the qualities
of movement (Experiment 1) and discrimination performance (direct comparison between the
two patterns to judge whether the two patterns are the same or different respectively which of
the two patterns is best in terms of continuous movement; Experiment 2).
We also want to test whether repetitive stimulation might induce changes in the cortical
representation of the stimulus patterns, which in turn affects discrimination performance when
the two different patterns are to be directly compared. Regarding saltation, previous studies
(Stolle, 2003) have already shown that a few stimulus repetitions are sufficient to cause
plastic changes that are reflected in a perceptual bias of the saltatory area.
Psychophysical characteristics of the illusion of motion might thus shed further light on
the dynamic behavior of neural networks.
5 Aim of the study and hypothesis
46
From a practical point of view the results might be instrumental in the design of
vibrotactile displays. Positioning a vibrotactile display on the torso has the advantage that the
hands of an operator are left free to handle tools or controls. On the other hand problems
might arise from the fact that due to breathing and small changes in subjects’ posture the
tactors might loose contact to the skin and therefore alter subjects’ perception. For this reason
it seems worthwhile to concentrate on the torso as a seldom-studied test site. Moreover an
array around the torso will enable us to investigate an additional variable crucial for saltation:
The crossing of the body midline.
In this study we investigate the spatio-temporal stimulus characteristics which are optimal
for evoking the illusion of motion–or as Cholewiak and Collins (2000) say, to draw a
“vibrotactile line” (p. 1220)–using different stimulus patterns. Such lines might serve as
directional vectors that provide navigational information or information about the body’s
orientation in space.
In a first calibration study we determined vibratory thresholds at six different body sites
around the abdomen for six different stimulus frequencies, to test if the tissue characteristics
or the distribution of mechanoreceptors affect the perception of vibrotactile stimuli at
different sites on the torso. Different vibratory thresholds might affect the comparability of
the two different stimulus patterns, as in the saltatory pattern only every second site is
activated.
Then, the stimulators (tactors) and the experimental procedure–both were identical to
Cholewiak and Collins (2000) study (on the arm)–are evaluated to test if a tactile array around
the torso is feasible to evoke the illusion of movement. Thus, in a first pilot study, we test the
equipment and also examine, if direction of movement is a quality of movement that should
be included in the succeeding experiments. In a second pilot study we test if there are limits to
the integration of different saltatory patterns into a unitary percept of motion dependent on the
number of stimuli delivered to a test site and consequently the distance between activated
sites.
Following these pilot studies, three main experiments are carried out. The aims of the first
two were already described above. In a third experiment, we investigate whether the
integration of spatio-temporal stimulus patterns differ for unilateral and bilateral presentation.
For better readability the Experiments 1 and 2 are combined in the following paragraphs–
unless otherwise noted–because the only major difference is the dependent variable (quality
5 Aim of the study and hypothesis
47
judgments/discrimination performance), i.e. the correlative to neural network behaviour, and
we expect our independent variables to have comparable effects on both dependent variables.
Nevertheless, using different response paradigms (quality judgments/discrimination
performance/forced-choice paradigm “which is best”) might reveal the role of attention in the
perception of illusory movement, as each response paradigm directs subjects’ attention to a
certain aspect of illusory movement.
Pilot-Study 1: Identification of the direction of tactile movement around the torso
A number of studies have been carried out (see Essick, 1998 or Gardner & Constanzo, 1980a)
to examine the impact of different variables (number of stimuli, velocity of motion, width of
stimuli,..) on direction discrimination, to evaluate, how direction is encoded by neural
mechanisms. To my knowledge only one study (Cholewiak & Collins, 2000) examined
whether different stimulus patterns (saltatory/ successive stimulation) affect direction
discrimination. Using a 7-tactor array that was placed on the volar forearm, Cholewiak found
that subjects could always distinguish the direction of tactile movement correctly, irrespective
of the stimulus pattern used.
The number of stimuli is known to be the most relevant factor for direction discrimination
(e.g. Essick, 1998; Gardner & Sklar, 1994). While we keep the number of stimuli constant (8
or 12 stimuli), the number of loci activated is different in the saltatory and successively
activated stimulus patterns: In the saltatory mode every second locus is activated twice while
in the successively activated pattern, each site is activated once, in series. In a first pilot study
we therefore test direction discriminability for the two stimulus patterns presented at a fixed
distance and with a constant number of stimuli, but with different numbers of activated loci.
The distance chosen is a full circle around the torso as in the experiments to follow.
Because velocity is another factor that has been shown to significantly impact direction
discrimination we vary the velocity of motion around the torso, again in the same manner as
in the experiments to follow by combining different levels of SD and ISI.
There is also a practical reason to investigate subjects’ ability to discriminate direction:
We want to determine whether direction is a quality useful for encoding information about the
5 Aim of the study and hypothesis
48
type of movement we present in our experiments, potentially disclosing differences between
the stimulus patterns. On the other hand, if subjects are always able to distinguish the
direction of motion correctly, we will drop this quality in the experiments to follow.
The most important factor for direction discrimination is the number of sequential inputs
by afferent fiber channels, rather than the length of skin traversed (Gardner & Sklar, 1986,
1994), however, no one has ever tested lengths as long as the distance around the abdomen–as
much as 100 cm in our subjects. Consequently, innervation density of the skin is a relevant
factor for direction discrimination: Direction discrimination is more accurate for more densely
innervated regions of the skin (like the digits). On less densely innervated regions (like the
torso), more stimuli should be needed and the path to be traversed will have to be longer.
Experiments with moving bar patterns on the index finger show that most subjects achieved
99% correct answers with eight or more stimuli (Gardner & Sklar, 1994). When motion is
simulated on the torso, probably more tactors should be applied to achieve the same
performance.
The longer the length of skin traversed, the broader the range of velocities over which
subjects may correctly discriminate direction (Essick, 1998; Essick et al., 1989). For long
lengths of skin traversed–where “long” depends on the test site and thus on its innervation
density–direction discrimination is nearly perfect and stimulus velocity has only a minor
effect on directional sensitivity.
In our experiments movement will always travel around the whole torso, along an array of
12 tactors. Thus, the length of our array should exceed by far the criterion for “long”, which is
1.0 cm on the finger, 6.0 cm on the arm (Essick, 1998), and, due to the lower innervation
density on the abdomen, supposedly longer around the trunk, but most likely still shorter than
a full circle around the waist. We therefore do not expect velocity to have an impact on
direction discrimination.
Sparks (1979) investigated the effects of the number of stimuli and the distance in-
between them on directional sensitivity. While holding the number of stimuli (electrodes),
constant, he varied the spacing between them and found that when the stimulus sequence
crossed the body-midline on the abdomen, performance was poorer. But since these findings
were confounded with stimulator spacing, they must be considered carefully.
5 Aim of the study and hypothesis
49
Hypothesis: When motion around the torso is simulated by using an array containing 12
stimulators, direction discrimination is near-perfect.
Hypothesis: Temporal stimulus parameters (SD/ISI) have no effect on direction
discrimination.
With the spatiotemporal parameters chosen for this experiment, we expect the saltatory
stimulus pattern to produce a percept of continuous movement, therefore no difference in
direction discrimination is expected between the different stimulus patterns
(saltatory/successive stimulation).
Hypothesis: Different stimulus patterns (saltatory/successive stimulation) have no effect
on direction discrimination.
If we don’t find any variation in subjects’ ability to distinguish the direction of movement
over the range of spatio-temporal stimulus characteristics tested, we will exclude this quality
from the succeeding experiments.
Pilot Study 2: Limits of spatio-temporal integration dependent on the number of stimuli
delivered to a stimulus location in the saltatory paradigm
In one experiment Geldard (1982) directly compared apparent movement with saltation: He
placed six contactors on the left forearm, delivering one stimulus to each contactor. On the
right forearm, three contactors were placed over the same total distance and each contactor
was activated twice. The perceptions evoked by the two stimulus patterns were identical,
when ISI ranged between 50 and 100 ms. Apparently, at this range of ISI, stimuli of both
patterns are integrated such that missing spots between the activated loci are filled-in and an
illusion of continuous motion is created.
According to Geldard (1982) saltation is vivid when the number of stimuli ranges between
2 and 16 per stimulus location. The larger the number of stimuli, delivered to a locus, the
shorter ISI must be to obtain the saltatory effect. Also, the size of the saltatory area depends
on the number of stimuli per location: When more stimuli are delivered to P2 in the reduced
5 Aim of the study and hypothesis
50
rabbit paradigm, the size of the saltatory area increases. Geldard found a parabolic function
between the number of stimuli delivered to a locus and the extent of the saltatory leap when
the dorsal thigh served as test site.
The question to be answered in this pilot study is, whether or not we still obtain
comparable percepts of movement as reported above, when we vary the saltatory paradigm
delivering different number of pulses to each stimulus site. Because we want to keep the total
distance of the tactile array (a complete circle around the torso) as well as the total number of
stimuli constant, the number of pulses given at each site will be confounded with the distance
between activated sites. There are 12 contactors equally spaced around the torso. Each
contactor is either successively activated or different saltatory patterns are applied: Every
second contactor is activated twice or every third contactor is activated three times or every
fourth contactor is activated four times. Thus, the more stimuli that are delivered to a
contactor, the greater the distance in-between activated sites will be. But since the saltatory
area should increase with the number of stimuli delivered to a locus, we should still be within
the distance limits where saltation can be observed (up to 150 cm with the original 5-5-5
rabbit sequence), so we don’t expect to obtain significantly different percepts.
Like in Geldard’s (1982) experiment we allowed subjects to compare two patterns of
stimulation: One of the above described saltatory patterns with successive activation of every
single one of the 12 contactors, to test if both patterns are integrated into the same percept of
continuous motion. One practical aim of our experiments was to find the optimal spatio-
temporal parameters for apparent movement for the design of tactile displays, so we wanted
subjects to judge which of the two stimulus patterns was “best” in terms of smooth,
uninterrupted movement. If both patterns produce the same percept, subjects should prefer
one pattern over the other in 50% of the trials−basically indicating “no preference”. In the
second pilot study we will thus examine if there are limits to the integration of saltatory
patterns into a percept of continuous motion, when the number of activated sites and thus the
distance in-between them is varied.
Hypothesis: As the successively activated and saltatory patterns are expected to produce
equivalent percepts of apparent motion within the spatiotemporal limits used in this pilot
study, there should be no preference for one pattern, regardless of the varying number of
pulses in the different saltatory patterns and the varying distance in-between activated sites.
5 Aim of the study and hypothesis
51
Spatio-temporal integration of different tactile patterns to produce illusory movement
depends on spatio-temporal parameters (Experiment 1 and 2)
Temporal stimulus parameters
ISI Psychophysical studies on motion percepts evoked by discrete vibrotactile stimulation
(Cholewiak & Collins, 2000; Kirman, 1974a, 1974b; Sherrick & Rogers, 1966; Szaniszlo et
al., 1998) showed that the quality of motion percepts and thus the extent of spatio-temporal
integration of successive stimuli doesn’t depend on the interstimulus onset interval (ISOI) in a
linear manner. Rather the ISOI interval optimal for the spatio-temporal integration of
successive stimuli varies with SD and number of stimuli. In contrast, the saltatory
phenomenon clearly shows a linear relationship between ISI and the amount of
mislocalization (Geldard, 1982; Geldard & Sherrick, 1986).
Note that two different measures for the temporal distance between two stimuli are used in
studies of apparent movement and saltation: ISOI (that is the time between the onset of the
first and the onset of the second stimulus) and ISI (that is the time between the offset of the
first stimulus and the onset of the second stimulus). In our studies we will concentrate on ISI,
as due to technical constraints we were not able to produce temporal overlap between
successive stimuli.
According to Wiemer et al. (1998, 2000) the integration of spatio-temporal stimuli
depends on the temporal interval between them. Stimuli following closely in time are
expected to belong together, therefore they should be represented close to each other in
somatosensory cortex.
Hypothesis: Shorter ISIs enhance the integration of spatio-temporal stimuli into a percept
of continuous motion for successively activated as well as saltatory stimulus patterns. (Thus
better quality judgments for both stimulus patterns and less distinctions between the patterns
are found for shorter ISIs.)
5 Aim of the study and hypothesis
52
SD Increasing SD had a positive effect on the goodness of motion in studies of apparent
motion. Moreover, increasing SD led to increasing ISOI values and also increased the range
of ISOI values where good motion was perceived.
In studies of saltation, SD has often been an unattended variable. But in Cholewiak and
Collins study (2000), SD has been systematically varied and they found that SD influenced
only specific qualities of movement (length/straightness) produced by saltatory stimulus
patterns. We assume in this work that percepts of illusory movement are influenced by SD, as
increasing SDs might enhance the fusion of discrete stimuli.
Hypothesis: Longer SDs enhance the integration of spatio-temporal stimuli into a percept
of continuous motion for successively activated as well as saltatory stimulus patterns. (Thus
better quality judgments for both stimulus patterns and less distinctions between the patterns
are found for longer SDs.)
Interactions between ISI and SD Interactions between ISI and SD have been found in
studies of apparent movement and to a minor degree also in Cholewiak and Collins (2000)
study on movement simulated by saltatory stimulus patterns. We assume that there is an
interaction between SD and ISI: An increase in SD supports the integration of stimuli, such,
that when SD increases, stimuli are integrated as well for longer ISIs.
Hypothesis: Increasing SD increases the range of ISIs over which the integration of
different spatio-temporal stimulus patterns occurs. (Increasing SD increases the range of ISIs
over which better quality judgments for both stimulus patterns and less distinctions between
the patterns are found.)
5 Aim of the study and hypothesis
53
Spatial stimulus parameters
Number of stimuli The number of successively activated stimuli has proved to be a crucial
factor for the integration of stimuli into an illusory percept of movement, though it was
usually confounded with the distance between adjacent stimuli (e.g. Kirman, 1975; Szaniszlo
et al., 1998). The more stimuli were activated, the smaller the distance between two stimuli
became, and the more the quality of motion percepts improved.
Because in previous studies of saltation usually only two (reduced rabbit) or three
(original 5-5-5 paradigm) stimulus sites were used, we have no available data about the
influence of the number of test sites on the illusion of saltation. But since we assume that the
spatial relatedness of stimuli enhances their cortical integration, we expect that increasing the
number of stimulus sites and thus decreasing the distance between activated sites will lead to
better quality judgments.
Hypothesis: Increasing the number of stimulus sites and thus decreasing the distance
between activated sites will enhance the integration of spatio-temporal stimuli into a percept
of continuous motion for successively activated as well as saltatory stimulus patterns. (Thus
better quality judgments for both stimulus patterns are achieved.)
Stimulus width When multiple stimuli are presented simultaneously at different points on
the skin (within certain spatial limits), a single sensation at the centre of the stimulus pattern
results, even if no physical stimulus occurs at that site. This sensation is broader, i.e. spread
out laterally, and also grater in magnitude when compared to a single stimuli. This illusion is
called tactile funneling (Békésy, 1958, 1967; Gardner & Constanzo, 1980b, 1980c; Gardner &
Spencer, 1972). We therefore assume that three closely-spaced, simultaneously-activated
tactors are perceived as a line or wide spot. Subsequently we will call the sensation produced
by three vertical, simultaneously activated tactors the wide stimulus compared to the single
moving dot produced the activation of a single tactor (called narrow stimulus).
From experiments regarding subjects’ ability to discriminate the direction of moving
tactile stimuli (e.g., Essick, 1998) we know that the size of the stimulus plays an important
role in the sense that direction discrimination was better for wider stimuli than for narrower,
presumably due to spatial summation. Vibrotactile sensation magnitude is also affected by the
number of simultaneously presented stimuli in a tactile pattern: With more stimuli, loudness
5 Aim of the study and hypothesis
54
increases (Cholewiak, 1979). Cholewiak (1979) suggests that loudness summation might
cause a form of masking and hence impair pattern perception.
However, it is unclear if stimulus width−equivalent in our experiments to the size of the
stimulated area−affects the perception of apparent tactile movement, as it affects direction
discrimination or sensation magnitude. If we find that stimulus width alters the perception of
moving vibrotactile stimuli we expect to find different quality judgments (for a specific set of
spatiotemporal conditions) when the stimulus is a moving point as opposed to a moving line.
Hypothesis: Stimulus width does not affect the integration of different spatio-temporal
stimulus patterns into a percept of continuous motion. (Thus quality judgments for both
stimulus patterns and distinctions between the patterns are not affected by stimulus width.)
Two qualities of special interest: Length and straightness of movement
Two qualities of movement are of special interest: Straightness and length. The
psychophysical conditions that underlie them, are important to correct percepts of the distance
and path of a tactile stimulus as it moves on the skin (Cholewiak & Collins, 2000; Langford et
al., 1973; Whitsel, Franzen, Dreyer, Hollins, Young, Essick et al., 1986). Experiments have
been conducted using different types of stimuli (e.g. brushing stimuli or the OPTACON),
different test sites (e.g. finger, forearm, back) and different response paradigms (e.g. drawing
a line or scaling methods) to evaluate the effects of stimulus velocity on perceived stimulus
distance and path.
It is known that judgments of the qualities straightness and length depend on the velocity
of motion:
1. Deviation from a perceived straight line increases as the rate of movement decreases
(Langford et al., 1973).
2. Perceived length decreases as rate of movement increases (e.g. Essick, Franzen,
McMillian, & Whitsel, 1991; Greenspan & Bolanowski, 1996).
Furthermore Cholewiak (1999) describes that both, physical separation and ISI affect
estimates of the extent of the sensation produced by two 230 Hz stimuli, such that perceived
distance increases with increasing physical separation and with increasing ISI, with a
5 Aim of the study and hypothesis
55
spatiotemporal interaction observed over all conditions. Specifically, when physical
separation exceeds the two-point threshold, length is generally underestimated.
In experiments to be described below, we want to reinvestigate these effects by using
discrete stimuli that travel around the whole torso (note: in the experiments mentioned above
stimuli only moved on one body site, never crossing the body-midline).
Hypothesis: When the velocity of simulated motion on the torso increases, lines feel
straighter, thus judgments for the quality straightness will improve.
Hypothesis: When the velocity of simulated motion on the torso increases, lines feel
shorter, thus judgments for the quality length will decrease.
Cholewiak & Collins (2000) demonstrated that the stimulus pattern (successively
activated or saltation) had no effect on perceived length and straightness for stimuli presented
to the fingertip, forearm, and thigh. For both saltatory and successively activated conditions
the relationships between velocity and length, and velocity and straightness were consistent
with the findings described above. Because the impact of velocity was quite similar for all test
sites–except for a shift in range–we also expected to find the same relationships in our studies
on the abdomen, independent of stimulus pattern.
Hypothesis: Stimulus pattern has no effect on the judgments for straightness and length.
Vibration frequency
According to the four channel model of cutaneous mechanoreception, different vibration
frequencies activate different populations of mechanoreceptors in both smooth (glabrous) and
hairy skin (Bolanowski et al., 1988, Bolanowski et al., 1994). Detection thresholds for
vibratory stimuli as well as subjective stimulus magnitude are influenced by the frequency of
vibratory stimuli. The perceptions evoked by stimuli of different frequencies also differ.
Whereas low-frequency stimuli appear to be dull, high-frequent stimuli produce bright, sharp
taps (see Chapter 1). But, on the other hand, two-point threshold and localization error are not
affected by vibration frequency (Bolanowski & Gescheider, 1996). Due to these results (that
5 Aim of the study and hypothesis
56
vibration frequency affects at least certain psychophysical measures and the perception of
tactile stimuli), we want to use vibratory stimuli of two different frequencies (80/250 Hz) to
test whether vibration frequency alters the integration of different spatio-temporal stimulus
patterns into a percept of continuous motion. However, since previous studies have shown
that vibration frequency has only a minor effect on apparent motion or the saltatory illusion,
we do not expect to find any significant differences in our measures of quality judgments or
discrimination performance.
Hypothesis: Vibration frequency does not affect the integration of different spatio-
temporal stimulus patterns into a percept of continuous motion. (Thus quality judgments for
both stimulus patterns and distinctions between the patterns are not affected by vibration
frequency.)
Time dependent shifts in response behaviour (Experiment 2)
Stolle (2003) showed that brief repetitive stimulation (reduced and utterly reduced rabbit
paradigm) resulted in changes of the tactile body map, as the space of the stimulated area on
the forearm was contracted in perception. In our study we will concentrate on the equivalence
of different stimulus patterns (successive activation and saltation) that induce illusory
movement, so our experimental design was different from Stolle’s and generally didn’t
involve repeated measures of temporal stimulus parameters within subjects. The exception is
the pattern discrimination experiment (Experiment 2), where every possible combination of
temporal parameters was repeated twice. Because in Stolle’s experiment the biggest change in
the perceived space of the simulated area occurred between the first and the second stimulus
repetition, we assume that one repetition is enough to cause plastic changes.
We therefore assume that:
1. If training enhances the discrimination between two stimulus patterns (successive
activation and saltation), then discrimination performance should improve (Note that
we didn’t give any feedback about the correctness of a subject’s response).
2. But, if, according to Wiemer et al.’s neural network model (1998, 2000), stimuli
presented close together in time are integrated and their representational distance in
somatosensory cortex is reduced with stimulus repetition, then both patterns should
feel more and more alike and discrimination performance should decline. One may
5 Aim of the study and hypothesis
57
also compare Braun et al.’s (2000) results, where when fingers are stimulated in a
fixed order, the distance between the cortical representations of these fingers is
decreased and Stolle’s (2003) findings where she found that the size of the saltatory
area was contracted in perception after repeated successive stimulation, and also a
decrease in point localization was observed.
Hypothesis: If the two different stimulus patterns have to be discriminated repeatedly,
then discrimination performance deteriorates due to plastic changes in neural networks.
Experiment 3: Unilateral and bilateral presentation of stimulus patterns
Geldard (1982; Geldard & Sherrick, 1983, 1986) conducted several experiments to explore
the spatial limits of saltation (saltatory areas) on different body-sites like the thigh, arm, or
forehead. He found that the size and shape of the saltatory area varies with body region–and
hypothesized that the areas so defined might correspond to the receptive field sizes and shapes
of the different body parts. In addition, experiments using the reduced rabbit paradigm on the
forehead, or anterior thorax showed that the saltatory illusion never crossed the body-midline,
the saltatory area was always truncated at the body-midline.
As already stated above, increasing the number of stimuli delivered to P2 in the reduced
rabbit paradigm increased the size of the saltatory area (Geldard, 1982). Additionally, the size
of the saltatory area can be altered with repetitive stimulation (Stolle, 2003) and also varies
with the exact position (proximal or distal on the forearm) of the saltatory pattern (Trojan et
al., 2006), indicating dynamic adjustments of neural networks to spatio-temporal stimulus
characteristics. Considering these findings, it is reasonable to ask if the attenuation of the
saltatory area at the body-midline also occurs when a saltation mode other than the reduced
rabbit is applied. In the third experiment we will thus examine if saltatory stimulus patterns
still produce the illusion of continuous motion when presented bilaterally.
When multiple stimulus locations are involved (7-tactor array), we expect to attain a
relatively stable illusion of saltatory movement that is also vivid when it crosses the body-
midline. Once the stimulation of discrete contactors produces the illusion of movement, this
illusory movement shouldn’t stop at the body-midline as the cortex integrates perceptions

5 Aim of the study and hypothesis
58
from the two body-sites into an integral whole. We can deduce therefore that subjects’ ability
to discriminate between saltation and successive activation is not different for unilateral and
bilateral presentation.
Hypothesis: When subjects have to discriminate between saltatory and successively
activated stimulus patterns they reach similar results when the illusory movement travels the
body-midline and when it travels on one body site only.
6 General Methods
59
6 General methods
Here, the apparatus, stimulus characteristics and the general experimental procedure, which
will be the same for each experiment will be described. A detailed description of each of the
several experiments will follow in the individual sections.
6.1 Subjects
Subjects for the experiments were recruited from the Naval Schools Command at the Naval
Air Station in Pensacola, Florida. They were (male and female) pilot candidates awaiting their
flying training. All subjects participated voluntarily, there was no reimbursement for their
participation. Their ages ranged from 21 to 33, averaging 24.2 years old.
In total, 139 subjects took part in 5 experiments (Pilot Studies 1 and 2, Experiments 1, 2,
and 3). Usually, the subjects had no prior experience with tactile experiments, but in the
calibration and first pilot study, one of the subjects was a research psychologist working for
NAMRL. In the second pilot study we had one subject who also participated in Pilot Study 1.
Every subject was asked to report any medical condition that might effect his/her tactile
sensitivity of the trunk or ability to operate the testing devices. Only subjects who didn’t
report any serious medical condition that might affect their ability to participate in the
experiment were included. In fact, no subjects had to be excluded based on medical criteria.
Because the subjects in our pool had limited availability, our research designs were
generally between-subjects rather than within-subject designs.
6.2 Apparatus
Tactile stimuli were provided by electrically driven transducers (“C2-Tactors”) manufactured
by Engineering Acoustics, Inc. of Winter Park, FL, USA (see Figure 6.1). They have a round
metal surface (made of anodized aluminum), are 3 cm in diameter and 0.8 cm deep. The
vibrating circular skin contactor in the middle is 0.7 cm in diameter and centered in a 0.9 cm
hole so that there is a 0.1 cm gap between the moving element and the rigid surround. This
perpendicular moving element is raised 0.05 cm above the housing to assure proper skin
contact and is pre-loaded when it touches the skin. The tactor weighs about 17 gm. These C2-
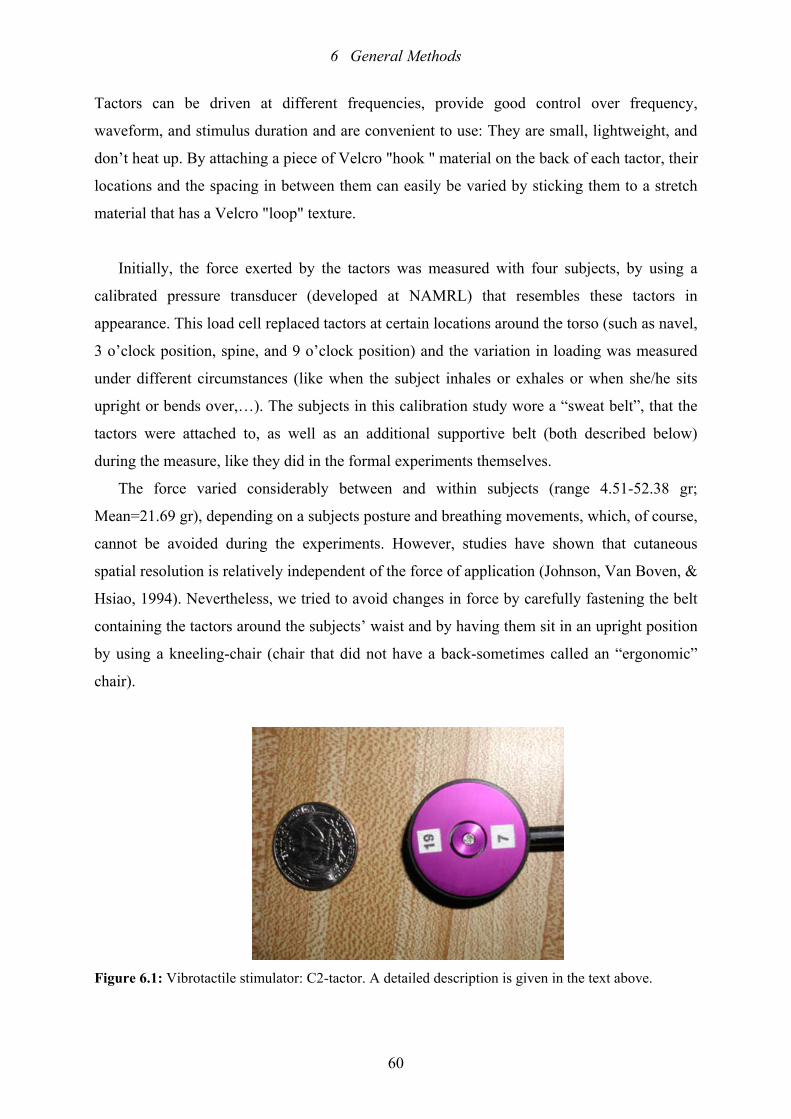
6 General Methods
60
Tactors can be driven at different frequencies, provide good control over frequency,
waveform, and stimulus duration and are convenient to use: They are small, lightweight, and
don’t heat up. By attaching a piece of Velcro "hook " material on the back of each tactor, their
locations and the spacing in between them can easily be varied by sticking them to a stretch
material that has a Velcro "loop" texture.
Initially, the force exerted by the tactors was measured with four subjects, by using a
calibrated pressure transducer (developed at NAMRL) that resembles these tactors in
appearance. This load cell replaced tactors at certain locations around the torso (such as navel,
3 o’clock position, spine, and 9 o’clock position) and the variation in loading was measured
under different circumstances (like when the subject inhales or exhales or when she/he sits
upright or bends over,…). The subjects in this calibration study wore a “sweat belt”, that the
tactors were attached to, as well as an additional supportive belt (both described below)
during the measure, like they did in the formal experiments themselves.
The force varied considerably between and within subjects (range 4.51-52.38 gr;
Mean=21.69 gr), depending on a subjects posture and breathing movements, which, of course,
cannot be avoided during the experiments. However, studies have shown that cutaneous
spatial resolution is relatively independent of the force of application (Johnson, Van Boven, &
Hsiao, 1994). Nevertheless, we tried to avoid changes in force by carefully fastening the belt
containing the tactors around the subjects’ waist and by having them sit in an upright position
by using a kneeling-chair (chair that did not have a back-sometimes called an “ergonomic”
chair).
Figure 6.1: Vibrotactile stimulator: C2-tactor. A detailed description is given in the text above.
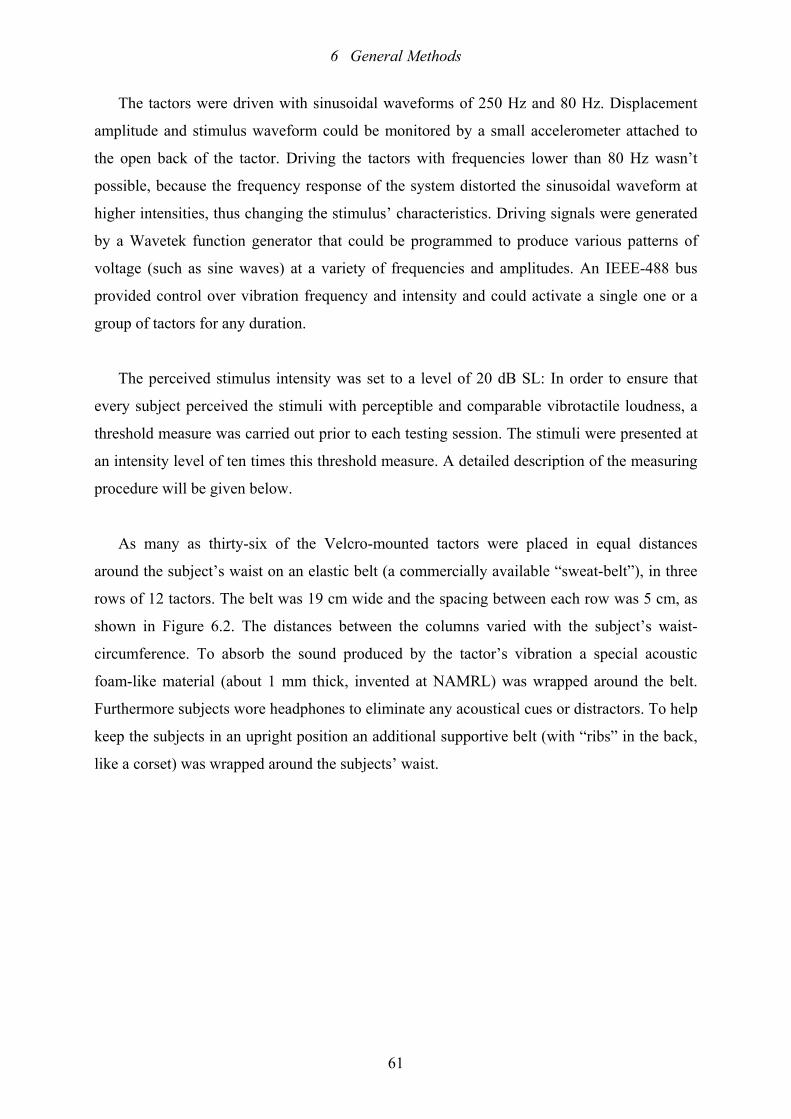
6 General Methods
61
The tactors were driven with sinusoidal waveforms of 250 Hz and 80 Hz. Displacement
amplitude and stimulus waveform could be monitored by a small accelerometer attached to
the open back of the tactor. Driving the tactors with frequencies lower than 80 Hz wasn’t
possible, because the frequency response of the system distorted the sinusoidal waveform at
higher intensities, thus changing the stimulus’ characteristics. Driving signals were generated
by a Wavetek function generator that could be programmed to produce various patterns of
voltage (such as sine waves) at a variety of frequencies and amplitudes. An IEEE-488 bus
provided control over vibration frequency and intensity and could activate a single one or a
group of tactors for any duration.
The perceived stimulus intensity was set to a level of 20 dB SL: In order to ensure that
every subject perceived the stimuli with perceptible and comparable vibrotactile loudness, a
threshold measure was carried out prior to each testing session. The stimuli were presented at
an intensity level of ten times this threshold measure. A detailed description of the measuring
procedure will be given below.
As many as thirty-six of the Velcro-mounted tactors were placed in equal distances
around the subject’s waist on an elastic belt (a commercially available “sweat-belt”), in three
rows of 12 tactors. The belt was 19 cm wide and the spacing between each row was 5 cm, as
shown in Figure 6.2. The distances between the columns varied with the subject’s waist-
circumference. To absorb the sound produced by the tactor’s vibration a special acoustic
foam-like material (about 1 mm thick, invented at NAMRL) was wrapped around the belt.
Furthermore subjects wore headphones to eliminate any acoustical cues or distractors. To help
keep the subjects in an upright position an additional supportive belt (with “ribs” in the back,
like a corset) was wrapped around the subjects’ waist.
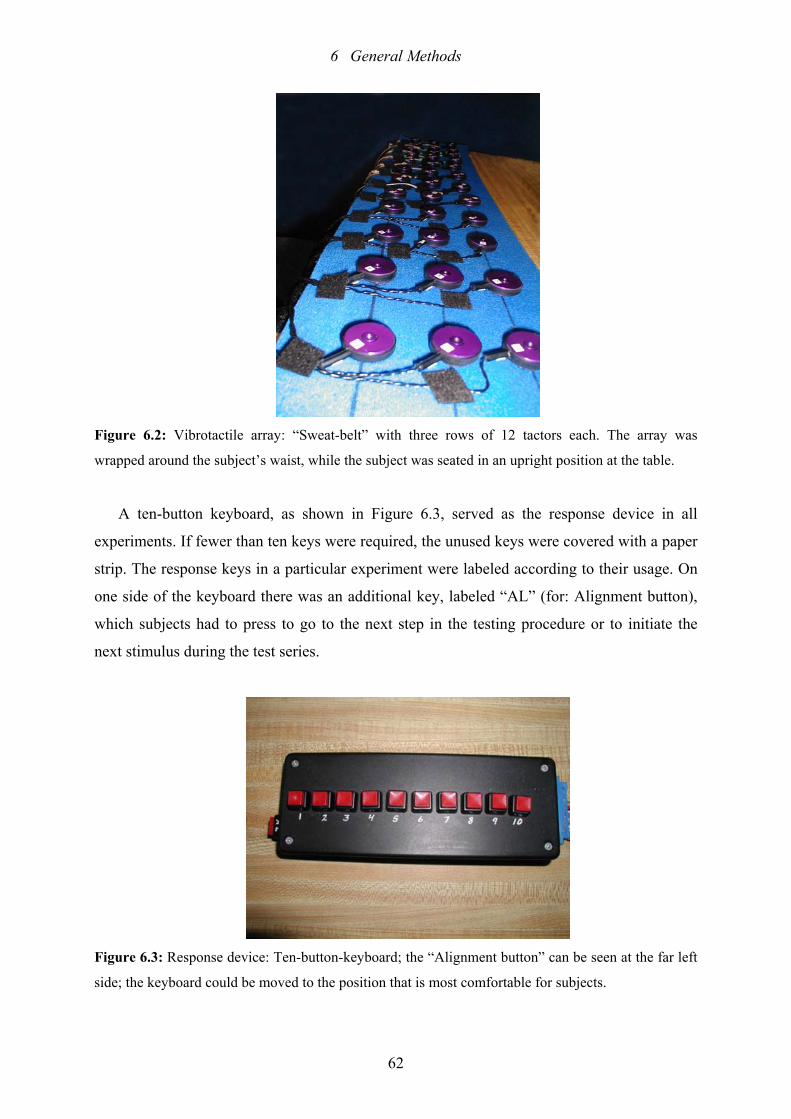
6 General Methods
62
Figure 6.2: Vibrotactile array: “Sweat-belt” with three rows of 12 tactors each. The array was
wrapped around the subject’s waist, while the subject was seated in an upright position at the table.
A ten-button keyboard, as shown in Figure 6.3, served as the response device in all
experiments. If fewer than ten keys were required, the unused keys were covered with a paper
strip. The response keys in a particular experiment were labeled according to their usage. On
one side of the keyboard there was an additional key, labeled “AL” (for: Alignment button),
which subjects had to press to go to the next step in the testing procedure or to initiate the
next stimulus during the test series.
Figure 6.3: Response device: Ten-button-keyboard; the “Alignment button” can be seen at the far left
side; the keyboard could be moved to the position that is most comfortable for subjects.
6 General Methods
63
An alpha-numeric display was mounted on the wall in front of the subjects, providing
task-related information, like the current phase of the experiment (“Rotating Tactors”,
“Threshold Measure”, “Block 1”’…) or short instructions to let the subjects know what keys
they were supposed to press. A computer controlled the stimulus parameters, stored the data
and was programmed to calculate descriptive statistics such as frequencies.
6.3 Vibrotactile Stimuli During each experiment the percepts evoked by different spatio-temporal patterns were
studied. The impact of the period of time that each tactor vibrates (SD) and the interval
between the end of vibration of one tactor and the beginning of vibration of the next tactor
(ISI, as in the papers of Geldard and Cholewiak) are of interest, as well as the effect of
different spatial settings.
Seven different SDs and seven ISIs spaced at roughly logarithmic intervals were
generated for the two vibration frequencies of 80 Hz and 250 Hz. For 80 Hz stimuli 12.5 ms
were required to complete a full sinusoidal cycle, while only 4 ms were required to cover a
sinusoidal cycle at 250 Hz. To have similar temporal parameters for 80 Hz and 250 Hz stimuli
patterns we chose the following durations:
For 250 Hz stimuli we used: 16 ms, 24 ms, 32 ms, 48 ms, 64 ms, 96 ms and 128 ms.
These durations are equivalent to 4, 6, 8, 12, 16, 24 and 32 sinusoidal cycles of the 250 Hz
signal (4 ms period).
For 80 Hz stimuli we used: 12 ms, 25 ms, 37 ms, 50 ms, 75 ms, 100 ms, 125 ms. These
durations are equivalent to 1, 2, 3, 4, 6, 8 and 10 sinusoidal cycles of the 80 Hz signal (12.5
ms period).
All possible combinations of these intervals resulted in a set of 49 SD-ISI temporal
stimulus patterns. It is known that saltation occurs over a broad range of time intervals: It is
vivid at ISIs between 20 and 200 ms, which is the reason why the above range of temporal
intervals were chosen.
Four different spatial settings were used in the experiments: Either all three rows of
tactors or just the middle row was activated. Also either 8 or all 12 tactors-columns were
activated. The combinations of these conditions resulted in four different spatial settings.
Although saltation has been observed at spacings ranging from 2 cm to 35 cm between
6 General Methods
64
activated loci, a distance of 10 cm (on the forearm) has typically been used to study the
phenomenon. The circumference of our subjects’ waist varied approximately between 75 cm
and 100 cm. The application of 12 tactors, equally spaced around the torso, resulted in spatial
separations of 6-8 cm between the tactors. If the number of tactors was reduced to eight, the
distances increased to 9-13 cm. Thus, the spatial separations employed in this study were
close to the intensely studied distance of 10 cm among taps. There was also a practical reason
to use 12 or 8 tactors: One application for the “Tactile Situation Awareness System” (TSAS),
on which this belt is modeled, is to provide threat or target location to aircraft pilots. They are
typically trained to use clock times (12 o’clock,…) or the eight cardinal points on the compass
(north, northeast,…) to specify a location in space.
Stimuli consisted of successive bursts of vibration presented to each or a subset of tactors
on the belt in order to simulate movement on the body. In these experiments, two presentation
modes were used: The successively activated and the saltatory modes. Corresponding patterns
had identical temporal parameters and the total number of bursts was the same, but the
number of loci activated differed. In the successively activated mode, every tactor was
activated successively (see Figure 6.4), while in the saltatory mode, only every second tactor
was vibrating (see Figure 6.5; note: In Pilot Study 2 also every third and every forth tactor
was activated; a detailed description will be given in the corresponding chapter). During the
saltation mode two bursts of vibration were presented at the first location (the navel), two at
the third, two at the fifth and so on, with an additional final single burst at the first tactor at
the navel. The pattern of activation started and ended each time at the navel, so that subjects
could not tell the difference between the successively activated and the saltatory patterns on
the basis of the traversed lengths of the patterns. In addition, in order to get the stimuli at the
last location to “jump” in saltation, we needed a final “attractant”–the single tap at the end of
the sequence. Consequently, in the 8-tactor condition there were actually nine bursts, while in
the 12-tactor condition, there were 13 bursts of vibration. Subjects weren’t told that there
were two different stimulus patterns (successively activated and saltatory). Figures 6.4 and
6.5 describe the time course of stimulation for the two different stimulus patterns.
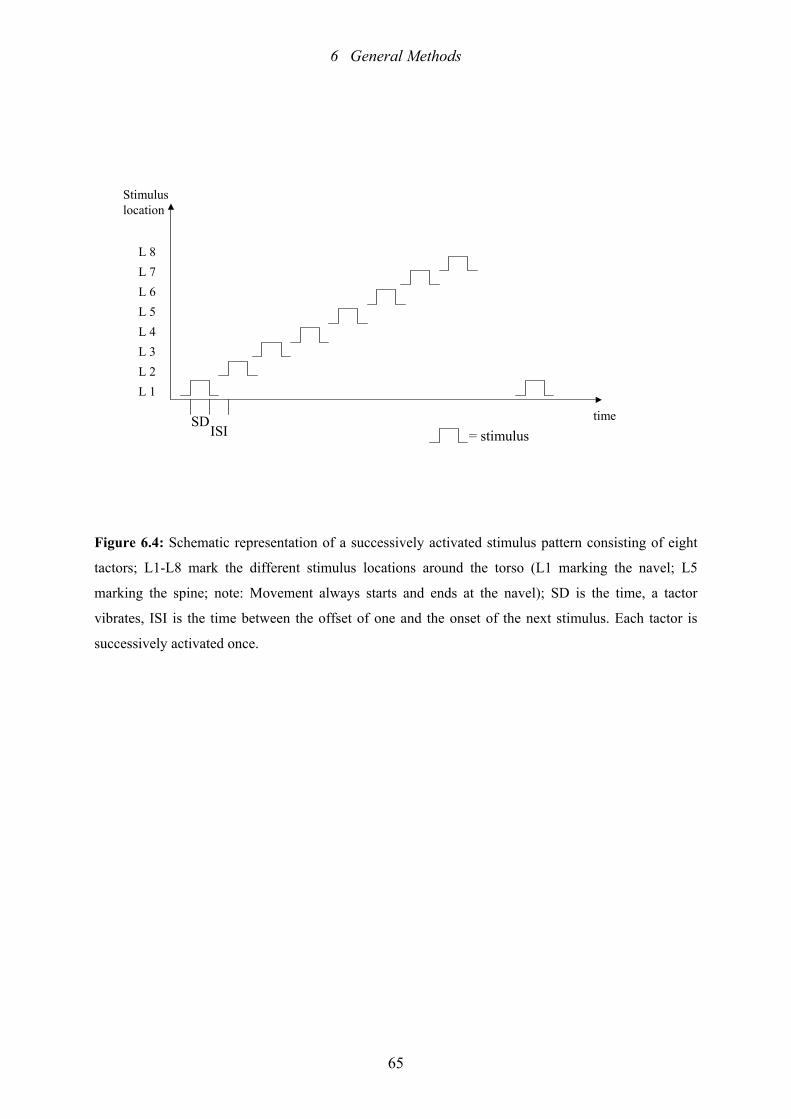
6 General Methods
65
Stimulus location
L 8L 7L 6L 5L 4L 3L 2L 1
time= stimulus
SDISI
Figure 6.4: Schematic representation of a successively activated stimulus pattern consisting of eight
tactors; L1-L8 mark the different stimulus locations around the torso (L1 marking the navel; L5
marking the spine; note: Movement always starts and ends at the navel); SD is the time, a tactor
vibrates, ISI is the time between the offset of one and the onset of the next stimulus. Each tactor is
successively activated once.
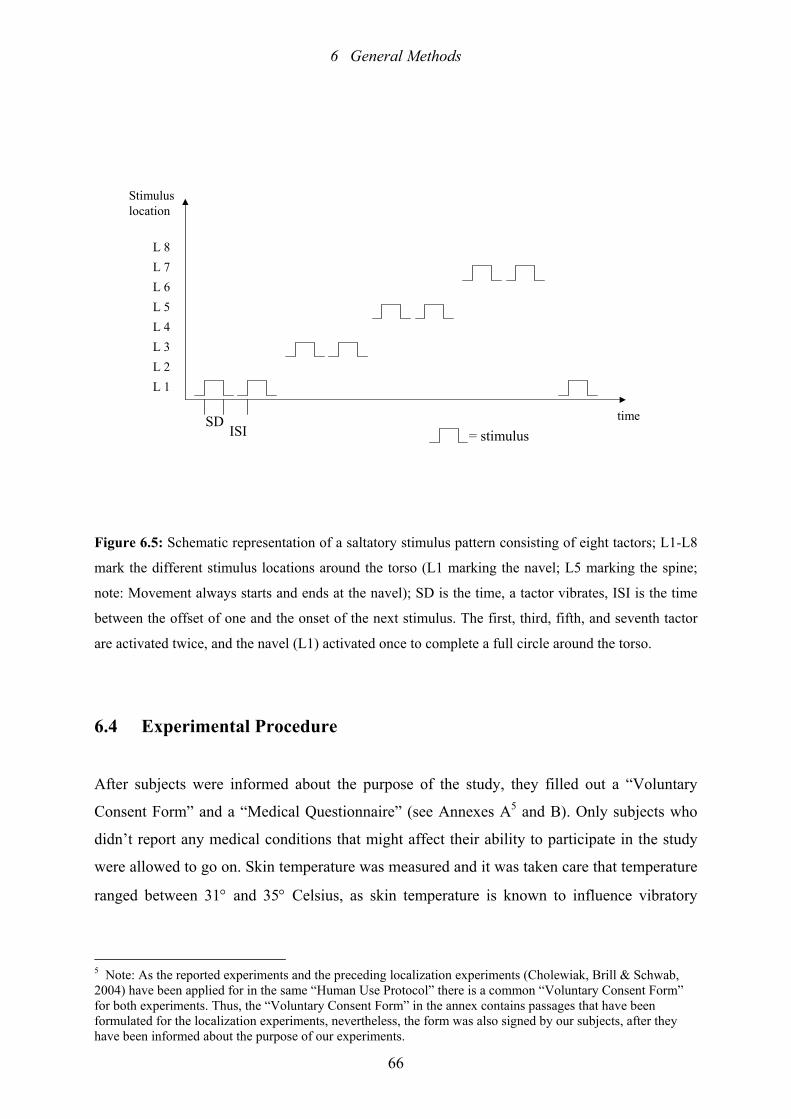
6 General Methods
66
Stimulus location
time
L 8L 7L 6L 5L 4L 3L 2L 1
= stimulusSD
ISI
Figure 6.5: Schematic representation of a saltatory stimulus pattern consisting of eight tactors; L1-L8
mark the different stimulus locations around the torso (L1 marking the navel; L5 marking the spine;
note: Movement always starts and ends at the navel); SD is the time, a tactor vibrates, ISI is the time
between the offset of one and the onset of the next stimulus. The first, third, fifth, and seventh tactor
are activated twice, and the navel (L1) activated once to complete a full circle around the torso.
6.4 Experimental Procedure
After subjects were informed about the purpose of the study, they filled out a “Voluntary
Consent Form” and a “Medical Questionnaire” (see Annexes A5 and B). Only subjects who
didn’t report any medical conditions that might affect their ability to participate in the study
were allowed to go on. Skin temperature was measured and it was taken care that temperature
ranged between 31° and 35° Celsius, as skin temperature is known to influence vibratory
5 Note: As the reported experiments and the preceding localization experiments (Cholewiak, Brill & Schwab, 2004) have been applied for in the same “Human Use Protocol” there is a common “Voluntary Consent Form” for both experiments. Thus, the “Voluntary Consent Form” in the annex contains passages that have been formulated for the localization experiments, nevertheless, the form was also signed by our subjects, after they have been informed about the purpose of our experiments.
6 General Methods
67
threshold, dependent on the type of mechanoreceptor activated (see Verrillo & Bolanowski,
1986; Weitz, 1941). In every experiment subjects’ age, waist, and handedness were recorded.
Subjects wore a standard all-cotton T-shirt provided by the laboratory for testing to make
sure that everybody wore the same type of clothing between the tactors and the skin. After
subjects changed into the T-shirt, their waist was measured and their naval was marked with a
felt-tip pen on the shirt. To determine the position of the belt, a mark was set one inch (2.54
cm) above the navel. For testing, subjects were seated in a comfortable, ergonomic kneeling-
chair, which had no backrest. The belt was placed around the torso, so that the tactor activated
first and last in the pattern was located at the mark set before. Standardized instructions were
read to the subjects by the experimenter and important contents were reviewed by either the
computer-controlled visual display or paper boards.
Before the test started, subjects were presented with a familiarization pattern in which
each of the (8 or 12) tactors in the middle row was activated sequentially, producing a
sensation of “rotation” around the trunk. This pattern served two purposes: First it insured that
all of the tactors were working properly and second, that they were making adequate contact
with the skin. The visual display read “Rotating Tactors”, indicating the availability of the
familiarization pattern and subjects could then feel the bursts of vibration by starting the
patterns themselves by pressing the “AL”-key. After a preparatory delay of 600 ms, a 110 ms
long burst of vibration occurred sequentially at each of the tactors, with an ISI of 300 ms
between each burst. The “Rotating Tactors” could be repeated as often as necessary−but was
presented at least three times−to ensure that every tactor touched the skin, which is especially
critical at the spine where the circumference shows a more or less distinctive “indentation”.
Subjects were requested to count the tactors as they went along to guarantee that they felt a
tactor activate at every position.
To ensure that subjects perceived the test-patterns with clearly palpable and comparable
levels of intensity, the next step in the procedure was a threshold measure. Subjects were
instructed to rerun the “Rotating Tactors”, starting at a clearly suprathreshold level. If subjects
couldn’t feel any one tactor, they informed the experimenter and intensity was increased by
20% steps until the subject was able to feel every tactor clearly. Now, with every repetition,
the intensity level was decreased by 10%. As soon as the subjects could not feel any one
tactor, the procedure stopped–by subjects pressing the number 1 key on the keyboard−and the
6 General Methods
68
actual intensity level (in volts) was measured, recorded and increased 10 times (20 dB SL) for
the experiment to follow. Every subject’s threshold, the number of steps until one tactor
couldn’t be felt and the tactor’s number were recorded.
Each testing session consisted of several blocks of trials. A trial is defined as a single
presentation of a stimulus pattern. The numbers of blocks and trials was a function of levels
of the variables tested. To move to the next stimulus the subjects had to press the “Alignment
button” on the keyboard, so they were in control when the next stimulus was presented. In
between the blocks the subjects could take a brief break if they wished. There was no time
limit for the subjects’ responses and no feedback was given.
After each testing session the subjects were interviewed to determine whether they
experienced any difficulties during the test and notes were taken on any remarks the subjects
made.
6.5 Overview of Experimental Designs
In most experiments there were two groups of subjects: One group was tested with 80 Hz
stimuli, one group with 250 Hz stimuli. Every experiment’s design was a multifactor design
with repeated measures. As the experimental design varies for each experiment, it will be
presented in detail in the corresponding chapters (Chapters 7-12). Below, an overview of the
independent and dependent variables is given.
6.5.1 Independent Variables
1. Stimulus patterns:
• Successively presented stimuli (one stimulus, that is one burst of vibration at
each location)
• Saltatory stimuli (two or more stimuli at every second, third, … location)
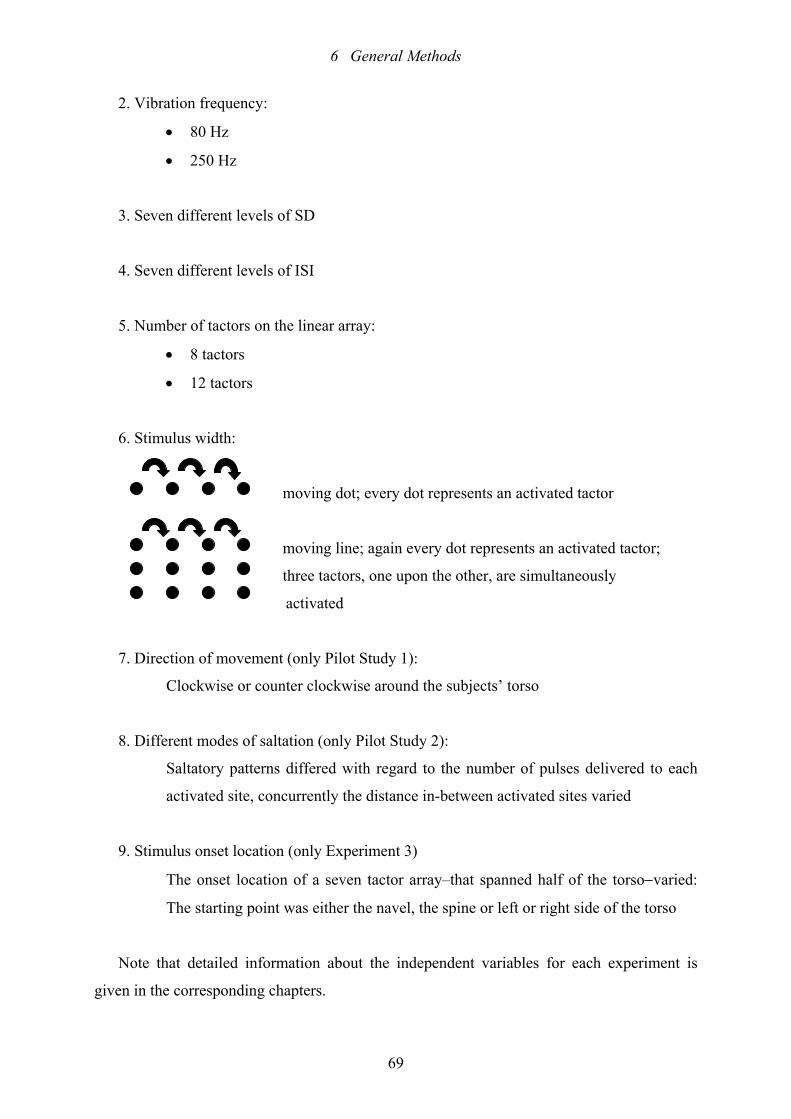
6 General Methods
69
2. Vibration frequency:
• 80 Hz
• 250 Hz
3. Seven different levels of SD
4. Seven different levels of ISI
5. Number of tactors on the linear array:
• 8 tactors
• 12 tactors
6. Stimulus width:
moving dot; every dot represents an activated tactor
moving line; again every dot represents an activated tactor;
three tactors, one upon the other, are simultaneously
activated
7. Direction of movement (only Pilot Study 1):
Clockwise or counter clockwise around the subjects’ torso
8. Different modes of saltation (only Pilot Study 2):
Saltatory patterns differed with regard to the number of pulses delivered to each
activated site, concurrently the distance in-between activated sites varied
9. Stimulus onset location (only Experiment 3)
The onset location of a seven tactor array–that spanned half of the torso−varied:
The starting point was either the navel, the spine or left or right side of the torso
Note that detailed information about the independent variables for each experiment is
given in the corresponding chapters.
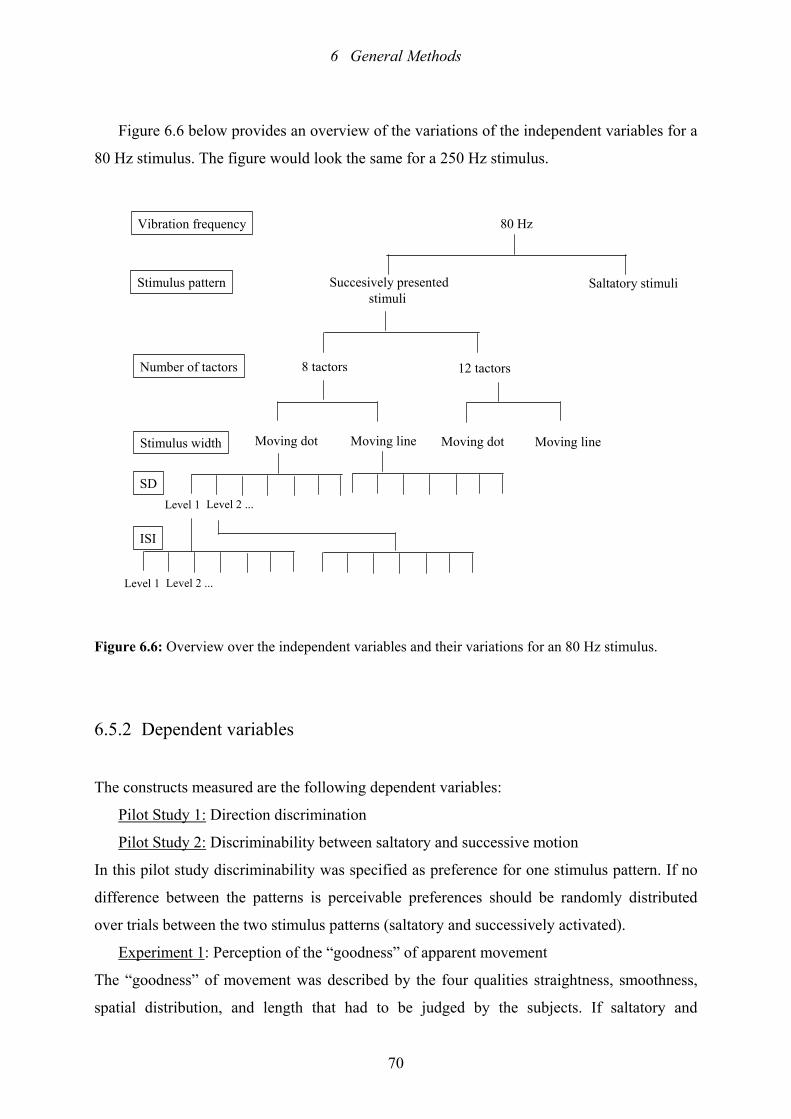
6 General Methods
70
Figure 6.6 below provides an overview of the variations of the independent variables for a
80 Hz stimulus. The figure would look the same for a 250 Hz stimulus.
80 Hz
Succesively presentedstimuli
Saltatory stimuli
8 tactors 12 tactors
Moving dot Moving lineMoving dotMoving line
Vibration frequency
Stimulus pattern
Number of tactors
Stimulus width
SD
ISI
Level 1 Level 2 ...
Level 1 Level 2 ...
Figure 6.6: Overview over the independent variables and their variations for an 80 Hz stimulus.
6.5.2 Dependent variables
The constructs measured are the following dependent variables:
Pilot Study 1: Direction discrimination
Pilot Study 2: Discriminability between saltatory and successive motion
In this pilot study discriminability was specified as preference for one stimulus pattern. If no
difference between the patterns is perceivable preferences should be randomly distributed
over trials between the two stimulus patterns (saltatory and successively activated).
Experiment 1: Perception of the “goodness” of apparent movement
The “goodness” of movement was described by the four qualities straightness, smoothness,
spatial distribution, and length that had to be judged by the subjects. If saltatory and
6 General Methods
71
successively activated stimuli produce the comparable percepts of movement, both patterns
should be affected similarly by our independent variables.
Experiments 2&3: Discriminability between saltatory and successive motion
Discriminability was specified as either corrects discriminations or preference for one
stimulus pattern.
6.6 Measures
Pilot Study 1: Subjects had to indicate if the direction of movement was clockwise or counter-
clockwise by pressing a corresponding key on a keyboard. The number of correct and
incorrect responses was counted for each subject and over subjects.
Pilot Study 2: In a two-alternative-forced-choice paradigm subjects had to choose the
stimulus pattern that felt “best” in terms of continuous motion around the torso. Every trial
consisted of one saltatory and one successively activated stimulus pattern with varying spatio-
temporal parameters (see Chapter 9 for detailed description). When subjects chose a saltatory
stimulus pattern a score of 0.00 was recorded, when a successively activated stimulus pattern
was picked, a score of 1.00 was entered. The number and percentage of votes for one stimulus
pattern was calculated for each subject and over all subjects.
Experiment 1: Perception of apparent movement was measured by subjects’ ratings of
four qualities of movement that describe the “goodness” of motion on a 10-point scale. The
qualities to be judged were straightness, smoothness, spatial distribution, and length. On the
10-point scale “1” marked the least straight and smooth movement, the poorest spatial
distribution and the shortest range of the flow. The number 10 indicates the straightest and
smoothest movement as well as the most equal spatial distribution of the stimuli. For the
quality length there is a specific feature: The number 9 on the scale marks a full circle around
the waist (from navel to navel), the “10” suggests on overshoot (movement outreached its
origin at the navel). For a detailed description of the different qualities see Annex C and
Chapter 10. Subjects’ ratings (1-10) served as row score.
Experiments 2&3: The ability to discriminate between saltatory and successively activated
motion was measured using a same-different design. On each trial the subjects had to decide
whether two stimulus patterns presented were the same or different. The answer “same” is a
correct response to same pattern pairs (both patterns saltatory or both patterns successively
activated) and an incorrect response to different pattern pairs (one pattern saltatory the other
6 General Methods
72
pattern successively activated). The number of “same” answers was counted over trials and
subjects, separately for same and different pairs. Additionally in Experiment 2, subjects had to
decide in a two-alternative-forced-choice paradigm, which of the two presented patterns
displays the best percept of continuous motion. Like in Pilot Study 2, preference for a
saltatory pattern was coded with 0.00, preference for a successively activated pattern was
coded with 1.00. Again, the number and percentage of votes for one stimulus pattern was
calculated for each subject and over all subjects. In Experiment 3 we calculated first the total
number and percentage of correct responses, that is correct discriminations, over all subjects
and trials. In a next step we differentiated between same pairs and different pairs and used the
number of “same” answers as a measure of discriminability between saltatory and successive
motion.
6.7 Statistical Analyses
Mean (M), range, and minimum (Min.) and maximum (Max.) describe the distribution of the
subjects’ age.
Pilot Study 1: As we expect only very few incorrect responses (wrong identification of
direction) we will only describe the stimulus parameters where discrimination errors
accumulated and will forgo statistical tests.
Pilot Study 2: χ2-Tests were performed for each subject to test if the number of votes for
the saltatory and successively activated stimulus patterns fit to a 50:50 distribution.
Additionally, χ2-tests were applied to test if subjects’ preferences for one stimulus pattern are
equally distributed over the seven levels of SD and ISI.
Experiment 1: The data for the statistical analysis are subjects’ judgments on the 10-point
scale for each quality. There were no missing values since subjects could only proceed to the
next trial when they had pushed a button on the 10-key-keyboard. Since it cannot be assumed
that the intervals on the 10-point scale are equidistant in subjects’ perception, nonparametric
methods were used. As a measure of central tendency the median is chosen. The range or
interquartile range served as a measure of statistical dispersion. To test differences between
independent samples (effect of vibration frequency on judgments) a Mann-Whitney U-Test
was calculated. For related samples (effect of number of tactors on the linear array on
judgments and effect of stimulus width) a Test of Marginal Homogeneity was used. To assess
if the seven levels of the temporal parameters SD and ISI or the duration of movement exerted
6 General Methods
73
an increasing influence on the integration of discrete stimuli, a Trend test (Page 1963) was
applied. To check interaction effects between SD and ISI, correlation coefficients (Kendall’s
Tau) between ISI and the quality ratings were calculated for each subject, broken down by the
lowest and highest value of SD. The two sets of correlation coefficients−one for the lowest
level of SD and one for the highest level of SD−were then tested with a sign-test. If the
difference between the correlation coefficents equals null, we proceed according to Bortz,
Lienert & Boehnke (2000, p. 257): If we get even-numbered null differences one half will
receive a positive, the other half a negative algebraic sign. If the number of null differences is
odd-numbered, the number of observations will be reduced by one.
Experiments 2&3: To test whether every level of SD and ISI accounted for the same
percentage of “same” answers, separate χ2-tests were performed for each subject, and a
binomial test was used to test if the number of significant results exceeds chance. McNemar
χ2-tests were used to test if stimulus width affected discriminability and to evaluate the effect
of stimulus repetition. To check for effects of frequency, χ2-tests were conducted. In the
second part of Experiment 2 (“which is best”) we performed χ2-tests for each subject to test if
subjects’ preference for one stimulus pattern is randomly distributed between the two
patterns. A Binomial test over all subjects tested if the significant results from the multiple χ2-
tests occur more frequently than random. To test the effects of the remaining independent
variables we used the same tests as described above.
In Experiment 3 we used χ2-tests to evaluate if the number of correct responses and the
number of “same” answers are equally distributed over the different positions of the 7-tactor
array. Temporal effects were tested in the same way as in Experiment 2.
The level of α was always set to .01. Some of the tests and correlation coefficients (Mann-
Whitney U-Test, Kendall’s Tau) were conducted with the help of the statistic software SPSS,
other tests (χ2-tests, Page test) were carried out with a pocket calculator. The statistical
procedures that we used are described by Bortz, Lienert, and Boehnke (2000) and Bortz
(1999). We also made use of the tables for the significance of the test statistics provided by
these authors.
7 Calibration Study: Vibrotactile thresholds on the torso
74
7 Calibration Study: Determination of vibrotactile
thresholds on the torso
In this preliminary study the variations in tactile sensitivity around the circumference of
the trunk at the level of the tactile array to be used in the later studies was explored. For
this purpose vibratory thresholds were measured at six different body sites around the
abdomen for six different stimulus frequencies. Variations in threshold magnitudes over
sites would be expected, since the tissue characteristics vary from the belly around to the
spine and because the different types of mechanoreceptors vary in their density and
location. This preliminary study is of importance for the following experiments as
variations in detection sensitivity might influence the perception of movement around the
torso: If we find significantly different thresholds over body sites we might have to vary
intensity over sites to ensure that sensation magnitude does not serve as a cue to
differentiate between different patterns of movement. This study was carried out at the
Cutaneous Communication Laboratory at Princeton University, whereas the following
studies took place at the Tactile Research Laboratory at NAMRL. The results of this
study have been published in Perception & Psychophysics (Cholewiak, Brill & Schwab,
2004).
In a comparable study Sherrick (1953) found quite similar sensitivity curves for the
tongue (bone-free tissue) and the index finger (bony tissue). More specifically, Wilska
(1954) examined vibratory thresholds on a number of body sites, but to my knowledge no
study has ever systematically examined vibratory thresholds at different locations around
the torso.
7.1 Subjects
Five subjects participated in this experiment: One male and four females. Four subjects
were students at Princeton University, one was a member of the laboratory staff. The
average age of the subjects was 24 (range 20-29). They all had prior experience with
tactile experiments, as well as with threshold measures. This was desirable because of the
7 Calibration Study: Vibrotactile thresholds on the torso
75
demands of this particular task, including the time commitment and attention to
threshold-level stimuli. None of them reported any medical condition that might have
affected their ability to perceive the stimuli used in this study. Students received a
reimbursement for their participation.
7.2 Apparatus
A wide-band vibratory device was used to stimulate the skin in this study, a Bruel &
Kjaer 4810 minishaker (Figure 7.1), whose moving skin contactor is 7 mm in diameter,
indenting the skin 0.5 mm beyond the static Plexiglas® surround. Between the contactor
and the surround there is a gap of 1 mm. The contactor itself is actually a PCB 303A
accelerometer that is used to monitor the stimulus waveform and to measure the actual
amplitude of the threshold stimulus intensity at the end of the session (described below).
The shaker is mounted on a jointed balance-arm that allows the contactor to be placed on
different positions perpendicular to the subject’s body while maintaining a fixed static
force. The pressure that is exerted by the shaker on the subject’s skin was about 50
grams.
The frequency and intensity of the sinusoidal stimuli, as well as their timing
parameters were controlled by a computer. This computer also stored and analyzed the
data. A four-button keyboard (with keys labeled with the numbers 1-4) served as the
response device. Task-related information was shown to the subjects on a portable visual
display.
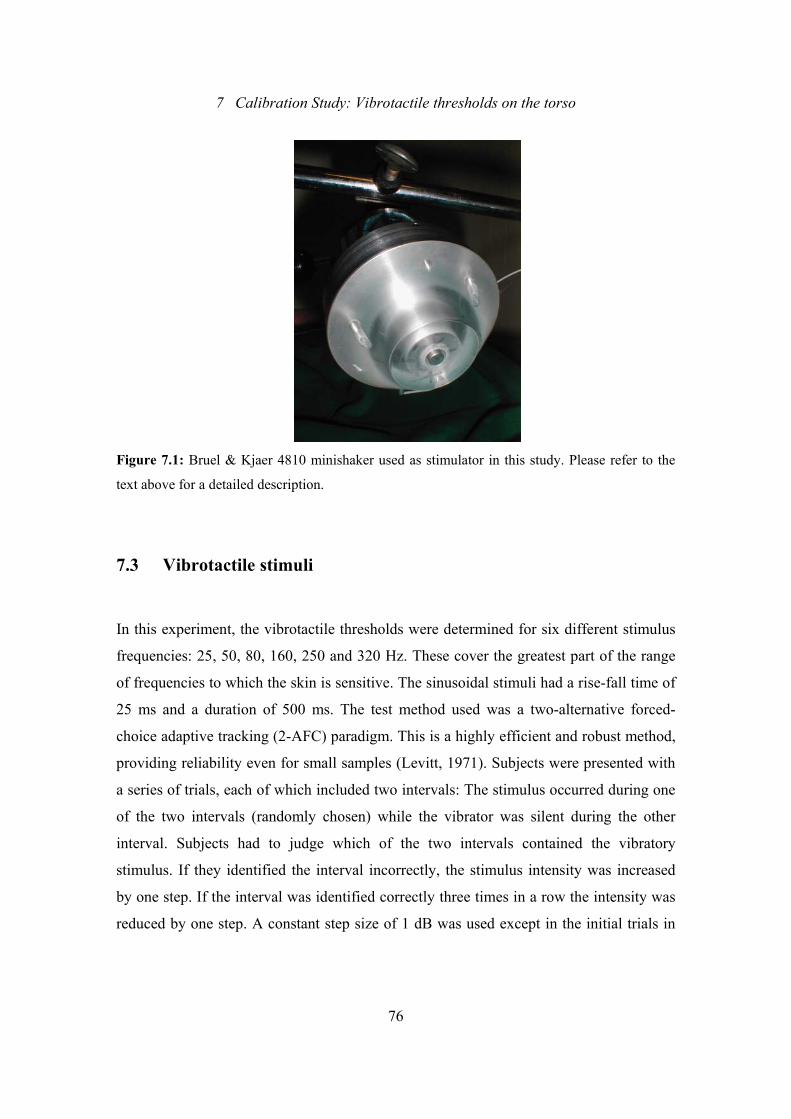
7 Calibration Study: Vibrotactile thresholds on the torso
76
Figure 7.1: Bruel & Kjaer 4810 minishaker used as stimulator in this study. Please refer to the
text above for a detailed description.
7.3 Vibrotactile stimuli
In this experiment, the vibrotactile thresholds were determined for six different stimulus
frequencies: 25, 50, 80, 160, 250 and 320 Hz. These cover the greatest part of the range
of frequencies to which the skin is sensitive. The sinusoidal stimuli had a rise-fall time of
25 ms and a duration of 500 ms. The test method used was a two-alternative forced-
choice adaptive tracking (2-AFC) paradigm. This is a highly efficient and robust method,
providing reliability even for small samples (Levitt, 1971). Subjects were presented with
a series of trials, each of which included two intervals: The stimulus occurred during one
of the two intervals (randomly chosen) while the vibrator was silent during the other
interval. Subjects had to judge which of the two intervals contained the vibratory
stimulus. If they identified the interval incorrectly, the stimulus intensity was increased
by one step. If the interval was identified correctly three times in a row the intensity was
reduced by one step. A constant step size of 1 dB was used except in the initial trials in
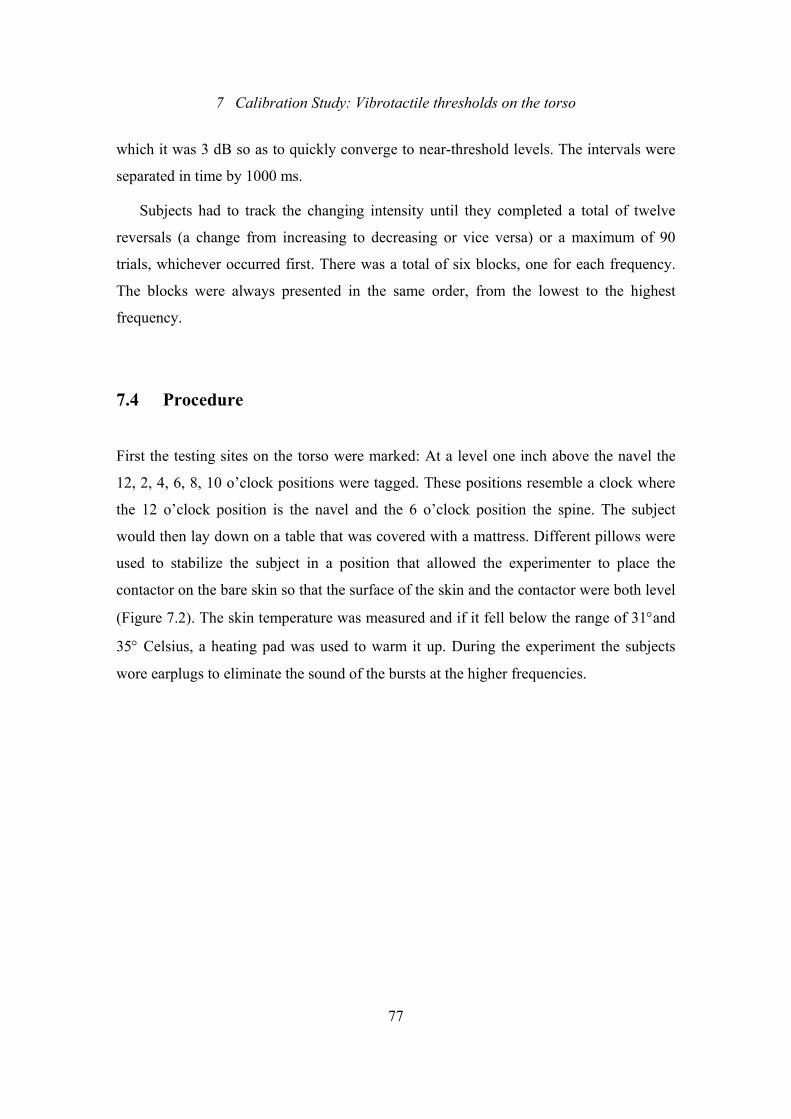
7 Calibration Study: Vibrotactile thresholds on the torso
77
which it was 3 dB so as to quickly converge to near-threshold levels. The intervals were
separated in time by 1000 ms.
Subjects had to track the changing intensity until they completed a total of twelve
reversals (a change from increasing to decreasing or vice versa) or a maximum of 90
trials, whichever occurred first. There was a total of six blocks, one for each frequency.
The blocks were always presented in the same order, from the lowest to the highest
frequency.
7.4 Procedure
First the testing sites on the torso were marked: At a level one inch above the navel the
12, 2, 4, 6, 8, 10 o’clock positions were tagged. These positions resemble a clock where
the 12 o’clock position is the navel and the 6 o’clock position the spine. The subject
would then lay down on a table that was covered with a mattress. Different pillows were
used to stabilize the subject in a position that allowed the experimenter to place the
contactor on the bare skin so that the surface of the skin and the contactor were both level
(Figure 7.2). The skin temperature was measured and if it fell below the range of 31°and
35° Celsius, a heating pad was used to warm it up. During the experiment the subjects
wore earplugs to eliminate the sound of the bursts at the higher frequencies.
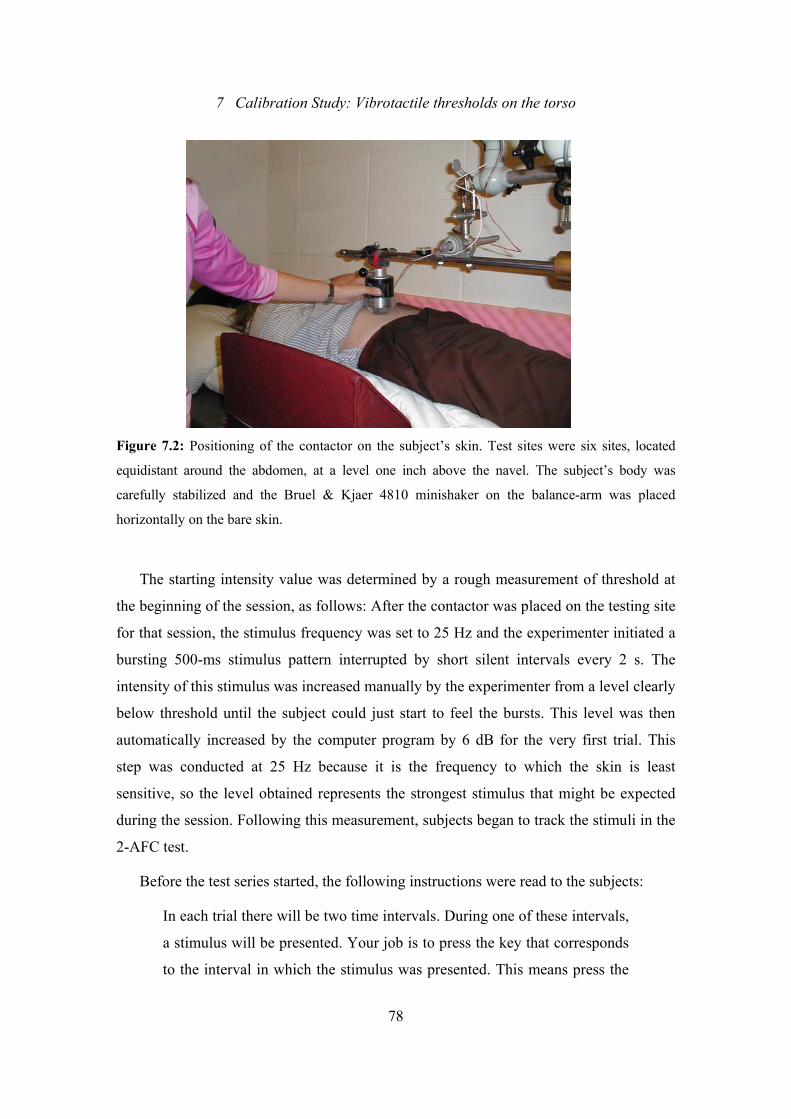
7 Calibration Study: Vibrotactile thresholds on the torso
78
Figure 7.2: Positioning of the contactor on the subject’s skin. Test sites were six sites, located
equidistant around the abdomen, at a level one inch above the navel. The subject’s body was
carefully stabilized and the Bruel & Kjaer 4810 minishaker on the balance-arm was placed
horizontally on the bare skin.
The starting intensity value was determined by a rough measurement of threshold at
the beginning of the session, as follows: After the contactor was placed on the testing site
for that session, the stimulus frequency was set to 25 Hz and the experimenter initiated a
bursting 500-ms stimulus pattern interrupted by short silent intervals every 2 s. The
intensity of this stimulus was increased manually by the experimenter from a level clearly
below threshold until the subject could just start to feel the bursts. This level was then
automatically increased by the computer program by 6 dB for the very first trial. This
step was conducted at 25 Hz because it is the frequency to which the skin is least
sensitive, so the level obtained represents the strongest stimulus that might be expected
during the session. Following this measurement, subjects began to track the stimuli in the
2-AFC test.
Before the test series started, the following instructions were read to the subjects:
In each trial there will be two time intervals. During one of these intervals,
a stimulus will be presented. Your job is to press the key that corresponds
to the interval in which the stimulus was presented. This means press the
7 Calibration Study: Vibrotactile thresholds on the torso
79
key labeled “1” if you feel the burst during the first interval and press the
key labeled “2” if you feel the burst during the second interval.
Most of the time the stimulus will be weak. There may be trials in
which you don’t feel anything in any of the intervals, but make your best
guess. We do expect that you will get some of them wrong, so try not to
get frustrated.
We will start at a level where you should be able to feel the stimulus.
When you answer correctly the intensity of the stimulus will be reduced
and when you answer incorrectly the intensity will be increased.
To start the testing sequence, subjects had to press the number four key on the
keyboard. The visual display showed the word “READY” and the next keystroke on
either of the two response keys initiated the first trial. After the two intervals were
presented and the subjects had responded, the visual display read “READY” again and
then subjects could start the next trial by pressing one of the response keys.
Consequently, subjects controlled when the next trial was presented. There was no
feedback given whether their answers were correct. A flashing light and a loud click
(clearly audible even with the earplugs) marked each of the two intervals. Additionally,
the numbers 1 and 2 were counted off on the visual display to indicate the intervals.
Subjects were informed of the number of blocks and told that the number of trials in
each block would vary depending on how quickly they would reach their threshold. From
their participation in prior threshold measures on other body sites (finger, palm of the
hand), subjects were aware of the changes in the perceived quality of the vibration that
would occur over blocks of trials as the stimulus frequency changed. Each body site was
tested in a separate session, the order of body sites was counterbalanced over subjects.
Three of the subjects were tested twice at each body site. One subject could only be tested
once at the six different sites and one subject served in only one testing session.
7 Calibration Study: Vibrotactile thresholds on the torso
80
7.5 Results and discussion
At the end of the session, before removing the stimulator from the subject’s body,
threshold (in dB) was calculated from the average of the function generator settings over
the final seven reversals for every frequency (25, 50, 80, 160, 250 and 320 Hz ). After
each physical dB setting was calculated, the threshold stimulus (frequency/ intensity
combination) was again presented to the subject’s skin. The physical stimulus intensity
was then measured while the shaker was loaded by the skin using the integral contactor/
accelerometer. Threshold acceleration was converted to physical displacement (in
microns), and the average calculated over subjects and sessions. Seven observations were
made for each frequency and body site except for the 12 o’clock position where eight
observations were obtained. Figure 7.3 shows the average of the thresholds for each
frequency and body site, expressed in decibels (dB) with reference to 1-µm peak
displacement . This measurement unit is used here because it is the unit that is commonly
seen in the literature on tactile psychophysics. Specifically, the total peak-to-peak
displacement of the sinusoidal stimulus that was calculated from the acceleration
measurement is divided in half (producing peak displacement), and then converted into
the logarithm of a ratio to 1 microm. The formula is:
20 * log10(peak displacement in microm/1 microm).
Consequently, a change of 6 dB indicates a doubling or halving, while 20 dB on this
scale reflects a ten-fold difference in magnitude. Thus the 80-dB range on the ordinate
represents a total of 4 log units - a 10 000-1 range of intensity.
The standard errors for the different test sites and frequencies varied between 1.50
and 7.12 dB, showing a quite large variation in the data. The largest standard errors were
obtained at the 6 o’clock position (the spine). Because the body shape shows a more or
less distinctive indentation at this site, it was difficult to ensure proper contact of the
contactor with the skin at this site, adding to the variability.
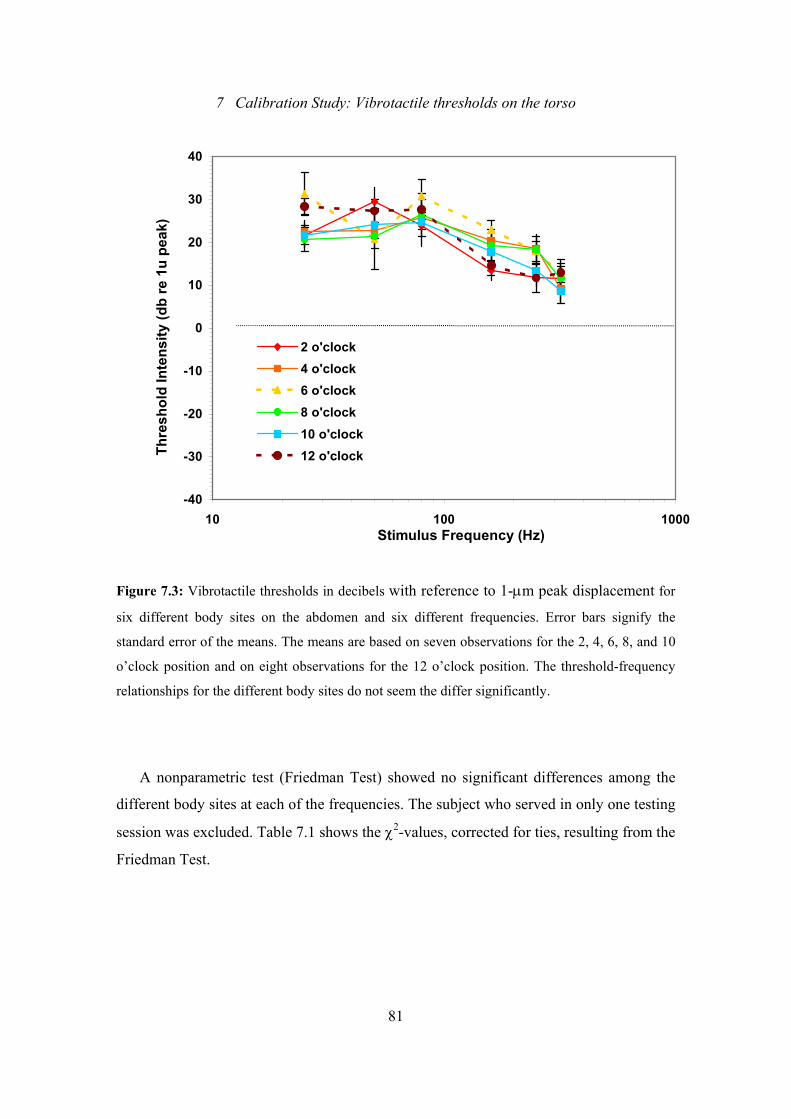
7 Calibration Study: Vibrotactile thresholds on the torso
81
-40
-30
-20
-10
0
10
20
30
40
10 100 1000Stimulus Frequency (Hz)
Thre
shol
d In
tens
ity (d
b re
1u
peak
)
2 o'clock4 o'clock6 o'clock8 o'clock10 o'clock12 o'clock
Figure 7.3: Vibrotactile thresholds in decibels with reference to 1-µm peak displacement for
six different body sites on the abdomen and six different frequencies. Error bars signify the
standard error of the means. The means are based on seven observations for the 2, 4, 6, 8, and 10
o’clock position and on eight observations for the 12 o’clock position. The threshold-frequency
relationships for the different body sites do not seem the differ significantly.
A nonparametric test (Friedman Test) showed no significant differences among the
different body sites at each of the frequencies. The subject who served in only one testing
session was excluded. Table 7.1 shows the χ2-values, corrected for ties, resulting from the
Friedman Test.
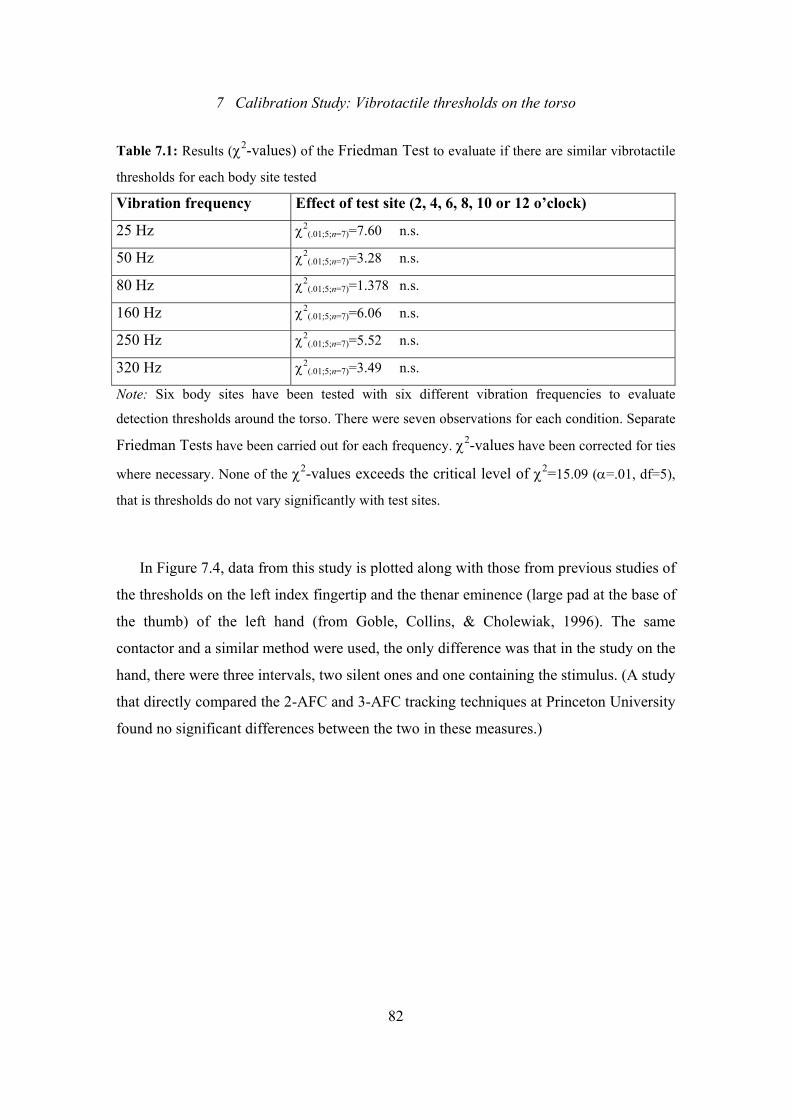
7 Calibration Study: Vibrotactile thresholds on the torso
82
Table 7.1: Results (χ2-values) of the Friedman Test to evaluate if there are similar vibrotactile
thresholds for each body site tested
Vibration frequency Effect of test site (2, 4, 6, 8, 10 or 12 o’clock)
25 Hz χ2(.01;5;n=7)=7.60 n.s.
50 Hz χ2(.01;5;n=7)=3.28 n.s.
80 Hz χ2(.01;5;n=7)=1.378 n.s.
160 Hz χ2(.01;5;n=7)=6.06 n.s.
250 Hz χ2(.01;5;n=7)=5.52 n.s.
320 Hz χ2(.01;5;n=7)=3.49 n.s.
Note: Six body sites have been tested with six different vibration frequencies to evaluate
detection thresholds around the torso. There were seven observations for each condition. Separate
Friedman Tests have been carried out for each frequency. χ2-values have been corrected for ties
where necessary. None of the χ2-values exceeds the critical level of χ2=15.09 (α=.01, df=5),
that is thresholds do not vary significantly with test sites.
In Figure 7.4, data from this study is plotted along with those from previous studies of
the thresholds on the left index fingertip and the thenar eminence (large pad at the base of
the thumb) of the left hand (from Goble, Collins, & Cholewiak, 1996). The same
contactor and a similar method were used, the only difference was that in the study on the
hand, there were three intervals, two silent ones and one containing the stimulus. (A study
that directly compared the 2-AFC and 3-AFC tracking techniques at Princeton University
found no significant differences between the two in these measures.)
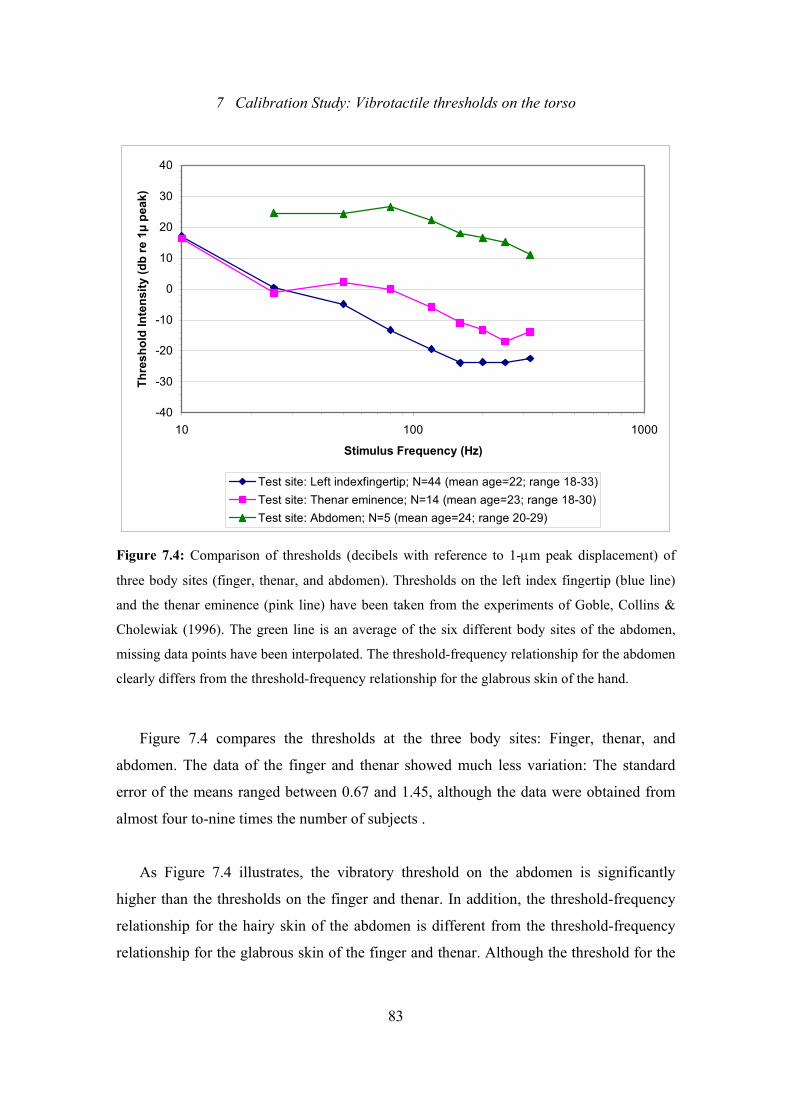
7 Calibration Study: Vibrotactile thresholds on the torso
83
-40
-30
-20
-10
0
10
20
30
40
10 100 1000
Stimulus Frequency (Hz)
Thre
shol
d In
tens
ity (d
b re
1µ
peak
)
Test site: Left indexfingertip; N=44 (mean age=22; range 18-33)Test site: Thenar eminence; N=14 (mean age=23; range 18-30)Test site: Abdomen; N=5 (mean age=24; range 20-29)
Figure 7.4: Comparison of thresholds (decibels with reference to 1-µm peak displacement) of
three body sites (finger, thenar, and abdomen). Thresholds on the left index fingertip (blue line)
and the thenar eminence (pink line) have been taken from the experiments of Goble, Collins &
Cholewiak (1996). The green line is an average of the six different body sites of the abdomen,
missing data points have been interpolated. The threshold-frequency relationship for the abdomen
clearly differs from the threshold-frequency relationship for the glabrous skin of the hand.
Figure 7.4 compares the thresholds at the three body sites: Finger, thenar, and
abdomen. The data of the finger and thenar showed much less variation: The standard
error of the means ranged between 0.67 and 1.45, although the data were obtained from
almost four to-nine times the number of subjects .
As Figure 7.4 illustrates, the vibratory threshold on the abdomen is significantly
higher than the thresholds on the finger and thenar. In addition, the threshold-frequency
relationship for the hairy skin of the abdomen is different from the threshold-frequency
relationship for the glabrous skin of the finger and thenar. Although the threshold for the
7 Calibration Study: Vibrotactile thresholds on the torso
84
abdomen also decreases with higher frequencies, the curve is more flat than those for the
finger and thenar which shows a more noticeable decline and a maximum sensitivity at
250 Hz (specifically, this is a manifestation of the contribution of the Pacinian Corpuscle
population). The fact that the abdomen has a lower density of neural elements and a
different receptor structure than the glabrous skin of the hand (see Chapter 2) might
explain the differences in shape, the higher threshold level, as well the higher variability.
Weinstein (1968) evaluated tactile sensitivity for points touching the skin, but not
vibrating against it, at numerous body sites using three different measures: Pressure
sensitivity, two-point discrimination and point-localization. The two spatial measures,
two point discrimination and point-localization correlated highly, showing that the fingers
and the palm are significantly more sensitive than the belly. Alternatively, looking at
pressure sensitivity thresholds, the fingers and the palm were significantly less sensitive
compared to the belly.
Wilska’s (1954) data are consistent with our findings: Vibratory thresholds are
significantly higher on the abdomen than on the finger and thenar (compare Figure 2.2:
Vibratory thresholds on a number of body sites). It seems that depending on the nature of
the stimulus – single pulse or vibration – and the method used, different thresholds are
obtained.
As a practical outcome of this preliminary study for the experiments to follow we
decided to carry out threshold measures at the beginning of each testing session to ensure
that stimuli are clearly perceivable. However, we will not vary stimulus intensity over
testing sites on the abdomen as detection thresholds did not vary significantly over sites.
Thus, every site will be stimulated with the same intensity level. This intensity level will
be adjusted for each subject due to the large variation in the threshold data of this study.
8 Pilot Study 1: Direction of movement
85
8. Pilot Study 1: Identification of the direction of tactile
movement around the torso
Essick (1998) describes in his review article a number of studies where a linear
relationship between directional sensitivity and the length of skin traversed was
discovered. In these studies different kinds of stimuli like brushing stimuli, moving
patterns on the OPTACON, an air stream, or a rolling wheel were used at different body
sites. The length of skin traversed varied from a few mm to less than 10 cm. At less-well
innervated test sites like the back, longer distances were required to achieve the same
directional sensitivity as at highly innervated test sites like the finger pad.
The velocity of the moving stimuli also has an impact on discrimination performance:
Essick cites studies that proved that the connection between directional sensitivity and the
logarithm of velocity could be described as an inverted U-shaped function, with poor
directional discrimination at the lowest and highest velocities employed while the best
discrimination performance occurred at intermediate velocities. The velocity of motion at
which subjects’ directional sensitivity reached its peak differed with the test site: At
highly innervated test sites, the peak sensitivity occurred at lower velocities than at less-
well innervated test sites. There is also an interaction between the velocity and the
traversed length: The effect of velocity on directional sensitivity was smaller for long
lengths of skin traversed. At long lengths (note: the criteria for “long” differs with test
site due to its innervation density), subjects obtained nearly 100% correct responses, even
at high velocities; the longer the length of skin traversed, the higher the velocity limit
could be.
Gardner & Sklar (1994) used the OPTACON to produce motion by successive
activation of stimuli on the fingertip when they studied discrimination performance. They
found that the length of skin that was stimulated was not crucial, but the number of pulses
was (that is the number of activated mechanoreceptors). Stimulation of only two points
was not sufficient for direction discrimination independent of the spacings between the
two points (1.2-4.8 mm, two-point threshold on the finger is 2 mm). But discrimination
8 Pilot Study 1: Direction of movement
86
performance increased linearly with the number of pulses and was close to 100% when
eight or more pulses were delivered.
To my knowledge, no study has yet published data that examined directional
discrimination for saltatory stimulus patterns, although Cholewiak and Collins (2000) did
mention pilot work that explored this question with patterns presented to the arm. But
studies on the impact of continuity of tactile motion suggest that stimuli delivered over
long lengths of skin are judged primarily on the basis of positional cues (changes in
position). Therefore, the discrimination performance should be independent of the
stimulus patterns (successively activated or saltatory) applied in this pilot study.
In our first pilot study simulated movement travels around the whole circumference
of the waist, which is a distance that exceeds by far the distances traversed in previous
studies. We therefore expect discrimination performance to be nearly perfect,
independent of temporal parameters (SD/ISI) and stimulus patterns (saltatory or
successive activation).
If our data verifies our hypothesis we will drop the quality direction in the
experiments to follow, as it adds no additional information about the quality of apparent
motion or the differences in the perception of the successively and saltatory patterns.
8.1 Subjects
Seven subjects participated in the study: Six males and one female, aged between 23 and
33, mean age was 27. The male subjects were recruited from the Naval School’s
Command (in Pensacola, Florida)−future pilots waiting for their flying training. The
female subject was a psychologist, working for NAMRL. Two subjects had prior
experience with tactile experiments, but the equipment and the task of this earlier
experiment were entirely different. None of the subjects reported any medical condition
8 Pilot Study 1: Direction of movement
87
that might affect his/her sensitivity of the trunk or ability to operate the keyboard. Five
subjects were right-handed as tested with the Edinburgh Handedness Survey.
8.2 Tactile stimuli
A description of the experimental equipment used in this pilot study is given in the
“General Methods” section. Only the middle row of the 36 tactor array was activated.
The distances between the tactors varied with the subjects’ waist-circumference, which
ranged between 67 and 97 cm, with an average of 89 cm. Thus, the distance between each
activated tactor ranged between 5.6 and 8.1 cm. Stimulus frequency was 250 Hz. The
tactors were activated sequentially in order to simulate movement around the torso.
Seven different levels of stimulus duration (SD) and interstimulus interval (ISI)
spaced at roughly logarithmic intervals were studied: 16 ms, 24 ms, 32 ms, 48 ms, 64 ms,
96 ms and 128 ms. The direction of movement was either clockwise or counterclockwise.
The combination of seven SD and seven ISI levels and two directions resulted in 98 trials
per block. These trials were randomly presented in each block. Each testing session
consisted of two blocks of trials: In one block every tactor was successively activated, in
the other block only every second tactor was activated twice (saltatory pattern). The
movement started and ended at the navel, so that subjects couldn’t tell the difference
between the two stimulus patterns on the basis of the traversed lengths of the patterns.
Although the number of loci activated differed in the successively activated and saltatory
stimulus patterns, the temporal parameters (SD/ISI) corresponded, as did the number of
stimuli in both modes. Subjects were not told how many sites were activated, nor did they
know that there were two different modes of presentation. The order of the two
presentation modes varied randomly, some subjects started with the successively
activated patterns block, some with the saltation block.

8 Pilot Study 1: Direction of movement
88
8.3 Apparatus
To judge the direction of tactile movement the subjects had to press one of two keys of a
ten-key-keyboard. Eight of the keys were covered with a paper strip, so that only the two
response keys were visible. These keys were labeled “1 clockwise” and “2
counterclockwise” and a small drawing, showing the corresponding direction, was added.
On one side of the keyboard there was an additional key, labeled “AL” (Alignment
button) which subjects had to press to go to the next step in the testing procedure or to get
the next stimulus during the test series. An alpha-numeric display was mounted on the
wall in front of them, providing task related information.
8.4 Procedure
The experimental procedure followed the steps described in the “General Methods”
section: First the “familiarization pattern” was presented to make sure that tactors had
proper skin contact. Subsequently they were presented with the threshold measure,
followed by the trial series. A standardized instruction (see Annex D) was read to the
subjects. They were asked to hit the key corresponding to the direction of movement as
quickly and as accurately as possible. There was no time limit for entering an answer and
no feedback given as to whether the answers were correct or incorrect.
In order to get the next stimulus, subjects had to press the “AL”-key, so they were in
control of when the next stimulus was presented. Subjects were instructed that there were
two blocks of trials and they could take a brief break in between the blocks if they
wished. Before the subjects started the first trial, they were asked if they had any
questions and requested to wear headphones to eliminate any acoustical cues or
distractors.
After subjects pressed the “AL”-Key, there was a preparatory delay of 600 ms and
then the first stimulus pattern was presented. When subjects had made their decision and
pressed the number corresponding to the direction of the simulated movement, the visual
8 Pilot Study 1: Direction of movement
89
display read “Ready” and subjects could press the “AL”-Key again to get the next
stimulus pattern. After the test was completed subjects were interviewed if they had any
difficulties performing the task, if the equipment was comfortable and if they noticed any
differences between the presented patterns. On the average it took 13 minutes to complete
the trial series.
8.5 Results
Post-test interviews with the subjects indicated that the equipment was comfortable and
easy to handle. Nobody had problems understanding the task. Most people recognized
when they made a mistake and many said that they pushed the wrong key only
erroneously. Nobody realized that the two blocks were presented in different modes, but
some subjects noted that the saltatory patterns would feel “smoother” and “less intense”
than the successively activated patterns.
The percentage of correct direction discriminations exceeded 98% of the trials for
each of the seven subjects. None of the subjects made more than three errors in the testing
session, which consisted of 196 trials at a time:
- One subject made 0 mistakes
- Five subjects made 1 mistake
- One subject made 3 mistakes
There was no accumulation of errors at any particular SD/ISI condition. Errors
occurred over the whole range of possible velocities, from the slowest (SD=128 ms and
ISI=128 ms; based on the average waist circumference of 89 cm this equals a velocity of
27.8 cm/s) to the fastest (SD=16 ms, ISI=16 ms, velocity = 222.5 cm/s). Figure 8.1 shows
the different combinations of SD and ISI, where errors were found.
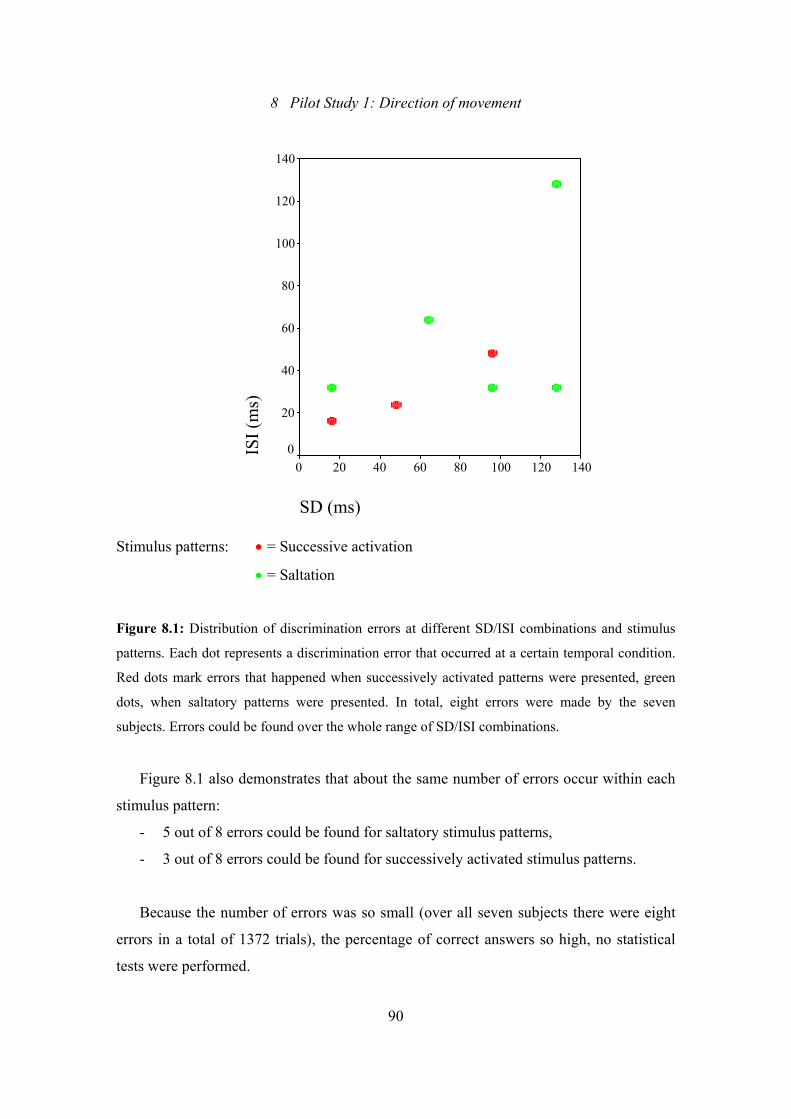
8 Pilot Study 1: Direction of movement
90
SD (ms)
140120100806040200
ISI (
ms)
140
120
100
80
60
40
20
0
Stimulus patterns: • = Successive activation
• = Saltation
Figure 8.1: Distribution of discrimination errors at different SD/ISI combinations and stimulus
patterns. Each dot represents a discrimination error that occurred at a certain temporal condition.
Red dots mark errors that happened when successively activated patterns were presented, green
dots, when saltatory patterns were presented. In total, eight errors were made by the seven
subjects. Errors could be found over the whole range of SD/ISI combinations.
Figure 8.1 also demonstrates that about the same number of errors occur within each
stimulus pattern:
- 5 out of 8 errors could be found for saltatory stimulus patterns,
- 3 out of 8 errors could be found for successively activated stimulus patterns.
Because the number of errors was so small (over all seven subjects there were eight
errors in a total of 1372 trials), the percentage of correct answers so high, no statistical
tests were performed.
8 Pilot Study 1: Direction of movement
91
We specifically explored if there were any other testing conditions where
discrimination errors accumulated, but for the same reason as mentioned above, no
statistical significance test could be carried out. There was a slight tendency that the
direction of counterclockwise patterns was more often misjudged than the direction of
clockwise patterns.
Because some of the subjects stated that the task was “very easy” and “boring” we
examined the data for any evidence of fatigue, such as an accumulation of errors at the
end of the testing session (which lasted between 10 and 15 minutes). But the same
amount of errors occurred in the first and in the second block. It is most likely that the
discrimination errors are due to a short lack of concentration.
8.6 Discussion
In the first pilot study we studied subjects’ ability to discriminate the direction of
vibrotactile movement around the torso. Movement varied in terms of stimulus pattern
(saltatory/successive activation), direction (clockwise/counterclockwise) and temporal
parameters (SD/ISI). For the length of skin traversed in this study (movement around the
torso), subjects’ direction discrimination performance was close to 100%, independent of
temporal parameters and stimulus patterns (saltatory/successive activation). These
findings correspond with those of Cholewiak and Collins (2000): In their experiment with
a vibrotactile array on the arm (seven tactors, inter tactor distance of 27.5 mm, total
extent of the array: 165 mm) subjects didn’t make mistakes in either stimulus pattern.
When movement travels around the torso along an array consisting of 12 tactors,
velocity has no impact on directional sensitivity. With the temporal parameters and the
length of the array we used in our study we have exceeded the criterion where direction
can be undoubtedly discriminated.
8 Pilot Study 1: Direction of movement
92
As a practical conclusion of this first pilot study, we decided to drop the quality
direction from further consideration in the experiments to follow. Furthermore, the
experimental procedure as well as the testing equipment proved to be feasible for the
following experiments. No subject had problems understanding the task and the belt that
the tactors were attached to fit well.
For the main experiments we should keep one interesting point in view: While
percepts of continuous movement requires spatiotemporal integration of discrete
activated points, direction discrimination requires separation of activated sites in space
and time. It will be interesting to see if the spatiotemporal parameters that are best for
direction discrimination are also best or different for percepts of smooth, continuous
movement.
9 Pilot Study 2: Different saltatory paradigms
93
9 Pilot Study 2: Limits of spatio-temporal integration
dependent on the number of stimuli delivered to a
stimulus location in the saltatory paradigm
In the second pilot study we want to explore the effect of the distance between activated
stimulus sites, which is in these studies related to the number of stimuli at each activated
site. The question was whether these variables limit the integration of saltatory stimulus
patterns into a percept of continuous motion, where perceptual processes fill-in missing
spots between activated sites.
In a two-alternative, forced-choice comparison subjects were asked to decide which
of two vibrotactile patterns is best in terms of straightness, smoothness, and spatial
distribution (for a definition of these qualities see Annex C). One of the patterns in each
trial was successively activated, the other pattern was presented in one of three saltatory
modes. The saltatory patterns differed with regard to the number of pulses delivered to
each activated site, consequently varying the distance in-between activated sites (see
Figure 9.1). In every case, the same overall distance was covered by the tactors and the
same total number of stimuli was delivered in each stimulus pattern. Within a trial, the
temporal parameters of the two patterns to be compared were identical.
Geldard (1982) compared veridical movement with saltation using a six tactor array
that was placed on both forearms. On the left forearm the six contactors were stimulated
successively, whereas on the right forearm three tactors, covering the same distance (the
exact distance isn’t specified by Geldard), were activated twice each. At interstimulus
intervals (ISI) between 50 and 100 ms both patterns produced equal sensations: “A more
or less continuous sweep punctuated by six evenly spaced taps” (Geldard, 1982, p. 140).
When both patterns (successive activation and saltation) were alternately presented, the
only difference was that saltatory patterns felt somewhat weaker.
9 Pilot Study 2: Different saltatory paradigms
94
In their experiment Cholewiak and Collins (2000) also tested if two vibrotactile
patterns presented vertically on the back–one successively activated, one saltatory–
produced comparable sensations. In successively activated stimulus patterns one stimulus
was presented sequentially at all seven sites. In the saltatory mode, seven stimuli were
presented at three sites: Three at the first, three at the fourth and one at the seventh site of
a linear array. The experimental procedure they used was similar to ours. Their results
indicate a strong equivalence of the two stimulus patterns. When subjects were asked to
discriminate between the two stimulus patterns, their discrimination performance was
better for short ISIs, but independent of SD. But, when subjects had to judge which of the
two stimulus patterns was best in terms of continuous movement, neither SD nor ISI had
a significant effect on the preference for one stimulus pattern (successively activated or
saltatory).
These results show that different response paradigms (patterns are the same/different
versus which of the two patterns produces better movement perception) lead to different
results concerning the comparability of simulated movement produced by successively
activated and saltatory stimulus patterns. Maybe the different response paradigms direct
subjects’ attention to different stimulus criteria: When subjects had to discriminate
between the two stimulus patterns they might identify gaps between activated sites in the
saltatory presentation mode–but then one would expect that these gaps occur at large
ISIs, when stimuli are not as easily integrated. It remains an open question why the
highest discriminability was found for the shortest ISIs.
When subjects had to decide which of two stimulus patterns is best they might focus
more on the quality of movement of each pattern presented, to a lesser extent on the
distinctions between the patterns. Since one practical aim of our experiments is to find the
optimal spatio-temporal parameters for simulated movement for the design of tactile
displays, we wanted subjects to judge which of the two stimulus patterns was best in
terms of continuous movement. In the experiments to follow we will choose the best
saltation mode for simulating movement and apply both response paradigms to further
explore the results they generate.
9 Pilot Study 2: Different saltatory paradigms
95
Varying the number of stimuli per test site, as we do in our second pilot study,
influences the temporal conditions for saltation as well as the size of the saltatory area:
Increasing the number of pulses at each contactor requires shortening of the ISI to
achieve well-distributed jumping between activated sites. Using the reduced rabbit
paradigm, Geldard (1982) could show that the number of pulses at the first stimulus
location influences the size of the saltatory area: The more pulses were delivered, the
larger the saltatory leaps became.
The purpose of our studies is to find the optimal spatio-temporal parameters where
successively and saltatory patterns both generate a percept of continuous motion. In this
pilot study we focus on the spatial conditions, i.e. the distance between activated stimulus
sites, respectively the number of stimuli at each activated site. We will thus test if there
are there limits to the integration of saltatory patterns into a percept of continuous motion,
when the number of activated sites and thus the distance in-between them is varied. We
expect that as the successively activated and saltatory patterns are expected to produce
equivalent percepts of apparent motion within the spatiotemporal limits used, there
should be no preference for one pattern, regardless of the varying number of pulses in the
different saltatory patterns and the varying distance in-between activated sites.
If the results of this pilot study show that the similarity between saltatory and
successively activated patterns requires a certain distance in-between activated sites, or
that a certain number of pulses has to be delivered to each site, these specifications for
saltatory patterns should be selected for the experiments to follow.

9 Pilot Study 2: Different saltatory paradigms
96
9.1 Subjects
Six male subjects, recruited from the Naval Schools Command, participated in the study.
They were between 24 and 30 years old, mean age was 26.3. Four subjects were right-
handed. One subject was also tested in the prior pilot study (identification of direction).
Nobody indicated any medical condition that might affect his ability to serve in the
experiment.
9.2 Tactile stimuli
The same equipment as described in the General Methods section was used. Only the
middle row of the 36-tactor-belt (three rows of 12 tactors) was activated. Seven levels of
stimulus durations (SD) and interstimulus intervals (ISI) were studied: 16 ms, 24 ms, 32
ms, 48 ms, 64 ms, 96 ms and 128 ms. This time, the direction of movement was only
clockwise. Stimulus frequency was again 250 Hz, as in the first pilot study.
In each trial, two patterns were presented: One saltatory, one successively activated.
The patterns had identical temporal parameters, but the number of loci activated differed.
Every tactor was either activated sequentially, or, in the saltatory patterns, the distance
between activated tactors and thus the number of pluses delivered to each tactor varied.
As before, in every presentation the number of stimuli was kept constant.
We generated three different modes of saltation in this pilot study:
In the saltation mode 1 condition, two stimuli were presented at the first location (the
navel), two at the third, two at the fifth and so on.
In the saltation mode 2 condition, there were three stimuli at the first location, three
at the fourth, three at the seventh and so on.
In the saltation mode 3 condition every fourth tactor was activated four times.
Note, that the total number of stimuli was always the same, only the number of loci
activated–and thus the distance in-between activated tactors–and how often a single locus
was activated changed. Each time the movement started and ended at the navel although
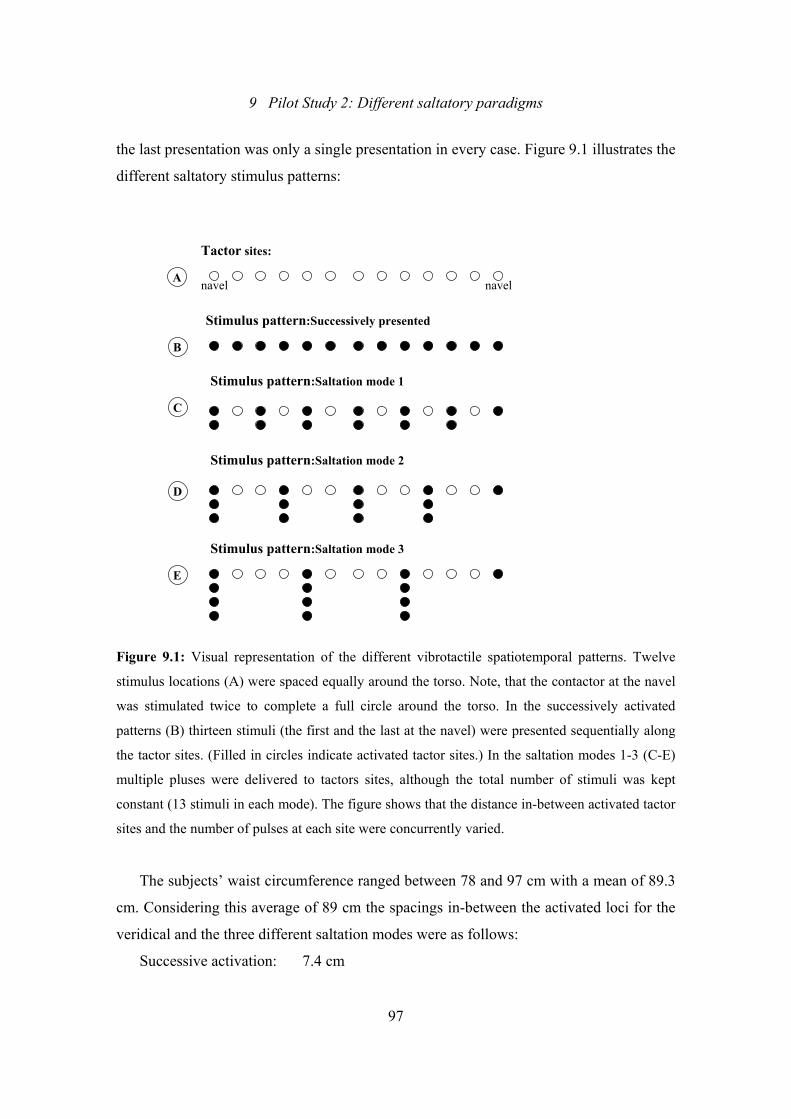
9 Pilot Study 2: Different saltatory paradigms
97
the last presentation was only a single presentation in every case. Figure 9.1 illustrates the
different saltatory stimulus patterns:
Tactor sites:
navel navel
Stimulus pattern:Successively presented
Stimulus pattern:Saltation mode 1
Stimulus pattern:Saltation mode 2
Stimulus pattern:Saltation mode 3
A
C
D
E
B
Figure 9.1: Visual representation of the different vibrotactile spatiotemporal patterns. Twelve
stimulus locations (A) were spaced equally around the torso. Note, that the contactor at the navel
was stimulated twice to complete a full circle around the torso. In the successively activated
patterns (B) thirteen stimuli (the first and the last at the navel) were presented sequentially along
the tactor sites. (Filled in circles indicate activated tactor sites.) In the saltation modes 1-3 (C-E)
multiple pluses were delivered to tactors sites, although the total number of stimuli was kept
constant (13 stimuli in each mode). The figure shows that the distance in-between activated tactor
sites and the number of pulses at each site were concurrently varied.
The subjects’ waist circumference ranged between 78 and 97 cm with a mean of 89.3
cm. Considering this average of 89 cm the spacings in-between the activated loci for the
veridical and the three different saltation modes were as follows:
Successive activation: 7.4 cm
9 Pilot Study 2: Different saltatory paradigms
98
saltation mode 1: 14.8 cm
saltation mode 2: 22.3 cm
saltation mode 3: 29.7 cm
To compare the three different saltation modes to the successively activated stimulus
patterns, three blocks of trials were generated. In each block the successively activated
stimulus patterns were to be compared to one of the three saltation modes. Each block
consisted of 98 trials: All possible combinations of the seven levels of SDs and ISIs were
utilized and the order of the two different patterns (one successively activated, one
saltation) was randomized. Subjects did not know that there were different stimulus
patterns. The order of the three blocks was varied for each subject: Some subjects started
with a comparison between the successively activated stimulus patterns and saltation
mode 3 condition, some with a comparison between the successively activated stimulus
patterns and the saltation mode 2 condition and some with a comparison between the
successively activated stimulus patterns and the saltation mode 1 condition.
9.3 Apparatus
As response device, we used the same keyboard as in the previous pilot study, but eight
of the ten keys were covered with a paper strip so that only the two response keys were
visible. These were labeled “1” and “2”, indicating which of the two presented patterns
the subject preferred – the first or the second one in the sequence.
The alpha-numeric display on the wall displayed task-related information to the
subjects, like the current phase of the experiment (“Rotating Tactors”, “Threshold
Measure”, “Block 1”’…) or short instructions (“Which is best 1 / 2”) to let the subjects
know what keys they were supposed to press.
9 Pilot Study 2: Different saltatory paradigms
99
9.4 Procedure
The experimental procedure of this pilot study resembled the procedure specified in the
General Method section. When the subjects were comfortably seated in the kneeling-
chair they were instructed to judge, which of two stimulus patterns feels best in terms of
continuous motion around the torso. Guidelines to determine this judgment were
provided, and included: Which line feels straighter, smoother, and equally distributed in
both, space and time (for complete instructions see Annex E). These guidelines were
written on a piece of paper and hung on the wall in front of the subjects, just above the
visual display, so the subjects could refer to the definition of “best” during the whole
testing session. Subjects responded by pressing a button on the keyboard (number 1 for
the first stimulus pattern and number 2 for the second). There were advised that there
were no correct or incorrect responses and no feedback will be given.
After the familiarization pattern (each of the 12 tactors was sequentially activated)
and the threshold measure, the first block of trials was presented. Subjects could start the
presentation of the patterns themselves by pressing an extra key on the keyboard
(“Alignment-key”). When subjects had started a trial there was a preparatory delay of 600
ms, before the first pattern was presented. After the first pattern, there was a short break
of 2.4 s, before the second pattern was presented automatically. There was no time limit
for the subjects’ decision of which of the two patterns was best. Subjects were told that
the testing session consisted of three blocks of trials and that they could take a brief break
between the blocks if they wished and could start the following block themselves.
Before starting the first block subjects could ask questions and were required to wear
headphones. On the average the testing duration was 36 minutes (Min.=27 minutes,
Max.=46 minutes). After the test ended the experimenter interviewed the subjects to ask
if they experienced any difficulties during the test. Notes were taken on any remarks the
subjects made.
9 Pilot Study 2: Different saltatory paradigms
100
9.5 Results
The judgments were encoded as follows: When a saltatory stimulus pattern was chosen as
best, a score of 0.00 was recorded, when a successively activated stimulus pattern was
chosen, a score of 1.00 was entered. Subjects clearly preferred the successively activated
stimulus patterns over all of the three saltation modes: In 85.3 percent of trials
(accumulated over subjects) successively activated patterns were preferred. As the
saltatory effect varies from subject to subject (see Stolle, 2003), we calculated χ2-tests
separately for each subject and also for each saltation mode to evaluate if the subjects’
preferences are randomly distributed over the saltatory or successively activated patterns. Table
9.1 shows the results. None of the subjects preferred the saltatory stimulus pattern over
the successively activated pattern. In the saltation mode 1 and saltation mode 2 condition
there was one subject at a time which had no significant preference for one stimulus
pattern. The preference for the successively activated patterns is clearest for the saltation
mode 3 condition where the inter-tactor distance is the largest: Here, every subject
preferred the successively activated patterns significantly more often and χ2-values are
predominantly largest.
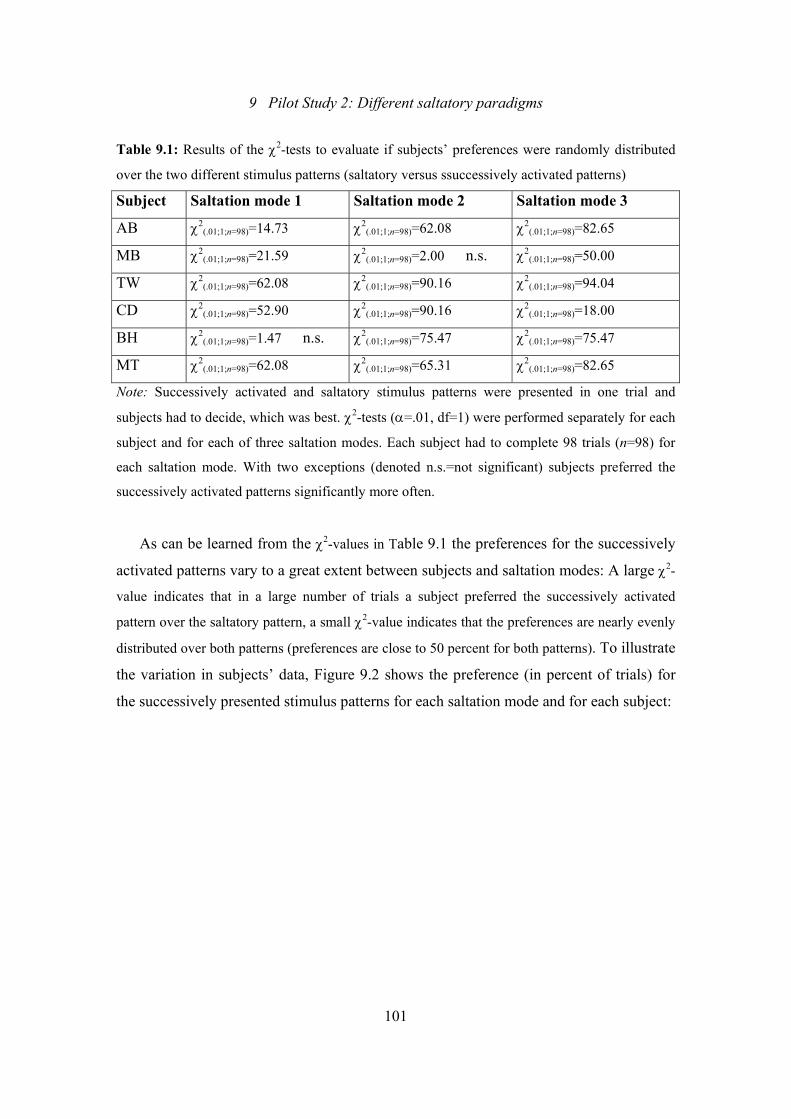
9 Pilot Study 2: Different saltatory paradigms
101
Table 9.1: Results of the χ2-tests to evaluate if subjects’ preferences were randomly distributed
over the two different stimulus patterns (saltatory versus ssuccessively activated patterns)
Subject Saltation mode 1 Saltation mode 2 Saltation mode 3
AB χ2(.01;1;n=98)=14.73 χ2
(.01;1;n=98)=62.08 χ2(.01;1;n=98)=82.65
MB χ2(.01;1;n=98)=21.59 χ2
(.01;1;n=98)=2.00 n.s. χ2(.01;1;n=98)=50.00
TW χ2(.01;1;n=98)=62.08 χ2
(.01;1;n=98)=90.16 χ2(.01;1;n=98)=94.04
CD χ2(.01;1;n=98)=52.90 χ2
(.01;1;n=98)=90.16 χ2(.01;1;n=98)=18.00
BH χ2(.01;1;n=98)=1.47 n.s. χ2
(.01;1;n=98)=75.47 χ2(.01;1;n=98)=75.47
MT χ2(.01;1;n=98)=62.08 χ2
(.01;1;n=98)=65.31 χ2(.01;1;n=98)=82.65
Note: Successively activated and saltatory stimulus patterns were presented in one trial and
subjects had to decide, which was best. χ2-tests (α=.01, df=1) were performed separately for each
subject and for each of three saltation modes. Each subject had to complete 98 trials (n=98) for
each saltation mode. With two exceptions (denoted n.s.=not significant) subjects preferred the
successively activated patterns significantly more often.
As can be learned from the χ2-values in Table 9.1 the preferences for the successively
activated patterns vary to a great extent between subjects and saltation modes: A large χ2-
value indicates that in a large number of trials a subject preferred the successively activated
pattern over the saltatory pattern, a small χ2-value indicates that the preferences are nearly evenly
distributed over both patterns (preferences are close to 50 percent for both patterns). To illustrate
the variation in subjects’ data, Figure 9.2 shows the preference (in percent of trials) for
the successively presented stimulus patterns for each saltation mode and for each subject:
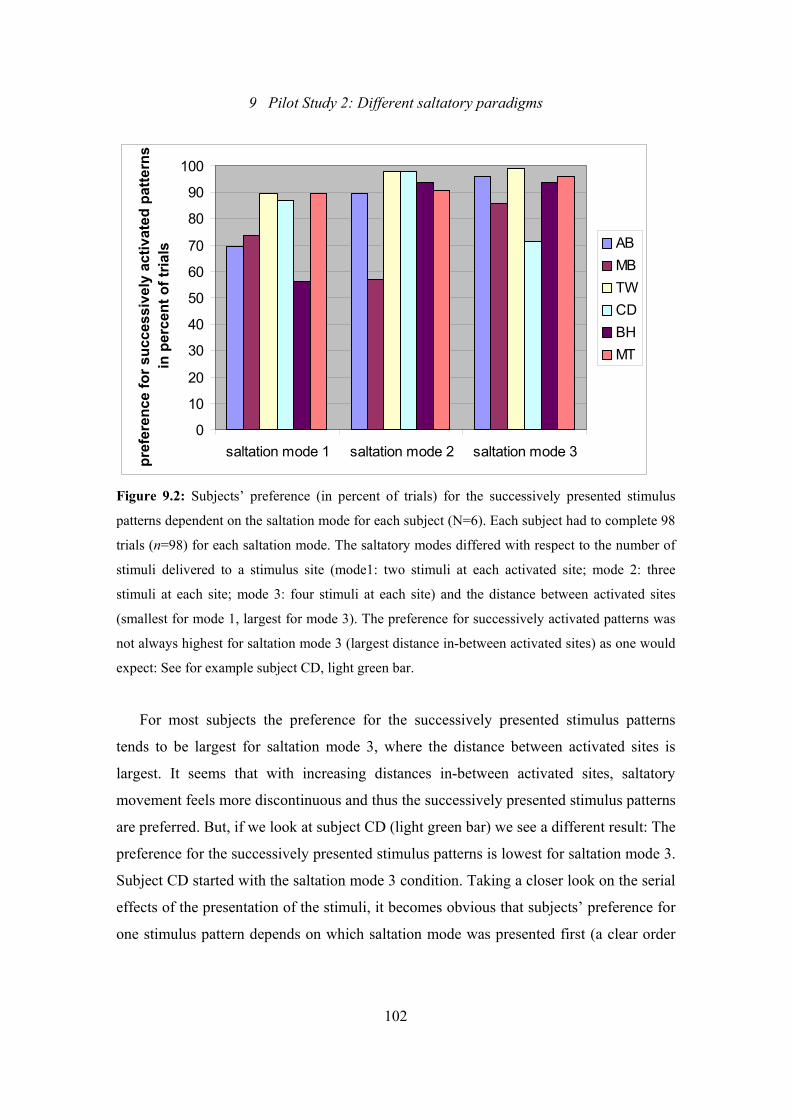
9 Pilot Study 2: Different saltatory paradigms
102
0
10
20
30
40
50
60
70
80
90
100
saltation mode 1 saltation mode 2 saltation mode 3
pref
eren
ce fo
r suc
cess
ivel
y ac
tivat
ed p
atte
rns
in p
erce
nt o
f tria
ls ABMBTWCDBHMT
Figure 9.2: Subjects’ preference (in percent of trials) for the successively presented stimulus
patterns dependent on the saltation mode for each subject (N=6). Each subject had to complete 98
trials (n=98) for each saltation mode. The saltatory modes differed with respect to the number of
stimuli delivered to a stimulus site (mode1: two stimuli at each activated site; mode 2: three
stimuli at each site; mode 3: four stimuli at each site) and the distance between activated sites
(smallest for mode 1, largest for mode 3). The preference for successively activated patterns was
not always highest for saltation mode 3 (largest distance in-between activated sites) as one would
expect: See for example subject CD, light green bar.
For most subjects the preference for the successively presented stimulus patterns
tends to be largest for saltation mode 3, where the distance between activated sites is
largest. It seems that with increasing distances in-between activated sites, saltatory
movement feels more discontinuous and thus the successively presented stimulus patterns
are preferred. But, if we look at subject CD (light green bar) we see a different result: The
preference for the successively presented stimulus patterns is lowest for saltation mode 3.
Subject CD started with the saltation mode 3 condition. Taking a closer look on the serial
effects of the presentation of the stimuli, it becomes obvious that subjects’ preference for
one stimulus pattern depends on which saltation mode was presented first (a clear order
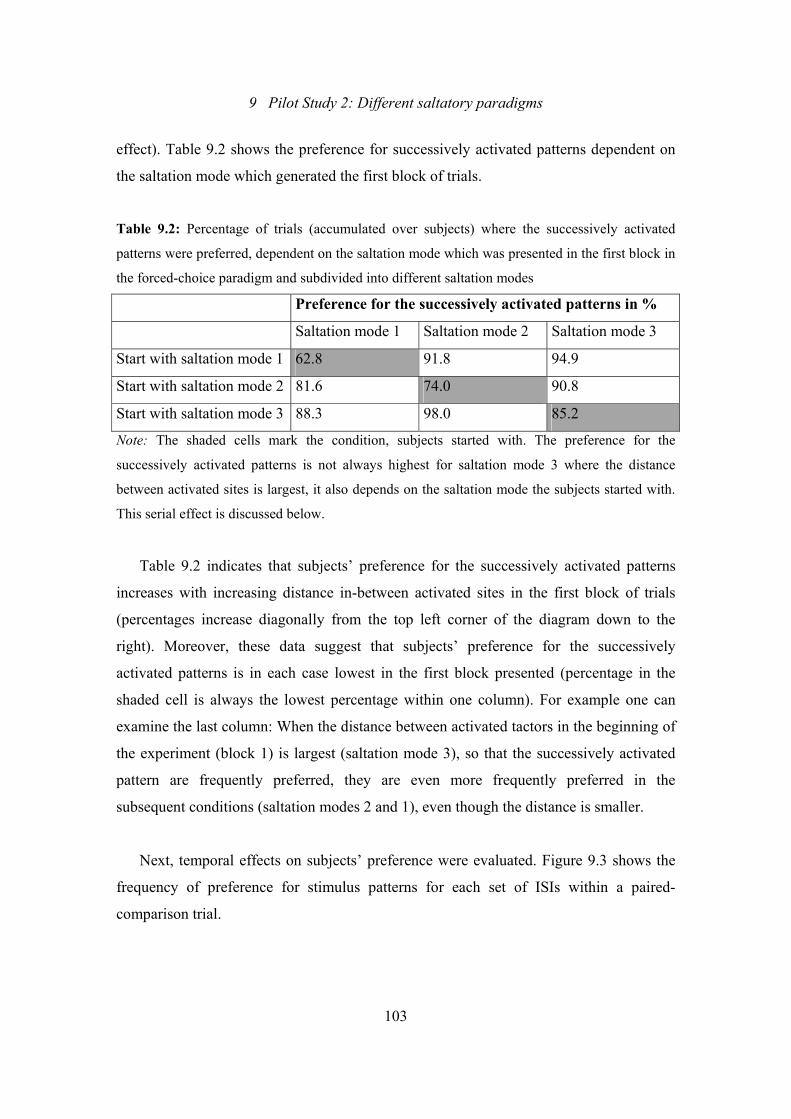
9 Pilot Study 2: Different saltatory paradigms
103
effect). Table 9.2 shows the preference for successively activated patterns dependent on
the saltation mode which generated the first block of trials.
Table 9.2: Percentage of trials (accumulated over subjects) where the successively activated
patterns were preferred, dependent on the saltation mode which was presented in the first block in
the forced-choice paradigm and subdivided into different saltation modes
Preference for the successively activated patterns in %
Saltation mode 1 Saltation mode 2 Saltation mode 3
Start with saltation mode 1 62.8 91.8 94.9
Start with saltation mode 2 81.6 74.0 90.8
Start with saltation mode 3 88.3 98.0 85.2
Note: The shaded cells mark the condition, subjects started with. The preference for the
successively activated patterns is not always highest for saltation mode 3 where the distance
between activated sites is largest, it also depends on the saltation mode the subjects started with.
This serial effect is discussed below.
Table 9.2 indicates that subjects’ preference for the successively activated patterns
increases with increasing distance in-between activated sites in the first block of trials
(percentages increase diagonally from the top left corner of the diagram down to the
right). Moreover, these data suggest that subjects’ preference for the successively
activated patterns is in each case lowest in the first block presented (percentage in the
shaded cell is always the lowest percentage within one column). For example one can
examine the last column: When the distance between activated tactors in the beginning of
the experiment (block 1) is largest (saltation mode 3), so that the successively activated
pattern are frequently preferred, they are even more frequently preferred in the
subsequent conditions (saltation modes 2 and 1), even though the distance is smaller.
Next, temporal effects on subjects’ preference were evaluated. Figure 9.3 shows the
frequency of preference for stimulus patterns for each set of ISIs within a paired-
comparison trial.
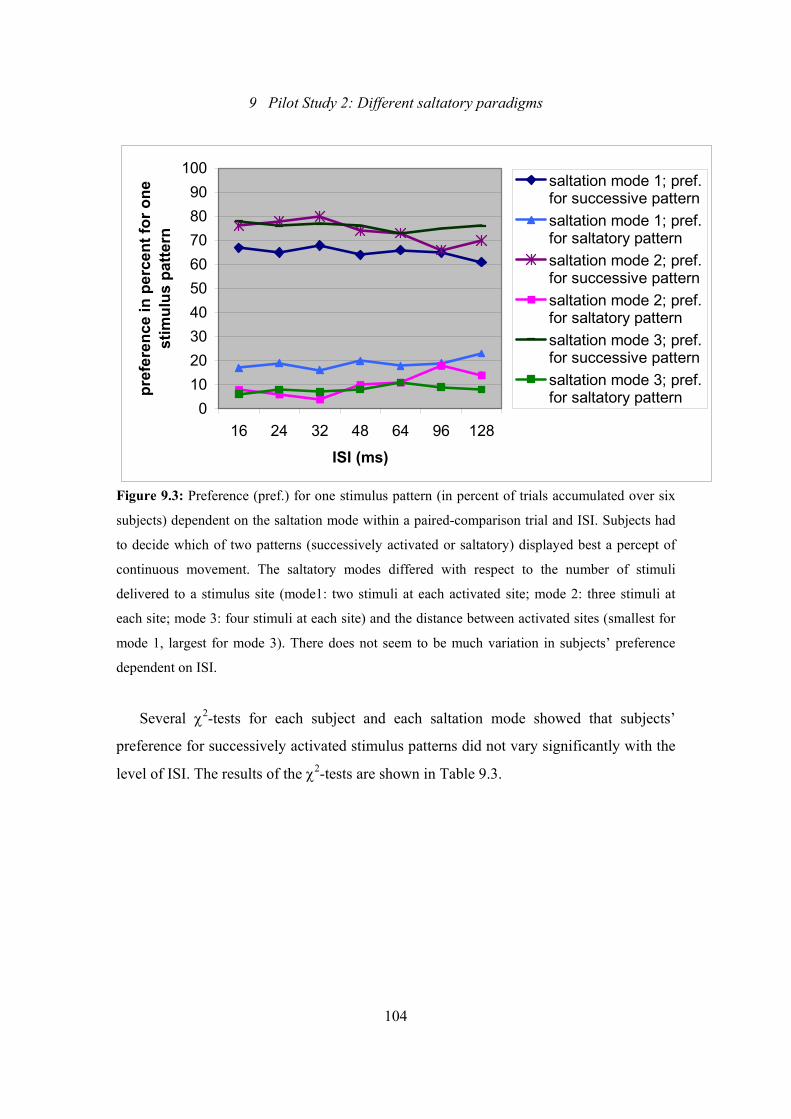
9 Pilot Study 2: Different saltatory paradigms
104
0102030405060708090
100
16 24 32 48 64 96 128
ISI (ms)
pref
eren
ce in
per
cent
for o
ne
stim
ulus
pat
tern
saltation mode 1; pref.for successive patternsaltation mode 1; pref.for saltatory patternsaltation mode 2; pref.for successive patternsaltation mode 2; pref.for saltatory patternsaltation mode 3; pref.for successive patternsaltation mode 3; pref.for saltatory pattern
Figure 9.3: Preference (pref.) for one stimulus pattern (in percent of trials accumulated over six
subjects) dependent on the saltation mode within a paired-comparison trial and ISI. Subjects had
to decide which of two patterns (successively activated or saltatory) displayed best a percept of
continuous movement. The saltatory modes differed with respect to the number of stimuli
delivered to a stimulus site (mode1: two stimuli at each activated site; mode 2: three stimuli at
each site; mode 3: four stimuli at each site) and the distance between activated sites (smallest for
mode 1, largest for mode 3). There does not seem to be much variation in subjects’ preference
dependent on ISI.
Several χ2-tests for each subject and each saltation mode showed that subjects’
preference for successively activated stimulus patterns did not vary significantly with the
level of ISI. The results of the χ2-tests are shown in Table 9.3.
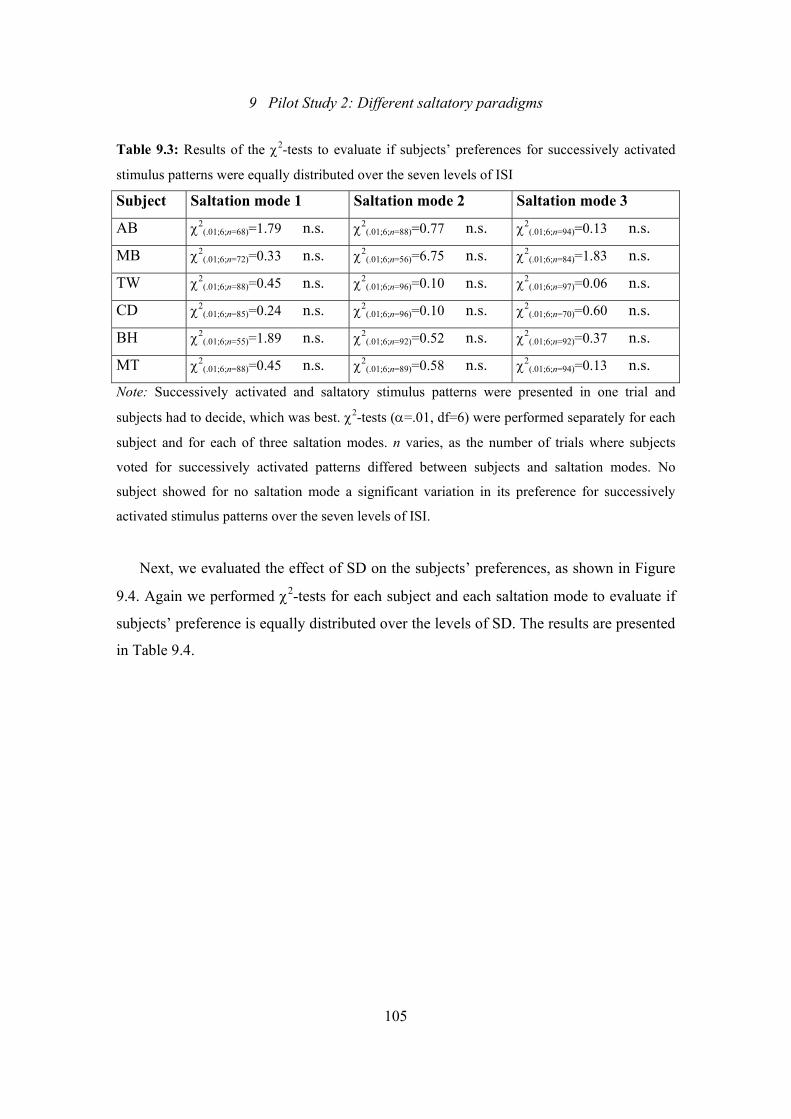
9 Pilot Study 2: Different saltatory paradigms
105
Table 9.3: Results of the χ2-tests to evaluate if subjects’ preferences for successively activated
stimulus patterns were equally distributed over the seven levels of ISI
Subject Saltation mode 1 Saltation mode 2 Saltation mode 3
AB χ2(.01;6;n=68)=1.79 n.s. χ2
(.01;6;n=88)=0.77 n.s. χ2(.01;6;n=94)=0.13 n.s.
MB χ2(.01;6;n=72)=0.33 n.s. χ2
(.01;6;n=56)=6.75 n.s. χ2(.01;6;n=84)=1.83 n.s.
TW χ2(.01;6;n=88)=0.45 n.s. χ2
(.01;6;n=96)=0.10 n.s. χ2(.01;6;n=97)=0.06 n.s.
CD χ2(.01;6;n=85)=0.24 n.s. χ2
(.01;6;n=96)=0.10 n.s. χ2(.01;6;n=70)=0.60 n.s.
BH χ2(.01;6;n=55)=1.89 n.s. χ2
(.01;6;n=92)=0.52 n.s. χ2(.01;6;n=92)=0.37 n.s.
MT χ2(.01;6;n=88)=0.45 n.s. χ2
(.01;6;n=89)=0.58 n.s. χ2(.01;6;n=94)=0.13 n.s.
Note: Successively activated and saltatory stimulus patterns were presented in one trial and
subjects had to decide, which was best. χ2-tests (α=.01, df=6) were performed separately for each
subject and for each of three saltation modes. n varies, as the number of trials where subjects
voted for successively activated patterns differed between subjects and saltation modes. No
subject showed for no saltation mode a significant variation in its preference for successively
activated stimulus patterns over the seven levels of ISI.
Next, we evaluated the effect of SD on the subjects’ preferences, as shown in Figure
9.4. Again we performed χ2-tests for each subject and each saltation mode to evaluate if
subjects’ preference is equally distributed over the levels of SD. The results are presented
in Table 9.4.
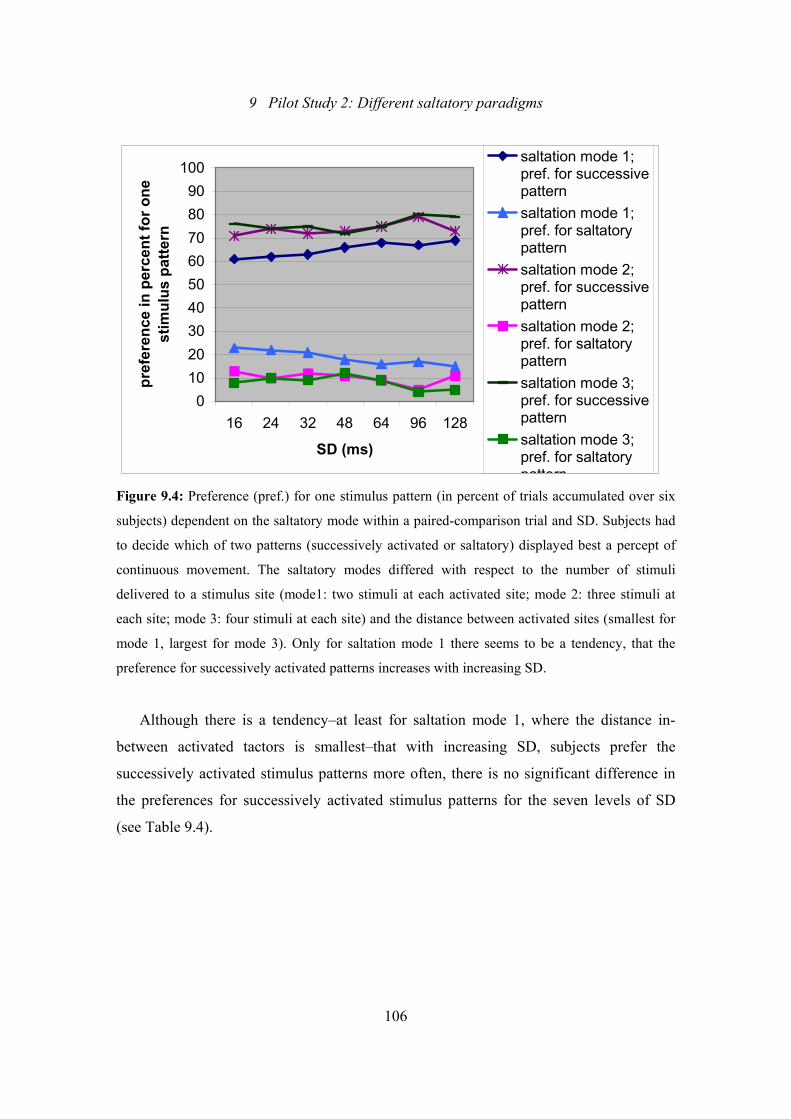
9 Pilot Study 2: Different saltatory paradigms
106
0102030405060708090
100
16 24 32 48 64 96 128
SD (ms)
pref
eren
ce in
per
cent
for o
ne
stim
ulus
pat
tern
saltation mode 1;pref. for successivepatternsaltation mode 1;pref. for saltatorypatternsaltation mode 2;pref. for successivepatternsaltation mode 2;pref. for saltatorypatternsaltation mode 3;pref. for successivepatternsaltation mode 3;pref. for saltatorypattern
Figure 9.4: Preference (pref.) for one stimulus pattern (in percent of trials accumulated over six
subjects) dependent on the saltatory mode within a paired-comparison trial and SD. Subjects had
to decide which of two patterns (successively activated or saltatory) displayed best a percept of
continuous movement. The saltatory modes differed with respect to the number of stimuli
delivered to a stimulus site (mode1: two stimuli at each activated site; mode 2: three stimuli at
each site; mode 3: four stimuli at each site) and the distance between activated sites (smallest for
mode 1, largest for mode 3). Only for saltation mode 1 there seems to be a tendency, that the
preference for successively activated patterns increases with increasing SD.
Although there is a tendency–at least for saltation mode 1, where the distance in-
between activated tactors is smallest–that with increasing SD, subjects prefer the
successively activated stimulus patterns more often, there is no significant difference in
the preferences for successively activated stimulus patterns for the seven levels of SD
(see Table 9.4).
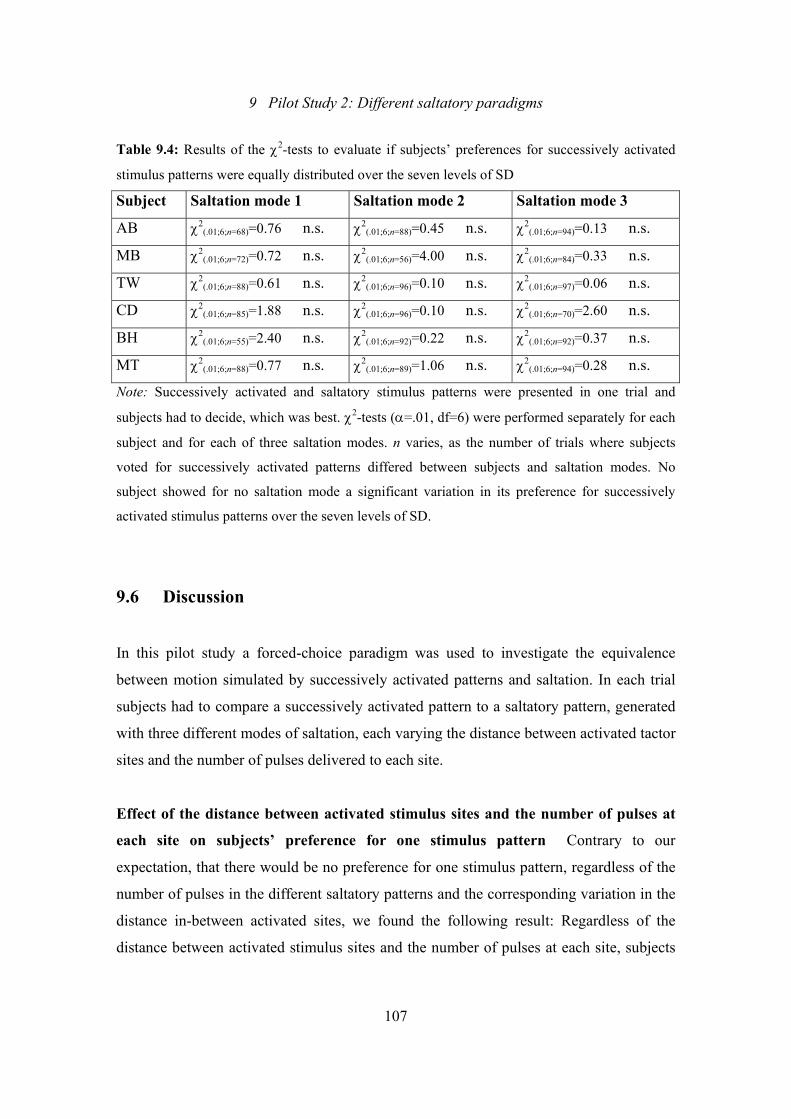
9 Pilot Study 2: Different saltatory paradigms
107
Table 9.4: Results of the χ2-tests to evaluate if subjects’ preferences for successively activated
stimulus patterns were equally distributed over the seven levels of SD
Subject Saltation mode 1 Saltation mode 2 Saltation mode 3
AB χ2(.01;6;n=68)=0.76 n.s. χ2
(.01;6;n=88)=0.45 n.s. χ2(.01;6;n=94)=0.13 n.s.
MB χ2(.01;6;n=72)=0.72 n.s. χ2
(.01;6;n=56)=4.00 n.s. χ2(.01;6;n=84)=0.33 n.s.
TW χ2(.01;6;n=88)=0.61 n.s. χ2
(.01;6;n=96)=0.10 n.s. χ2(.01;6;n=97)=0.06 n.s.
CD χ2(.01;6;n=85)=1.88 n.s. χ2
(.01;6;n=96)=0.10 n.s. χ2(.01;6;n=70)=2.60 n.s.
BH χ2(.01;6;n=55)=2.40 n.s. χ2
(.01;6;n=92)=0.22 n.s. χ2(.01;6;n=92)=0.37 n.s.
MT χ2(.01;6;n=88)=0.77 n.s. χ2
(.01;6;n=89)=1.06 n.s. χ2(.01;6;n=94)=0.28 n.s.
Note: Successively activated and saltatory stimulus patterns were presented in one trial and
subjects had to decide, which was best. χ2-tests (α=.01, df=6) were performed separately for each
subject and for each of three saltation modes. n varies, as the number of trials where subjects
voted for successively activated patterns differed between subjects and saltation modes. No
subject showed for no saltation mode a significant variation in its preference for successively
activated stimulus patterns over the seven levels of SD.
9.6 Discussion
In this pilot study a forced-choice paradigm was used to investigate the equivalence
between motion simulated by successively activated patterns and saltation. In each trial
subjects had to compare a successively activated pattern to a saltatory pattern, generated
with three different modes of saltation, each varying the distance between activated tactor
sites and the number of pulses delivered to each site.
Effect of the distance between activated stimulus sites and the number of pulses at
each site on subjects’ preference for one stimulus pattern Contrary to our
expectation, that there would be no preference for one stimulus pattern, regardless of the
number of pulses in the different saltatory patterns and the corresponding variation in the
distance in-between activated sites, we found the following result: Regardless of the
distance between activated stimulus sites and the number of pulses at each site, subjects
9 Pilot Study 2: Different saltatory paradigms
108
always preferred the successively activated patterns over the saltatory stimulus patterns.
Thus, the percepts produced by both stimulus patterns seem to be different. We seemed to
have crossed the spatial limits where saltatory patterns seem to be as evenly distributed as
successively activated patterns.
If we try to compare our results to those of Cholewiak and Collins (2000) we should
only consider trials where subjects started with the saltation mode 2 condition−three
pulses at each contactor (since this is the saltatory stimulus pattern used by Cholewiak
and Collins)−and only take into account the results of the first block to eliminate serial
effects. The mean frequency of the judgments (binary coded: 0=saltation and
1=successively activated) was 0.64 in Cholewiak’s experiment–indicating no significant
difference between the different stimulus patterns–compared to 0.74 in our experiment.
This small difference may be due to three factors:
1. Different spacing between tactors: In the “Princeton linear array” tactor separation
was 27.5 mm, while in our experiment it was 74 mm on an average−nearly three times as
much. But since saltatory leaping occurs over distances of 2-35 cm (Geldard, 1975)
between activated sites on the arm, the illusion should also be demonstrable at the
distances we used in the present experiment, even though innervation density on the torso
is poorer.
2. Different placement on the torso: Cholewiak and Collins (2000) placed their array
vertically on the lower aspect of the back, whereas our array was placed horizontally
around the torso. Mrsic et al. (2004) could demonstrate that the amount of displacement,
using the reduced rabbit paradigm depends amongst others on the direction of the
saltatory stimulus pattern in relation to the body axis. This may account for the observed
differences.
3. Crossing the body-midline: In our experiment, the saltatory movement crossed the
body-midline, while in Cholewiak and Collins’ (2000) experiments it did not.
Experiments using the reduced rabbit paradigm showed that a saltatory area–no matter
what body site was tested–was always truncated at the body-midline, when contactors
were placed bilaterally (e.g. Geldard, 1982, Geldard & Sherrick, 1986). Geldard (1975)
did mention, however, that if an additional stimulator is placed on the body-midline,
9 Pilot Study 2: Different saltatory paradigms
109
saltation occurs. In our present experiment we had three stimuli at the navel and three at
the spine (saltation mode 2), so we would have expected that this saltatory stimulus
pattern generates evenly distributed taps. Perhaps stimulating the body-midline initiated
saltatory leaping to some extent, but not as evenly as the saltatory leaping would have
been when the patterns were applied unilaterally as in Cholewiak and Collins (2000).
Effect of temporal stimulus parameters (ISI/SD) on subjects’ preference for one
presentation mode An effect of temporal parameters was not observed for any of the
saltation modes. In their experiments Cholewiak and Collins (2000) also found, that
temporal parameters (SD/ISIs in the range of 4-139 ms) did not affect equivalence
between the two stimulus patterns. They explained these findings with a previous
experiment that indicated that the quality of a line produced by vibrotactile stimuli–either
successively presented or saltatory–depends strongly on temporal parameters. As these
temporal parameters were held constant in the paired comparison, lines presented in
either mode should feel the same. Consequently, the temporal parameters of the
successively and saltatory patterns ought to differ within one trial to obtain an effect of
ISI or SD. So, the lack of an effect of ISI might be due to the experimental setting,
although in our experiment the two stimulus patterns failed to produce comparable
sensations.
Serial effects Although this was not the main purpose of this pilot study we also
analyzed serial effects of pattern presentation. Depending on the order in which the two
stimulus patterns were presented in one trial and the order of the saltation modes,
subjects’ preference for the successively activated versus the saltatory stimulus patterns
changed. It appeared that once subjects recognized that some tactors were skipped while
others were activated several times (saltation)–which is most obvious at the saltation
mode 3 condition–they may be more likely to perceive the difference between the two
stimulus patterns. It is more likely then that they will find the successively activated
pattern as straighter, smoother and more equally distributed compared to the saltatory
pattern. Once subjects detect the principle of saltation, they may pay more attention to the
spatial distribution of the pulses and are able to make a distinction between the saltatory
9 Pilot Study 2: Different saltatory paradigms
110
and successively activated patterns, also if the gaps between the activated sites get
narrower.
This result is reminiscent of the findings of Kilgard and Merzenich (1995): They
added a fourth stimulus to the reduced rabbit at the second stimulus site. When subjects
were told to concentrate on the proximal or distal region of the forearm, where the stimuli
were delivered, the location of the second and third taps shifted up and down the forearm
in the attended direction. Therefore they stated that “the perceived location of stimulus
pairs were largely determined by subjects’ selective attention and/or expectation”
(Kilgard & Merzenich, 1995, p. 663). Subjects who have detected that stimuli are
bunched up at certain locations (saltatory patterns) might thus more-easily localize the
veridical position of stimuli in the succeeding stimulus patterns.
The dynamic behaviour of neural networks might help to interpret our findings: That
the cortical representation of the tactile body map adapts dynamically to the focus of
attention was demonstrated amongst others by Braun et al. (2001). Once subjects in our
pilot study detect gaps in-between activated sites (in the saltatory patterns) they may
subsequently concentrate on these gaps to differentiate saltatory from successively
activated patterns. Thus the cortical representation of the distance in-between activated
sites might expand for saltatory patterns, facilitating the detection of gaps in subsequent
trials, even when those gaps become smaller. This finding would agree with Braun et al.’s
(2001) finding that if subjects focus their attention on certain stimulus locations (in our
present experiments these would be the stimulus sites were multiple stimuli are presented
in the saltatory patterns) the cortical representation of the distance between those sites
would be larger than when subjects concentrate on the whole stimulated area (which
would be the case when the saltatory and successively activated patterns produce the
indistinguishable percepts of motion).
As a practical outcome of this pilot study, we wanted to choose the saltation mode
that was most similar to the successively activated patterns. If we only consider trials
where subjects started with the saltation mode 1 condition and only look at the results of
the first block (comparison between a saltation mode 1 and a successively activated
pattern), the mean of the judgments was 0.63, which is still significantly different from a
9 Pilot Study 2: Different saltatory paradigms
111
value of 0.5 which would indicate that there is no preference for one stimulus pattern
(χ2(.01;1;n=196)=12.76). However, if the result was a mean of 0.59 judgments would be
randomly distributed. In only seven more trials–out of 196–subjects would have had to
answer “the saltatory pattern is better” to reach this random distribution.
For the following experiments we therefore chose the saltation mode 1, as it produces
the most similar sensations compared to the successively activated patterns.
10 Experiment 1: Quality judgments
112
10 Experiment 1: Integration of different spatio-temporal
stimulus patterns into a percept of continuous motion
measured by quality judgments
In the first experiment we will focus on the question whether two different stimulus patterns–
one saltatory, one successively activated–can be comparably integrated into a percept of
continuous motion. Such a transformation of tactile information by central neural networks
would comprise the perceptual merger of successive stimuli, i.e. the blanks between
successive stimuli are filled in to create the illusion of uninterrupted movement. The premises
of such an integration process are studied by varying different spatio-temporal stimulus
parameters. Judgments of the quality of movement will serve as correlates for the success of
this integration process. Stimuli are presented along an array around the trunk about 2.5 cm
above the navel.
Temporal effects By varying SD and ISI we will analyze the temporal conditions for the
integration of discrete stimuli (saltatory and successively activated stimulus patterns) into a
precept of continuous motion. According to the hypothesis described in Chapter 5 we expect
that shorter ISIs enhance the merger of discrete stimuli, thus quality judgments should
improve for shorter ISIs for both stimulus patterns. The effect of SD on the illusory percept of
motion produced by successively presented stimuli is such that increasing SD has been found
to improve the quality of apparent motion, but for saltatory stimulus patterns the effect of SD
is largely unknown. If we assume that both stimulus patterns undergo the same integration
process we hypothesize that longer SDs enhance the integration of both stimulus patterns into
a percept of continuous motion, thus quality judgments should improve for longer SDs. An
increase in SD should also support the merger of saltatory and successively activated stimulus
patterns into a percept of continuous motion over a wider range of ISIs, i.e. we expect to find
an interaction between SD and ISI.
Spatial effects In this experiment we will vary the number of test sites, that is the number of
activated tactors on the array that spans the whole circumference of the torso. Since we will
keep the total length of the array constant, the number of test sites will be confounded with
the spacing in-between activated tactors: The more tactors are active in a particular pattern,
the shorter the distance in-between them will be. Since we expect that not only the temporal,
10 Experiment 1: Quality judgments
113
but also the spatial relatedness between discrete stimuli enhances their integration we assume
that increasing the number of stimulus sites and thus decreasing the distance between
activated sites will lead to better quality judgments for both stimulus patterns.
Stimulus width as defined as in Chapter 5–three vertically placed, simultaneously
activated tactors–is not expected to affect the integration of either spatio-temporal stimulus
pattern into a percept of continuous motion. Thus quality judgments for both stimulus patterns
should not differ for wide (three tactors) and narrow (single tactor) stimuli.
Effects of vibration frequency In this experiment we will use two different vibration
frequencies: 80 and 250 Hz. The effect of vibration frequency on the integration of the two
stimulus patterns into a percept of continuous motion should not be significant. Thus quality
judgments for both stimulus patterns should not differ for the two different vibration
frequencies.
10.1 Method
Subjects In this experiment we tested 28 subjects with 250 Hz stimuli and 20 subjects with
80 Hz stimuli. In the 250 Hz group there were 22 males and 6 females. The subjects’ age
ranged between 22 and 33 years (M=25.0). 21 subjects were right-handers, and 7 subjects
were left-handers. Out of the 20 subjects tested with 80 Hz stimuli there were only two
females and 18 males. The youngest subjects were 22 years old, the oldest subject was 29
years old (M=23.8), 16 were right-handed, 3 were left-handed, and one was ambidextrous.
Procedure For this experiment we used the apparatus and stimulus parameters described in
the General Method section. The task of the subjects was to judge each one of the following
qualities:
- Length
- Straightness
- Smoothness
- Spatial Distribution
These qualities are identical to those used in Cholewiak and Collins (2000) study. After
extended pilot testing the authors found that these qualities are the most suitable ones to
reveal differences between the two stimulus patterns and are the most relevant for potential
10 Experiment 1: Quality judgments
114
applications in mobility, orientation, threat notice, and direction-finding. Due to the results of
Pilot Study 1 we excluded direction as a studied quality.
All of the possible combinations of SD and ISI levels and the two stimulus patterns
(saltatory and successively activated) were presented in one block (resulting in 98 trials per
block). Only one quality was to be judged in each block, so there were four blocks per
session. The order of qualities was randomized in each session. There were four sessions per
subject, each session representing a different spatial condition (8 versus 12 tactors, one versus
three simultaneously activated tactors). The spatial conditions were also randomly ordered
over the four testing sessions, which took place on four consecutive days. The direction of
movement was always clockwise and the first and last stimulus were presented on the navel.
The experimental procedure followed the steps described in the General Method Section
with one exception: To acquaint subjects with the temporal varieties of the stimulus patterns
they were presented with three sample patterns before the test series started. The visual
display read “Flo Samples” and subjects were able to start the sample, consisting of
consecutively presented stimuli, by pressing the “AL”-button. The first sample pattern
presented was the fastest one in terms of stimulus duration around the torso (250 Hz stimuli:
SD=16 ms/ISI=16 ms; 80 Hz stimuli: SD=12 ms/ISI=12 ms). The visual display read “Fast
Ready” and after pressing the “AL”-key again, the pattern was initiated after a 600 ms delay.
The second sample pattern was presented at medium velocity (250 Hz stimuli: SD=48
ms/ISI=48 ms; 80 Hz stimuli: SD=50 ms/ISI=50 ms) following the same procedure while the
third pattern was the slowest one possible (250 Hz stimuli: SD=128 ms/ISI=128 ms; 80 Hz
stimuli: SD=125 ms/ISI=125 ms).
Just before the test series started, instructions were read to the subjects (see Annex F).
They were told to make judgments of a certain quality of movement after the presentation of a
stimulus pattern, by pressing a button on the keyboard (number 1 meaning “least” to number
10 meaning “most”). They were also informed that there were no correct or incorrect answers.
In addition, a definition of each quality was given to the subjects.
Length: How much surface area does the line cover along the length of the array? This
may vary depending on the time of the bursts und burst durations. You may perceive the
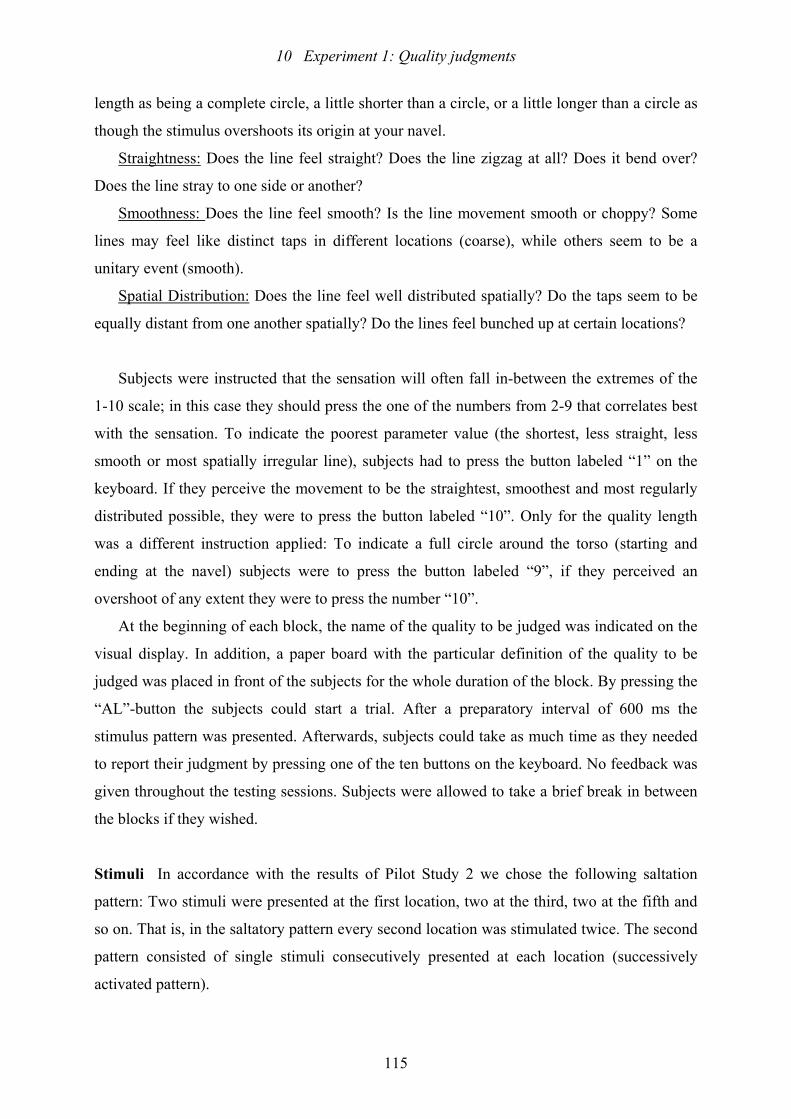
10 Experiment 1: Quality judgments
115
length as being a complete circle, a little shorter than a circle, or a little longer than a circle as
though the stimulus overshoots its origin at your navel.
Straightness: Does the line feel straight? Does the line zigzag at all? Does it bend over?
Does the line stray to one side or another?
Smoothness: Does the line feel smooth? Is the line movement smooth or choppy? Some
lines may feel like distinct taps in different locations (coarse), while others seem to be a
unitary event (smooth).
Spatial Distribution: Does the line feel well distributed spatially? Do the taps seem to be
equally distant from one another spatially? Do the lines feel bunched up at certain locations?
Subjects were instructed that the sensation will often fall in-between the extremes of the
1-10 scale; in this case they should press the one of the numbers from 2-9 that correlates best
with the sensation. To indicate the poorest parameter value (the shortest, less straight, less
smooth or most spatially irregular line), subjects had to press the button labeled “1” on the
keyboard. If they perceive the movement to be the straightest, smoothest and most regularly
distributed possible, they were to press the button labeled “10”. Only for the quality length
was a different instruction applied: To indicate a full circle around the torso (starting and
ending at the navel) subjects were to press the button labeled “9”, if they perceived an
overshoot of any extent they were to press the number “10”.
At the beginning of each block, the name of the quality to be judged was indicated on the
visual display. In addition, a paper board with the particular definition of the quality to be
judged was placed in front of the subjects for the whole duration of the block. By pressing the
“AL”-button the subjects could start a trial. After a preparatory interval of 600 ms the
stimulus pattern was presented. Afterwards, subjects could take as much time as they needed
to report their judgment by pressing one of the ten buttons on the keyboard. No feedback was
given throughout the testing sessions. Subjects were allowed to take a brief break in between
the blocks if they wished.
Stimuli In accordance with the results of Pilot Study 2 we chose the following saltation
pattern: Two stimuli were presented at the first location, two at the third, two at the fifth and
so on. That is, in the saltatory pattern every second location was stimulated twice. The second
pattern consisted of single stimuli consecutively presented at each location (successively
activated pattern).

10 Experiment 1: Quality judgments
116
Experimental design Independent variables were SD (seven levels), ISI (seven levels),
number of tactors on the linear array (8 or 12 tactors), stimulus width (single tactor versus
three simultaneously activated tactors), and vibration frequency (80 and 250 Hz). Dependent
variables were the four qualities of movement to be judged on the 10-point scale. Because of
the large number of independent variables, every subject was tested with every combination
of the independent variables only once.
10.2 Results
In the following analyses the four different qualities of movement: Straightness, smoothness,
spatial distribution, and length will be regarded separately, as in Cholewiak and Collins
(2000) study where they found that spatio-temporal stimulus parameters affected the different
qualities to different extents. The medians of the judgments were calculated for each stimulus
condition to be examined. Since we cannot prove that our data complies with the
requirements of a cardinal scale, we will use nonparametric tests.
10.2.1 Temporal effects
In the following analyses we will concentrate on tactile arrays containing only one row of
tactors. The effects of stimulus width (one row of tactors versus three rows of tactors) will be
considered separately.
Effect of ISI on quality judgments
The effect of ISI on the integration of spatio-temporal stimulus patterns will be examined
separately for the two different stimulus patterns (saltatory and successively activated), the
different vibration frequencies (80 and 250 Hz), and the different number of tactors on the
linear array (8 and 12 tactors).
Figures 10.1 to 10.4 show the effect of ISI on the quality ratings.
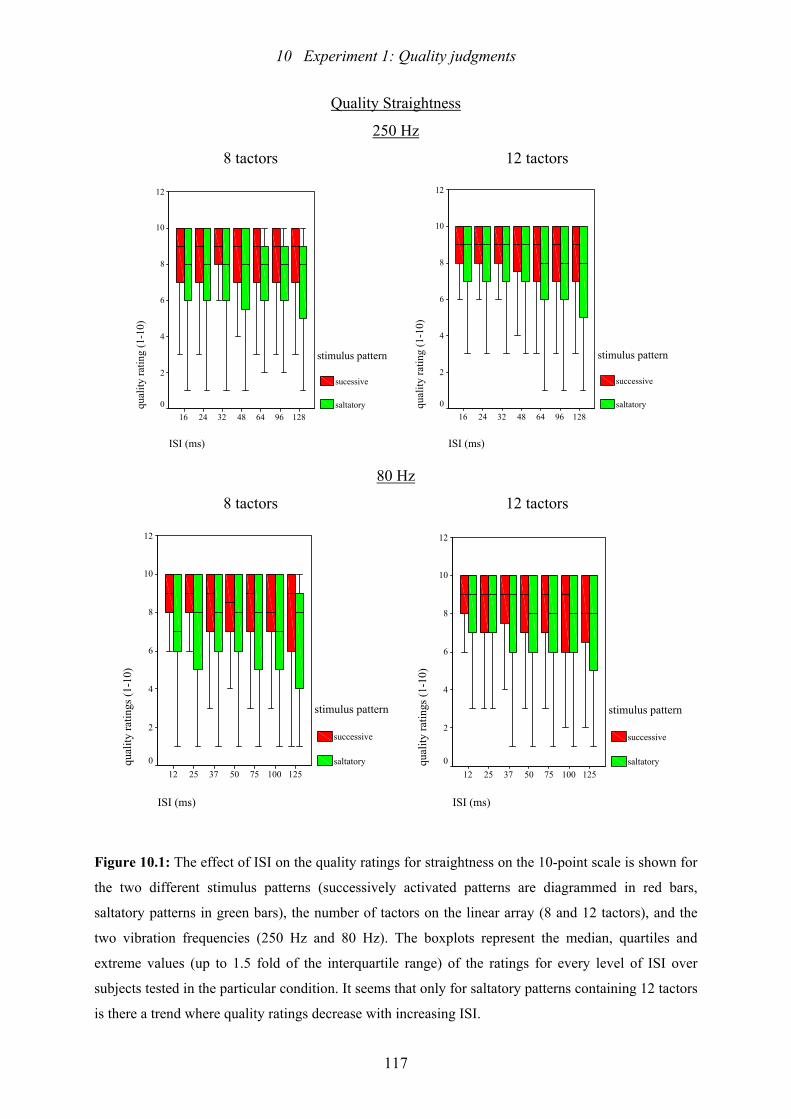
10 Experiment 1: Quality judgments
117
Quality Straightness
250 Hz
8 tactors 12 tactors
ISI (ms)
128966448322416
qual
ity ra
ting
(1-1
0)
12
10
8
6
4
2
0
stimulus pattern
sucessive
saltatory
ISI (ms)
128966448322416qu
ality
ratin
g (1
-10)
12
10
8
6
4
2
0
stimulus pattern
successive
saltatory
80 Hz
8 tactors 12 tactors
ISI (ms)
1251007550372512
qual
ity ra
tings
(1-1
0)
12
10
8
6
4
2
0
stimulus pattern
successive
saltatory
ISI (ms)
1251007550372512
qual
ity ra
tings
(1-1
0)
12
10
8
6
4
2
0
stimulus pattern
successive
saltatory
Figure 10.1: The effect of ISI on the quality ratings for straightness on the 10-point scale is shown for
the two different stimulus patterns (successively activated patterns are diagrammed in red bars,
saltatory patterns in green bars), the number of tactors on the linear array (8 and 12 tactors), and the
two vibration frequencies (250 Hz and 80 Hz). The boxplots represent the median, quartiles and
extreme values (up to 1.5 fold of the interquartile range) of the ratings for every level of ISI over
subjects tested in the particular condition. It seems that only for saltatory patterns containing 12 tactors
is there a trend where quality ratings decrease with increasing ISI.
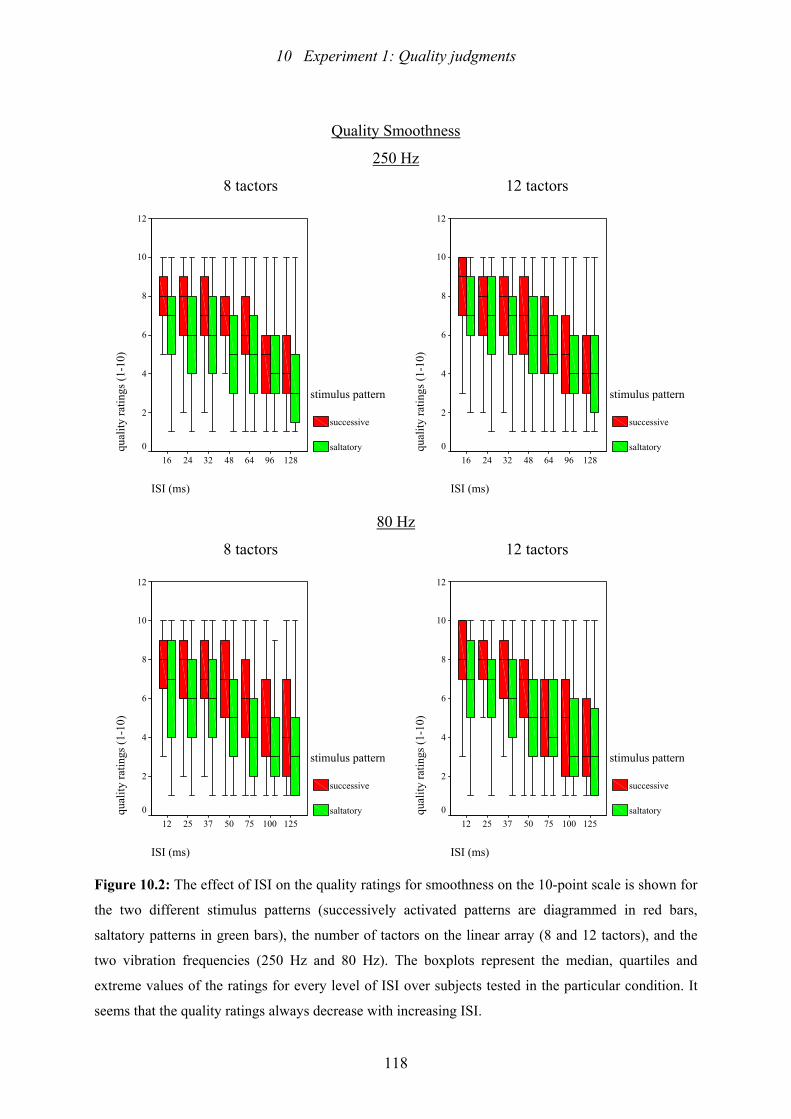
10 Experiment 1: Quality judgments
118
Quality Smoothness
250 Hz
8 tactors 12 tactors
ISI (ms)
128966448322416
qual
ity ra
tings
(1-1
0)
12
10
8
6
4
2
0
stimulus pattern
successive
saltatory
ISI (ms)
128966448322416
qual
ity ra
tings
(1-1
0)
12
10
8
6
4
2
0
stimulus pattern
successive
saltatory
80 Hz
8 tactors 12 tactors
ISI (ms)
1251007550372512
qual
ity ra
tings
(1-1
0)
12
10
8
6
4
2
0
stimulus pattern
successive
saltatory
ISI (ms)
1251007550372512
qual
ity ra
tings
(1-1
0)
12
10
8
6
4
2
0
stimulus pattern
successive
saltatory
Figure 10.2: The effect of ISI on the quality ratings for smoothness on the 10-point scale is shown for
the two different stimulus patterns (successively activated patterns are diagrammed in red bars,
saltatory patterns in green bars), the number of tactors on the linear array (8 and 12 tactors), and the
two vibration frequencies (250 Hz and 80 Hz). The boxplots represent the median, quartiles and
extreme values of the ratings for every level of ISI over subjects tested in the particular condition. It
seems that the quality ratings always decrease with increasing ISI.
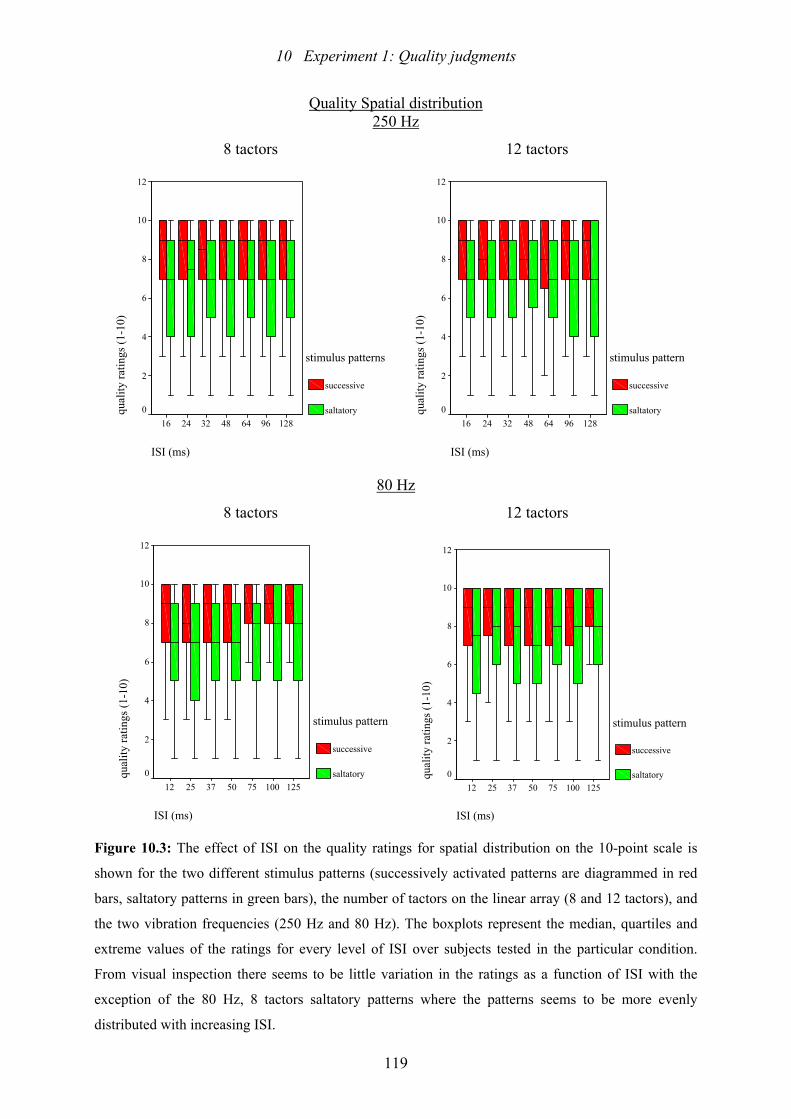
10 Experiment 1: Quality judgments
119
Quality Spatial distribution 250 Hz
8 tactors 12 tactors
ISI (ms)
128966448322416
qual
ity ra
tings
(1-1
0)
12
10
8
6
4
2
0
stimulus patterns
successive
saltatory
ISI (ms)
128966448322416qu
ality
ratin
gs (1
-10)
12
10
8
6
4
2
0
stimulus pattern
successive
saltatory
80 Hz
8 tactors 12 tactors
ISI (ms)
1251007550372512
qual
ity ra
tings
(1-1
0)
12
10
8
6
4
2
0
stimulus pattern
successive
saltatory
ISI (ms)
1251007550372512
qual
ity ra
tings
(1-1
0)
12
10
8
6
4
2
0
stimulus pattern
successive
saltatory
Figure 10.3: The effect of ISI on the quality ratings for spatial distribution on the 10-point scale is
shown for the two different stimulus patterns (successively activated patterns are diagrammed in red
bars, saltatory patterns in green bars), the number of tactors on the linear array (8 and 12 tactors), and
the two vibration frequencies (250 Hz and 80 Hz). The boxplots represent the median, quartiles and
extreme values of the ratings for every level of ISI over subjects tested in the particular condition.
From visual inspection there seems to be little variation in the ratings as a function of ISI with the
exception of the 80 Hz, 8 tactors saltatory patterns where the patterns seems to be more evenly
distributed with increasing ISI.
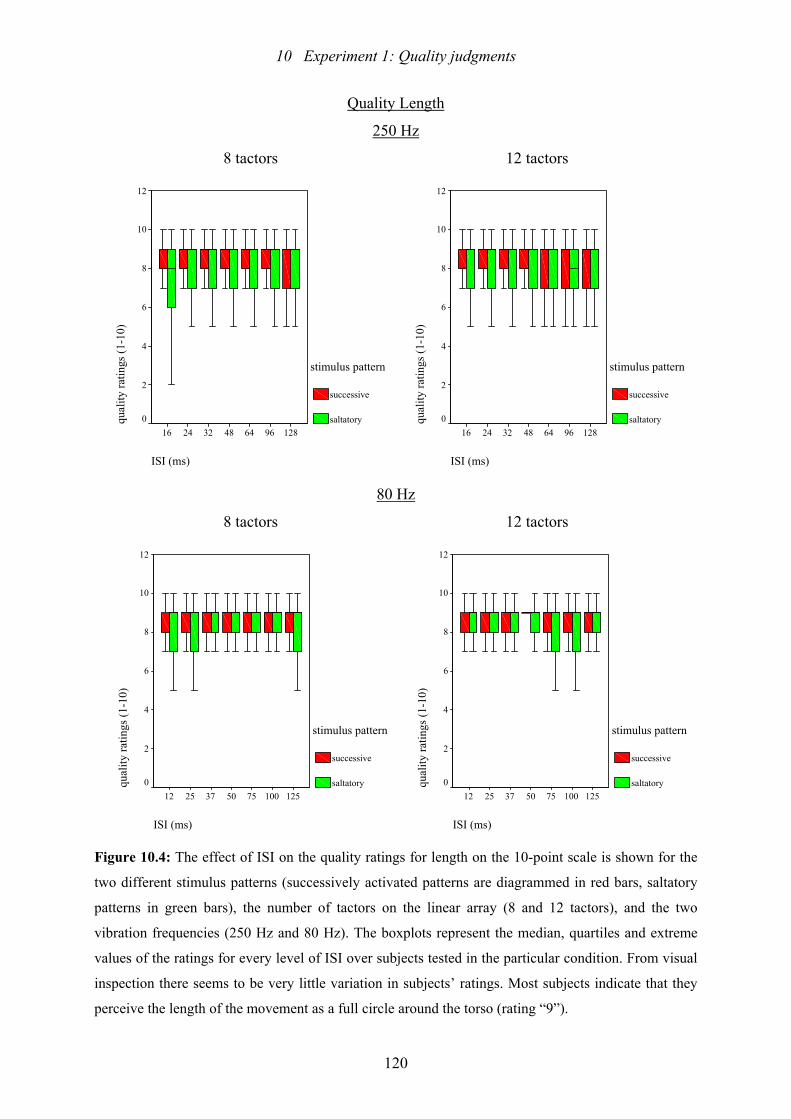
10 Experiment 1: Quality judgments
120
Quality Length
250 Hz
8 tactors 12 tactors
ISI (ms)
128966448322416
qual
ity ra
tings
(1-1
0)
12
10
8
6
4
2
0
stimulus pattern
successive
saltatory
ISI (ms)
128966448322416qu
ality
ratin
gs (1
-10)
12
10
8
6
4
2
0
stimulus pattern
successive
saltatory
80 Hz
8 tactors 12 tactors
ISI (ms)
1251007550372512
qual
ity ra
tings
(1-1
0)
12
10
8
6
4
2
0
stimulus pattern
successive
saltatory
ISI (ms)
1251007550372512
qual
ity ra
tings
(1-1
0)
12
10
8
6
4
2
0
stimulus pattern
successive
saltatory
Figure 10.4: The effect of ISI on the quality ratings for length on the 10-point scale is shown for the
two different stimulus patterns (successively activated patterns are diagrammed in red bars, saltatory
patterns in green bars), the number of tactors on the linear array (8 and 12 tactors), and the two
vibration frequencies (250 Hz and 80 Hz). The boxplots represent the median, quartiles and extreme
values of the ratings for every level of ISI over subjects tested in the particular condition. From visual
inspection there seems to be very little variation in subjects’ ratings. Most subjects indicate that they
perceive the length of the movement as a full circle around the torso (rating “9”).
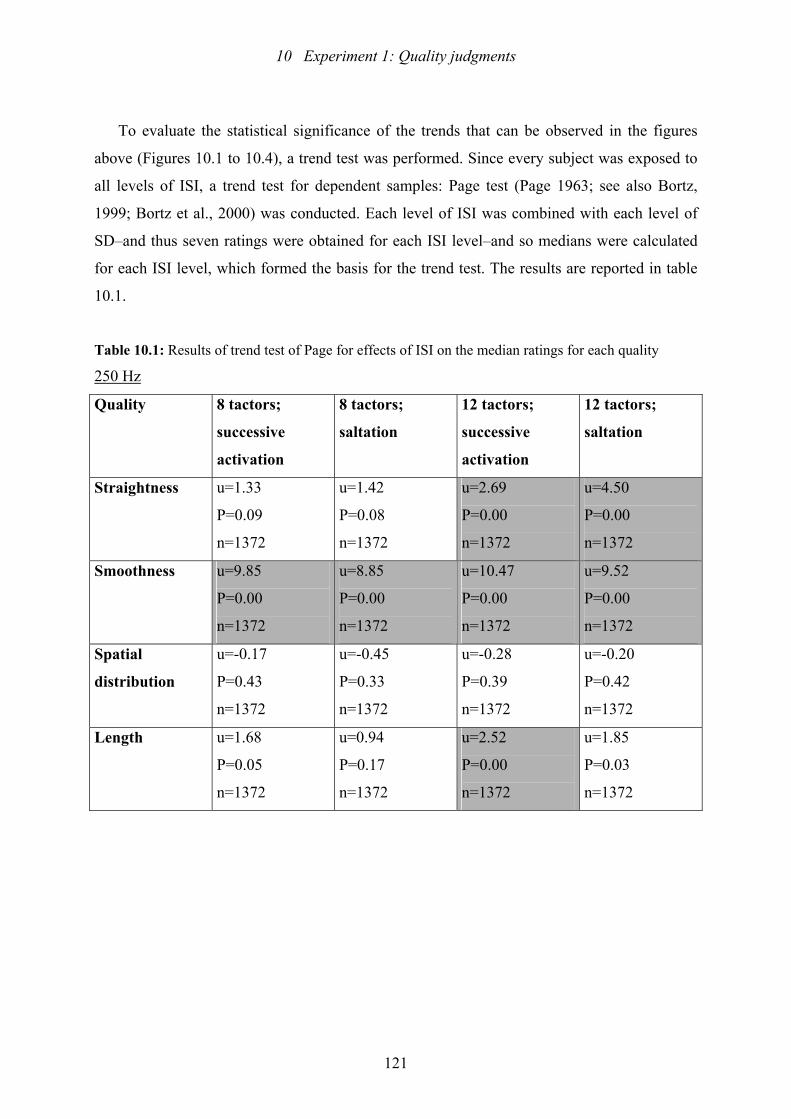
10 Experiment 1: Quality judgments
121
To evaluate the statistical significance of the trends that can be observed in the figures
above (Figures 10.1 to 10.4), a trend test was performed. Since every subject was exposed to
all levels of ISI, a trend test for dependent samples: Page test (Page 1963; see also Bortz,
1999; Bortz et al., 2000) was conducted. Each level of ISI was combined with each level of
SD–and thus seven ratings were obtained for each ISI level–and so medians were calculated
for each ISI level, which formed the basis for the trend test. The results are reported in table
10.1.
Table 10.1: Results of trend test of Page for effects of ISI on the median ratings for each quality
250 Hz
Quality 8 tactors;
successive
activation
8 tactors;
saltation
12 tactors;
successive
activation
12 tactors;
saltation
Straightness u=1.33
P=0.09
n=1372
u=1.42
P=0.08
n=1372
u=2.69
P=0.00
n=1372
u=4.50
P=0.00
n=1372
Smoothness u=9.85
P=0.00
n=1372
u=8.85
P=0.00
n=1372
u=10.47
P=0.00
n=1372
u=9.52
P=0.00
n=1372
Spatial
distribution
u=-0.17
P=0.43
n=1372
u=-0.45
P=0.33
n=1372
u=-0.28
P=0.39
n=1372
u=-0.20
P=0.42
n=1372
Length
u=1.68
P=0.05
n=1372
u=0.94
P=0.17
n=1372
u=2.52
P=0.00
n=1372
u=1.85
P=0.03
n=1372
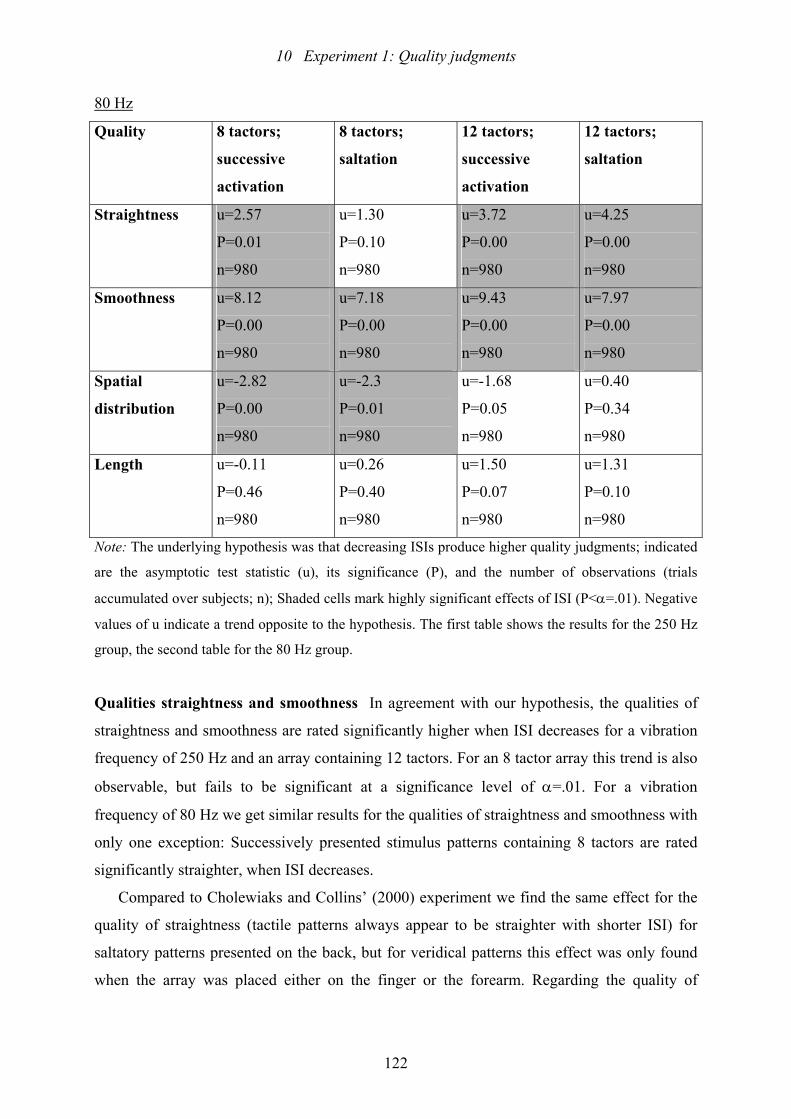
10 Experiment 1: Quality judgments
122
80 Hz
Quality 8 tactors;
successive
activation
8 tactors;
saltation
12 tactors;
successive
activation
12 tactors;
saltation
Straightness u=2.57
P=0.01
n=980
u=1.30
P=0.10
n=980
u=3.72
P=0.00
n=980
u=4.25
P=0.00
n=980
Smoothness u=8.12
P=0.00
n=980
u=7.18
P=0.00
n=980
u=9.43
P=0.00
n=980
u=7.97
P=0.00
n=980
Spatial
distribution
u=-2.82
P=0.00
n=980
u=-2.3
P=0.01
n=980
u=-1.68
P=0.05
n=980
u=0.40
P=0.34
n=980
Length
u=-0.11
P=0.46
n=980
u=0.26
P=0.40
n=980
u=1.50
P=0.07
n=980
u=1.31
P=0.10
n=980
Note: The underlying hypothesis was that decreasing ISIs produce higher quality judgments; indicated
are the asymptotic test statistic (u), its significance (P), and the number of observations (trials
accumulated over subjects; n); Shaded cells mark highly significant effects of ISI (P<α=.01). Negative
values of u indicate a trend opposite to the hypothesis. The first table shows the results for the 250 Hz
group, the second table for the 80 Hz group.
Qualities straightness and smoothness In agreement with our hypothesis, the qualities of
straightness and smoothness are rated significantly higher when ISI decreases for a vibration
frequency of 250 Hz and an array containing 12 tactors. For an 8 tactor array this trend is also
observable, but fails to be significant at a significance level of α=.01. For a vibration
frequency of 80 Hz we get similar results for the qualities of straightness and smoothness with
only one exception: Successively presented stimulus patterns containing 8 tactors are rated
significantly straighter, when ISI decreases.
Compared to Cholewiaks and Collins’ (2000) experiment we find the same effect for the
quality of straightness (tactile patterns always appear to be straighter with shorter ISI) for
saltatory patterns presented on the back, but for veridical patterns this effect was only found
when the array was placed either on the finger or the forearm. Regarding the quality of
10 Experiment 1: Quality judgments
123
smoothness, the same main effects of ISI−tactile patterns appear to be smoother with shorter
ISIs−were observed in Cholewiak and Collins’ (2000) study.
Quality spatial distribution Contrary to our hypothesis, there is no effect of ISI on the
quality spatial distribution for 250 Hz patterns, which is surprising at least for saltatory
patterns: The relationship between ISI and the amount of mislocalization should be linear in
saltatory patterns. This means that saltatory patterns should feel more or less evenly
distributed–i.e. illusory stimuli are mislocalized to a variable extent between activated
loci−depending on ISI. However, in our experiment, ISI doesn’t seem to affect the perceived
distribution of stimuli. If we examine the comments that subjects made after each session, it
becomes clear that most of them had difficulties judging spatial distribution since they didn’t
notice a difference among the patterns, they all felt evenly distributed, especially when the
speed of movement was high. So they developed different strategies, some based their
judgments on the speed of movement, some on intensity, some looked for gaps, some judged
the distribution of stimuli in relation to other trials. Correspondingly, some subjects rated
spatial distribution higher with increasing ISI, some with decreasing ISI and for some
subjects, judgments were uniformly distributed over all levels of ISI.
Surprisingly, ISI exerts an effect on the perceived spatial distribution of the 80 Hz
stimulus patterns that is contrary to the hypothesis: Both successively activated or saltatory
stimulus patterns appear to be more evenly distributed when ISI increases. This trend is
significant only for stimulus patterns containing less tactors (that is 8 tactors), but is still
observable for stimulus patterns containing 12 tactors. Some subjects reported that it was
easier to judge the stimulus patterns containing 8 tactors, as soon as they realized that some
sites were activated twice (saltatory patterns). Nevertheless, the effect of ISI on their
judgments was the same for saltatory and successively activated patterns.
Cholewiak and Collins (2000) found a significant main effect of ISI for saltatory patterns
in that a shorter ISI produced a more equally-distributed tactile pattern. This effect was true of
patterns presented on the finger and forearm, but not on the back. When stimulus patterns
were presented successively, the same effect could be found for patterns presented only to the
finger. For tactile patterns presented on the back no significant main effects could be found
either for SD nor for ISI–at least for the quality of spatial distribution.

10 Experiment 1: Quality judgments
124
Quality length There is only one significant effect of ISI on perceived length of the stimulus
patterns: Successively activated patterns with a vibration frequency of 250 Hz that contain 12
tactors appear to be longer at shorter ISIs. In Cholewiak and Collins’ (2000) study there was
only a significant main effect of ISI when successively activated and saltatory patterns were
presented on the forearm, but their effect was contrary to ours: In their study patterns
appeared longer at longer ISI.
With only two exceptions (250 Hz, length, 12 tactors and 80 Hz straightness, 8 tactors), is
the effect of ISI on subjects’ judgments equal for both stimulus patterns (successively and
saltatory activated).
Effect of SD on quality judgments
Again, the effect of SD on the integration of spatio-temporal stimulus patterns will be
examined separately for the two different stimulus patterns (saltatory and successively
activated), the different vibration frequencies (80 and 250 Hz), and the different number of
tactors on the linear array (8 and 12 tactors). Figures 10.5 to 10.8 show the effect of SD on the
quality ratings.
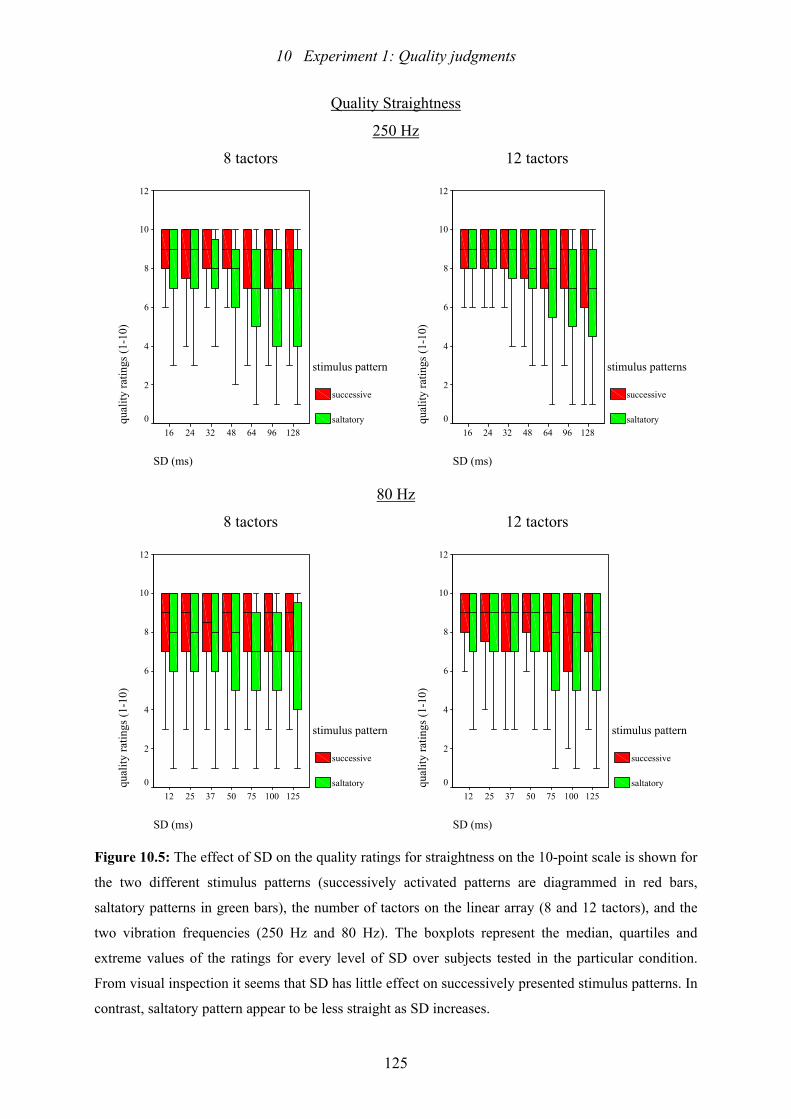
10 Experiment 1: Quality judgments
125
Quality Straightness
250 Hz
8 tactors 12 tactors
SD (ms)
128966448322416
qual
ity ra
tings
(1-1
0)
12
10
8
6
4
2
0
stimulus pattern
successive
saltatory
SD (ms)
128966448322416qu
ality
ratin
gs (1
-10)
12
10
8
6
4
2
0
stimulus patterns
successive
saltatory
80 Hz
8 tactors 12 tactors
SD (ms)
1251007550372512
qual
ity ra
tings
(1-1
0)
12
10
8
6
4
2
0
stimulus pattern
successive
saltatory
SD (ms)
1251007550372512
qual
ity ra
tings
(1-1
0)
12
10
8
6
4
2
0
stimulus pattern
successive
saltatory
Figure 10.5: The effect of SD on the quality ratings for straightness on the 10-point scale is shown for
the two different stimulus patterns (successively activated patterns are diagrammed in red bars,
saltatory patterns in green bars), the number of tactors on the linear array (8 and 12 tactors), and the
two vibration frequencies (250 Hz and 80 Hz). The boxplots represent the median, quartiles and
extreme values of the ratings for every level of SD over subjects tested in the particular condition.
From visual inspection it seems that SD has little effect on successively presented stimulus patterns. In
contrast, saltatory pattern appear to be less straight as SD increases.
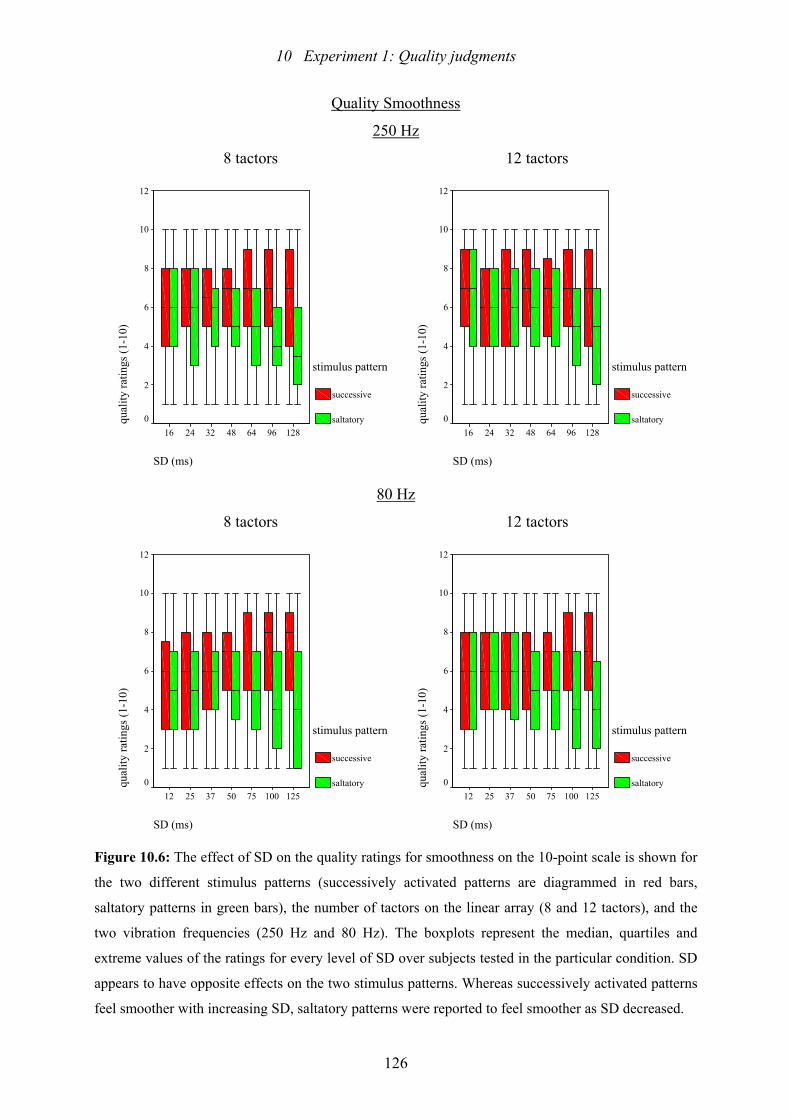
10 Experiment 1: Quality judgments
126
Quality Smoothness
250 Hz
8 tactors 12 tactors
SD (ms)
128966448322416
qual
ity ra
tings
(1-1
0)
12
10
8
6
4
2
0
stimulus pattern
successive
saltatory
SD (ms)
128966448322416qu
ality
ratin
gs (1
-10)
12
10
8
6
4
2
0
stimulus pattern
successive
saltatory
80 Hz
8 tactors 12 tactors
SD (ms)
1251007550372512
qual
ity ra
tings
(1-1
0)
12
10
8
6
4
2
0
stimulus pattern
successive
saltatory
SD (ms)
1251007550372512
qual
ity ra
tings
(1-1
0)
12
10
8
6
4
2
0
stimulus pattern
successive
saltatory
Figure 10.6: The effect of SD on the quality ratings for smoothness on the 10-point scale is shown for
the two different stimulus patterns (successively activated patterns are diagrammed in red bars,
saltatory patterns in green bars), the number of tactors on the linear array (8 and 12 tactors), and the
two vibration frequencies (250 Hz and 80 Hz). The boxplots represent the median, quartiles and
extreme values of the ratings for every level of SD over subjects tested in the particular condition. SD
appears to have opposite effects on the two stimulus patterns. Whereas successively activated patterns
feel smoother with increasing SD, saltatory patterns were reported to feel smoother as SD decreased.
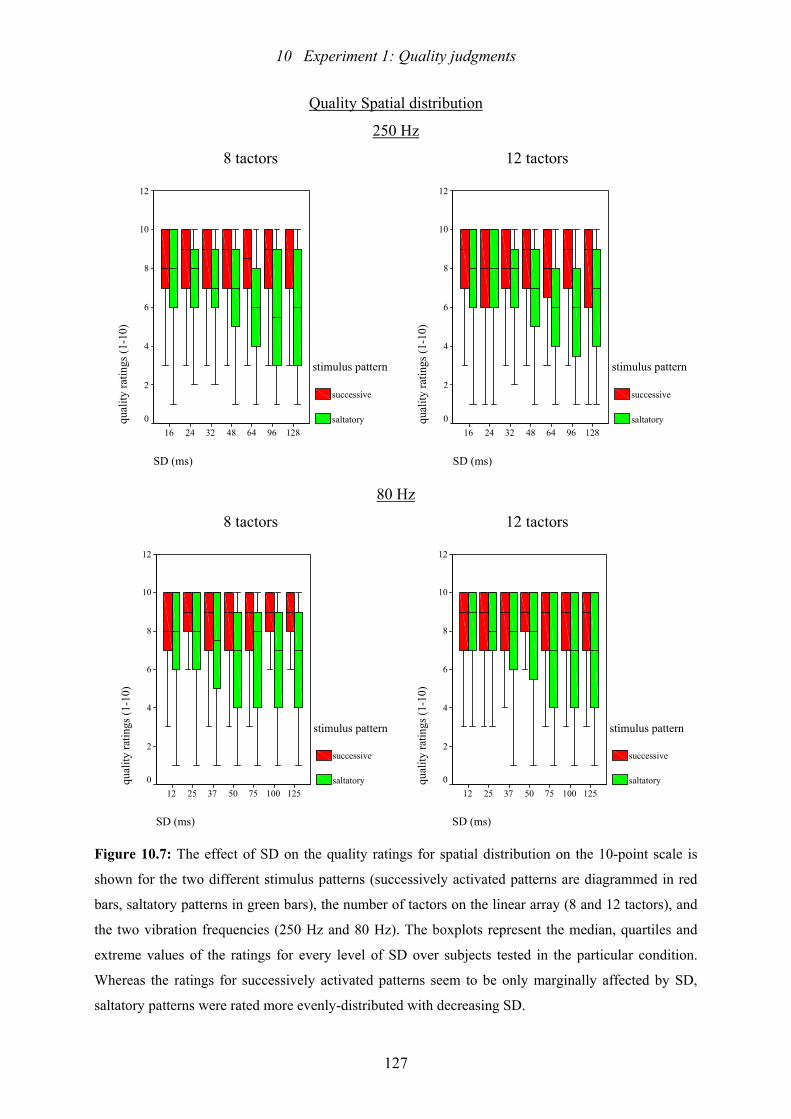
10 Experiment 1: Quality judgments
127
Quality Spatial distribution
250 Hz
8 tactors 12 tactors
SD (ms)
128966448322416
qual
ity ra
tings
(1-1
0)
12
10
8
6
4
2
0
stimulus pattern
successive
saltatory
SD (ms)
128966448322416qu
ality
ratin
gs (1
-10)
12
10
8
6
4
2
0
stimulus pattern
successive
saltatory
80 Hz
8 tactors 12 tactors
SD (ms)
1251007550372512
qual
ity ra
tings
(1-1
0)
12
10
8
6
4
2
0
stimulus pattern
successive
saltatory
SD (ms)
1251007550372512
qual
ity ra
tings
(1-1
0)
12
10
8
6
4
2
0
stimulus pattern
successive
saltatory
Figure 10.7: The effect of SD on the quality ratings for spatial distribution on the 10-point scale is
shown for the two different stimulus patterns (successively activated patterns are diagrammed in red
bars, saltatory patterns in green bars), the number of tactors on the linear array (8 and 12 tactors), and
the two vibration frequencies (250 Hz and 80 Hz). The boxplots represent the median, quartiles and
extreme values of the ratings for every level of SD over subjects tested in the particular condition.
Whereas the ratings for successively activated patterns seem to be only marginally affected by SD,
saltatory patterns were rated more evenly-distributed with decreasing SD.
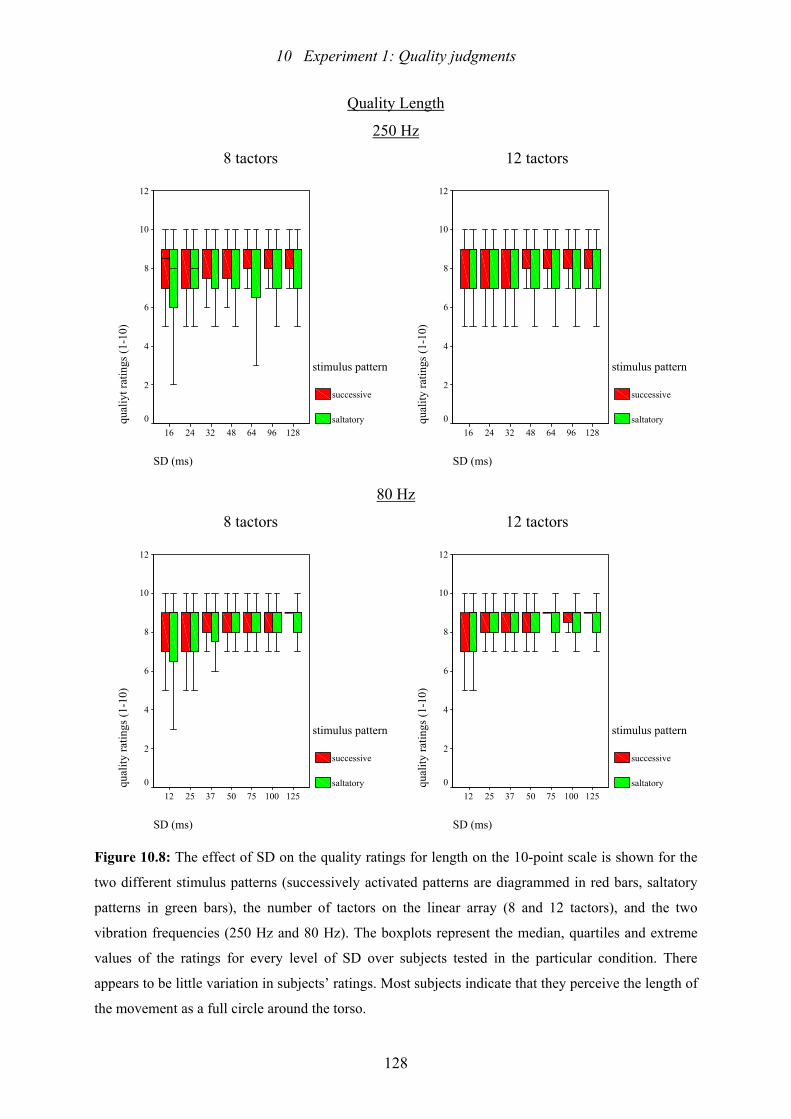
10 Experiment 1: Quality judgments
128
Quality Length
250 Hz
8 tactors 12 tactors
SD (ms)
128966448322416
qual
iyt r
atin
gs (1
-10)
12
10
8
6
4
2
0
stimulus pattern
successive
saltatory
SD (ms)
128966448322416qu
ality
ratin
gs (1
-10)
12
10
8
6
4
2
0
stimulus pattern
successive
saltatory
80 Hz
8 tactors 12 tactors
SD (ms)
1251007550372512
qual
ity ra
tings
(1-1
0)
12
10
8
6
4
2
0
stimulus pattern
successive
saltatory
SD (ms)
1251007550372512
qual
ity ra
tings
(1-1
0)
12
10
8
6
4
2
0
stimulus pattern
successive
saltatory
Figure 10.8: The effect of SD on the quality ratings for length on the 10-point scale is shown for the
two different stimulus patterns (successively activated patterns are diagrammed in red bars, saltatory
patterns in green bars), the number of tactors on the linear array (8 and 12 tactors), and the two
vibration frequencies (250 Hz and 80 Hz). The boxplots represent the median, quartiles and extreme
values of the ratings for every level of SD over subjects tested in the particular condition. There
appears to be little variation in subjects’ ratings. Most subjects indicate that they perceive the length of
the movement as a full circle around the torso.
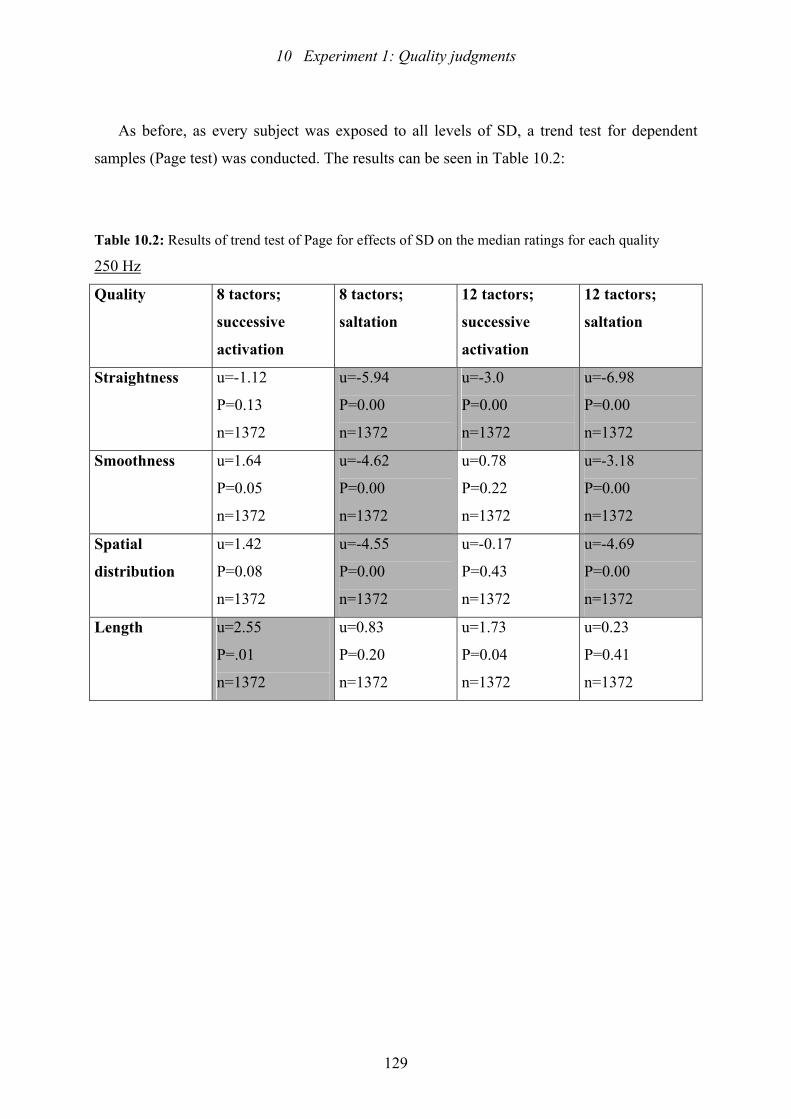
10 Experiment 1: Quality judgments
129
As before, as every subject was exposed to all levels of SD, a trend test for dependent
samples (Page test) was conducted. The results can be seen in Table 10.2:
Table 10.2: Results of trend test of Page for effects of SD on the median ratings for each quality
250 Hz
Quality 8 tactors;
successive
activation
8 tactors;
saltation
12 tactors;
successive
activation
12 tactors;
saltation
Straightness u=-1.12
P=0.13
n=1372
u=-5.94
P=0.00
n=1372
u=-3.0
P=0.00
n=1372
u=-6.98
P=0.00
n=1372
Smoothness u=1.64
P=0.05
n=1372
u=-4.62
P=0.00
n=1372
u=0.78
P=0.22
n=1372
u=-3.18
P=0.00
n=1372
Spatial
distribution
u=1.42
P=0.08
n=1372
u=-4.55
P=0.00
n=1372
u=-0.17
P=0.43
n=1372
u=-4.69
P=0.00
n=1372
Length
u=2.55
P=.01
n=1372
u=0.83
P=0.20
n=1372
u=1.73
P=0.04
n=1372
u=0.23
P=0.41
n=1372
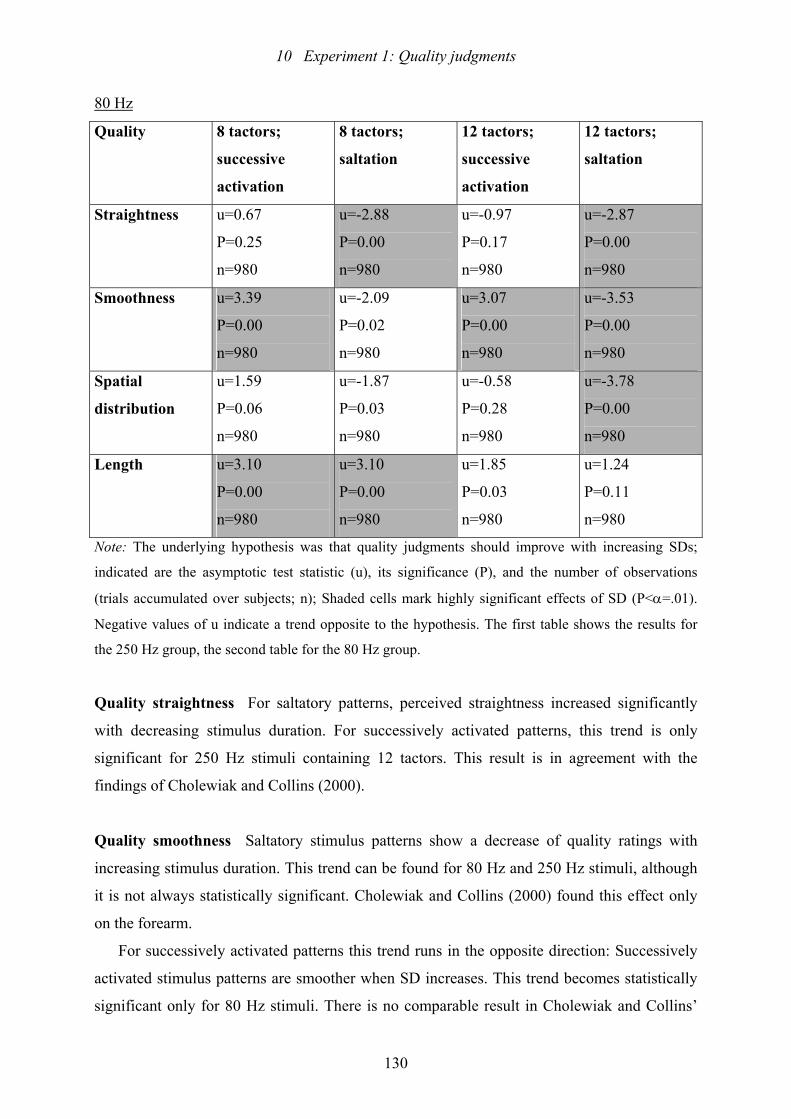
10 Experiment 1: Quality judgments
130
80 Hz
Quality 8 tactors;
successive
activation
8 tactors;
saltation
12 tactors;
successive
activation
12 tactors;
saltation
Straightness u=0.67
P=0.25
n=980
u=-2.88
P=0.00
n=980
u=-0.97
P=0.17
n=980
u=-2.87
P=0.00
n=980
Smoothness u=3.39
P=0.00
n=980
u=-2.09
P=0.02
n=980
u=3.07
P=0.00
n=980
u=-3.53
P=0.00
n=980
Spatial
distribution
u=1.59
P=0.06
n=980
u=-1.87
P=0.03
n=980
u=-0.58
P=0.28
n=980
u=-3.78
P=0.00
n=980
Length
u=3.10
P=0.00
n=980
u=3.10
P=0.00
n=980
u=1.85
P=0.03
n=980
u=1.24
P=0.11
n=980
Note: The underlying hypothesis was that quality judgments should improve with increasing SDs;
indicated are the asymptotic test statistic (u), its significance (P), and the number of observations
(trials accumulated over subjects; n); Shaded cells mark highly significant effects of SD (P<α=.01).
Negative values of u indicate a trend opposite to the hypothesis. The first table shows the results for
the 250 Hz group, the second table for the 80 Hz group.
Quality straightness For saltatory patterns, perceived straightness increased significantly
with decreasing stimulus duration. For successively activated patterns, this trend is only
significant for 250 Hz stimuli containing 12 tactors. This result is in agreement with the
findings of Cholewiak and Collins (2000).
Quality smoothness Saltatory stimulus patterns show a decrease of quality ratings with
increasing stimulus duration. This trend can be found for 80 Hz and 250 Hz stimuli, although
it is not always statistically significant. Cholewiak and Collins (2000) found this effect only
on the forearm.
For successively activated patterns this trend runs in the opposite direction: Successively
activated stimulus patterns are smoother when SD increases. This trend becomes statistically
significant only for 80 Hz stimuli. There is no comparable result in Cholewiak and Collins’

10 Experiment 1: Quality judgments
131
(2000) study which is not unexpected, since they use a vibration frequency of 230 Hz; our
results for the 250 Hz stimuli weren’t significant either.
Quality spatial distribution The shorter the SD, the more equally distributed are saltatory
patterns perceived. This is true for both vibration frequencies with the only exception of 80
Hz stimuli containing 8 tactors. For successively activated patterns there is no significant
trend.
In Cholewiak and Collins’ (2000) study, a significant effect of SD as described for
saltatory patterns was only found when a tactile array was placed on the finger and forearm,
not on the back. On the forearm the same effect could also be found for successively activated
patterns.
Quality length Successively activated stimulus patterns appear to be longer with increasing
stimulus duration when they contain only 8 tactors–with the exception of 250 Hz saltatory
patterns. When the inter-tactor distance becomes smaller (12 tactors), no significant trend can
be observed. In this case there is much less variation in subjects’ answers, they generally
perceive the length of movement correctly−as a complete circle around the torso.
Cholewiak and Collins (2000) found this effect for all test sites and also for both stimulus
patterns.
To summarize, SD has an antagonistic effect on the ratings of the qualities of smoothness
and spatial distribution for the two stimulus patterns (successively activated and saltatory).
Interaction between SD and ISI
We assume that the following interaction exists between SD and ISI: An increase in SD
supports the integration of stimuli, such that when SD increases, stimuli are integrated even
for longer ISIs, and judgments of the different qualities improve.
In Annex G median ratings for the different levels of SD for each ISI are shown for all
qualities and for both vibration frequencies. Visual inspection of those figures indicate that
our hypothesis may apply only for the quality spatial distribution. Here there seems to exist
the following interaction for saltatory patterns: For shorter SDs, judgments appear to be
10 Experiment 1: Quality judgments
132
largely uninfluenced by ISI, whereas for longer SDs, stimuli feel more evenly distributed for
longer ISIs. This effect can be observed for both vibration frequencies, but in the 80 Hz group
the effect is more distinct for 12 tactors patterns.
As a statistical indicator for the significance of this interaction the correlation coefficients
(Kendall’s Tau) between ISI and the quality ratings were calculated for each subject, broken
down by the lowest and highest value of SD. Thus we get two sets of correlation coefficients,
one for the lowest level of SD, and one for the highest level of SD. According to our
hypothesis, the second set of correlation coefficients (highest level of ISI) should contain
higher values.
In the 80 Hz group we get the following results: When the array contained 8 tactors, half
of the subjects had a higher correlation coefficient when SD was largest, for the other half, the
opposite was true (subjects with no variation in their judgments, and for whom the correlation
coefficient thus could not be calculated were excluded). When the array contained 12 tactors,
only five subjects had larger correlation coefficients when SD was largest, for nine subjects
the correlation coefficients were lower and two subjects showed no difference. A sign-test
was performed to test the significance of these results, but the results were not statistically
significant for either 8 or 12 tactors (8 tactor array: N=18, x=9, P=0.59; 12 tactor array: N=16,
x=6, P=0.23; N=sample size; x=number of subjects with higher correlation coefficient for
large SD; P=probability for π<0.5). For the 250 Hz group, results were different: When the
array contained either 8 or 12 tactors, the majority of the subjects (17 out of 25 subjects for
the 8 tactor array and 20 out of 26 subjects for the 12 tactor array) showed larger correlation
coefficients when SD was longer. A sign-test showed that these results were statistically
significant for 12 tactor arrays, but not for 8 tactor arrays (12 tactor array: N=26, x=6, P=0.00;
8 tactor array: N=25, x=8, P=0.05; N=sample size; x=number of subjects with lower
correlation coefficient for large SD; P=probability for π<0.5).
Cholewiak and Collins (2000) reported no significant interaction between SD and ISI, but
they used parametric procedures for the analysis of their experiments which might account for
some of the differences between their and our results.
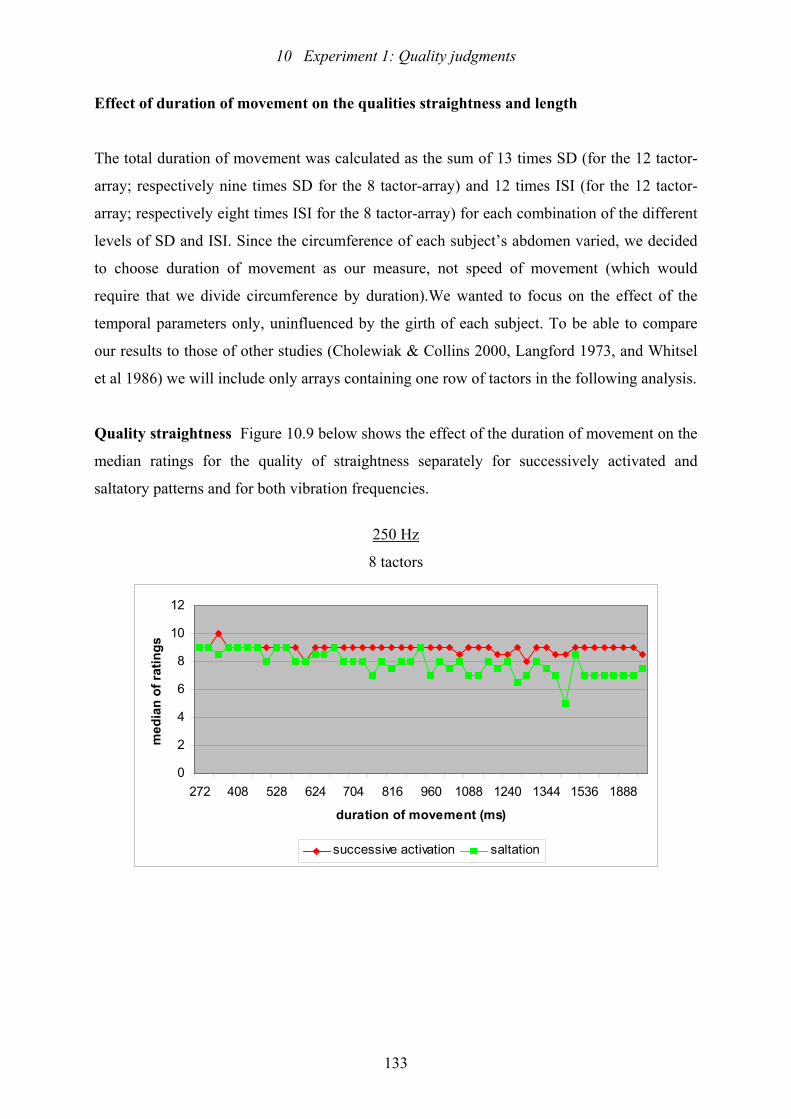
10 Experiment 1: Quality judgments
133
Effect of duration of movement on the qualities straightness and length
The total duration of movement was calculated as the sum of 13 times SD (for the 12 tactor-
array; respectively nine times SD for the 8 tactor-array) and 12 times ISI (for the 12 tactor-
array; respectively eight times ISI for the 8 tactor-array) for each combination of the different
levels of SD and ISI. Since the circumference of each subject’s abdomen varied, we decided
to choose duration of movement as our measure, not speed of movement (which would
require that we divide circumference by duration).We wanted to focus on the effect of the
temporal parameters only, uninfluenced by the girth of each subject. To be able to compare
our results to those of other studies (Cholewiak & Collins 2000, Langford 1973, and Whitsel
et al 1986) we will include only arrays containing one row of tactors in the following analysis.
Quality straightness Figure 10.9 below shows the effect of the duration of movement on the
median ratings for the quality of straightness separately for successively activated and
saltatory patterns and for both vibration frequencies.
250 Hz
8 tactors
0
2
4
6
8
10
12
272 408 528 624 704 816 960 1088 1240 1344 1536 1888
duration of movement (ms)
med
ian
of ra
tings
successive activation saltation
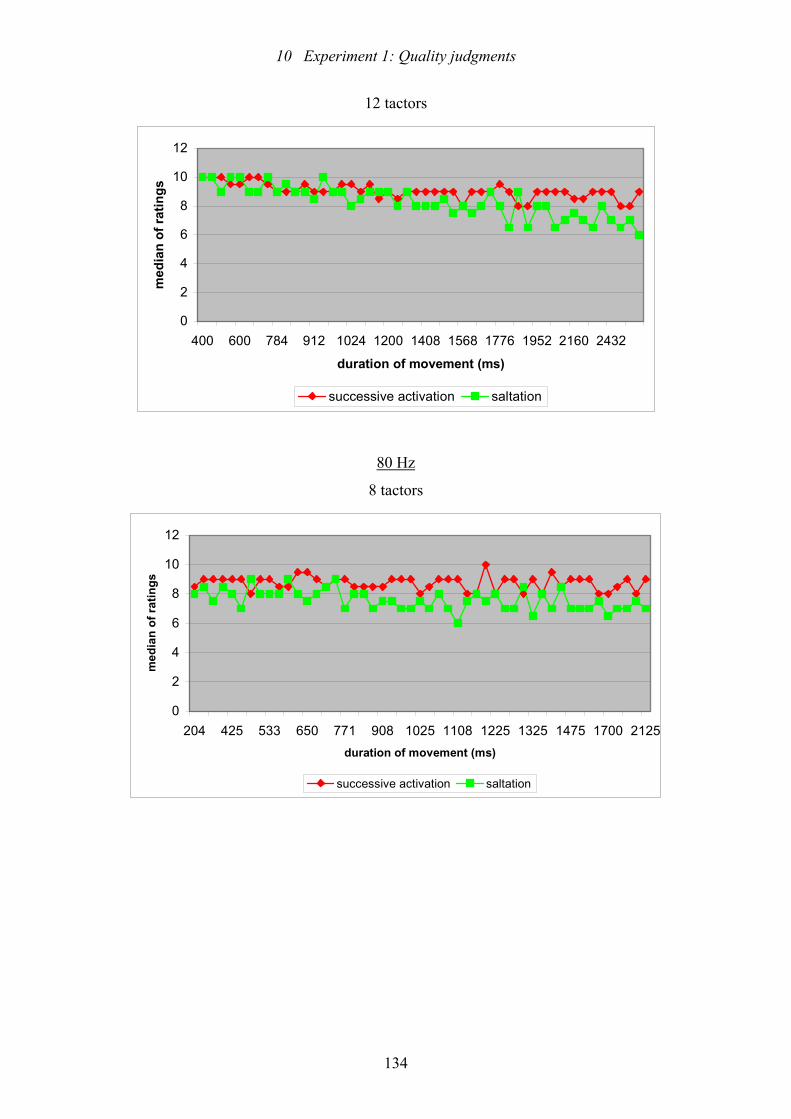
10 Experiment 1: Quality judgments
134
12 tactors
0
2
4
6
8
10
12
400 600 784 912 1024 1200 1408 1568 1776 1952 2160 2432
duration of movement (ms)
med
ian
of ra
tings
successive activation saltation
80 Hz
8 tactors
0
2
4
6
8
10
12
204 425 533 650 771 908 1025 1108 1225 1325 1475 1700 2125duration of movement (ms)
med
ian
of ra
tings
successive activation saltation
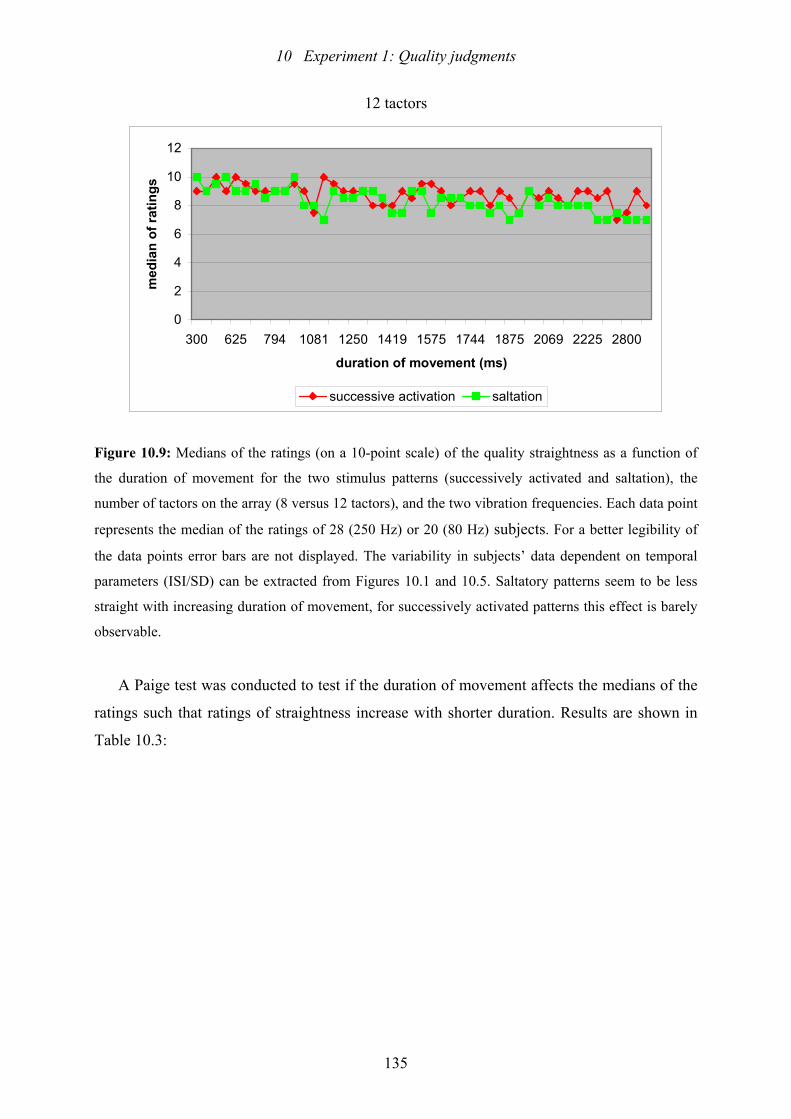
10 Experiment 1: Quality judgments
135
12 tactors
0
2
4
6
8
10
12
300 625 794 1081 1250 1419 1575 1744 1875 2069 2225 2800
duration of movement (ms)
med
ian
of ra
tings
successive activation saltation
Figure 10.9: Medians of the ratings (on a 10-point scale) of the quality straightness as a function of
the duration of movement for the two stimulus patterns (successively activated and saltation), the
number of tactors on the array (8 versus 12 tactors), and the two vibration frequencies. Each data point
represents the median of the ratings of 28 (250 Hz) or 20 (80 Hz) subjects. For a better legibility of
the data points error bars are not displayed. The variability in subjects’ data dependent on temporal
parameters (ISI/SD) can be extracted from Figures 10.1 and 10.5. Saltatory patterns seem to be less
straight with increasing duration of movement, for successively activated patterns this effect is barely
observable.
A Paige test was conducted to test if the duration of movement affects the medians of the
ratings such that ratings of straightness increase with shorter duration. Results are shown in
Table 10.3:
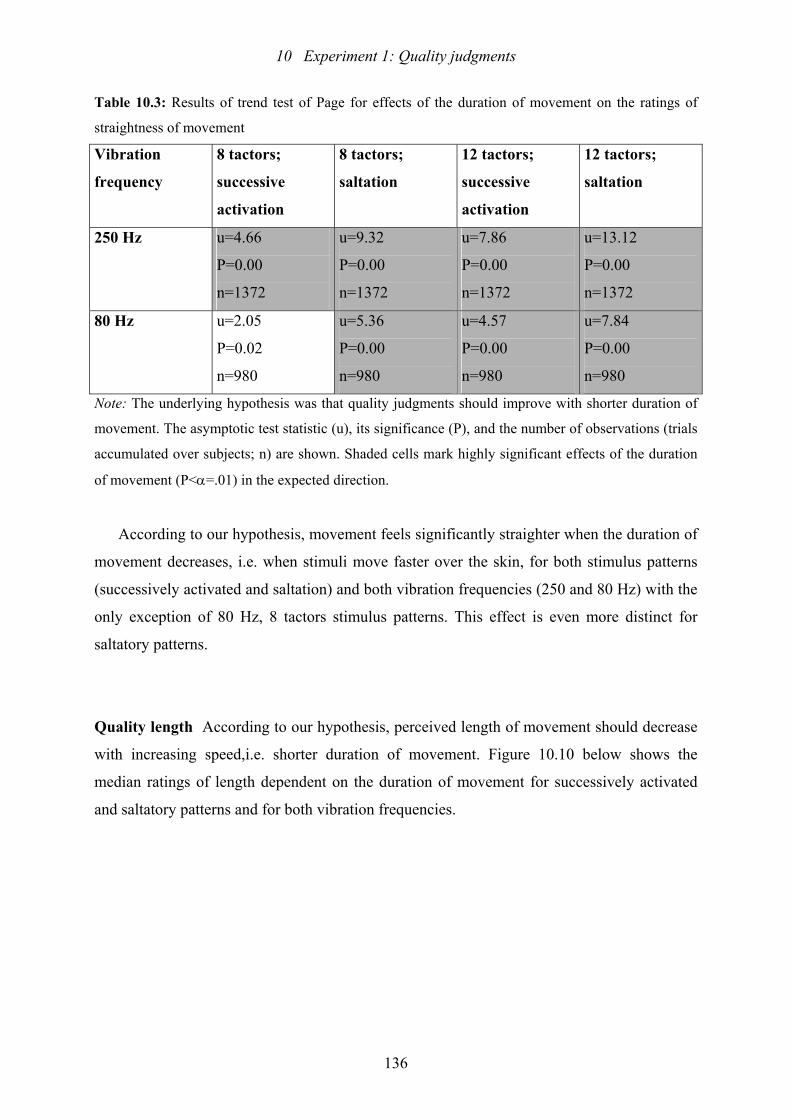
10 Experiment 1: Quality judgments
136
Table 10.3: Results of trend test of Page for effects of the duration of movement on the ratings of
straightness of movement
Vibration
frequency
8 tactors;
successive
activation
8 tactors;
saltation
12 tactors;
successive
activation
12 tactors;
saltation
250 Hz u=4.66
P=0.00
n=1372
u=9.32
P=0.00
n=1372
u=7.86
P=0.00
n=1372
u=13.12
P=0.00
n=1372
80 Hz u=2.05
P=0.02
n=980
u=5.36
P=0.00
n=980
u=4.57
P=0.00
n=980
u=7.84
P=0.00
n=980
Note: The underlying hypothesis was that quality judgments should improve with shorter duration of
movement. The asymptotic test statistic (u), its significance (P), and the number of observations (trials
accumulated over subjects; n) are shown. Shaded cells mark highly significant effects of the duration
of movement (P<α=.01) in the expected direction.
According to our hypothesis, movement feels significantly straighter when the duration of
movement decreases, i.e. when stimuli move faster over the skin, for both stimulus patterns
(successively activated and saltation) and both vibration frequencies (250 and 80 Hz) with the
only exception of 80 Hz, 8 tactors stimulus patterns. This effect is even more distinct for
saltatory patterns.
Quality length According to our hypothesis, perceived length of movement should decrease
with increasing speed,i.e. shorter duration of movement. Figure 10.10 below shows the
median ratings of length dependent on the duration of movement for successively activated
and saltatory patterns and for both vibration frequencies.
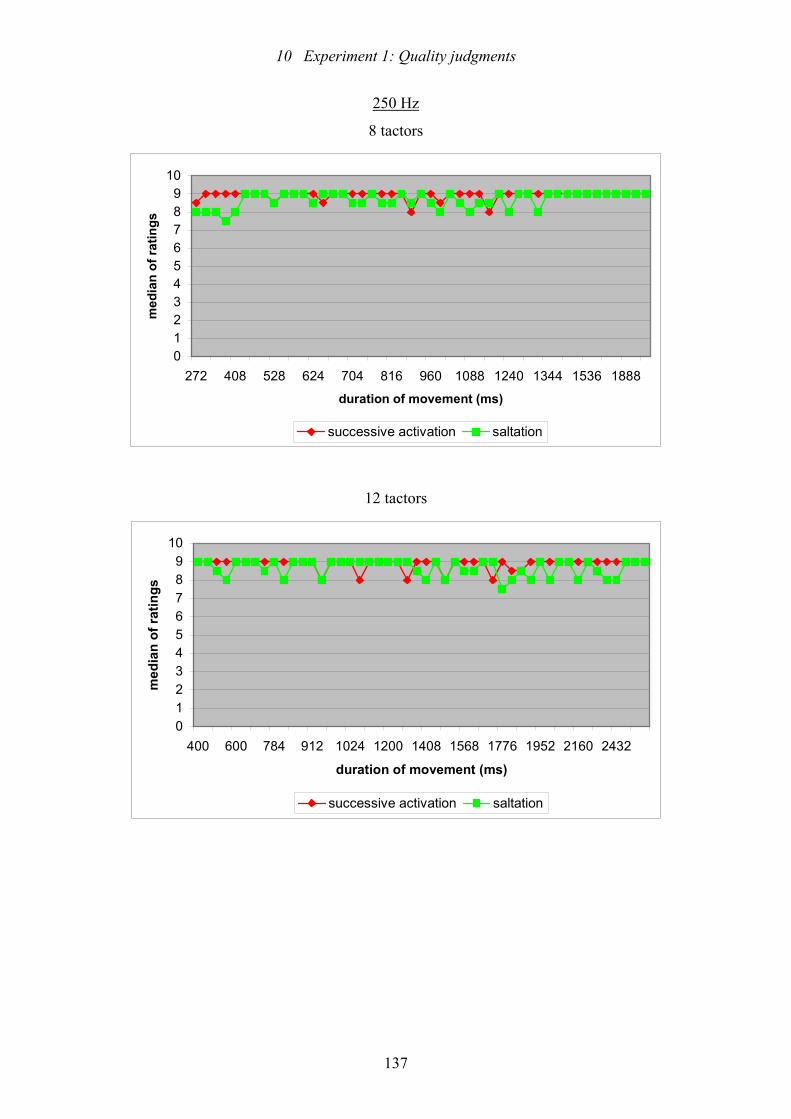
10 Experiment 1: Quality judgments
137
250 Hz
8 tactors
0123456789
10
272 408 528 624 704 816 960 1088 1240 1344 1536 1888
duration of movement (ms)
med
ian
of ra
tings
successive activation saltation
12 tactors
0123456789
10
400 600 784 912 1024 1200 1408 1568 1776 1952 2160 2432
duration of movement (ms)
med
ian
of ra
tings
successive activation saltation
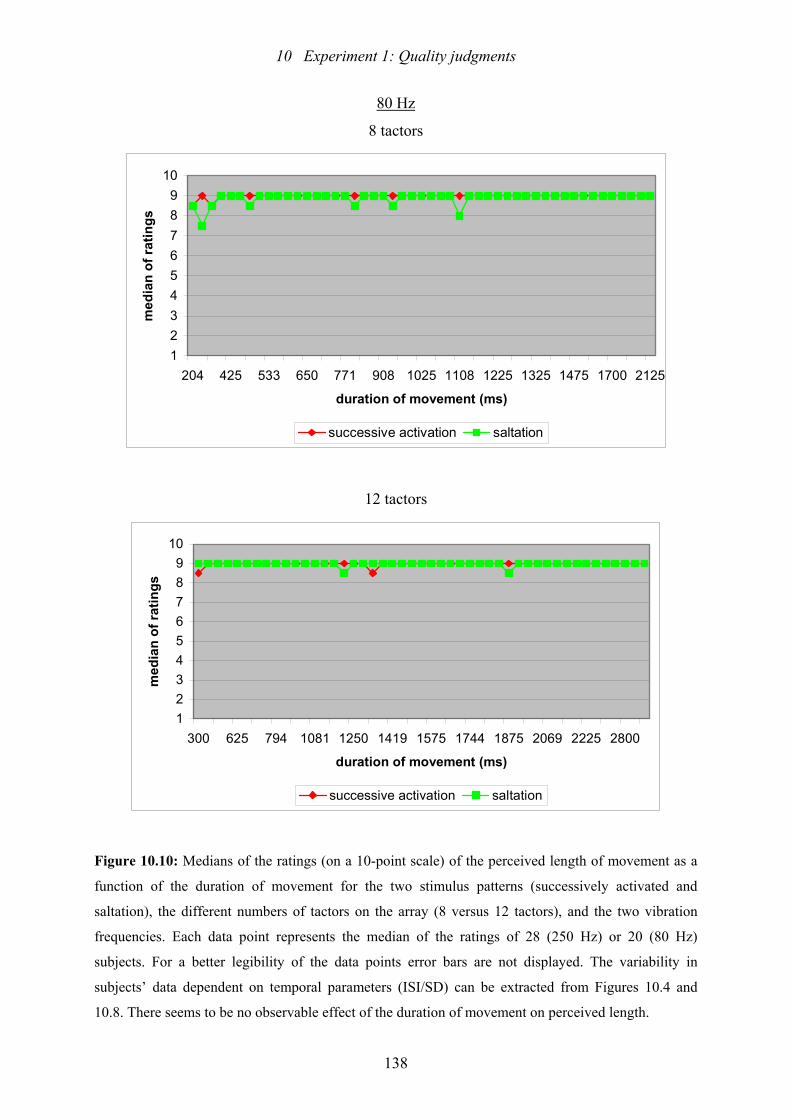
10 Experiment 1: Quality judgments
138
80 Hz
8 tactors
123456789
10
204 425 533 650 771 908 1025 1108 1225 1325 1475 1700 2125
duration of movement (ms)
med
ian
of ra
tings
successive activation saltation
12 tactors
123456789
10
300 625 794 1081 1250 1419 1575 1744 1875 2069 2225 2800
duration of movement (ms)
med
ian
of ra
tings
successive activation saltation
Figure 10.10: Medians of the ratings (on a 10-point scale) of the perceived length of movement as a
function of the duration of movement for the two stimulus patterns (successively activated and
saltation), the different numbers of tactors on the array (8 versus 12 tactors), and the two vibration
frequencies. Each data point represents the median of the ratings of 28 (250 Hz) or 20 (80 Hz)
subjects. For a better legibility of the data points error bars are not displayed. The variability in
subjects’ data dependent on temporal parameters (ISI/SD) can be extracted from Figures 10.4 and
10.8. There seems to be no observable effect of the duration of movement on perceived length.
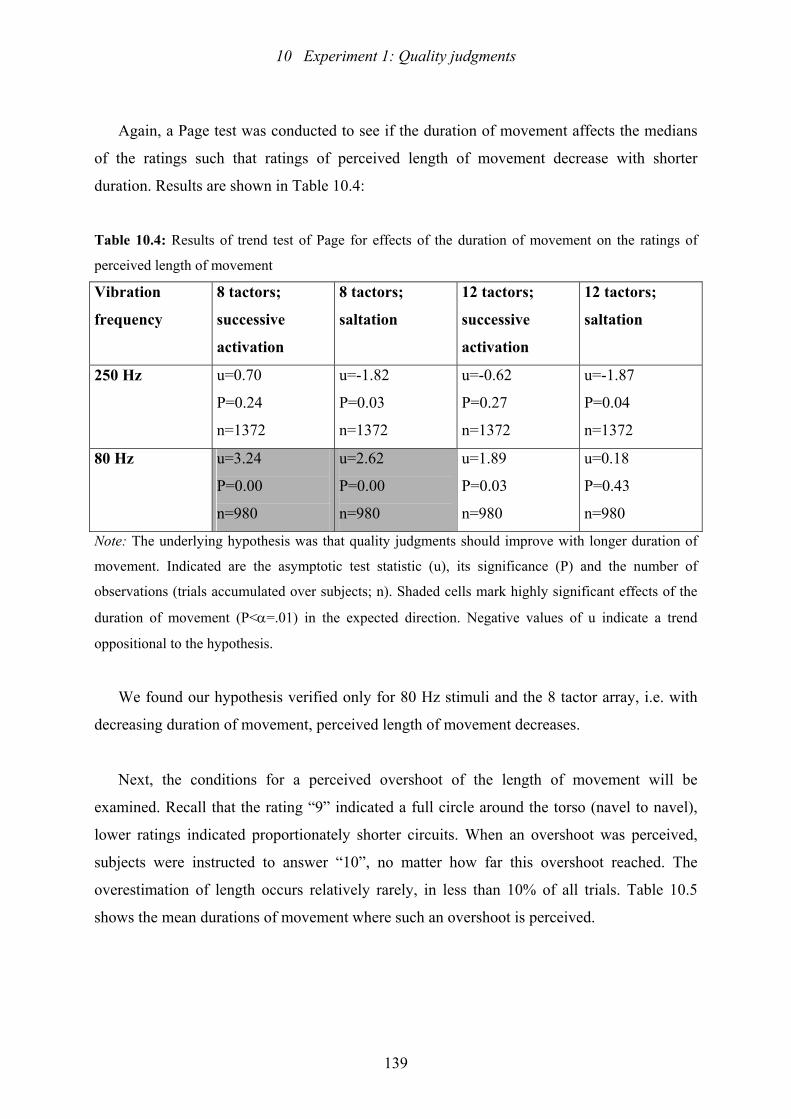
10 Experiment 1: Quality judgments
139
Again, a Page test was conducted to see if the duration of movement affects the medians
of the ratings such that ratings of perceived length of movement decrease with shorter
duration. Results are shown in Table 10.4:
Table 10.4: Results of trend test of Page for effects of the duration of movement on the ratings of
perceived length of movement
Vibration
frequency
8 tactors;
successive
activation
8 tactors;
saltation
12 tactors;
successive
activation
12 tactors;
saltation
250 Hz u=0.70
P=0.24
n=1372
u=-1.82
P=0.03
n=1372
u=-0.62
P=0.27
n=1372
u=-1.87
P=0.04
n=1372
80 Hz u=3.24
P=0.00
n=980
u=2.62
P=0.00
n=980
u=1.89
P=0.03
n=980
u=0.18
P=0.43
n=980
Note: The underlying hypothesis was that quality judgments should improve with longer duration of
movement. Indicated are the asymptotic test statistic (u), its significance (P) and the number of
observations (trials accumulated over subjects; n). Shaded cells mark highly significant effects of the
duration of movement (P<α=.01) in the expected direction. Negative values of u indicate a trend
oppositional to the hypothesis.
We found our hypothesis verified only for 80 Hz stimuli and the 8 tactor array, i.e. with
decreasing duration of movement, perceived length of movement decreases.
Next, the conditions for a perceived overshoot of the length of movement will be
examined. Recall that the rating “9” indicated a full circle around the torso (navel to navel),
lower ratings indicated proportionately shorter circuits. When an overshoot was perceived,
subjects were instructed to answer “10”, no matter how far this overshoot reached. The
overestimation of length occurs relatively rarely, in less than 10% of all trials. Table 10.5
shows the mean durations of movement where such an overshoot is perceived.
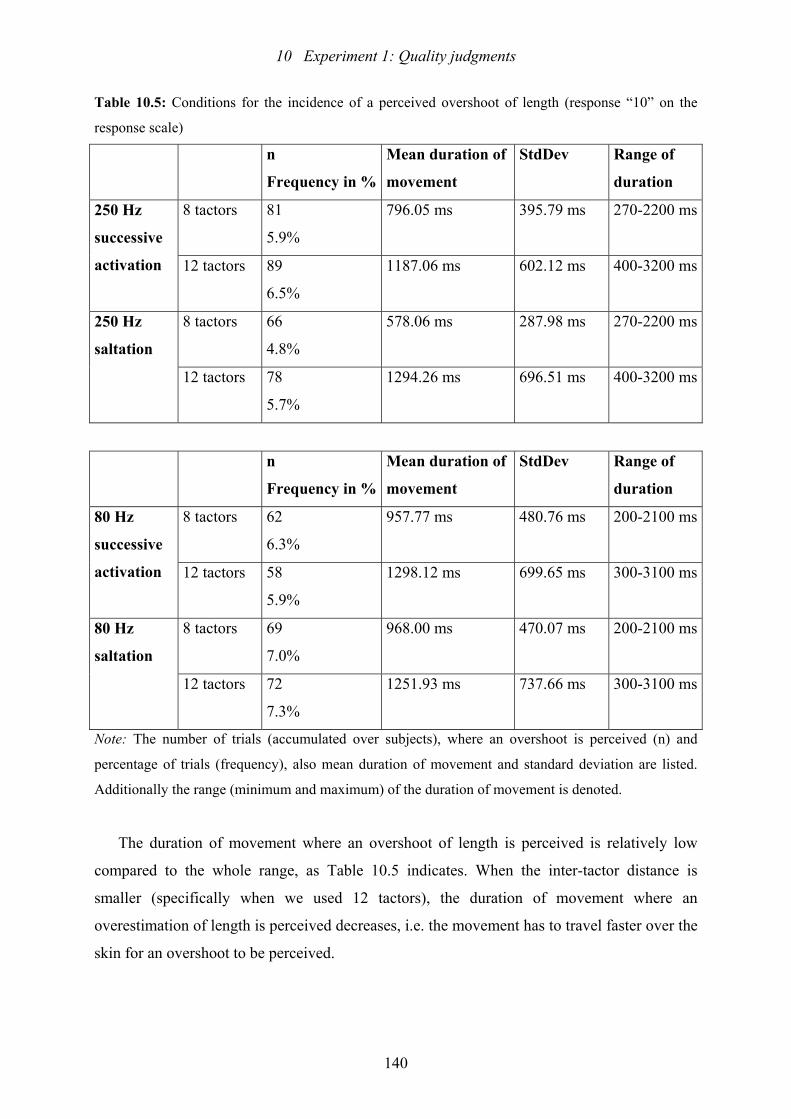
10 Experiment 1: Quality judgments
140
Table 10.5: Conditions for the incidence of a perceived overshoot of length (response “10” on the
response scale)
n
Frequency in %
Mean duration of
movement
StdDev Range of
duration
8 tactors
81
5.9%
796.05 ms 395.79 ms 270-2200 ms250 Hz
successive
activation 12 tactors
89
6.5%
1187.06 ms 602.12 ms 400-3200 ms
8 tactors 66
4.8%
578.06 ms 287.98 ms 270-2200 ms250 Hz
saltation
12 tactors 78
5.7%
1294.26 ms 696.51 ms 400-3200 ms
n
Frequency in %
Mean duration of
movement
StdDev Range of
duration
8 tactors
62
6.3%
957.77 ms 480.76 ms 200-2100 ms80 Hz
successive
activation 12 tactors
58
5.9%
1298.12 ms 699.65 ms 300-3100 ms
8 tactors 69
7.0%
968.00 ms 470.07 ms 200-2100 ms80 Hz
saltation
12 tactors 72
7.3%
1251.93 ms 737.66 ms 300-3100 ms
Note: The number of trials (accumulated over subjects), where an overshoot is perceived (n) and
percentage of trials (frequency), also mean duration of movement and standard deviation are listed.
Additionally the range (minimum and maximum) of the duration of movement is denoted.
The duration of movement where an overshoot of length is perceived is relatively low
compared to the whole range, as Table 10.5 indicates. When the inter-tactor distance is
smaller (specifically when we used 12 tactors), the duration of movement where an
overestimation of length is perceived decreases, i.e. the movement has to travel faster over the
skin for an overshoot to be perceived.
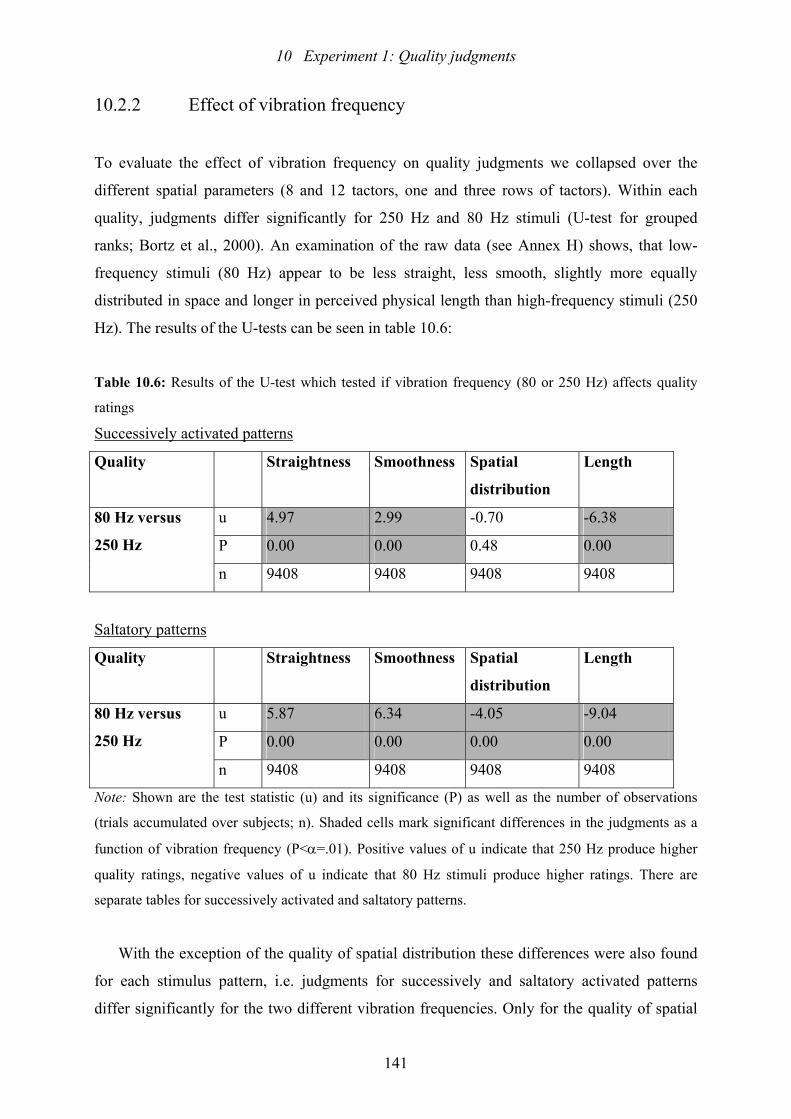
10 Experiment 1: Quality judgments
141
10.2.2 Effect of vibration frequency
To evaluate the effect of vibration frequency on quality judgments we collapsed over the
different spatial parameters (8 and 12 tactors, one and three rows of tactors). Within each
quality, judgments differ significantly for 250 Hz and 80 Hz stimuli (U-test for grouped
ranks; Bortz et al., 2000). An examination of the raw data (see Annex H) shows, that low-
frequency stimuli (80 Hz) appear to be less straight, less smooth, slightly more equally
distributed in space and longer in perceived physical length than high-frequency stimuli (250
Hz). The results of the U-tests can be seen in table 10.6:
Table 10.6: Results of the U-test which tested if vibration frequency (80 or 250 Hz) affects quality
ratings
Successively activated patterns
Quality Straightness Smoothness Spatial
distribution
Length
u 4.97 2.99 -0.70 -6.38
P 0.00 0.00 0.48 0.00
80 Hz versus
250 Hz
n 9408 9408 9408 9408
Saltatory patterns
Quality Straightness Smoothness Spatial
distribution
Length
u 5.87 6.34 -4.05 -9.04
P 0.00 0.00 0.00 0.00
80 Hz versus
250 Hz
n 9408 9408 9408 9408
Note: Shown are the test statistic (u) and its significance (P) as well as the number of observations
(trials accumulated over subjects; n). Shaded cells mark significant differences in the judgments as a
function of vibration frequency (P<α=.01). Positive values of u indicate that 250 Hz produce higher
quality ratings, negative values of u indicate that 80 Hz stimuli produce higher ratings. There are
separate tables for successively activated and saltatory patterns.
With the exception of the quality of spatial distribution these differences were also found
for each stimulus pattern, i.e. judgments for successively and saltatory activated patterns
differ significantly for the two different vibration frequencies. Only for the quality of spatial
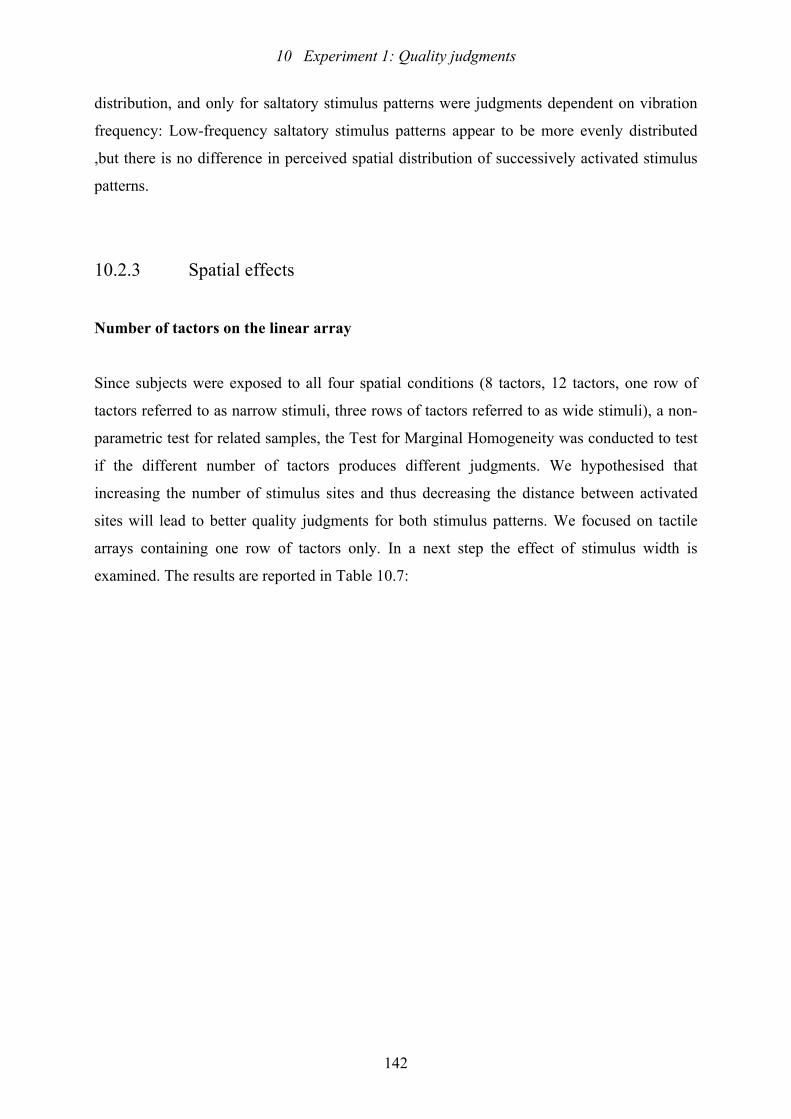
10 Experiment 1: Quality judgments
142
distribution, and only for saltatory stimulus patterns were judgments dependent on vibration
frequency: Low-frequency saltatory stimulus patterns appear to be more evenly distributed
,but there is no difference in perceived spatial distribution of successively activated stimulus
patterns.
10.2.3 Spatial effects
Number of tactors on the linear array
Since subjects were exposed to all four spatial conditions (8 tactors, 12 tactors, one row of
tactors referred to as narrow stimuli, three rows of tactors referred to as wide stimuli), a non-
parametric test for related samples, the Test for Marginal Homogeneity was conducted to test
if the different number of tactors produces different judgments. We hypothesised that
increasing the number of stimulus sites and thus decreasing the distance between activated
sites will lead to better quality judgments for both stimulus patterns. We focused on tactile
arrays containing one row of tactors only. In a next step the effect of stimulus width is
examined. The results are reported in Table 10.7:
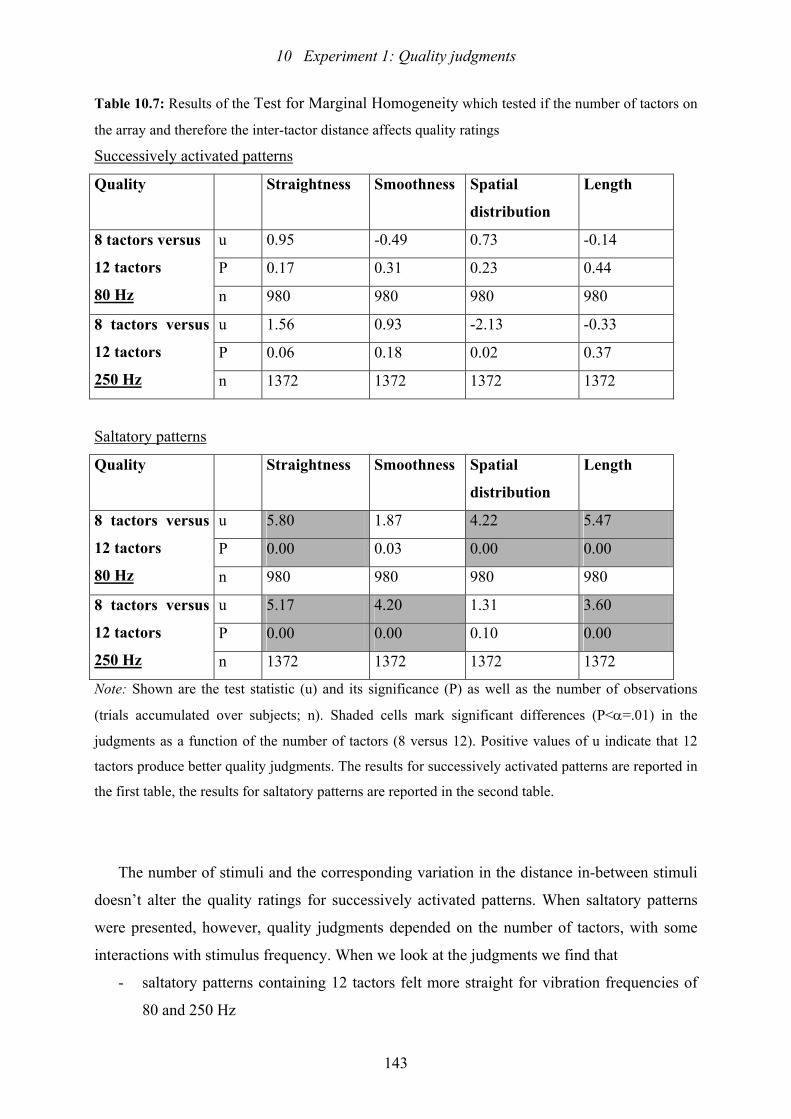
10 Experiment 1: Quality judgments
143
Table 10.7: Results of the Test for Marginal Homogeneity which tested if the number of tactors on
the array and therefore the inter-tactor distance affects quality ratings
Successively activated patterns
Quality Straightness Smoothness Spatial
distribution
Length
u 0.95 -0.49 0.73 -0.14
P 0.17 0.31 0.23 0.44
8 tactors versus
12 tactors
80 Hz n 980 980 980 980
u 1.56 0.93 -2.13 -0.33
P 0.06 0.18 0.02 0.37
8 tactors versus
12 tactors
250 Hz n 1372 1372 1372 1372
Saltatory patterns
Quality Straightness Smoothness Spatial
distribution
Length
u 5.80 1.87 4.22 5.47
P 0.00 0.03 0.00 0.00
8 tactors versus
12 tactors
80 Hz n 980 980 980 980
u 5.17 4.20 1.31 3.60
P 0.00 0.00 0.10 0.00
8 tactors versus
12 tactors
250 Hz n 1372 1372 1372 1372
Note: Shown are the test statistic (u) and its significance (P) as well as the number of observations
(trials accumulated over subjects; n). Shaded cells mark significant differences (P<α=.01) in the
judgments as a function of the number of tactors (8 versus 12). Positive values of u indicate that 12
tactors produce better quality judgments. The results for successively activated patterns are reported in
the first table, the results for saltatory patterns are reported in the second table.
The number of stimuli and the corresponding variation in the distance in-between stimuli
doesn’t alter the quality ratings for successively activated patterns. When saltatory patterns
were presented, however, quality judgments depended on the number of tactors, with some
interactions with stimulus frequency. When we look at the judgments we find that
- saltatory patterns containing 12 tactors felt more straight for vibration frequencies of
80 and 250 Hz
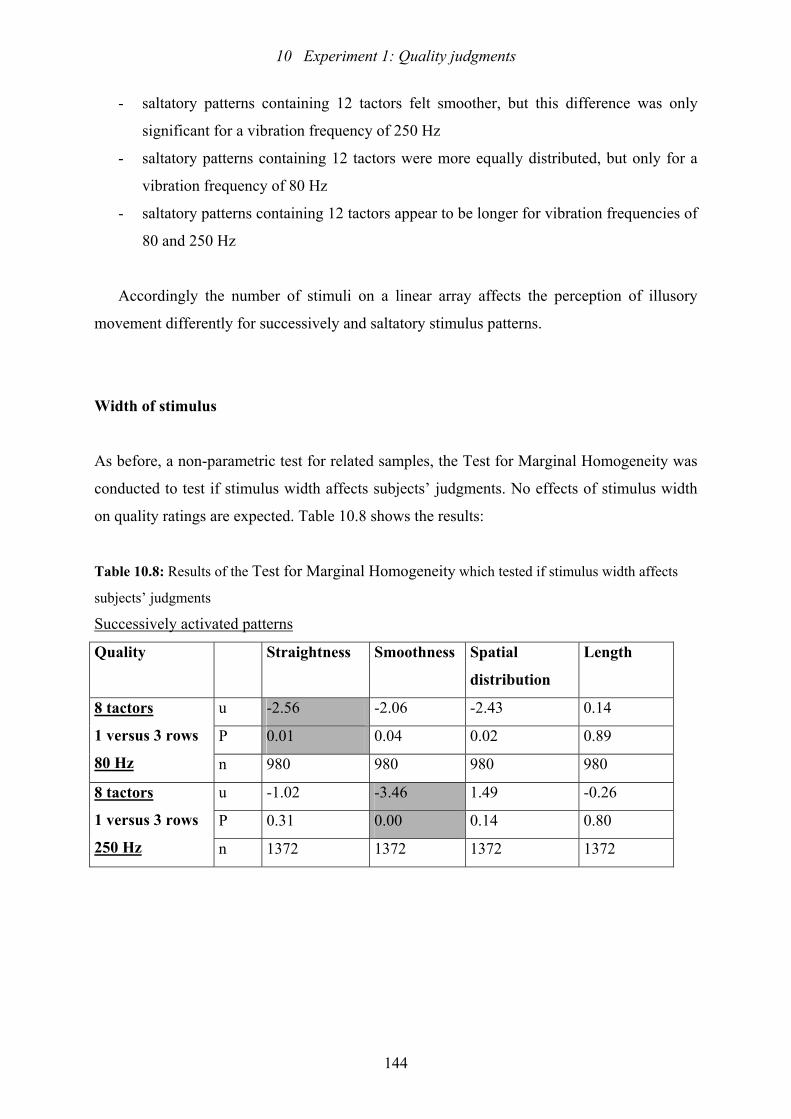
10 Experiment 1: Quality judgments
144
- saltatory patterns containing 12 tactors felt smoother, but this difference was only
significant for a vibration frequency of 250 Hz
- saltatory patterns containing 12 tactors were more equally distributed, but only for a
vibration frequency of 80 Hz
- saltatory patterns containing 12 tactors appear to be longer for vibration frequencies of
80 and 250 Hz
Accordingly the number of stimuli on a linear array affects the perception of illusory
movement differently for successively and saltatory stimulus patterns.
Width of stimulus
As before, a non-parametric test for related samples, the Test for Marginal Homogeneity was
conducted to test if stimulus width affects subjects’ judgments. No effects of stimulus width
on quality ratings are expected. Table 10.8 shows the results:
Table 10.8: Results of the Test for Marginal Homogeneity which tested if stimulus width affects
subjects’ judgments
Successively activated patterns
Quality Straightness Smoothness Spatial
distribution
Length
u -2.56 -2.06 -2.43 0.14
P 0.01 0.04 0.02 0.89
8 tactors
1 versus 3 rows
80 Hz n 980 980 980 980
u -1.02 -3.46 1.49 -0.26
P 0.31 0.00 0.14 0.80
8 tactors
1 versus 3 rows
250 Hz n 1372 1372 1372 1372
10 Experiment 1: Quality judgments
145
Quality Straightness Smoothness Spatial
distribution
Length
u -3.56 -2.78 -1.62 3.94
P 0.00 0.01 0.11 0.00
12 tactors
1 versus 3 rows
80 Hz n 980 980 980 980
u -3.17 -3.42 5.34 1.38
P 0.00 0.00 0.00 0.17
12 tactors
1 versus 3 rows
250 Hz n 1372 1372 1372 1372
Saltatory patterns
Quality Straightness Smoothness Spatial
distribution
Length
u -3.41 -1.61 3.13 1.89
P 0.00 0.11 0.00 0.56
8 tactors
1 versus 3 rows
80 Hz n 980 980 980 980
u 0.22 -0.41 1.76 2.96
P 0.83 0.68 0.08 0.00
8 tactors
1 versus 3 rows
250 Hz n 1372 1372 1372 1372
Quality Straightness Smoothness Spatial
distribution
Length
u -6.98 -3.89 -0.79 2.19
P 0.00 0.00 0.43 0.03
12 tactors
1 versus 3 rows
80 Hz n 980 980 980 980
u -1.41 -5.08 4.72 2.40
P 0.16 0.00 0.00 0.02
12 tactors
1 versus 3 rows
250 Hz n 1372 1372 1372 1372
Note: One row of tactors is referred to as narrow stimuli, three rows of tactors are referred to as wide
stimuli. Shown are the test statistic (u) and its significance (P) as well as the number of observations
(trials accumulated over subjects; n). Shaded cells mark significant differences (P<α=.01) in the
judgments as a function of stimulus width (one versus a row of three stimuli). Negative values of u
indicate that narrow stimuli–composed of only a single stimulus–are superior to wide stimuli–
composed of three stimuli on top of each other. Positive values of u indicate that wide stimuli are
10 Experiment 1: Quality judgments
146
judged better. There are separate tables for successively activated and saltatory stimuli and for the
different numbers of tactors on the array.
Quality straightness When vibration frequency is 80 Hz, narrow stimuli–composed of only
a single stimulus–feel significantly straighter than wide stimuli–composed of a row of three
stimuli−, as the marginal distribution of the judgments for the narrow versus wide stimuli
shows. This is true for 8 and 12 tactors as well as for successively and for saltatory stimulus
patterns. For vibration frequencies of 250 Hz, the only significant difference was found for
successively activated patterns containing 12 tactors. With only one exception (250 Hz/12
tactors), stimulus width affects the perception of the straightness of illusory movement
produced by successively activated and saltatory stimulus patterns equally.
Quality smoothness When the array contains more tactors (that is 12 tactors), a narrow
stimulus feels smoother compared to a wide stimulus. This is true for vibration frequencies of
80 and 250 Hz and for successively activated as well as for saltatory stimulus patterns. When
the array contains only 8 tactors there is only one significant difference in subjects’
judgments: For successively activated patterns of a vibration frequency of 250 Hz. Aside from
this exception (8 tactors, 250 Hz), stimulus width affects the perception of the smoothness of
illusory movement produced by successively activated and saltatory stimulus patterns equally.
Quality spatial distribution When the array contains more tactors (that is 12 tactors), a
wider stimulus at 250 Hz vibration frequency produces more-evenly distributed movement,
regardless of the stimulus pattern mode. When the stimulus frequency is 80 Hz and 12 tactors
form the array there is no significant difference in subjects’ judgments over stimulus widths
for either stimulus pattern. When the array contains only 8 tactors there is only one significant
difference in subjects’ judgments: For saltatory patterns of a vibration frequency of 80 Hz.
Aside from this exception (8 tactors, 80 Hz), stimulus width affects the perception of the
spatial distribution of illusory movement produced by successively activated and saltatory
stimulus patterns equally.
Quality length Only two comparisons (narrow versus wide stimuli) were statistically
significant: Saltatory patterns with a vibration frequency of 250 Hz containing 8 tactors and
successively activated patterns with a vibration frequency of 80 Hz containing 12 tactors. In
both cases, wider stimuli felt longer. Aside from these two exceptions, stimulus width affects
10 Experiment 1: Quality judgments
147
the perception of the length of illusory movement produced by successively activated and
saltatory stimulus patterns equally.
Recapitulating, there are only few instances in which stimulus width affects the perception
of illusory movement produced by successively activated and saltatory stimulus patterns
differently.
10.3 Summary and discussion
The different independent variables affected subjects’ judgments differently dependent on the
quality to be judged. Like in Cholewiaks and Collins’ (2000) experiment, there is no specific
set of spatio-temporal parameters that generates the very best ratings for each quality.
Temporal effects We expected that shorter ISIs would enhance the integration of spatio-
temporal stimuli into a percept of continuous motion in similar ways for successively
activated and saltatory stimulus patterns. This expectation was borne out for the qualities
straightness and smoothness. There was no effect of ISI on the quality spatial distribution for
250 Hz stimuli although there was a significant opposite effect for 80 Hz stimuli which
disappeared when more tactors were involved and the inter-tactor distance decreased. An
explanation for this finding might be found in the remarks of the subjects who stated that most
of the patterns felt evenly distributed and they applied different strategies to make their
judgments, so no uniform trend could be found. Patterns containing 12 tactors appear to be
longer at shorter ISIs, but there is only one significant effect of ISI that occurred with
successively activated patterns at a vibration frequency of 250 Hz. This effect is contrary to
the studies of Cholewiak (1999, 2000), where estimates of length were higher for longer ISIs.
Although the effects of ISI were similar for both stimulus patterns (successively activated
and saltatory), the situation was different when we considered the effects of SD: In general
SD affects the quality ratings of successively and saltatory stimulus patterns in different ways.
Whereas the effect of SD on saltation is largely unexplored, increasing SD was found to have
a positive effect on the “goodness” of motion in studies using successively activated stimulus
patterns. But, in our experiment, the effect of SD varied with the quality being judged as well
as the vibration frequency and the number of tactors. There is no consistent effect of SD on
10 Experiment 1: Quality judgments
148
the “goodness” of movement simulated by successively activated patterns and only few trends
are statistically significant. The differences with previous studies that might account for these
results were: Test site (Kirman, 1974a, 1974b, 1975: finger; Szanislo et al., 1998: face),
stimulator (Kirman: vibrating bronze rods; Szanislo: vibrating rows of a dense array tactile
stimulator), vibration frequency (Kirman: 100 Hz; Szanislo: 200 Hz), and experimental
method (Kirman: categorization of “goodness” of motion; Szanislo: method of
limits/magnitude estimation for “goodness” of motion).
SD mostly affects quality ratings (except length) for saltatory patterns such, that quality
ratings decreased with increasing SD. In saltation experiments SDs chosen were brief, e.g. 10
ms in Geldard’s original experiments (1982) or 20 ms in Stolle’s experiment (2003). In our
experiment, with such low levels of SD (16 ms for 250 Hz stimuli, 12 ms for 80 Hz stimuli),
there seems to be no variation in subjects’ ratings of the spatial distribution of stimuli with ISI
as might be expected from previous experiments (compare Annex G). At longer SDs (128 ms
for 250 Hz stimuli, 125 ms for 80 Hz stimuli) there is a tendency, that saltatory patterns feel
more evenly distributed with increasing SD, which becomes more obvious for smaller inter-
tactor distances (with the 12 tactor array), but the interaction between SD and ISI was only
partly significant for the 250 Hz group. It seems though that both ISI and SD play an
important role in eliciting the saltatory illusion.
Movement feels straighter when duration of movement decreases, i.e. stimuli move faster
over the skin. These results were also found by Cholewiak and Collins (2000) and Langford
(1973). We expected to find the same result for length−like Cholewiak and Collins (2000) and
Whitsel et al. (1986)−but in our case the perceived length of movement mostly did not vary
significantly with duration. (Note: In our case, since we have a circular array and tried to
insure (by adding the extra stimulus at the end) that completion occurred around the body, we
might have worked against the expectation of “shorter” stimulus extents.) The rare effect of
the duration of movement on perceived length is related to the effect of SD and the more
distinct effect of the duration of movement on straightness is influenced by SD as well as by
ISI.
Although several researchers confirm these effects, a full explanation is missing. It is
possible that at higher velocities stimuli are being interpolated strongly as the tactile system’s
ability to discriminate between successive stimuli decreases when velocity increases. Thus,
there are fewer spots where movement can be perceptually “measured” at high velocities,
making movement feeling straighter and shorter. At slower velocities, the tactile system may
10 Experiment 1: Quality judgments
149
be able to distinguish more spots where movement can be observed, allowing movement to
stray from a straight line.
That perceived length depends first of all on SD parallels findings in the auditory sense:
Strybel et al (1998) found that estimates of separation between two successively presented
auditory stimuli is affected first of all by stimulus duration, as well as by ISOI and the
physical separation between the stimuli. Longer SDs, longer ISOIs and greater physical
separations lead to higher estimates of separation. It seems that subjects use different
strategies to judge physical separation: They either base their judgments on total stimulus
duration, physical separation, or a mixture of both, which might also apply to our results and
explain the large variation in subjects’ responses.
Of special interest were the instances in which subjects overestimate length, i.e. When do
they perceive the length of movement as being longer than a full circle around the torso? We
find that an overshoot of length–which occurs relatively rarely−is perceived at low durations
of movement, the probability of which decreases with increasing duration of movement for
both stimulus patterns. This finding agrees with studies in vision: When a moving object
(movement can be illusory, i.e. generated by successive presentation of stimuli or veridical)
abruptly vanishes, subjects place the final position ahead of the physical final position, which
has been referred to as “representational momentum” or “displacement in the direction of
motion” (Hubbard, 2005; p. 822). Representational momentum is regarded as a memory bias
of the final position and the observed forward displacement increases with the speed of
movement (Hubbart, 2005, Nagai & Saiki, 2005). The difference is that in these subjects were
asked to point at the perceived final position of the moving target, whereas in our experiment
subjects had to judge the length of movement on a 10-point scale, and answer “10”, if
movement exceeded the physical final position, without specifying the amount of
“overshoot”. However, one could interpret the forward displacement as an overestimation of
length of movement, as was supported by the experiment of Hubbart and Motes (2002). They
had subjects judge the initial and final position of a visual moving target and found a
backward displacement of the initial position (i.e. the initial position was displaced in the
direction opposite to movement) and at the same time a forward displacement of the final
position. These findings indicate that the remembered length of the trajectory was larger than
the physical length, an effect that increased with the speed of movement. Their results suggest
that representational momentum does not result from a forward displacement of the whole
trajectory but from an overestimation of overall length.
10 Experiment 1: Quality judgments
150
Representational momentum has been explained as an automatic process of extrapolation
based on physical regularities which can be modified by attention or expectation (Kerzel,
2003). There is experimental evidence that rather high-level cognitive processes underlie
forward displacement than low-level sensory processes (Hubbart, 2005).
Forward displacement of moving stimuli has also been found in audition for different
types of stimuli (series of tones ascending or descending in frequency or continuous noise or
noise pulses), but the effects of velocity differed with the stimulus type used (Getzmann,
Lewald, & Guski, 2004; Hubbart, 2005). To our knowledge, no systematic study has ever
investigated the existence of representational momentum in the tactile sense, so it is unclear
whether our findings can be replicated in other experimental settings (different response
paradigms, different test sites,...). Nor is it obvious whether or not the same motion-
perception mechanisms generate the representational momentum in the visual, auditory, and
tactile senses.
Effect of vibration frequency Contrary to our hypothesis, vibration frequency affected the
perception of the different qualities of movement: 80 Hz stimuli are perceived to be less
straight, less smooth, more equally distributed in space and longer than 250 Hz stimuli.
Low-frequency stimuli are known to appear dull, whereas high-frequent stimuli produce
bright, sharp–maybe also more punctiform–taps. According to Békésy (1967) there is an
increase in lateral spread of travelling waves produced by vibratory stimuli with decreasing
frequency. It is possible that 80 Hz stimuli feel larger, less distinct, or less punctuate as their
surface waves travel further over the skin, activating distant receptors, letting the single
stimuli “melt together”, and making the stimulus patterns feel more evenly distributed.
However, it should be noted that the presence of a rigid surround around the vibrating element
of our tactors, should restrict these surface travelling waves. Goble, Collins and Cholewiak
(1996) showed that vibratory thresholds increase with the presence of a rigid surround at high
frequencies, whereas at low frequencies <50 Hz, threshold is reduced, due to the properties of
the activated mechanoreceptors. Nevertheless, deeper waves may still continue to spread
laterally. This lateral spread may also account for the result that 80 Hz vibratory stimuli
appear to be longer and seem to be less straight and less smooth, since they are not as
spatially defined as 250 Hz stimuli6.
6 Pacinian afferents resolve spatial detail poorly (Johnson & Hsiao, 1992), when static tactile patterns are presented (like Braille characters). Note, however, we are talking about vibratory patterns and the travelling waves they elicit here, so our results and the study of Johnson and Hsiao do not seem to be contradictory.
10 Experiment 1: Quality judgments
151
Spatial effects
Number of tactors on the linear array We expected that increasing the number of stimulus
sites and thus decreasing the distance between activated sites will enhance the integration of
spatio-temporal stimuli into a percept of continuous motion for successively activated as well
as saltatory stimulus patterns.
Variation in the number of stimuli and the resulting changes in distance in-between
activated sites doesn’t alter the quality ratings for successively activated patterns. At first
view, this contradicts the findings of Kirman (1974) and Szaniszlo et al. (1998) who found
that the quality of motion percepts improved with more activated stimuli. But in Kirman’s
study the number of stimuli and the length of the path travelled was confounded: Each
contactor was separated by a fixed distance of 0.5 cm, so the total length of the array varied
with the number of stimuli (2, 4, 8 stimuli; test site: finger). In our experiment the total length
of the array was kept constant, so the results cannot be compared directly.
Szaniszlo et al. kept the total length of the array constant and varied only the number of
rows activated on the OPTACON (test site: face). The goodness of motion percepts increased
with increasing number of activated rows, but goodness of motion was very similar for the 4-,
8-, and 22 row pattern, only the 2-row pattern received judgments that were significantly
worse.
In our experiment the differences in judgments between the 8 tactor and 12 tactor array
were marginal, suggesting that we would have to reduce the number of tactors beyond the
number of 8 to achieve different quality ratings. The distance in-between activated tactors
varied between 5.8 cm and 9.2 cm for the 12 tactor array and 8.6 cm and 14.9 cm for the 8
tactors array. It seems that if once the number of tactors has exceeded a minimum, the
distance doesn’t effect the integration of discrete stimuli–and thus quality ratings−any more.
Nevertheless, in most cases, saltatory patterns containing 12 tactors produce better quality
judgments than saltatory patterns containing 8 tactors, according to the hypothesis. According
to Geldard and Sherrick (1972) or Geldard (1982) saltation is vivid at inter-tactor distances
between 2-35 cm and could even be observed over a distance of 150 cm (5-5-5 tap
arrangement). However, he only examined if taps were mislocalized from their origin, not if
the quality of saltatory movement changed with increasing inter-tactor distance. It seems that
although saltation occurs over a wide range of separations between stimuli, the quality of
10 Experiment 1: Quality judgments
152
saltatory movement depends on the inter-tactor distance (or number of tactors, since the two
factors were confounded in our experiments).
Width of stimulus Finally, we didn’t expect that stimulus width affects the integration of
different spatio-temporal stimulus patterns into a percept of continuous motion, but wide
stimuli−composed a column of three stimuli−are mostly less straight and less smooth than
narrow stimuli–composed of only a single stimulus. On the other hand, wide stimuli often feel
more evenly distributed and longer than narrow stimuli. Thus, a larger stimulated area affects
the perception of simulated movement. In most cases the effect is equal for the two different
stimulus patterns–as opposed to the effect of the number of tactors.
11 Experiment 2: Discrimination between successively activated and saltatory patterns
153
11 Experiment 2: Discrimination between successively activated
and saltatory stimulus patterns
In the second experiment we use a different response paradigm to analyze if the two stimulus
patterns−successively activated and saltatory–can produce indiscriminable sensations and to
determine the spatio-temporal limits where the two stimulus patterns feel the same. This
question couldn’t be answered unambiguously in Experiment 1 since there was there was no
specific set of spatio-temporal parameters that generated best ratings for each quality. Rather
each quality was affected by the spatio-temporal parameters in different ways.
In this experiment, using a paired-comparison paradigm, subjects made a direct
comparison between successively activated and saltatory stimulus patterns. This experimental
procedure was used in previous experiments (Cholewiak & Collins, 2000, and slightly
modified by Eimer et al., 2005) to test the existence of the saltatory illusion. Since it is
assumed that at appropriate spatio-temporal stimulus characteristics, the illusory saltatory
stimulus is located between activated sites, as when successively activated stimuli are
presented, this experimental procedure allows us to directly evaluate the spatio-temporal
stimulus parameters when both patterns produce phenomenological similar percepts.
The first part of the experiment required a discrimination between movement produced in
these two different ways (a “same/different” distinction), while in the second part the
subjects’ task was to chose the preferred stimulus pattern (by judging “which is best”). In
addition, we will present every possible combination of our independent variables twice,
which allows us to investigate if repetitive stimulation leads to changes in the tactile body
map that alter discrimination performance.
The spatio-temporal parameters we use in this experiment will be the same as in the
previous experiment with only one exception: We will only use a 12 tactor array, thus inter-
tactor distance will be held constant this time.
Temporal effects We know from Experiment 1 that there was no uniform effect of ISI on the
different qualities. But, like in the first experiment, we expect that shorter ISIs enhance the
integration of spatio-temporal stimuli into a percept of continuous motion. If ISI affects both
stimulus patterns the same way, as it genrally did in the first experiment, then discriminability
should decrease with shorter ISI.
11 Experiment 2: Discrimination between successively activated and saltatory patterns
154
With the direct-comparison paradigm (“which is best”), we expect that preferences for one
stimulus pattern over another as a function of ISI would be revealed when subjects have to
choose the pattern that is “best” in terms of smoothness, straightness and spatial distribution.
For short ISIs, patterns should be indiscriminable, so there should be no preference for either
pattern. For longer ISIs, quality ratings in Experiment 1 were slightly higher for successively
activated patterns, thus we expect that for longer ISIs, subjects will have a preference for one
pattern over the other.
The effect of SD on the quality judgments was different for the two stimulus patterns and
qualities, but from Figures 10.5-10.8 we learned, that quality ratings are rather similar for
short SDs (<50 ms), whereas for longer SDs quality ratings for successively activated and
saltatory patterns diverge. Specifically, ratings for saltatory patterns decrease with increasing
SD. We therefore expect (deviating from the hypothesis formulated in Chapter 5) that
discriminability is poor for short SDs and improves for longer SDs.
At the same time, there should be no clear preference for one stimulus pattern for short
SDs, but for longer SDs, successively activated stimulus patterns should be preferred over
saltatory patterns.
Spatial effect In Experiment 1 we found that the size of the stimulated area–here the width
of the stimulus–affected the perception of illusory motion. This effect was frequently the
same for both stimulus patterns, although it differed between qualities. If stimulus width
affects both patterns equally, we do not expect to find an effect of stimulus width on
discriminability or on preference for one stimulus pattern over the other.
Effect of frequency Experiment 1 showed that the effect of vibration frequency was
generally identical for both stimulus patterns. We therefore expect that vibration frequency
doesn’t affect discriminability or preference for one stimulus pattern.
Repetitive stimulation Stimulus repetition might improve discrimination performance, since
with experience, subjects find perceptual cues to distinguish between the two stimulus
patterns. Conversely, repetition can lead to a rapid adaptation of the cortical map to spatio-
temporal stimulus characteristics–as Stolle (2003) demonstrated for saltation. Hegner et al.
11 Experiment 2: Discrimination between successively activated and saltatory patterns
155
(2006) showed that these plastic changes can arise within minutes. Tactile stimulation in a
fixed order and in quick temporal succession–like in our stimulus patterns−might lead to a
reduction in cortical representational distances. Thus, discrimination performance might
decline, as the patterns feel more and more alike. Finally, if one stimulus patterns is preferred
over the other, this preferential treatment should diminish with stimulus repetition.
11.1 Method Subjects In the “same/different” experiment, 18 subjects were tested with 250 Hz stimuli,
and 19 subjects with 80 Hz stimuli. Of the 18 subjects tested with 250 Hz stimuli, there were
13 males and 5 females. Their average age was 23.3 (Min.=21, Max.=31). Only two subjects
were left-handed, the remaining 16 subjects were right-handed. In the 80 Hz group we had 18
male and one female subjects. The youngest subject was 21 and the oldest was 32 (M=24.3).
Sixteen subjects were right-handed, two were left-handed, and one was ambidextrous.
In the second part of the experiment (“which is best”) we tested 20 subjects with 250 Hz
stimuli and another 20 subjects with 80 Hz stimuli. In the 250 Hz group there were 19 male
subjects and only one female. Their age varied between 21 and 29 (M=22.9). Sixteen subjects
were right-handed, three subjects left-handed, one was ambidextrous. Out of the 20 subjects
tested with 80 Hz stimuli there were 18 males and two females. Their average age was 23.3
(Min.=22, Max.=28). Only two subjects were left-handed, the rest were right-handed.
Procedure The apparatus and stimulus parameters described in the General Method section
were employed in this experiment.
In the first part of the experiment−that required a same/different distinction−one half of
the trials were generated in the same mode (both stimuli were successively activated or both
were saltatory) and in the other half they were different (one stimulus successively activated,
one stimulus saltatory). A combination of the seven different levels of SDs and ISIs resulted
in 49 pairs of same trials successively activated, 49 pairs of same trials saltatory. When all
possible pairings of the levels of SD and ISI and the sequence of stimulus patterns (mode of
the pattern presented first) were specified, we had 98 pairs of different trials. If we would
11 Experiment 2: Discrimination between successively activated and saltatory patterns
156
have presented all possible same and different pairs in one block, we would have had a total
of 196 trials. We knew from previous pilot studies that subjects have difficulties concentrating
on a task like this over a long period of time. Consequently we designed each block to consist
of only 98 trials, with two blocks required to sample the complete set of alternatives. Stimulus
pairs within a trial were generated with identical temporal parameters so that the total duration
for the patterns to be compared was the same within a trial. The number of same and different
pairs in each block was the same to ensure equal probabilities for same and different
judgments. Otherwise, same and different pairs were randomly presented. All possible 196
pairings were presented twice, so there was a total of four blocks per session. Subjects were
tested in two separate sessions on two consecutive days. In one session the tactile array
consisted of one row of 12 tactors (narrow stimulus), while in the other session there were
three rows of 12 tactors (wide stimulus). The order of the two sessions was randomized. One
group of subjects was presented with 80 Hz stimuli and the second group of subjects was
presented with 250 Hz stimuli.
Subjects were able to initiate the trials themselves by a keystroke. After a brief
preparatory delay (600 ms) the first pattern was presented and after a delay of 2.4 s the second
pattern followed automatically. Subjects reported their responses on the first two keys of the
10-button keyboard. Eight keys were covered with a paper strip, so that only the two response
keys were visible; labeled with “S” for “same” and “D” for “different”. Subjects had no time
limit for entering their answer. No feedback was given, whether the subjects’ answers were
correct or incorrect. In between the blocks subjects could take a brief break if they wished.
During the second part of the experiment, only different pairs of stimulus patterns were
presented: One pattern was always successively activated, while the other pattern was
saltatory, with the order of the two modes varied randomly. As in the previous protocol, there
were 98 possible pairings when the two orders, seven levels of SD and seven ISIs were
combined. Every pairing was presented twice in each session. Again, there were two sessions,
one for one row of 12 tactors, and one for three rows of 12 tactors, but this time, both sessions
were executed successively on one day, separated by a brief break when the belt was removed
to change the tactor arrangement. In this study there were also two groups of subjects: One
group received 80 Hz stimuli in all conditions, the other group received 250 Hz stimuli.
The question to be answered by the subjects in this forced-choice paradigm, was which of
the two patterns was the “best”. The two visible response keys on the keyboard were labeled
11 Experiment 2: Discrimination between successively activated and saltatory patterns
157
“1” ( for the first pattern) and “2” ( for the second pattern). Because the definition of best
could vary over subjects, a standardized definition–based on the criteria from Experiment
1−was read to subjects and was available for reference throughout the whole session:
WHICH IS BEST?
By which is best we mean which pattern felt overall better.
Guidelines to determine this include:
Which line felt:
-straighter
-smoother
-equally distributed in both space and time
Subjects were also instructed that there are no correct or incorrect responses simply
because they are rating which of the two patterns feels best for them. Accordingly no
feedback was given. For complete instructions for both parts of the experiment see Annexes I
and K.
The design of Experiment 2 is a multifactor design with repeated measures on the factors
SD, ISI, sequence of stimulus patterns (only for “different” pairs) and number of tactors.
Frequency serves as a group variable.
11.2 Results (“same-different”)
Subjects had a strong tendency to answer “patterns are the same” as Table 11.1 shows:
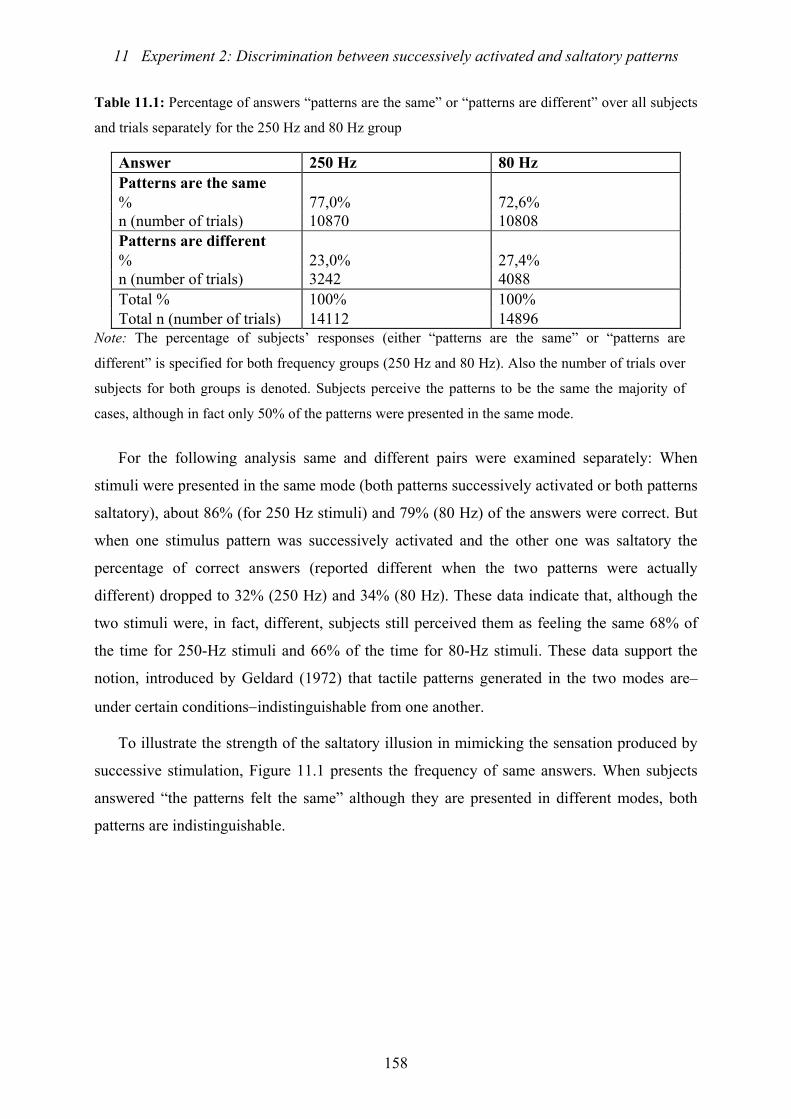
11 Experiment 2: Discrimination between successively activated and saltatory patterns
158
Table 11.1: Percentage of answers “patterns are the same” or “patterns are different” over all subjects
and trials separately for the 250 Hz and 80 Hz group
Answer 250 Hz 80 Hz Patterns are the same % 77,0% 72,6% n (number of trials) 10870 10808 Patterns are different % 23,0% 27,4% n (number of trials) 3242 4088 Total % 100% 100% Total n (number of trials) 14112 14896
Note: The percentage of subjects’ responses (either “patterns are the same” or “patterns are
different” is specified for both frequency groups (250 Hz and 80 Hz). Also the number of trials over
subjects for both groups is denoted. Subjects perceive the patterns to be the same the majority of
cases, although in fact only 50% of the patterns were presented in the same mode.
For the following analysis same and different pairs were examined separately: When
stimuli were presented in the same mode (both patterns successively activated or both patterns
saltatory), about 86% (for 250 Hz stimuli) and 79% (80 Hz) of the answers were correct. But
when one stimulus pattern was successively activated and the other one was saltatory the
percentage of correct answers (reported different when the two patterns were actually
different) dropped to 32% (250 Hz) and 34% (80 Hz). These data indicate that, although the
two stimuli were, in fact, different, subjects still perceived them as feeling the same 68% of
the time for 250-Hz stimuli and 66% of the time for 80-Hz stimuli. These data support the
notion, introduced by Geldard (1972) that tactile patterns generated in the two modes are–
under certain conditions−indistinguishable from one another.
To illustrate the strength of the saltatory illusion in mimicking the sensation produced by
successive stimulation, Figure 11.1 presents the frequency of same answers. When subjects
answered “the patterns felt the same” although they are presented in different modes, both
patterns are indistinguishable.
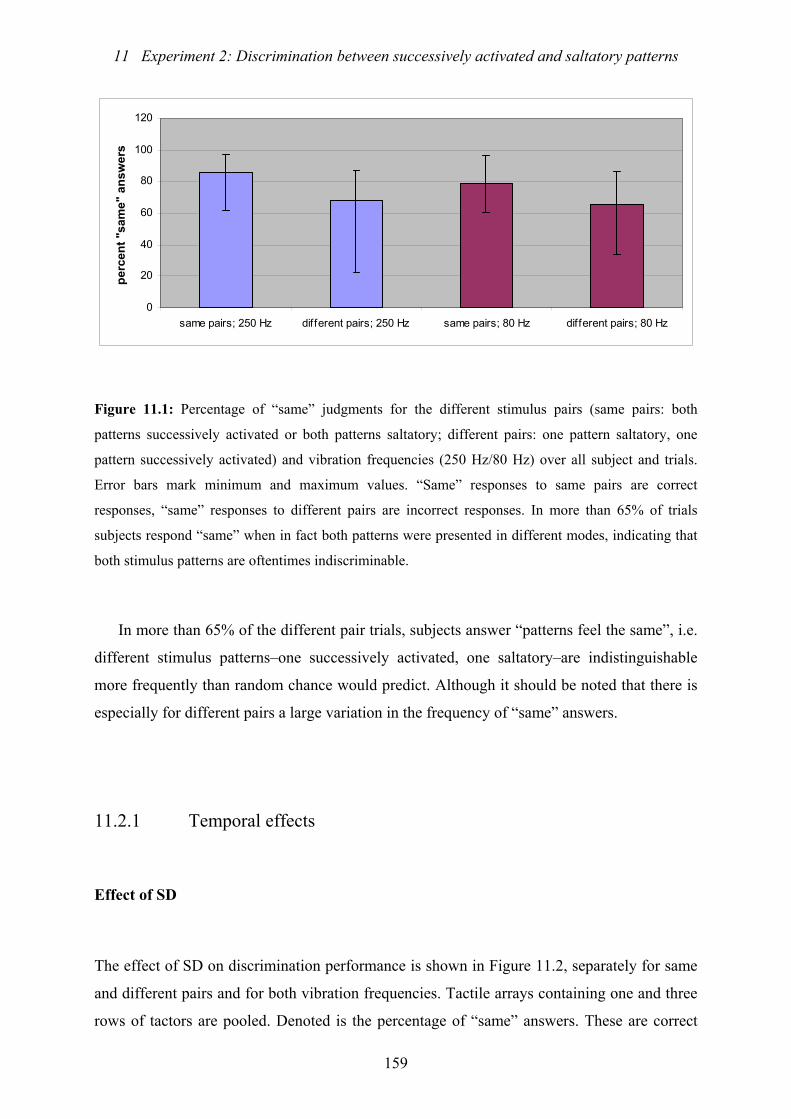
11 Experiment 2: Discrimination between successively activated and saltatory patterns
159
0
20
40
60
80
100
120
same pairs; 250 Hz different pairs; 250 Hz same pairs; 80 Hz different pairs; 80 Hz
perc
ent "
sam
e" a
nsw
ers
Figure 11.1: Percentage of “same” judgments for the different stimulus pairs (same pairs: both
patterns successively activated or both patterns saltatory; different pairs: one pattern saltatory, one
pattern successively activated) and vibration frequencies (250 Hz/80 Hz) over all subject and trials.
Error bars mark minimum and maximum values. “Same” responses to same pairs are correct
responses, “same” responses to different pairs are incorrect responses. In more than 65% of trials
subjects respond “same” when in fact both patterns were presented in different modes, indicating that
both stimulus patterns are oftentimes indiscriminable.
In more than 65% of the different pair trials, subjects answer “patterns feel the same”, i.e.
different stimulus patterns–one successively activated, one saltatory–are indistinguishable
more frequently than random chance would predict. Although it should be noted that there is
especially for different pairs a large variation in the frequency of “same” answers.
11.2.1 Temporal effects
Effect of SD
The effect of SD on discrimination performance is shown in Figure 11.2, separately for same
and different pairs and for both vibration frequencies. Tactile arrays containing one and three
rows of tactors are pooled. Denoted is the percentage of “same” answers. These are correct
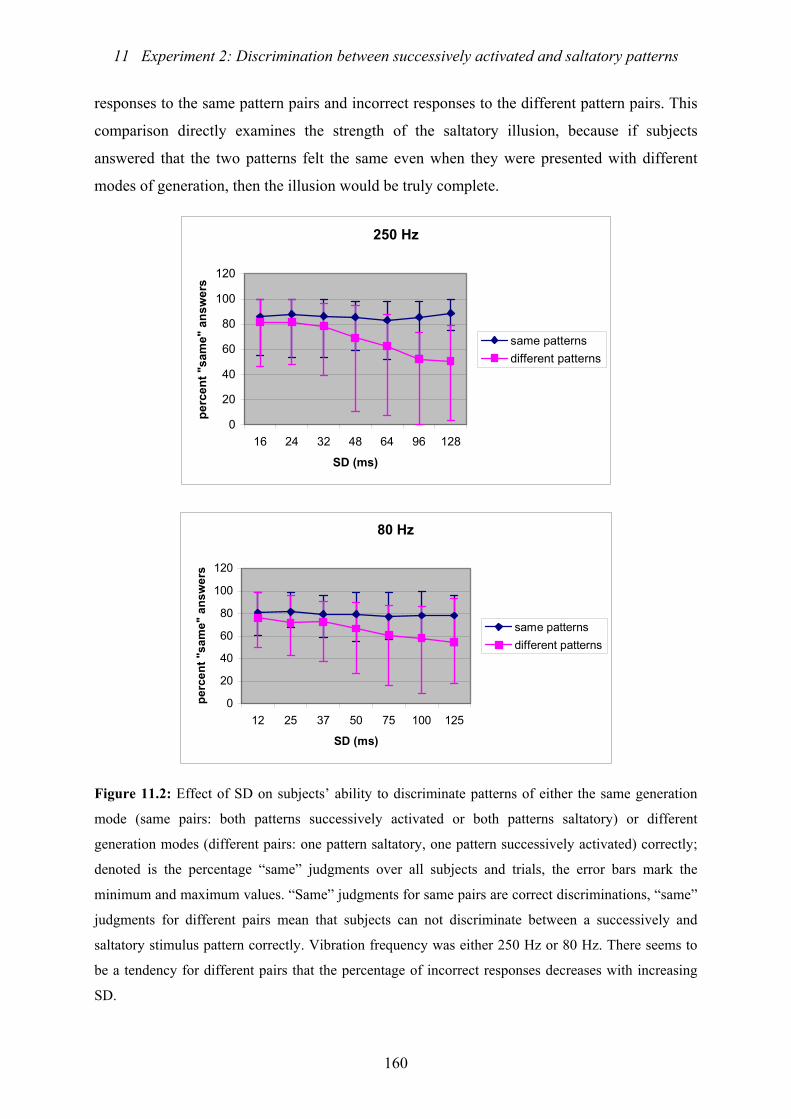
11 Experiment 2: Discrimination between successively activated and saltatory patterns
160
responses to the same pattern pairs and incorrect responses to the different pattern pairs. This
comparison directly examines the strength of the saltatory illusion, because if subjects
answered that the two patterns felt the same even when they were presented with different
modes of generation, then the illusion would be truly complete.
250 Hz
0
20
40
60
80
100
120
16 24 32 48 64 96 128
SD (ms)
perc
ent "
sam
e" a
nsw
ers
same patternsdifferent patterns
80 Hz
0
20
40
60
80
100
120
12 25 37 50 75 100 125
SD (ms)
perc
ent "
sam
e" a
nsw
ers
same patternsdifferent patterns
Figure 11.2: Effect of SD on subjects’ ability to discriminate patterns of either the same generation
mode (same pairs: both patterns successively activated or both patterns saltatory) or different
generation modes (different pairs: one pattern saltatory, one pattern successively activated) correctly;
denoted is the percentage “same” judgments over all subjects and trials, the error bars mark the
minimum and maximum values. “Same” judgments for same pairs are correct discriminations, “same”
judgments for different pairs mean that subjects can not discriminate between a successively and
saltatory stimulus pattern correctly. Vibration frequency was either 250 Hz or 80 Hz. There seems to
be a tendency for different pairs that the percentage of incorrect responses decreases with increasing
SD.
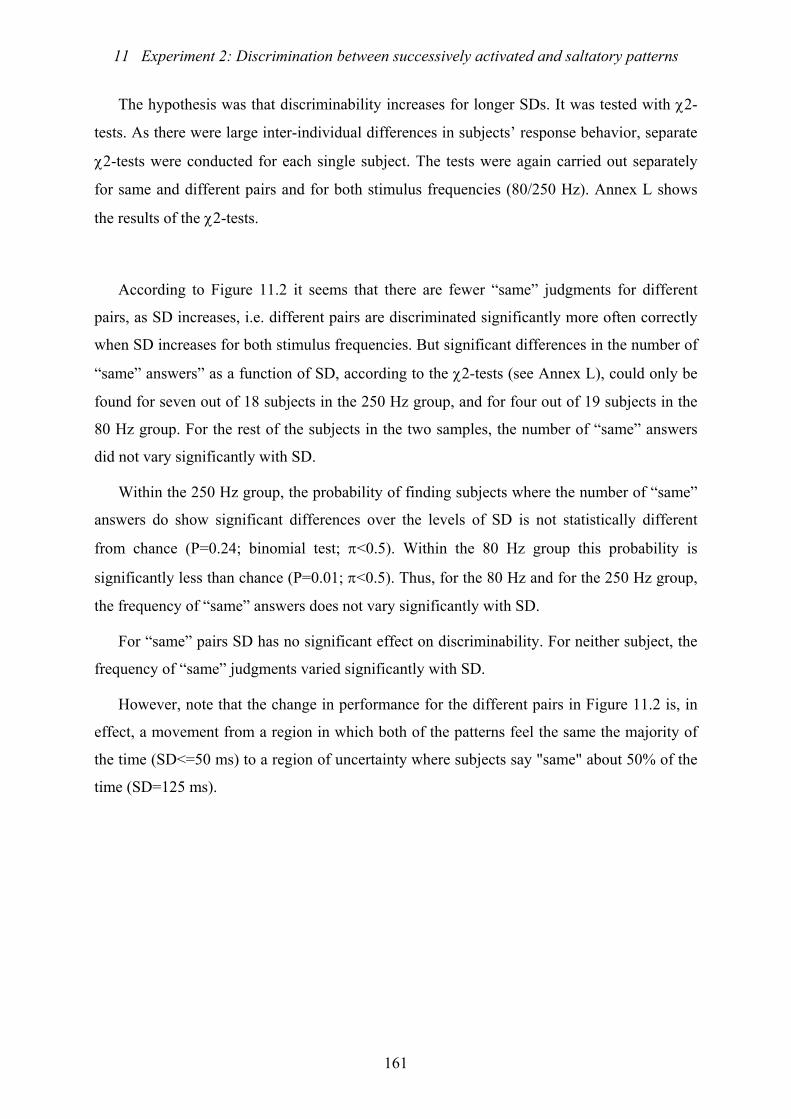
11 Experiment 2: Discrimination between successively activated and saltatory patterns
161
The hypothesis was that discriminability increases for longer SDs. It was tested with χ2-
tests. As there were large inter-individual differences in subjects’ response behavior, separate
χ2-tests were conducted for each single subject. The tests were again carried out separately
for same and different pairs and for both stimulus frequencies (80/250 Hz). Annex L shows
the results of the χ2-tests.
According to Figure 11.2 it seems that there are fewer “same” judgments for different
pairs, as SD increases, i.e. different pairs are discriminated significantly more often correctly
when SD increases for both stimulus frequencies. But significant differences in the number of
“same” answers” as a function of SD, according to the χ2-tests (see Annex L), could only be
found for seven out of 18 subjects in the 250 Hz group, and for four out of 19 subjects in the
80 Hz group. For the rest of the subjects in the two samples, the number of “same” answers
did not vary significantly with SD.
Within the 250 Hz group, the probability of finding subjects where the number of “same”
answers do show significant differences over the levels of SD is not statistically different
from chance (P=0.24; binomial test; π<0.5). Within the 80 Hz group this probability is
significantly less than chance (P=0.01; π<0.5). Thus, for the 80 Hz and for the 250 Hz group,
the frequency of “same” answers does not vary significantly with SD.
For “same” pairs SD has no significant effect on discriminability. For neither subject, the
frequency of “same” judgments varied significantly with SD.
However, note that the change in performance for the different pairs in Figure 11.2 is, in
effect, a movement from a region in which both of the patterns feel the same the majority of
the time (SD<=50 ms) to a region of uncertainty where subjects say "same" about 50% of the
time (SD=125 ms).
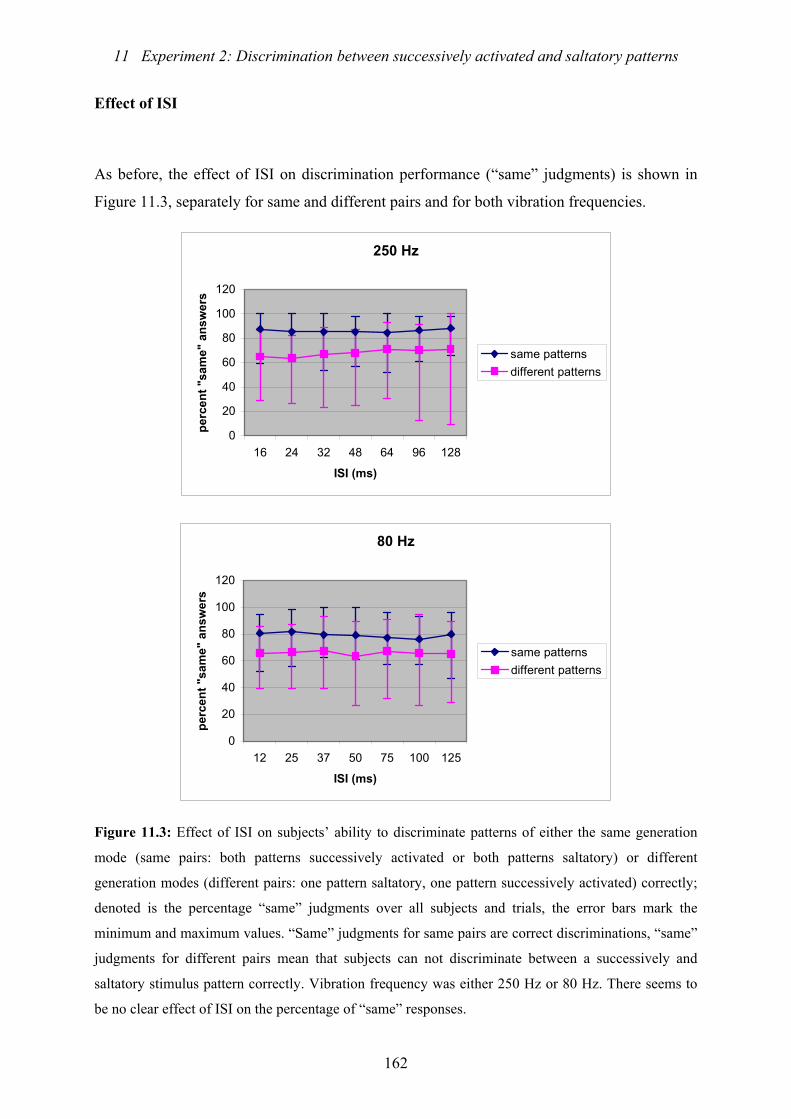
11 Experiment 2: Discrimination between successively activated and saltatory patterns
162
Effect of ISI
As before, the effect of ISI on discrimination performance (“same” judgments) is shown in
Figure 11.3, separately for same and different pairs and for both vibration frequencies.
250 Hz
0
20
40
60
80
100
120
16 24 32 48 64 96 128
ISI (ms)
perc
ent "
sam
e" a
nsw
ers
same patternsdifferent patterns
80 Hz
0
20
40
60
80
100
120
12 25 37 50 75 100 125
ISI (ms)
perc
ent "
sam
e" a
nsw
ers
same patternsdifferent patterns
Figure 11.3: Effect of ISI on subjects’ ability to discriminate patterns of either the same generation
mode (same pairs: both patterns successively activated or both patterns saltatory) or different
generation modes (different pairs: one pattern saltatory, one pattern successively activated) correctly;
denoted is the percentage “same” judgments over all subjects and trials, the error bars mark the
minimum and maximum values. “Same” judgments for same pairs are correct discriminations, “same”
judgments for different pairs mean that subjects can not discriminate between a successively and
saltatory stimulus pattern correctly. Vibration frequency was either 250 Hz or 80 Hz. There seems to
be no clear effect of ISI on the percentage of “same” responses.
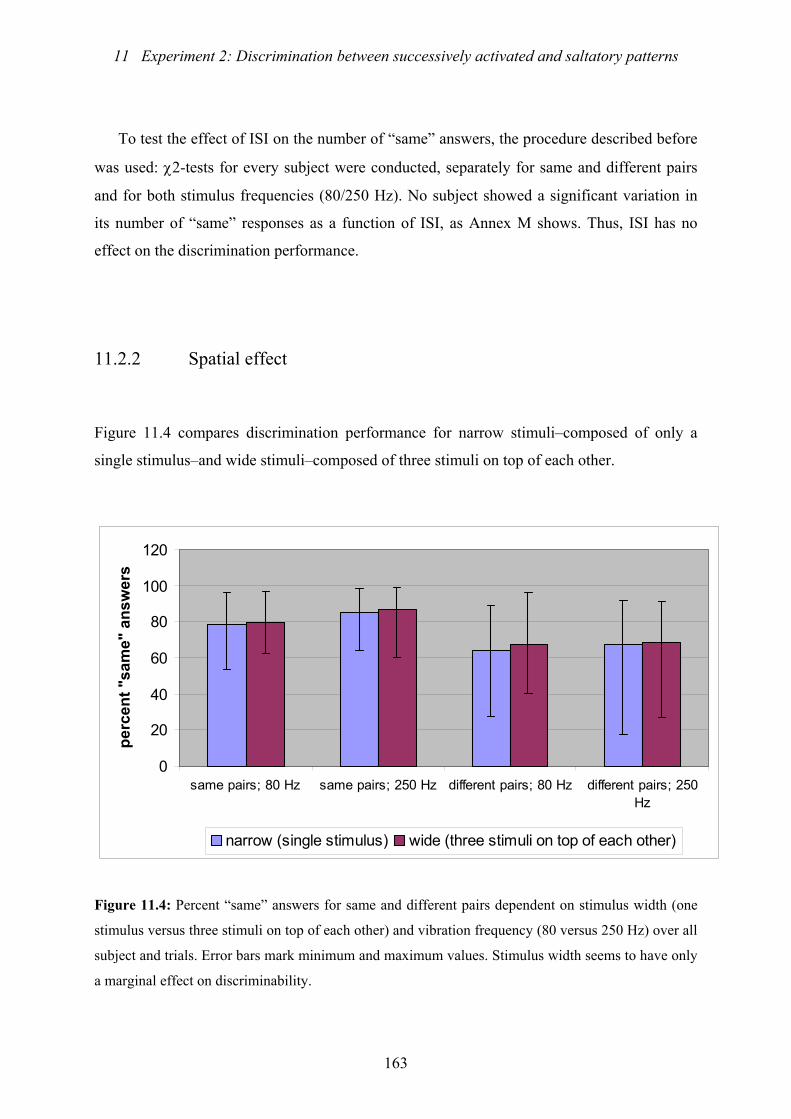
11 Experiment 2: Discrimination between successively activated and saltatory patterns
163
To test the effect of ISI on the number of “same” answers, the procedure described before
was used: χ2-tests for every subject were conducted, separately for same and different pairs
and for both stimulus frequencies (80/250 Hz). No subject showed a significant variation in
its number of “same” responses as a function of ISI, as Annex M shows. Thus, ISI has no
effect on the discrimination performance.
11.2.2 Spatial effect
Figure 11.4 compares discrimination performance for narrow stimuli–composed of only a
single stimulus–and wide stimuli–composed of three stimuli on top of each other.
0
20
40
60
80
100
120
same pairs; 80 Hz same pairs; 250 Hz different pairs; 80 Hz different pairs; 250Hz
perc
ent "
sam
e" a
nsw
ers
narrow (single stimulus) wide (three stimuli on top of each other)
Figure 11.4: Percent “same” answers for same and different pairs dependent on stimulus width (one
stimulus versus three stimuli on top of each other) and vibration frequency (80 versus 250 Hz) over all
subject and trials. Error bars mark minimum and maximum values. Stimulus width seems to have only
a marginal effect on discriminability.
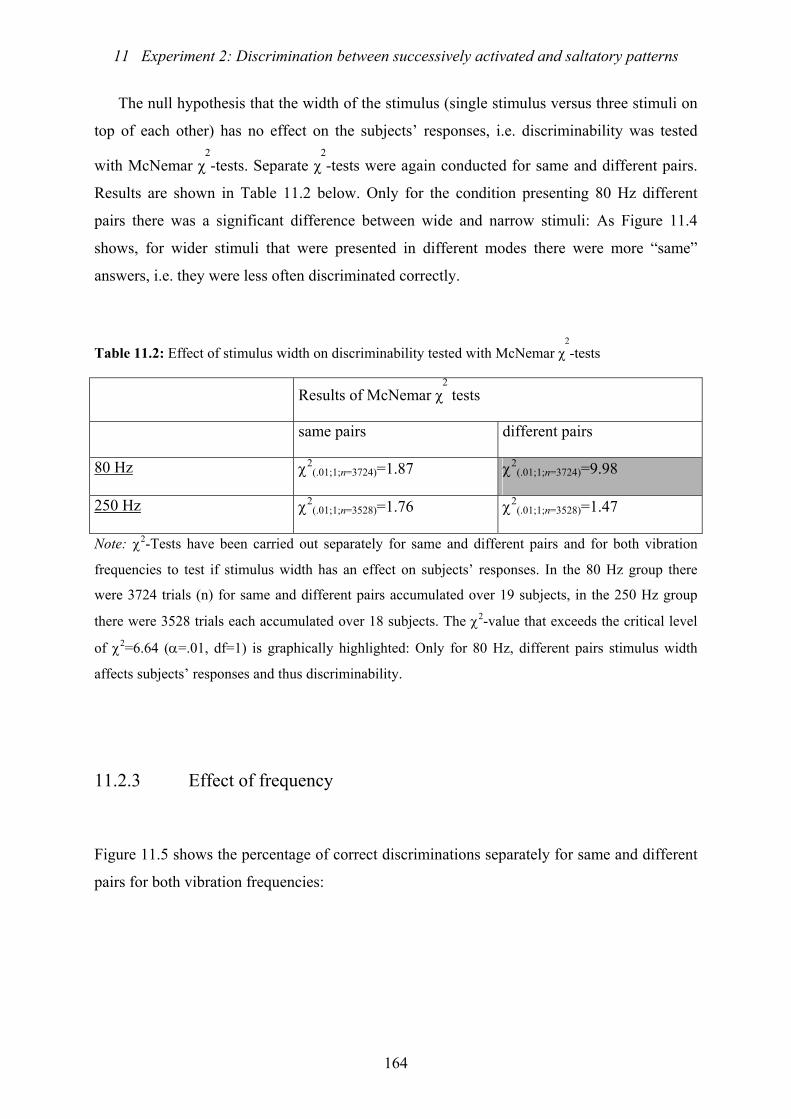
11 Experiment 2: Discrimination between successively activated and saltatory patterns
164
The null hypothesis that the width of the stimulus (single stimulus versus three stimuli on
top of each other) has no effect on the subjects’ responses, i.e. discriminability was tested
with McNemar χ2-tests. Separate χ
2-tests were again conducted for same and different pairs.
Results are shown in Table 11.2 below. Only for the condition presenting 80 Hz different
pairs there was a significant difference between wide and narrow stimuli: As Figure 11.4
shows, for wider stimuli that were presented in different modes there were more “same”
answers, i.e. they were less often discriminated correctly.
Table 11.2: Effect of stimulus width on discriminability tested with McNemar χ2-tests
Results of McNemar χ2 tests
same pairs different pairs
80 Hz χ2(.01;1;n=3724)=1.87 χ2
(.01;1;n=3724)=9.98
250 Hz χ2(.01;1;n=3528)=1.76 χ2
(.01;1;n=3528)=1.47
Note: χ2-Tests have been carried out separately for same and different pairs and for both vibration
frequencies to test if stimulus width has an effect on subjects’ responses. In the 80 Hz group there
were 3724 trials (n) for same and different pairs accumulated over 19 subjects, in the 250 Hz group
there were 3528 trials each accumulated over 18 subjects. The χ2-value that exceeds the critical level
of χ2=6.64 (α=.01, df=1) is graphically highlighted: Only for 80 Hz, different pairs stimulus width
affects subjects’ responses and thus discriminability.
11.2.3 Effect of frequency
Figure 11.5 shows the percentage of correct discriminations separately for same and different
pairs for both vibration frequencies:
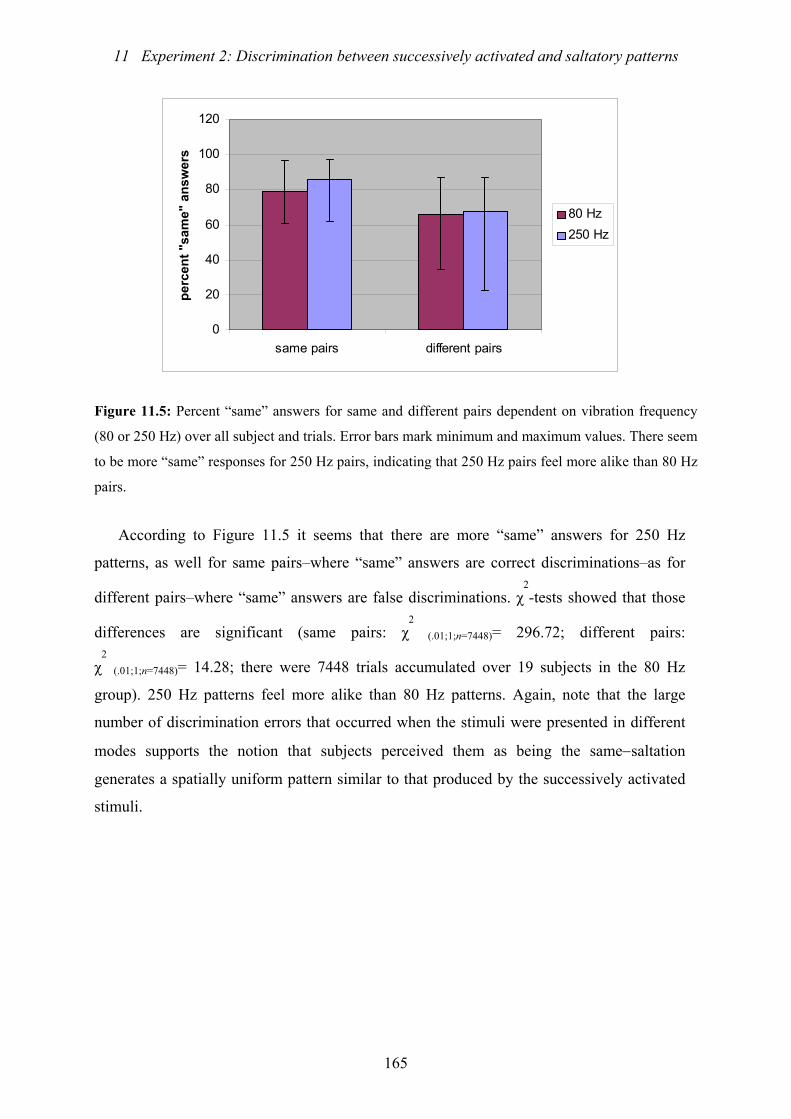
11 Experiment 2: Discrimination between successively activated and saltatory patterns
165
0
20
40
60
80
100
120
same pairs different pairs
perc
ent "
sam
e" a
nsw
ers
80 Hz250 Hz
Figure 11.5: Percent “same” answers for same and different pairs dependent on vibration frequency
(80 or 250 Hz) over all subject and trials. Error bars mark minimum and maximum values. There seem
to be more “same” responses for 250 Hz pairs, indicating that 250 Hz pairs feel more alike than 80 Hz
pairs.
According to Figure 11.5 it seems that there are more “same” answers for 250 Hz
patterns, as well for same pairs–where “same” answers are correct discriminations–as for
different pairs–where “same” answers are false discriminations. χ2-tests showed that those
differences are significant (same pairs: χ2
(.01;1;n=7448)= 296.72; different pairs:
χ2 (.01;1;n=7448)= 14.28; there were 7448 trials accumulated over 19 subjects in the 80 Hz
group). 250 Hz patterns feel more alike than 80 Hz patterns. Again, note that the large
number of discrimination errors that occurred when the stimuli were presented in different
modes supports the notion that subjects perceived them as being the same−saltation
generates a spatially uniform pattern similar to that produced by the successively activated
stimuli.
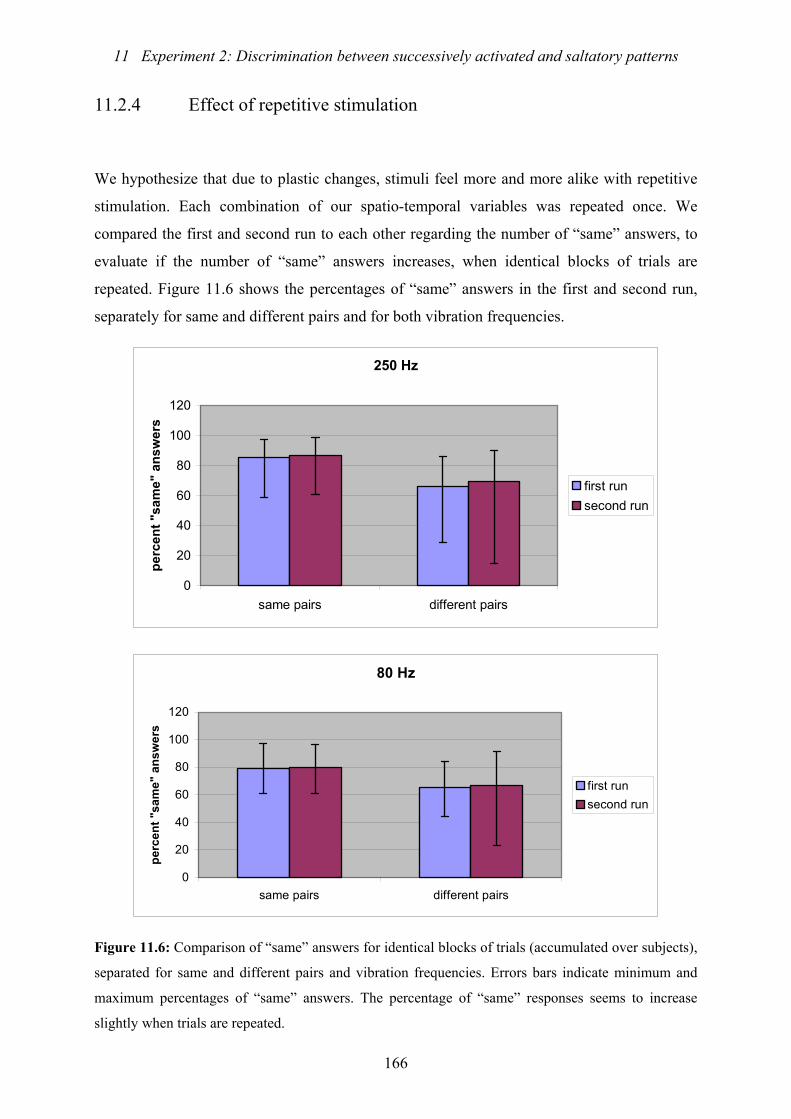
11 Experiment 2: Discrimination between successively activated and saltatory patterns
166
11.2.4 Effect of repetitive stimulation
We hypothesize that due to plastic changes, stimuli feel more and more alike with repetitive
stimulation. Each combination of our spatio-temporal variables was repeated once. We
compared the first and second run to each other regarding the number of “same” answers, to
evaluate if the number of “same” answers increases, when identical blocks of trials are
repeated. Figure 11.6 shows the percentages of “same” answers in the first and second run,
separately for same and different pairs and for both vibration frequencies.
250 Hz
0
20
40
60
80
100
120
same pairs different pairs
perc
ent "
sam
e" a
nsw
ers
first runsecond run
80 Hz
0
20
40
60
80
100
120
same pairs different pairs
perc
ent "
sam
e" a
nsw
ers
first runsecond run
Figure 11.6: Comparison of “same” answers for identical blocks of trials (accumulated over subjects),
separated for same and different pairs and vibration frequencies. Errors bars indicate minimum and
maximum percentages of “same” answers. The percentage of “same” responses seems to increase
slightly when trials are repeated.
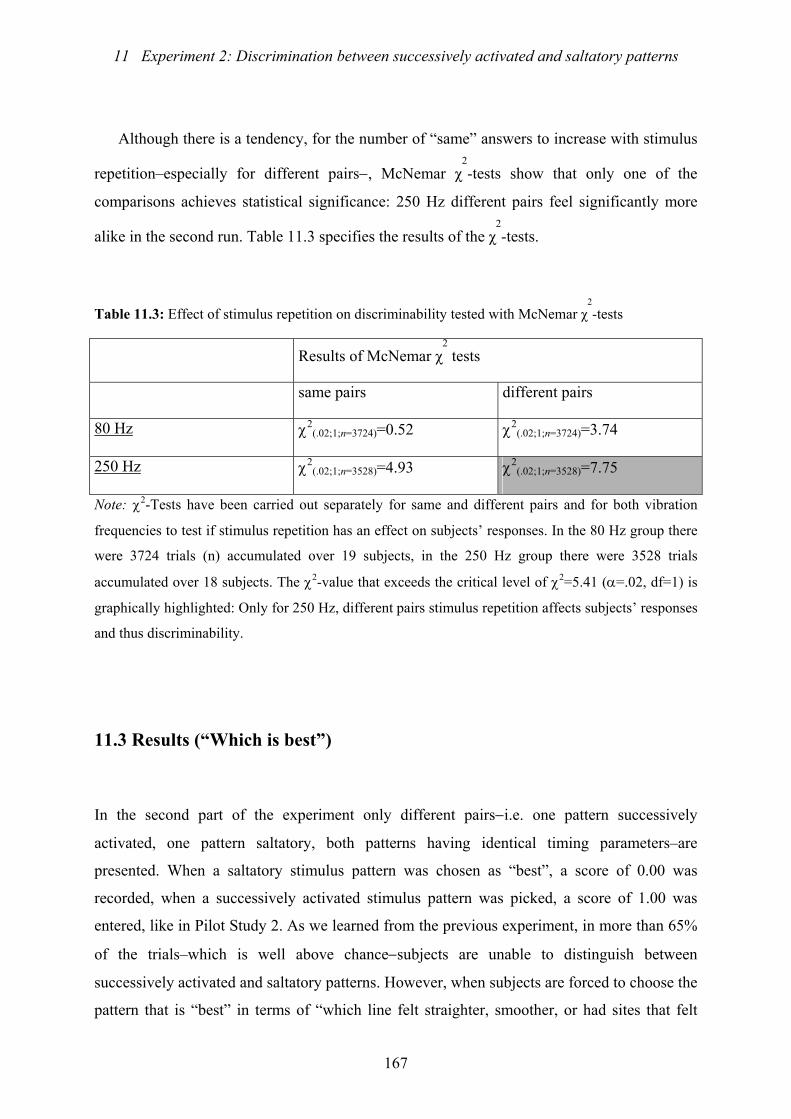
11 Experiment 2: Discrimination between successively activated and saltatory patterns
167
Although there is a tendency, for the number of “same” answers to increase with stimulus
repetition–especially for different pairs−, McNemar χ2-tests show that only one of the
comparisons achieves statistical significance: 250 Hz different pairs feel significantly more
alike in the second run. Table 11.3 specifies the results of the χ2-tests.
Table 11.3: Effect of stimulus repetition on discriminability tested with McNemar χ2-tests
Results of McNemar χ2 tests
same pairs different pairs
80 Hz χ2(.02;1;n=3724)=0.52 χ2
(.02;1;n=3724)=3.74
250 Hz χ2(.02;1;n=3528)=4.93 χ2
(.02;1;n=3528)=7.75
Note: χ2-Tests have been carried out separately for same and different pairs and for both vibration
frequencies to test if stimulus repetition has an effect on subjects’ responses. In the 80 Hz group there
were 3724 trials (n) accumulated over 19 subjects, in the 250 Hz group there were 3528 trials
accumulated over 18 subjects. The χ2-value that exceeds the critical level of χ2=5.41 (α=.02, df=1) is
graphically highlighted: Only for 250 Hz, different pairs stimulus repetition affects subjects’ responses
and thus discriminability.
11.3 Results (“Which is best”)
In the second part of the experiment only different pairs−i.e. one pattern successively
activated, one pattern saltatory, both patterns having identical timing parameters–are
presented. When a saltatory stimulus pattern was chosen as “best”, a score of 0.00 was
recorded, when a successively activated stimulus pattern was picked, a score of 1.00 was
entered, like in Pilot Study 2. As we learned from the previous experiment, in more than 65%
of the trials–which is well above chance−subjects are unable to distinguish between
successively activated and saltatory patterns. However, when subjects are forced to choose the
pattern that is “best” in terms of “which line felt straighter, smoother, or had sites that felt
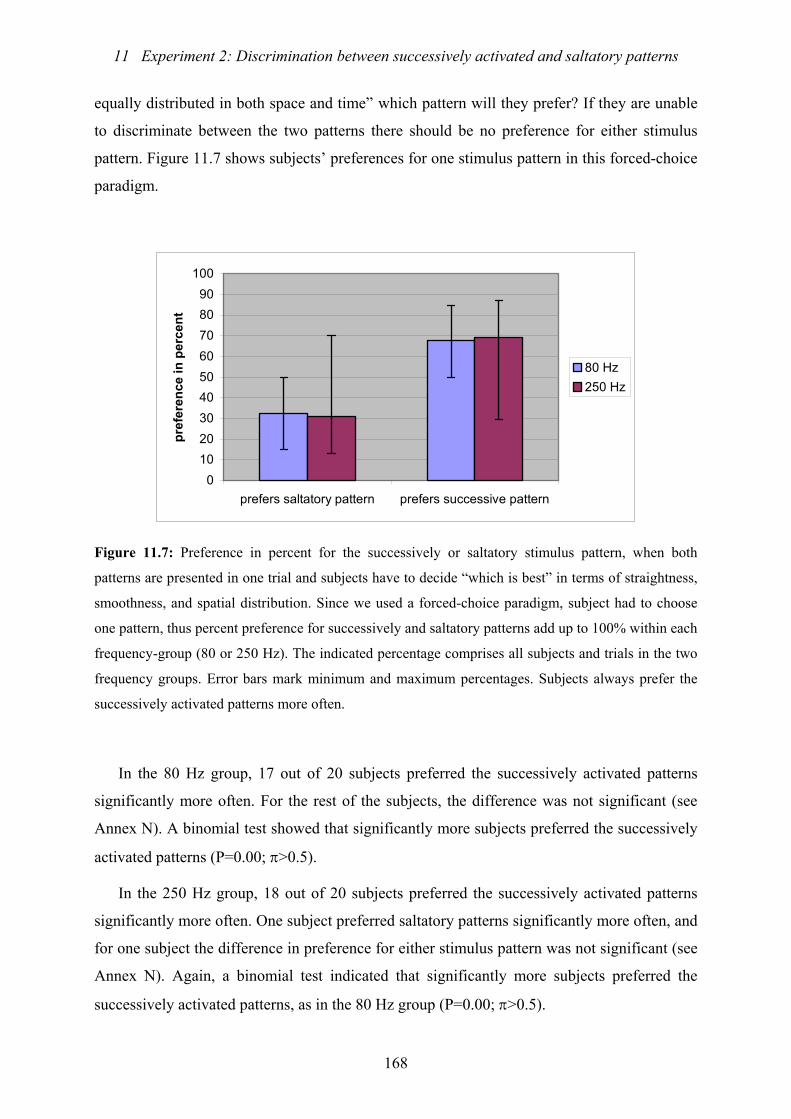
11 Experiment 2: Discrimination between successively activated and saltatory patterns
168
equally distributed in both space and time” which pattern will they prefer? If they are unable
to discriminate between the two patterns there should be no preference for either stimulus
pattern. Figure 11.7 shows subjects’ preferences for one stimulus pattern in this forced-choice
paradigm.
0102030405060708090
100
prefers saltatory pattern prefers successive pattern
pref
eren
ce in
per
cent
80 Hz250 Hz
Figure 11.7: Preference in percent for the successively or saltatory stimulus pattern, when both
patterns are presented in one trial and subjects have to decide “which is best” in terms of straightness,
smoothness, and spatial distribution. Since we used a forced-choice paradigm, subject had to choose
one pattern, thus percent preference for successively and saltatory patterns add up to 100% within each
frequency-group (80 or 250 Hz). The indicated percentage comprises all subjects and trials in the two
frequency groups. Error bars mark minimum and maximum percentages. Subjects always prefer the
successively activated patterns more often.
In the 80 Hz group, 17 out of 20 subjects preferred the successively activated patterns
significantly more often. For the rest of the subjects, the difference was not significant (see
Annex N). A binomial test showed that significantly more subjects preferred the successively
activated patterns (P=0.00; π>0.5).
In the 250 Hz group, 18 out of 20 subjects preferred the successively activated patterns
significantly more often. One subject preferred saltatory patterns significantly more often, and
for one subject the difference in preference for either stimulus pattern was not significant (see
Annex N). Again, a binomial test indicated that significantly more subjects preferred the
successively activated patterns, as in the 80 Hz group (P=0.00; π>0.5).
11 Experiment 2: Discrimination between successively activated and saltatory patterns
169
11.3.1 Temporal effects
Effect of SD
We expect that for longer SDs, the preference for successively activated stimulus patterns
should increase, while the preference for saltatory patterns should decline. The effect of SD
on subjects’ preference for one stimulus pattern is shown in Figure 11.8, separately for both
vibration frequencies. Data from tactile arrays containing one and three rows of tactors are
pooled. Shown is subjects’ preference for either the successively presented or saltatory
stimulus pattern.
250 Hz
020406080
100120
16 24 32 48 64 96 128
SD (ms)
pref
eren
ce in
per
cent
preference for successive pattern preference for saltatory pattern
80 Hz
020406080
100120
12 25 37 50 75 100 125
SD (ms)
pref
eren
ce in
per
cent
preference for successive pattern preference for saltatory pattern
Figure 11.8: Effect of SD on subjects’ preference for either successively activated or saltatory
stimulus patterns in a forced-choice paradigm, where subjects had to decide, which pattern was “best”.
Shown is the percentage of preference for one stimulus pattern over all subjects and trials; the error
bars mark the minimum and maximum values. Vibration frequency was either 250 Hz or 80 Hz. With
increasing SD the preference for saltatory patterns seems to decrease.
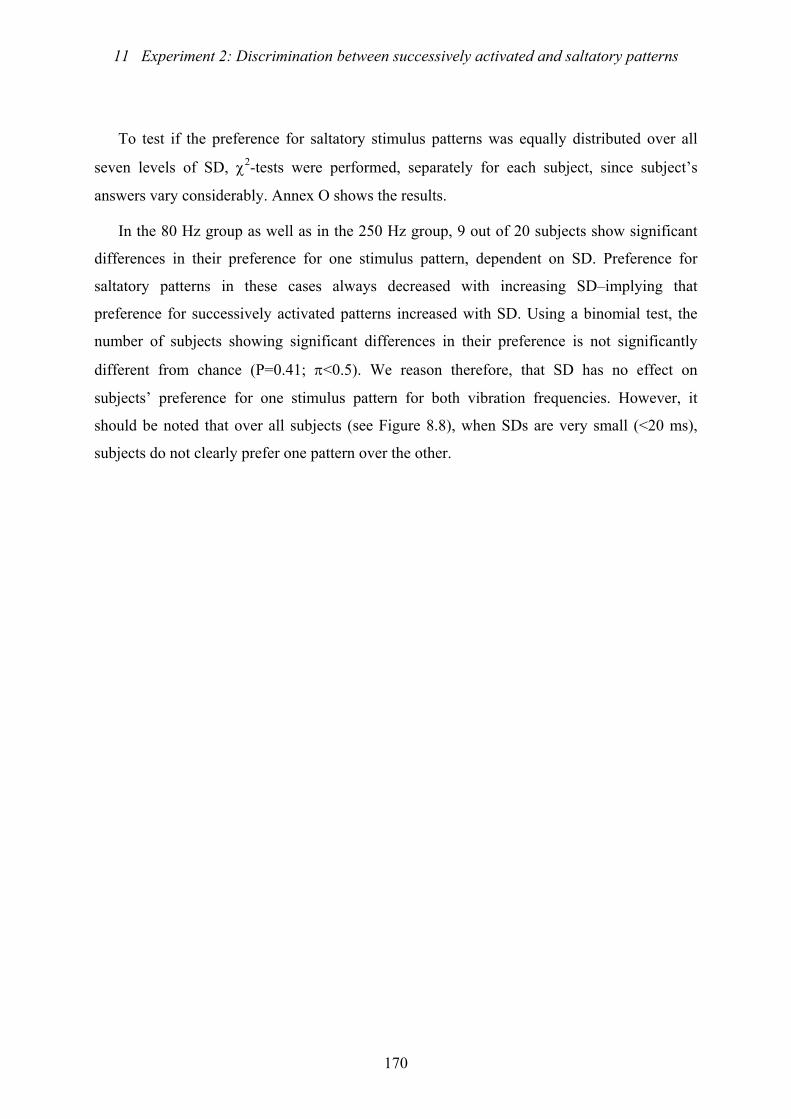
11 Experiment 2: Discrimination between successively activated and saltatory patterns
170
To test if the preference for saltatory stimulus patterns was equally distributed over all
seven levels of SD, χ2-tests were performed, separately for each subject, since subject’s
answers vary considerably. Annex O shows the results.
In the 80 Hz group as well as in the 250 Hz group, 9 out of 20 subjects show significant
differences in their preference for one stimulus pattern, dependent on SD. Preference for
saltatory patterns in these cases always decreased with increasing SD–implying that
preference for successively activated patterns increased with SD. Using a binomial test, the
number of subjects showing significant differences in their preference is not significantly
different from chance (P=0.41; π<0.5). We reason therefore, that SD has no effect on
subjects’ preference for one stimulus pattern for both vibration frequencies. However, it
should be noted that over all subjects (see Figure 8.8), when SDs are very small (<20 ms),
subjects do not clearly prefer one pattern over the other.
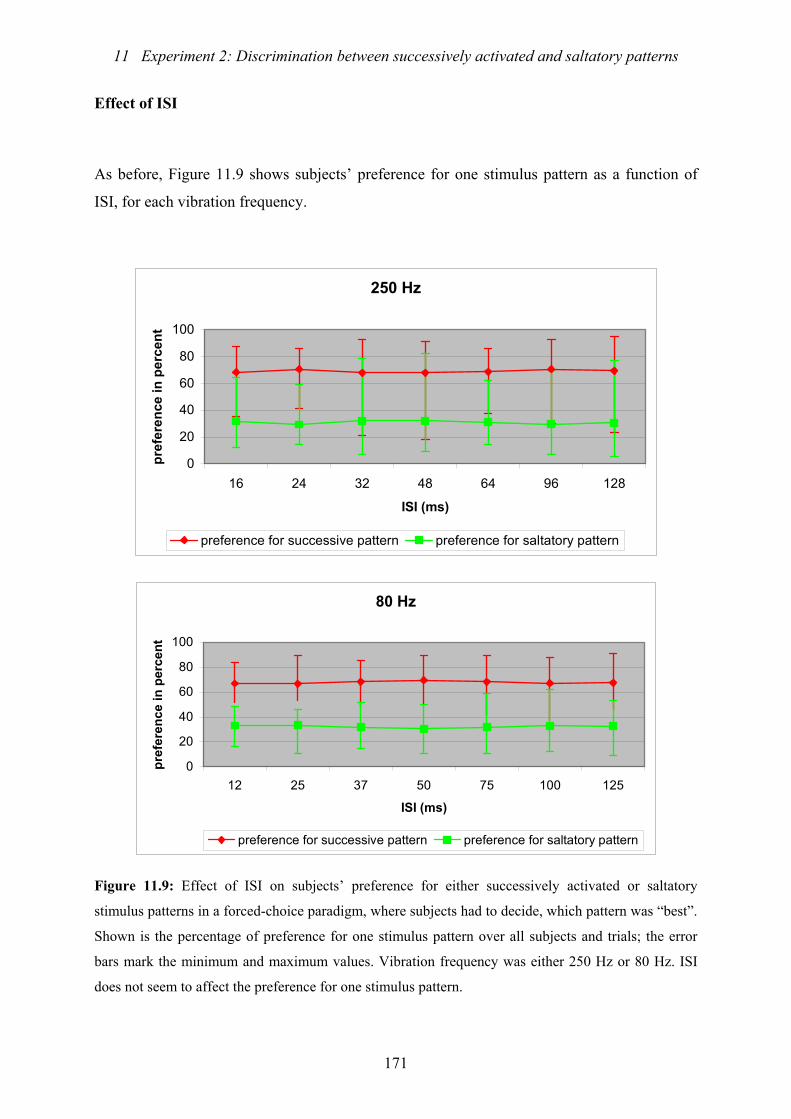
11 Experiment 2: Discrimination between successively activated and saltatory patterns
171
Effect of ISI
As before, Figure 11.9 shows subjects’ preference for one stimulus pattern as a function of
ISI, for each vibration frequency.
250 Hz
0
20
40
60
80
100
16 24 32 48 64 96 128
ISI (ms)
pref
eren
ce in
per
cent
preference for successive pattern preference for saltatory pattern
80 Hz
0
20
40
60
80
100
12 25 37 50 75 100 125
ISI (ms)
pref
eren
ce in
per
cent
preference for successive pattern preference for saltatory pattern
Figure 11.9: Effect of ISI on subjects’ preference for either successively activated or saltatory
stimulus patterns in a forced-choice paradigm, where subjects had to decide, which pattern was “best”.
Shown is the percentage of preference for one stimulus pattern over all subjects and trials; the error
bars mark the minimum and maximum values. Vibration frequency was either 250 Hz or 80 Hz. ISI
does not seem to affect the preference for one stimulus pattern.
11 Experiment 2: Discrimination between successively activated and saltatory patterns
172
Again, for each subject χ2-tests were performed, to test whether the preference for one
stimulus pattern is equally distributed over all seven levels of ISI (see Annex P).
In the 80 Hz group, no subject showed a variation of their preference for one stimulus
pattern as a function of ISI.
In the 250 Hz group, 2 out of 20 subjects show significant differences in their preference
for one stimulus pattern over the levels of ISI. In both cases, subjects prefer saltatory patterns
more often, as ISI decreases. However, a binomial test (P=0.00; π<0.5) proved, that the
number of subjects showing significant variations in their preferences is lower than chance.
We can conclude that ISI has no effect on subjects’ preference for one stimulus pattern for
both vibration frequencies.
11.3.2 Spatial effect
Figure 11.10 compares subjects’ preference for one stimulus pattern (saltatory or successive)
for narrow stimuli–composed of only a single stimulus–and wide stimuli–composed of three
stimuli in a column.
To test if the width of the stimulus (single stimulus versus three stimuli on top of each
other) has an effect on subjects’ preference for one stimulus pattern, McNemar χ2-tests
(α=.01, df=1) were performed for each frequency group (80 Hz versus 250 Hz group). In both
groups stimulus width had no significant influence on subjects’ preference (80 Hz:
χ2(.01;1;n=3920)=3.16; 250 Hz: . χ2
(.01;1;n=3920)=2.41; n is the number of trials accumulated over
subjects).
11 Experiment 2: Discrimination between successively activated and saltatory patterns
173
0102030405060708090
100
prefers saltation80 Hz
prefers saltation250 Hz
preferssuccessive 80
Hz
preferssucessive 250
Hz
pref
eren
ce in
per
cent
narrow (single stimulus) wide (three stimuli in a column)
Figure 11.10: Percent preference for one stimulus pattern (saltatory or successively activated)
dependent on stimulus width (one stimulus versus three stimuli in a column) and vibration frequency
(80 versus 250 Hz) over all subjects and trials. Error bars mark minimum and maximum values.
Stimulus width seems to have only a marginal effect on subjects’ preferences for one stimulus pattern.
11.3.3 Effect of frequency
Figure 11.7 showed that subjects preferred saltatory patterns a little more frequently in the 80
Hz group, compared to the 250 Hz group, where successively activated patterns are favored.
But, according to a χ2-test (χ2
(.01;1;n=7840)=5.71; there were 7840 trials accumulated over 20
subjects in the 250 Hz and in the 80 Hz group) this difference is not statistically significant.
11.3.4 Effect of repetitive stimulation
As we know from Figure 11.7 significantly more subjects preferred the successive over the
saltatory patterns. If the perceived difference between the two patterns diminishes due to
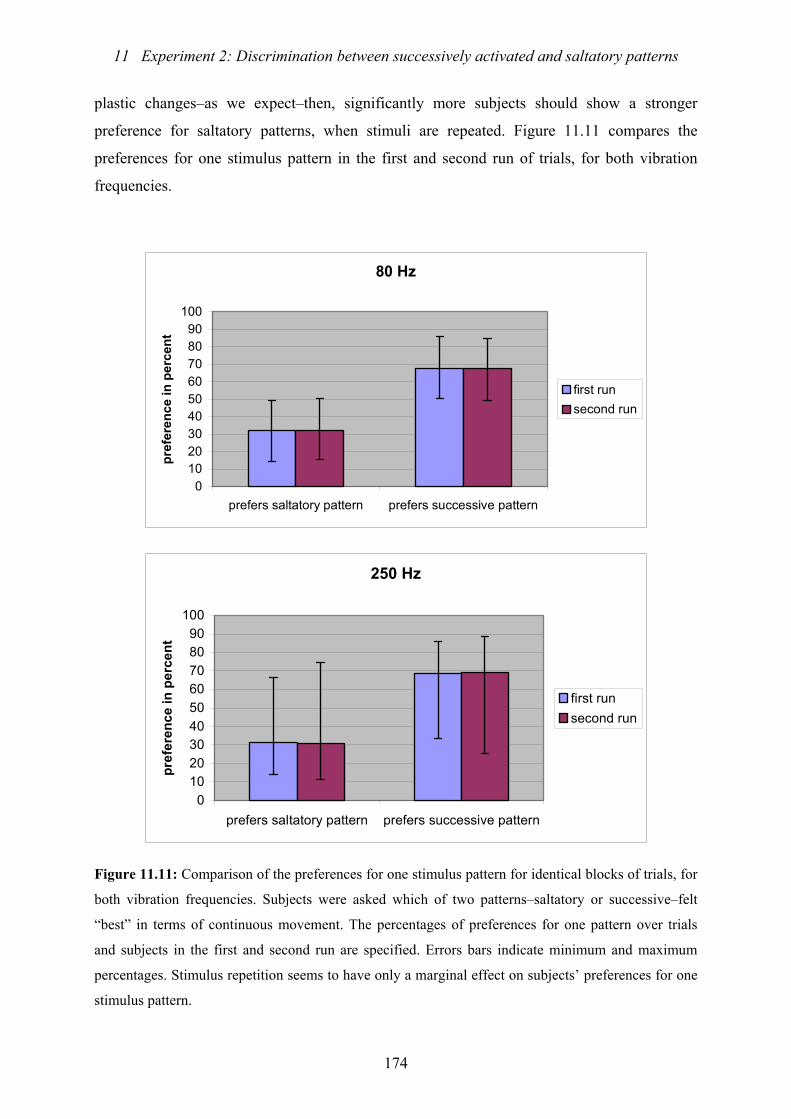
11 Experiment 2: Discrimination between successively activated and saltatory patterns
174
plastic changes–as we expect–then, significantly more subjects should show a stronger
preference for saltatory patterns, when stimuli are repeated. Figure 11.11 compares the
preferences for one stimulus pattern in the first and second run of trials, for both vibration
frequencies.
80 Hz
0102030405060708090
100
prefers saltatory pattern prefers successive pattern
pref
eren
ce in
per
cent
first runsecond run
250 Hz
0102030405060708090
100
prefers saltatory pattern prefers successive pattern
pref
eren
ce in
per
cent
first runsecond run
Figure 11.11: Comparison of the preferences for one stimulus pattern for identical blocks of trials, for
both vibration frequencies. Subjects were asked which of two patterns–saltatory or successive–felt
“best” in terms of continuous movement. The percentages of preferences for one pattern over trials
and subjects in the first and second run are specified. Errors bars indicate minimum and maximum
percentages. Stimulus repetition seems to have only a marginal effect on subjects’ preferences for one
stimulus pattern.
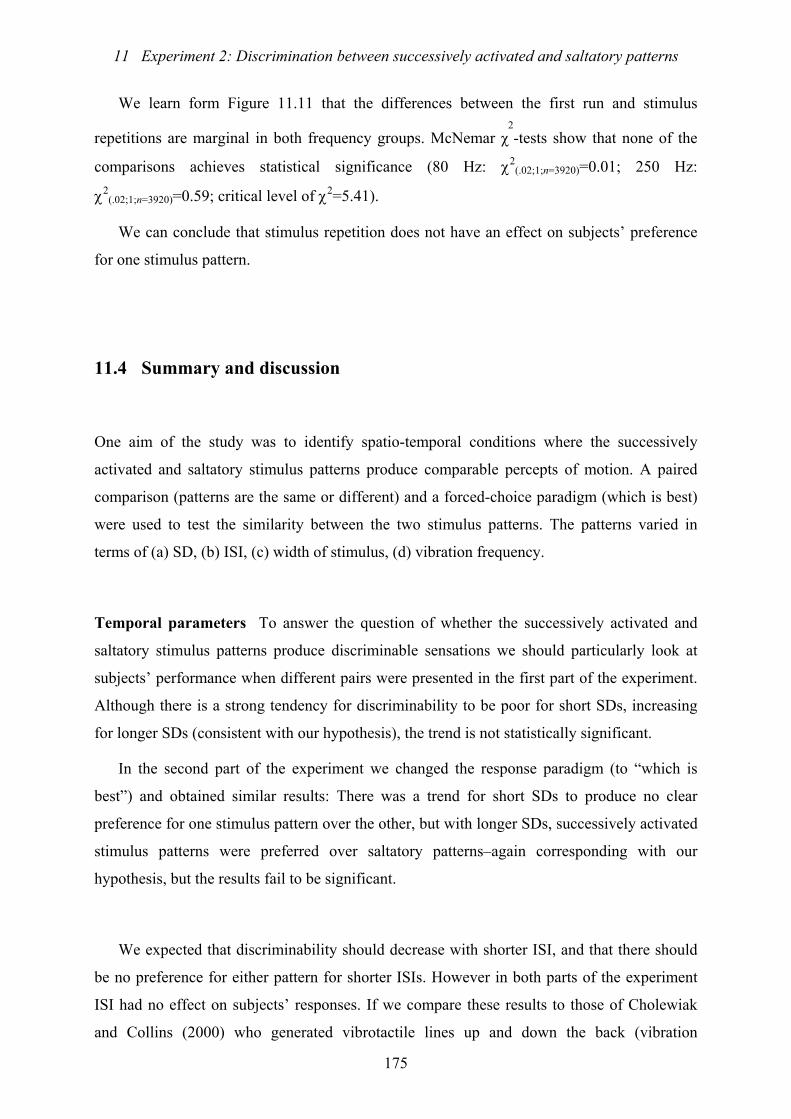
11 Experiment 2: Discrimination between successively activated and saltatory patterns
175
We learn form Figure 11.11 that the differences between the first run and stimulus
repetitions are marginal in both frequency groups. McNemar χ2-tests show that none of the
comparisons achieves statistical significance (80 Hz: χ2(.02;1;n=3920)=0.01; 250 Hz:
χ2(.02;1;n=3920)=0.59; critical level of χ2=5.41).
We can conclude that stimulus repetition does not have an effect on subjects’ preference
for one stimulus pattern.
11.4 Summary and discussion
One aim of the study was to identify spatio-temporal conditions where the successively
activated and saltatory stimulus patterns produce comparable percepts of motion. A paired
comparison (patterns are the same or different) and a forced-choice paradigm (which is best)
were used to test the similarity between the two stimulus patterns. The patterns varied in
terms of (a) SD, (b) ISI, (c) width of stimulus, (d) vibration frequency.
Temporal parameters To answer the question of whether the successively activated and
saltatory stimulus patterns produce discriminable sensations we should particularly look at
subjects’ performance when different pairs were presented in the first part of the experiment.
Although there is a strong tendency for discriminability to be poor for short SDs, increasing
for longer SDs (consistent with our hypothesis), the trend is not statistically significant.
In the second part of the experiment we changed the response paradigm (to “which is
best”) and obtained similar results: There was a trend for short SDs to produce no clear
preference for one stimulus pattern over the other, but with longer SDs, successively activated
stimulus patterns were preferred over saltatory patterns–again corresponding with our
hypothesis, but the results fail to be significant.
We expected that discriminability should decrease with shorter ISI, and that there should
be no preference for either pattern for shorter ISIs. However in both parts of the experiment
ISI had no effect on subjects’ responses. If we compare these results to those of Cholewiak
and Collins (2000) who generated vibrotactile lines up and down the back (vibration
11 Experiment 2: Discrimination between successively activated and saltatory patterns
176
frequency: 230 Hz), using the same experimental procedure, we find some analogies. They
also found that subjects predominately answered “patterns are the same”. When same pairs
were presented, 82% of the answers were correct (in our study: 86% (at 250 Hz) and 79% (at
80 Hz)). When successively activated and saltatory lines (different stimuli) were paired, 37%
of the answers were correct (in our study: 32% (250 Hz) and 34% (80 Hz)). Cholewiak and
Collins (2000) noted a significant main effect of ISI on accuracy in that discriminability was
better for shorter ISIs; we found no such effect.
These results are contrary to other studies: Eimer et al. (2005) using tactile stimuli, Philips
et al. (2002), Boehnke and Philips (2005) using auditory stimuli, showed that subjects are
unable to distinguish saltation and continuous motion at short ISIs. In line with these findings
are the experiments of van Erp (2007): Localization of successively presented stimuli
(indicating if the second stimulus is located left or right from the first) also decreases when
ISOI and SD decrease−whereas the effect of SD is less distinct. Since the temporal parameters
for good localization performance are in the range where apparent motion can be observed,
van Erp argue that subjects used motion cues in this localization task.
We found at least a trend that SD affects discriminability which was not reported by
Cholewiak and Collins (2000).
For the occurrence of the saltatory illusion the interstimulus interval is crucial according
to Geldard (1975, 1982) and Geldard and Sherrick (1986)−because the amount of
mislocalization depends linearly on ISI between S2-S3 (reduced rabbit ). But in order to
discriminate veridical from saltatory patterns, we find that stimulus duration is the more
important factor. To produce comparable percepts of tactile apparent motion, short SDs are
needed.
Stimulus width We hypothesized that there would be no effect of stimulus width on
discriminability or on the preference for one stimulus pattern over the other. This was
supported with one exception: For 80 Hz different pairs there were more “same” answers for
wider stimuli, i.e. they were less often discriminated correctly. Obviously, in this case, a
wider stimulated skin area allows single stimuli to meld together more easily.
Vibration frequency We didn’t expect that vibration frequency would affect
discriminability or preference for one stimulus pattern. In the first part of the experiment
11 Experiment 2: Discrimination between successively activated and saltatory patterns
177
(same-different) we found that 250 Hz patterns felt significantly more alike than 80 Hz
patterns, whereas in the second part of the experiment (which is best) vibration frequency had
no effect on subjects’ responses.
The first result is somewhat surprising, since saltation and apparent movement are known
to be largely uninfluenced by vibration frequency (refer to the Chapter 3). A possible
explanation could be that we used a different experimental paradigm, one that requires pattern
discrimination (“same-different” judgments). Although the existence of saltation and apparent
movement per se might not be affected by vibration frequency, the resolution of fine spatial
details in these percepts of movement might well be (compare also the results of Experiment
1: 80 Hz stimuli appear to be less straight, less smooth, slightly more equally distributed in
space and longer in perceived physical length than 250 Hz stimuli).
Thus it seems worthwhile to review how vibration frequency influences spatial acuity.
The two standard measures of tactile acuity, two-point threshold and localization error, are
not affected by frequency (Cholewiak, Collins & Brill, 2001; Greenspan & Bolanowski,
1996; Vierck & Jones, 1970)7, but these measure are not sufficient to study spatial resolution
(Johnson, van Boven & Hsaio, 1994). Recently, a study by Bensmaia, Craig, and Johnson
(2006) showed that the ability of detecting gaps in a grating decreased with increasing
vibration frequency over the range of 5-80 Hz.
Physiologically, mechanoreceptive afferent fibres convey spatial information to a varying
extent: PC and SAII afferents are not able to resolve spatial detail, and note that PCs are the
structures most sensitive to 250 Hz stimuli. Predominantly RA (FAI) and SAI afferents in
glabrous skin provide information about the spatial structure of a stimulus, whereat SAI
afferents are more effective than RA afferents in this connection, especially at low vibration
frequencies (Bensmaia et al., 2006; Johnson & Hsiao, 1992; Johnson & Lamb, 1981). In hairy
skin, we do not find FAI type fibres, here, hair follicle afferent fibres (having larger receptive
fields than type I units) respond to vibration stimuli up to 80 Hz. At higher frequencies
vibrotactile sensitivity depends on PC receptors which are located deep to the hairy skin.
Because of the distance, the vibratory signal has to travel until it reaches the hairy skin PC
receptor, its strength (and maybe also irregularities or gaps in the stimulus pattern) is
attenuated, hence vibratory thresholds are higher on hairy than on glabrous skin (Mahns et al.,
2006; one can also see the difference in Figure 7.4, page 83, of this Dissertation). It is
7 One exception is mentioned by Sherrick, Cholewiak and Collins (1990): They found a better localization performance for low-frequency vibratory stimuli (25 Hz) compared to high-frequency stimuli (250 Hz), but only at a proximal locus on the palm of the hand. This effect disappeared, when a more distal locus was stimulated, indicating that receptor density and its gradient across the skin might contribute to the results obtained.
11 Experiment 2: Discrimination between successively activated and saltatory patterns
178
possible that the perception of spatial details in tactile patterns is degraded at higher
frequencies, which would explain why discriminability decreases with vibration frequency
and we obtain more “same” answers in the same/different experiment for 250 Hz patterns
than for 80 Hz patterns.
Repetitive stimulation Applying spatio-temporal stimulus patterns with ISIs smaller than
130 ms, should lead to an integration of the single stimulus points and their representational
distances in somatosensory cortex should be reduced (Wiemer et al., 1998, 2000; see Chapters
1 and 2). In our experiments no feedback was given, so we didn’t expect that a learning
process took place, which would presumably have increased discrimination performance over
the time course of the experiment. Instead, we expected that in agreement with Wiemer’s
theory, the integration of stimulus patterns consisting of stimuli following close together in
time would be enhanced with stimulus repetition and discrimination performance would
decrease as the patterns begin to feel more and more alike. Additionally, if one stimulus
pattern is preferred over the other, this preferential treatment should be diminished with
stimulus repetition.
In our studies, although there was a tendency that the number of “same” answers
increased with stimulus repetition in the first part of the experiment (“same/different”
judgments), this trend was only statistically significant for 250 Hz different pairs. In the
second part of the experiment (which is best), stimulus repetition had no effect on subjects’
responses. It is likely that only one repetition of the whole set of spatio-temporal stimulus
parameters was insufficient to cause plastic changes.
12 Experiment 3: Different stimulus onset locations
179
12 Experiment 3: Different stimulus onset locations and their
effects on tactile movement crossing the body midline
When Geldard (1982; Geldard & Sherrick, 1983, 1986) explored the spatial limits of saltation
(which he called saltatory areas) he found that the saltatory illusion never crossed the body
midline. In some of these experiments he placed two stimulators on opposite sides on the
forehead. When he varied the time interval between those two tactors as well as the distance
between them (11 cm–1 cm), saltatory jumping was never reported. In contrast, apparent
movement could often be experienced–especially at interstimulus intervals of about 100 ms
(Geldard, 1982). A repetition of this experiment on the torso also showed that the saltatory area
was truncated at the body-midline. Geldard reasoned that different neural mechanisms form the
basis for the two tactile illusions (apparent movement versus saltation). In another experiment he
compared synthetic motion (comparable to the successive activation in our experiments) with
saltation. Here he placed six equidistant contactors along the left forearm that were each
stimulated once in sequence while on the right forearm he placed three contactors covering the
same distance, each being activated twice. The total duration of stimulation was identical for
both arms, and six pulses were presented in both cases. At ISIs between 50 and 100 ms “the
observed patterns were identical, a more or less continuous sweep punctuated by six evenly
spaced taps… the two [stimulus patterns] were distinguished only by the observation that the
former [saltatory pattern] had slightly weaker, less “bright” taps,…” (Geldard, 1982; pp. 139).
These results, taken as a whole, show that both tactual illusions: Tactual phi or apparent
movement and saltation can appear concurrently during unilateral stimulation. When stimulation
crosses the body midline (which we call subsequently bilateral presentation in comparison to
unilateral presentation, i.e. stimuli are presented on one body-half only), only phi-movement
occurs and saltation is not observed.
The latter observation is supported by Wiemer et al. (2000): They offer a model for the
processing of stimuli in somatosensory cortex that includes stimulus dynamics, i.e. the temporal
course of stimuli. They presume that interstimulus intervals are transformed into representational
distances in the cortical map. The perception of a mislocalized stimulus that occurs during
12 Experiment 3: Different stimulus onset locations
180
saltation is due to time-dependent shifts of cortical responses. Because these shifts of neural
activation should only happen between adjacent areas (and therefore within one hemisphere), the
saltatory illusion should not cross the body midline.
Based on these findings, we could hypothesize that conformity between the percepts of
saltatory movement and apparent movement produced by sequential activation should be better
when movement travels on one side of the torso rather than when movement travels across the
front or back of the torso. In the latter case the saltatory illusion would be expected to break
down when it crosses the body midline. But in contrast to Geldard's experiments we did not use
just two tactors, but a linear array of seven tactors. We assume that once we produce the illusion
of saltatory movement on a linear array, then movement shouldn’t stop at the body-midline,
assuming that the cortex integrates perceptions from the two body-sites into an integral whole.
When subjects have to discriminate between saltatory and successively activated stimulus
patterns they should reach similar results when the illusory movement travels the body-midline
and when it travels on one body site only.
This presumption is supported by the work of Stolle (2003). In her integrative model of
spatiotemporal illusions, she assumes that tactile illusions like saltation, apparent movement, and
the Békésy phantom (Békésy, 1967) are due to neural mechanisms in primary somatosensory
cortex (SI). Processing of tactile stimuli is thereby influenced by higher cortical levels like SII–
where a bilateral representation of the body exists−facilitating the integration of tactile stimuli
presented at both body sites. Accordingly she presumes that the saltatory illusion might also
occur when the stimuli cross the body midline, but the temporal conditions might differ
considerably between unilateral and bilateral stimulation.
12.1 Method
Subjects There were two conditions in this study: One in which the stimulus sites in the middle
of the array were located on either side of the body midline and thus “span the navel”, the other
in which one of the tactors in the middle of the linear array is actually sited on the body-midline,
so we called this condition “with navel”. Twenty-one subjects participated in the span the navel
12 Experiment 3: Different stimulus onset locations
181
experimental condition (17 males, four females). The age of the subjects varied between 21 and
30 (M=23.5). Most of the subjects were right hander (18 subjects), only three of them were left
hander. In the second–with navel –condition, 20 subjects participated (19 males, one female).
These subjects’ ages ranged between 21 and 25 (M=22.5). Eighteen subjects were right handed,
two were left handed.
Procedure Vibrotactile movement was produced with the apparatus and stimuli described in the
General Method section, although in this experiment only 250 Hz stimuli were used. The
experimental procedure was similar to that of Experiment 2 (same/different comparison): Again
the paired-comparison paradigm was employed to let subjects discriminate between the saltatory
patterns and successive activation. The temporal stimulus parameters were also identical to those
used in Experiment 2. How the same and different stimulus pairs were generated can be seen in
the method section of Experiment 2 (Chapter 11.1).
The tactile array in all of the conditions in this study consisted of a line of 7 tactors. Their
arrangement in the span navel and with navel conditions and placements on the body were as
follows:
In the span navel conditions the tactile array covered only the front of the torso. The tactors
were placed on the belt so that the navel lay in-between two tactors: Either between tactors three
and four or tactors four and five in the line of seven. With this arrangement we can also test if the
number of activated tactor sites (three or four) before the movement crosses the body midline has
an effect on discriminability. These arrangements are pictured below in Figure 12.1:
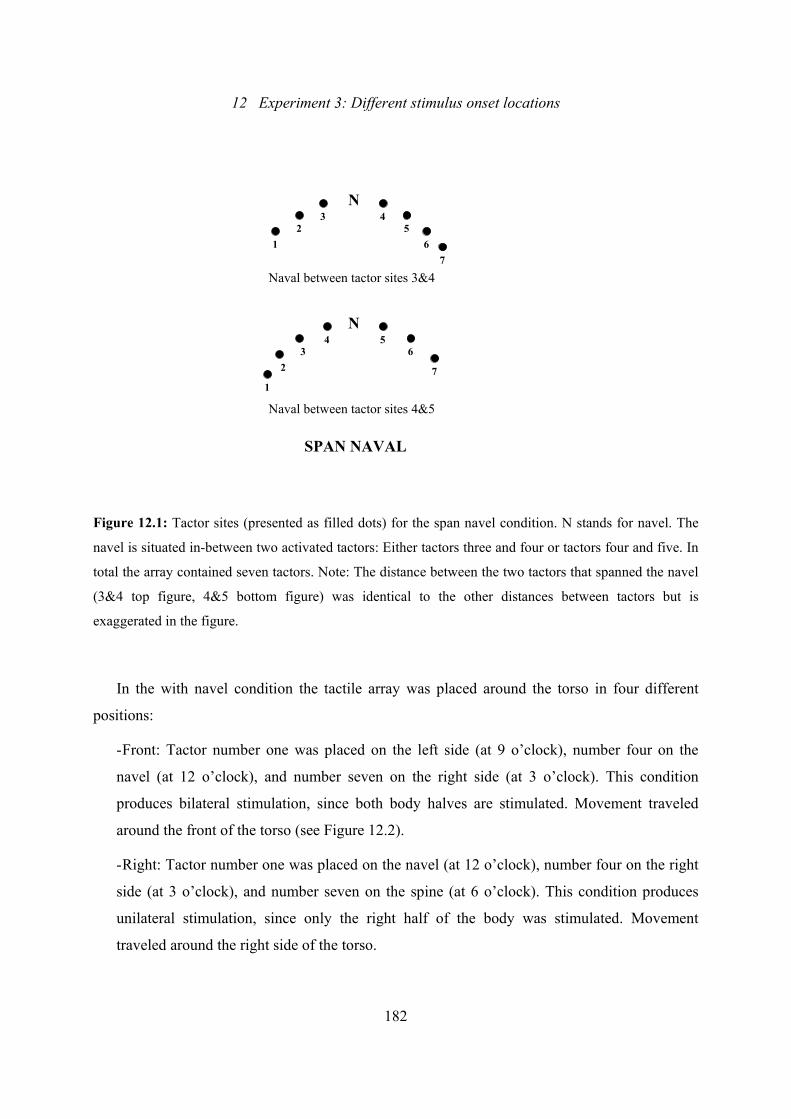
12 Experiment 3: Different stimulus onset locations
182
N
N
12
3 45
67
1
32
4 56
7
SPAN NAVAL
Naval between tactor sites 4&5
Naval between tactor sites 3&4
Figure 12.1: Tactor sites (presented as filled dots) for the span navel condition. N stands for navel. The
navel is situated in-between two activated tactors: Either tactors three and four or tactors four and five. In
total the array contained seven tactors. Note: The distance between the two tactors that spanned the navel
(3&4 top figure, 4&5 bottom figure) was identical to the other distances between tactors but is
exaggerated in the figure.
In the with navel condition the tactile array was placed around the torso in four different
positions:
- Front: Tactor number one was placed on the left side (at 9 o’clock), number four on the
navel (at 12 o’clock), and number seven on the right side (at 3 o’clock). This condition
produces bilateral stimulation, since both body halves are stimulated. Movement traveled
around the front of the torso (see Figure 12.2).
- Right: Tactor number one was placed on the navel (at 12 o’clock), number four on the right
side (at 3 o’clock), and number seven on the spine (at 6 o’clock). This condition produces
unilateral stimulation, since only the right half of the body was stimulated. Movement
traveled around the right side of the torso.
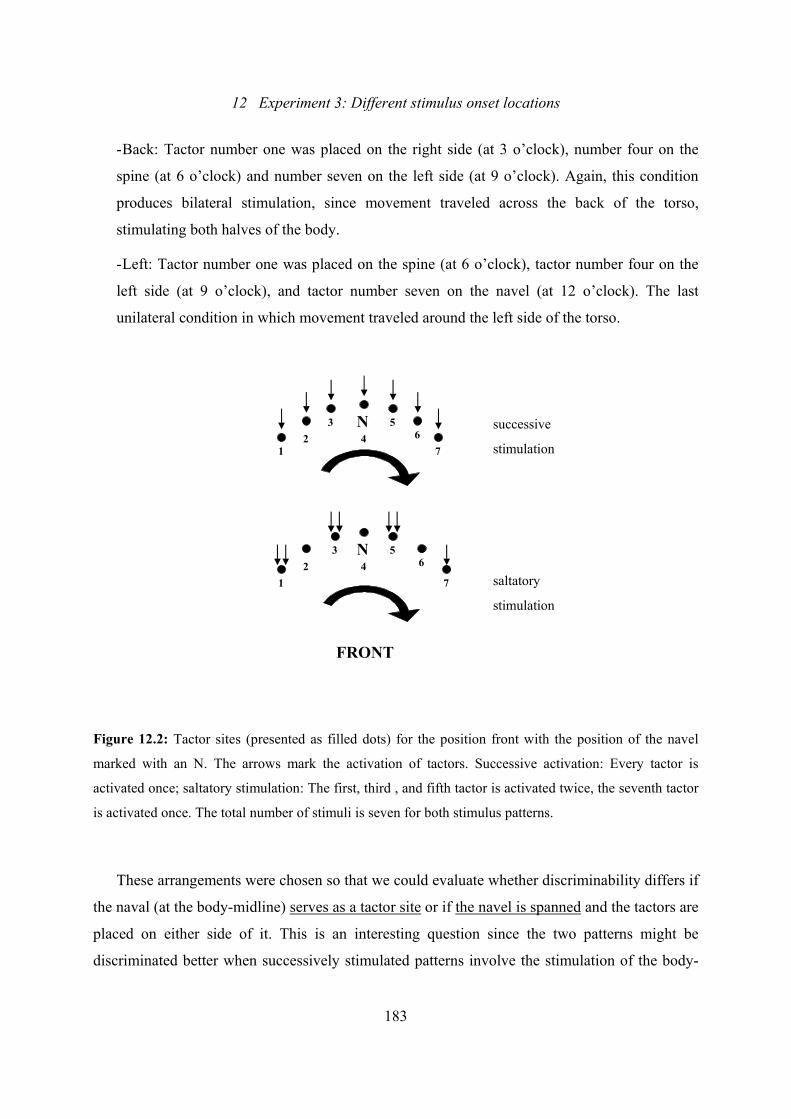
12 Experiment 3: Different stimulus onset locations
183
- Back: Tactor number one was placed on the right side (at 3 o’clock), number four on the
spine (at 6 o’clock) and number seven on the left side (at 9 o’clock). Again, this condition
produces bilateral stimulation, since movement traveled across the back of the torso,
stimulating both halves of the body.
- Left: Tactor number one was placed on the spine (at 6 o’clock), tactor number four on the
left side (at 9 o’clock), and tactor number seven on the navel (at 12 o’clock). The last
unilateral condition in which movement traveled around the left side of the torso.
N successive
stimulation
saltatory
stimulation
N
12
34
56
7
1
32 4
56
7
FRONT
Figure 12.2: Tactor sites (presented as filled dots) for the position front with the position of the navel
marked with an N. The arrows mark the activation of tactors. Successive activation: Every tactor is
activated once; saltatory stimulation: The first, third , and fifth tactor is activated twice, the seventh tactor
is activated once. The total number of stimuli is seven for both stimulus patterns.
These arrangements were chosen so that we could evaluate whether discriminability differs if
the naval (at the body-midline) serves as a tactor site or if the navel is spanned and the tactors are
placed on either side of it. This is an interesting question since the two patterns might be
discriminated better when successively stimulated patterns involve the stimulation of the body-
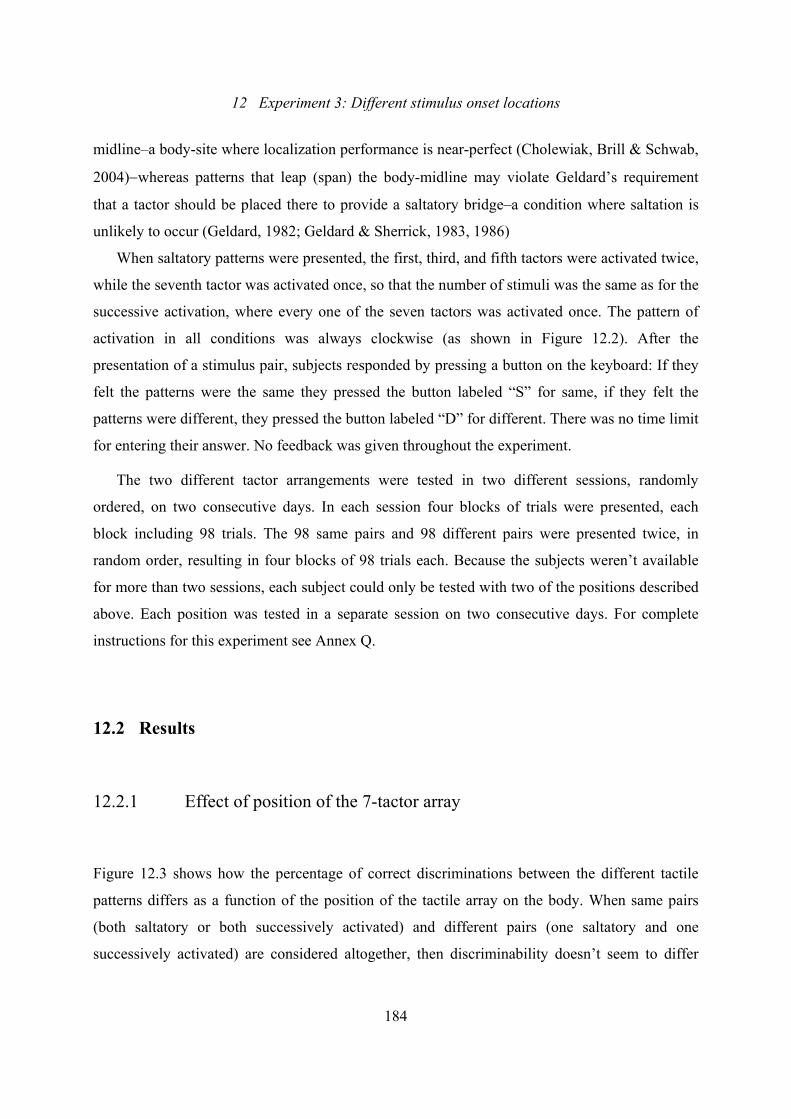
12 Experiment 3: Different stimulus onset locations
184
midline–a body-site where localization performance is near-perfect (Cholewiak, Brill & Schwab,
2004)−whereas patterns that leap (span) the body-midline may violate Geldard’s requirement
that a tactor should be placed there to provide a saltatory bridge–a condition where saltation is
unlikely to occur (Geldard, 1982; Geldard & Sherrick, 1983, 1986)
When saltatory patterns were presented, the first, third, and fifth tactors were activated twice,
while the seventh tactor was activated once, so that the number of stimuli was the same as for the
successive activation, where every one of the seven tactors was activated once. The pattern of
activation in all conditions was always clockwise (as shown in Figure 12.2). After the
presentation of a stimulus pair, subjects responded by pressing a button on the keyboard: If they
felt the patterns were the same they pressed the button labeled “S” for same, if they felt the
patterns were different, they pressed the button labeled “D” for different. There was no time limit
for entering their answer. No feedback was given throughout the experiment.
The two different tactor arrangements were tested in two different sessions, randomly
ordered, on two consecutive days. In each session four blocks of trials were presented, each
block including 98 trials. The 98 same pairs and 98 different pairs were presented twice, in
random order, resulting in four blocks of 98 trials each. Because the subjects weren’t available
for more than two sessions, each subject could only be tested with two of the positions described
above. Each position was tested in a separate session on two consecutive days. For complete
instructions for this experiment see Annex Q.
12.2 Results
12.2.1 Effect of position of the 7-tactor array
Figure 12.3 shows how the percentage of correct discriminations between the different tactile
patterns differs as a function of the position of the tactile array on the body. When same pairs
(both saltatory or both successively activated) and different pairs (one saltatory and one
successively activated) are considered altogether, then discriminability doesn’t seem to differ
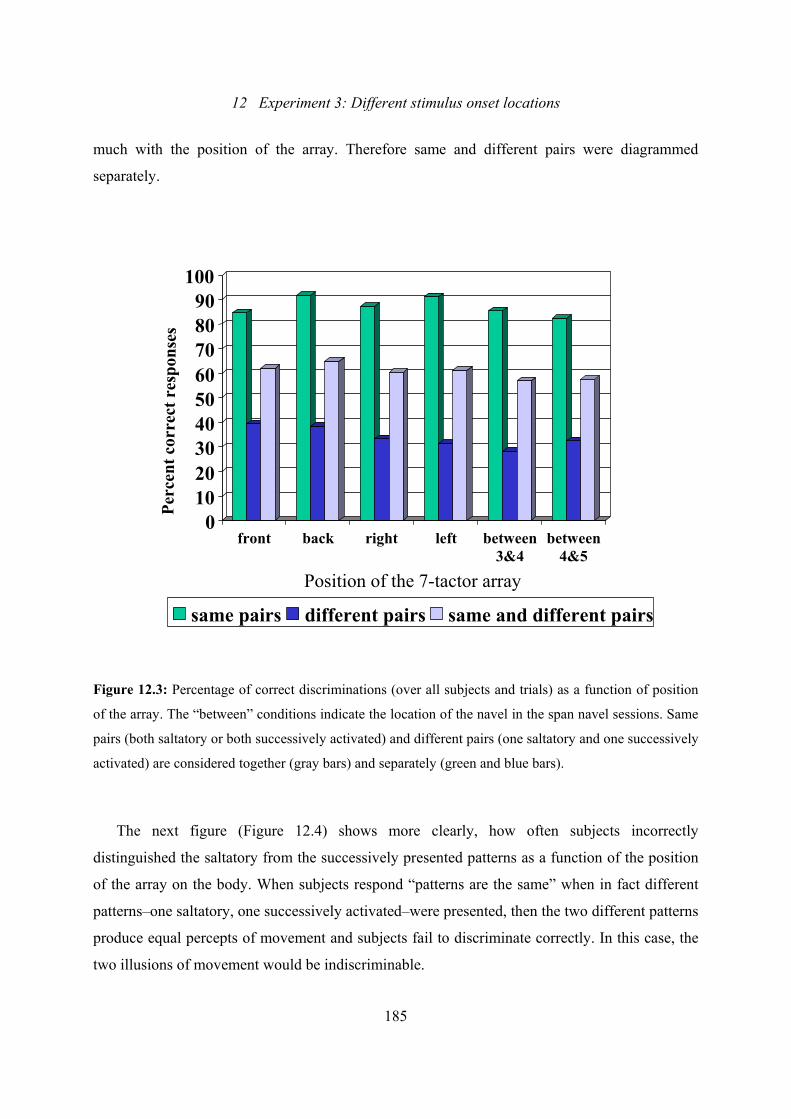
12 Experiment 3: Different stimulus onset locations
185
much with the position of the array. Therefore same and different pairs were diagrammed
separately.
0102030405060708090
100
front back right left between3&4
between4&5
same pairs different pairs same and different pairs
Perc
ent c
orre
c t r
espo
nses
Position of the 7-tactor array
Figure 12.3: Percentage of correct discriminations (over all subjects and trials) as a function of position
of the array. The “between” conditions indicate the location of the navel in the span navel sessions. Same
pairs (both saltatory or both successively activated) and different pairs (one saltatory and one successively
activated) are considered together (gray bars) and separately (green and blue bars).
The next figure (Figure 12.4) shows more clearly, how often subjects incorrectly
distinguished the saltatory from the successively presented patterns as a function of the position
of the array on the body. When subjects respond “patterns are the same” when in fact different
patterns–one saltatory, one successively activated–were presented, then the two different patterns
produce equal percepts of movement and subjects fail to discriminate correctly. In this case, the
two illusions of movement would be indiscriminable.
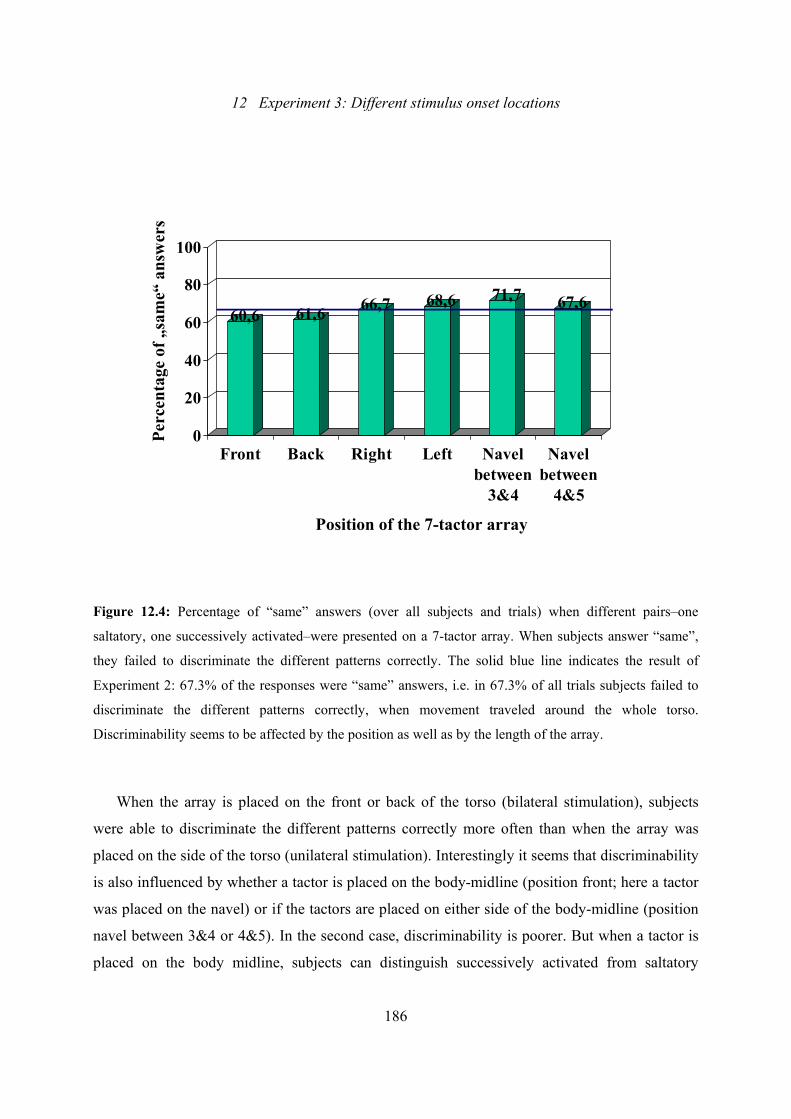
12 Experiment 3: Different stimulus onset locations
186
60,6 61,6 66,7 68,6 71,7 67,6
0
20
40
60
80
100
Front Back Right Left Navelbetween
3&4
Navelbetween
4&5
Position of the 7-tactor array
Perc
enta
ge o
f „sa
me“
ans
we r
s
Figure 12.4: Percentage of “same” answers (over all subjects and trials) when different pairs–one
saltatory, one successively activated–were presented on a 7-tactor array. When subjects answer “same”,
they failed to discriminate the different patterns correctly. The solid blue line indicates the result of
Experiment 2: 67.3% of the responses were “same” answers, i.e. in 67.3% of all trials subjects failed to
discriminate the different patterns correctly, when movement traveled around the whole torso.
Discriminability seems to be affected by the position as well as by the length of the array.
When the array is placed on the front or back of the torso (bilateral stimulation), subjects
were able to discriminate the different patterns correctly more often than when the array was
placed on the side of the torso (unilateral stimulation). Interestingly it seems that discriminability
is also influenced by whether a tactor is placed on the body-midline (position front; here a tactor
was placed on the navel) or if the tactors are placed on either side of the body-midline (position
navel between 3&4 or 4&5). In the second case, discriminability is poorer. But when a tactor is
placed on the body midline, subjects can distinguish successively activated from saltatory
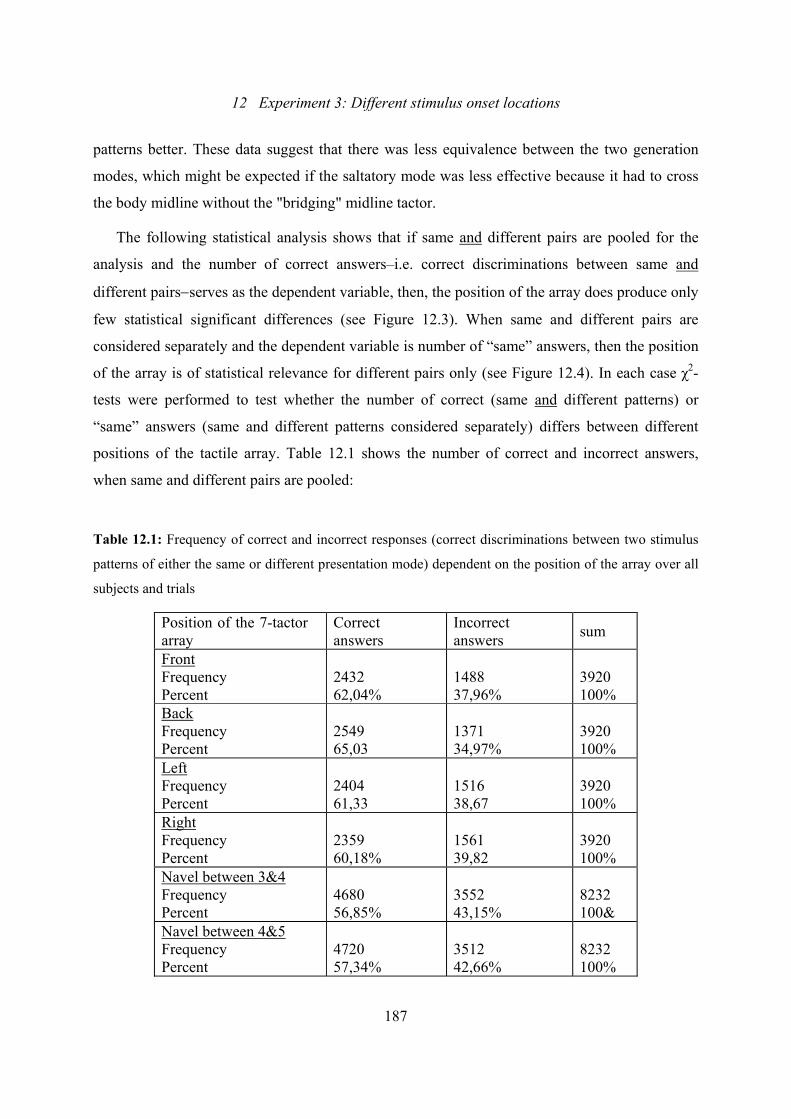
12 Experiment 3: Different stimulus onset locations
187
patterns better. These data suggest that there was less equivalence between the two generation
modes, which might be expected if the saltatory mode was less effective because it had to cross
the body midline without the "bridging" midline tactor.
The following statistical analysis shows that if same and different pairs are pooled for the
analysis and the number of correct answers–i.e. correct discriminations between same and
different pairs−serves as the dependent variable, then, the position of the array does produce only
few statistical significant differences (see Figure 12.3). When same and different pairs are
considered separately and the dependent variable is number of “same” answers, then the position
of the array is of statistical relevance for different pairs only (see Figure 12.4). In each case χ2-
tests were performed to test whether the number of correct (same and different patterns) or
“same” answers (same and different patterns considered separately) differs between different
positions of the tactile array. Table 12.1 shows the number of correct and incorrect answers,
when same and different pairs are pooled:
Table 12.1: Frequency of correct and incorrect responses (correct discriminations between two stimulus
patterns of either the same or different presentation mode) dependent on the position of the array over all
subjects and trials
Position of the 7-tactor array
Correct answers
Incorrect answers sum
Front Frequency Percent
2432 62,04%
1488 37,96%
3920 100%
Back Frequency Percent
2549 65,03
1371 34,97%
3920 100%
Left Frequency Percent
2404 61,33
1516 38,67
3920 100%
Right Frequency Percent
2359 60,18%
1561 39,82
3920 100%
Navel between 3&4 Frequency Percent
4680 56,85%
3552 43,15%
8232 100&
Navel between 4&5 Frequency Percent
4720 57,34%
3512 42,66%
8232 100%
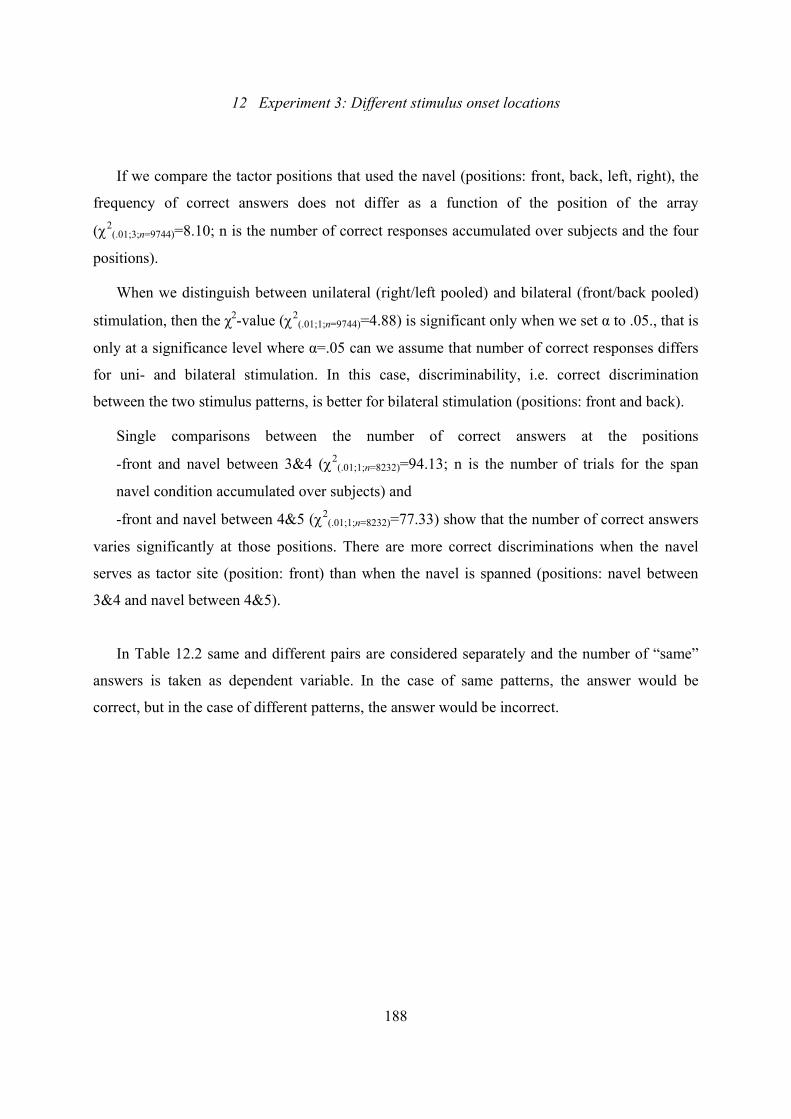
12 Experiment 3: Different stimulus onset locations
188
If we compare the tactor positions that used the navel (positions: front, back, left, right), the
frequency of correct answers does not differ as a function of the position of the array
(χ2(.01;3;n=9744)=8.10; n is the number of correct responses accumulated over subjects and the four
positions).
When we distinguish between unilateral (right/left pooled) and bilateral (front/back pooled)
stimulation, then the χ2-value (χ2(.01;1;n=9744)=4.88) is significant only when we set α to .05., that is
only at a significance level where α=.05 can we assume that number of correct responses differs
for uni- and bilateral stimulation. In this case, discriminability, i.e. correct discrimination
between the two stimulus patterns, is better for bilateral stimulation (positions: front and back).
Single comparisons between the number of correct answers at the positions
-front and navel between 3&4 (χ2(.01;1;n=8232)=94.13; n is the number of trials for the span
navel condition accumulated over subjects) and
-front and navel between 4&5 (χ2(.01;1;n=8232)=77.33) show that the number of correct answers
varies significantly at those positions. There are more correct discriminations when the navel
serves as tactor site (position: front) than when the navel is spanned (positions: navel between
3&4 and navel between 4&5).
In Table 12.2 same and different pairs are considered separately and the number of “same”
answers is taken as dependent variable. In the case of same patterns, the answer would be
correct, but in the case of different patterns, the answer would be incorrect.
12 Experiment 3: Different stimulus onset locations
189
Table 12.2: Subjects’ “same” answers to same and different patterns as a function of the position of the
7-tactor array on the body
Position of the 7-tactor array
“Same” answers
Same patterns Different patterns Front Frequency Percent
1659 84,64%
1187 60,56%
Back Frequency Percent
1796 91,63%
1207 61,58%
Left Frequency Percent
1788 91,22%
1344 68,57%
Right Frequency Percent
1707 87,09%
1308 66,73%
Navel between 3&4 Frequency Percent
3517 85,44%
2953 71,74%
Navel between 4&5 Frequency Percent
3386 82,26%
2782 67,59%
Note: Same patterns are generated in the same mode (both successively activated or both saltatory),
different pairs are generated in different modes (one pattern successively activated, one pattern saltatory).
When subjects answer “same” to same patterns, the answer would be correct, when they answer “same”
to different patterns the answer is incorrect and the two different stimulus patterns create the same illusory
percept of movement. Denoted are the absolute number of “same” answers (frequency) and the
percentage of “same” answers within same patterns and different patterns over trials and subjects in the
respective condition.
First, we consider same pairs: There is no significant difference in the number of “same”
answers as a function of the position of the array when it is placed on the front, back, left, or
right side of the torso (χ2(.01;3;n=6950)=7.52; n is the number of “same” responses to same pairs
accumulated over subjects and the four positions). When unilateral (right and left) and bilateral
(front and back) positions are compared, we also find no significant difference in the number of
“same” answers (χ2(.01;1;n=6950=0.23). Finally, when we compare the positions where the illusory
movement travels over the front of the torso, we find a significant difference only between the
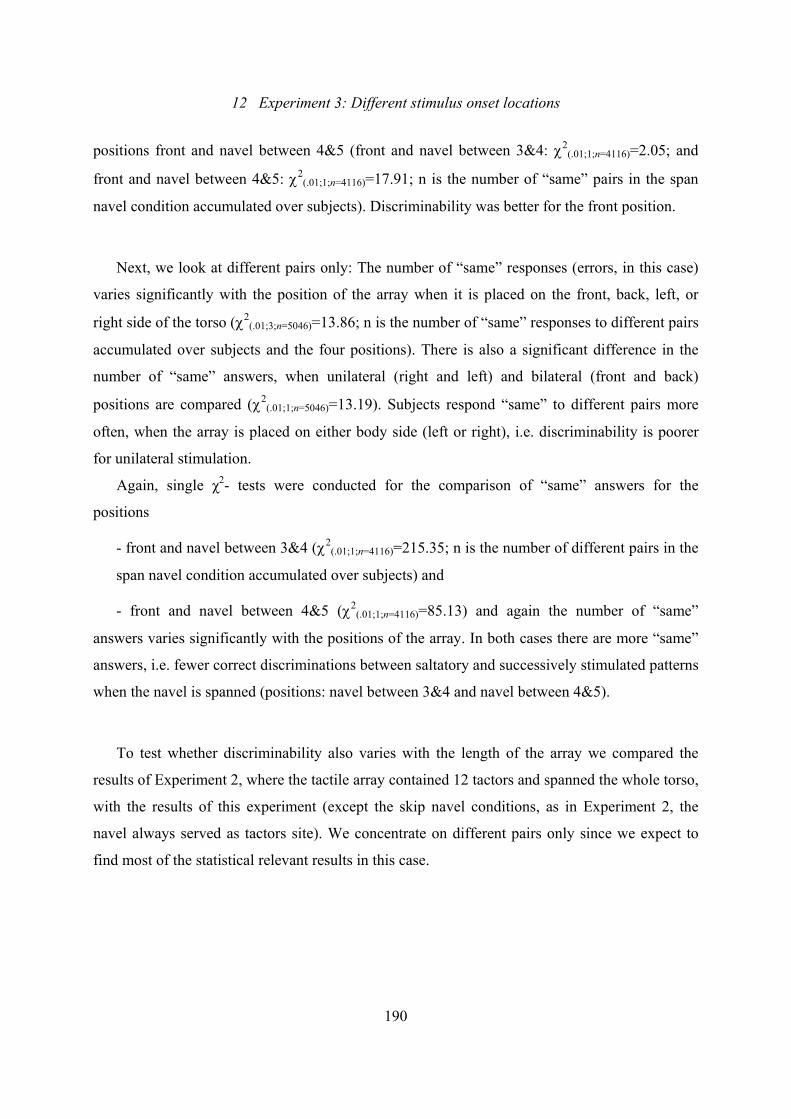
12 Experiment 3: Different stimulus onset locations
190
positions front and navel between 4&5 (front and navel between 3&4: χ2(.01;1;n=4116)=2.05; and
front and navel between 4&5: χ2(.01;1;n=4116)=17.91; n is the number of “same” pairs in the span
navel condition accumulated over subjects). Discriminability was better for the front position.
Next, we look at different pairs only: The number of “same” responses (errors, in this case)
varies significantly with the position of the array when it is placed on the front, back, left, or
right side of the torso (χ2(.01;3;n=5046)=13.86; n is the number of “same” responses to different pairs
accumulated over subjects and the four positions). There is also a significant difference in the
number of “same” answers, when unilateral (right and left) and bilateral (front and back)
positions are compared (χ2(.01;1;n=5046)=13.19). Subjects respond “same” to different pairs more
often, when the array is placed on either body side (left or right), i.e. discriminability is poorer
for unilateral stimulation.
Again, single χ2- tests were conducted for the comparison of “same” answers for the
positions
- front and navel between 3&4 (χ2(.01;1;n=4116)=215.35; n is the number of different pairs in the
span navel condition accumulated over subjects) and
- front and navel between 4&5 (χ2(.01;1;n=4116)=85.13) and again the number of “same”
answers varies significantly with the positions of the array. In both cases there are more “same”
answers, i.e. fewer correct discriminations between saltatory and successively stimulated patterns
when the navel is spanned (positions: navel between 3&4 and navel between 4&5).
To test whether discriminability also varies with the length of the array we compared the
results of Experiment 2, where the tactile array contained 12 tactors and spanned the whole torso,
with the results of this experiment (except the skip navel conditions, as in Experiment 2, the
navel always served as tactors site). We concentrate on different pairs only since we expect to
find most of the statistical relevant results in this case.
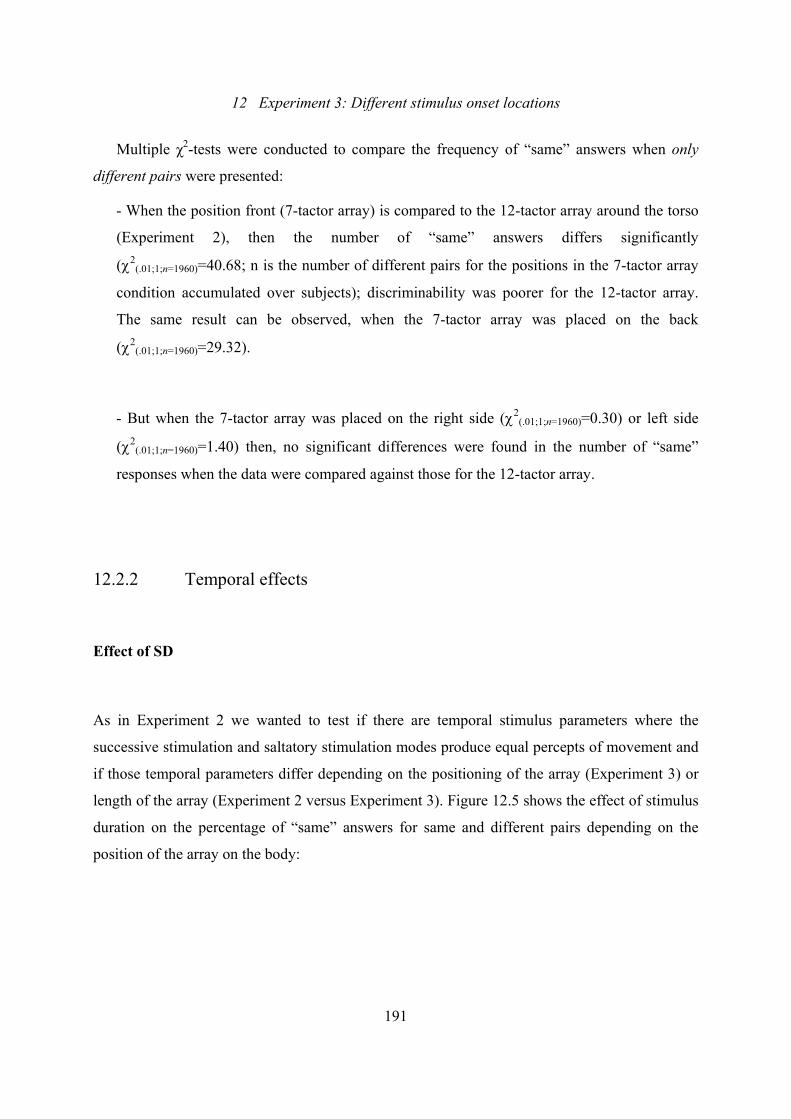
12 Experiment 3: Different stimulus onset locations
191
Multiple χ2-tests were conducted to compare the frequency of “same” answers when only
different pairs were presented:
- When the position front (7-tactor array) is compared to the 12-tactor array around the torso
(Experiment 2), then the number of “same” answers differs significantly
(χ2(.01;1;n=1960)=40.68; n is the number of different pairs for the positions in the 7-tactor array
condition accumulated over subjects); discriminability was poorer for the 12-tactor array.
The same result can be observed, when the 7-tactor array was placed on the back
(χ2(.01;1;n=1960)=29.32).
- But when the 7-tactor array was placed on the right side (χ2(.01;1;n=1960)=0.30) or left side
(χ2(.01;1;n=1960)=1.40) then, no significant differences were found in the number of “same”
responses when the data were compared against those for the 12-tactor array.
12.2.2 Temporal effects
Effect of SD
As in Experiment 2 we wanted to test if there are temporal stimulus parameters where the
successive stimulation and saltatory stimulation modes produce equal percepts of movement and
if those temporal parameters differ depending on the positioning of the array (Experiment 3) or
length of the array (Experiment 2 versus Experiment 3). Figure 12.5 shows the effect of stimulus
duration on the percentage of “same” answers for same and different pairs depending on the
position of the array on the body:
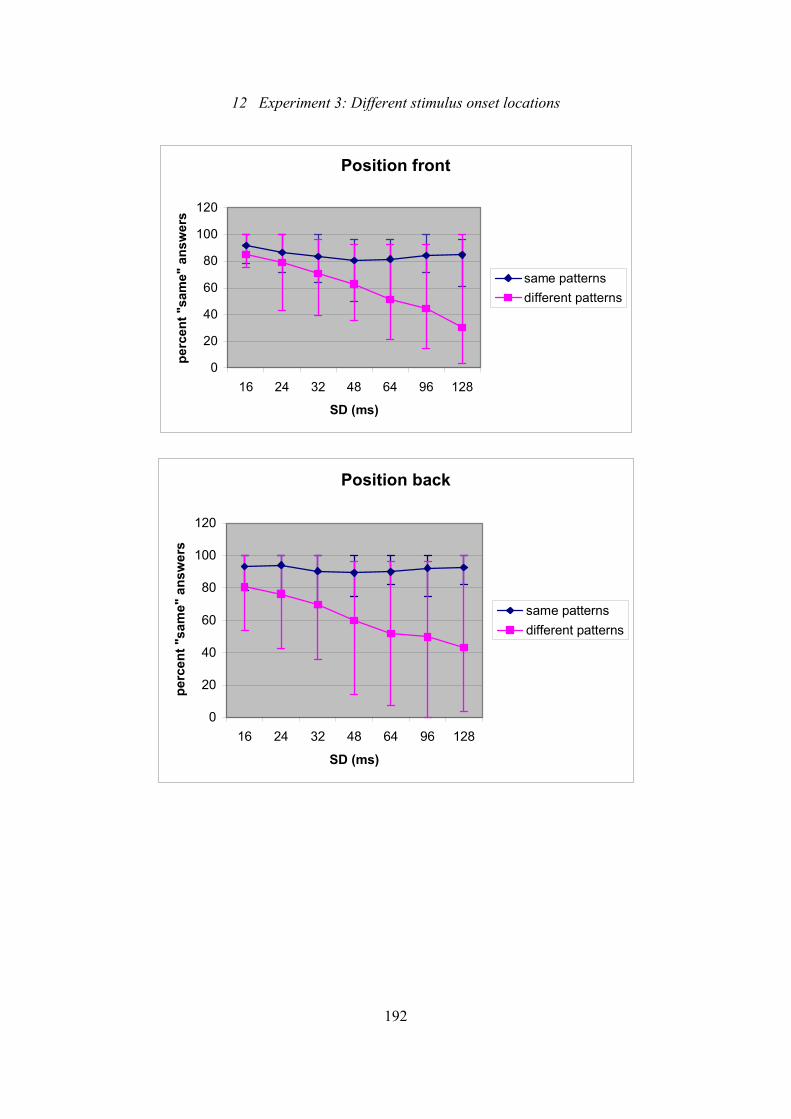
12 Experiment 3: Different stimulus onset locations
192
Position front
0
20
40
60
80
100
120
16 24 32 48 64 96 128
SD (ms)
perc
ent "
sam
e" a
nsw
ers
same patternsdifferent patterns
Position back
0
20
40
60
80
100
120
16 24 32 48 64 96 128
SD (ms)
perc
ent "
sam
e" a
nsw
ers
same patternsdifferent patterns
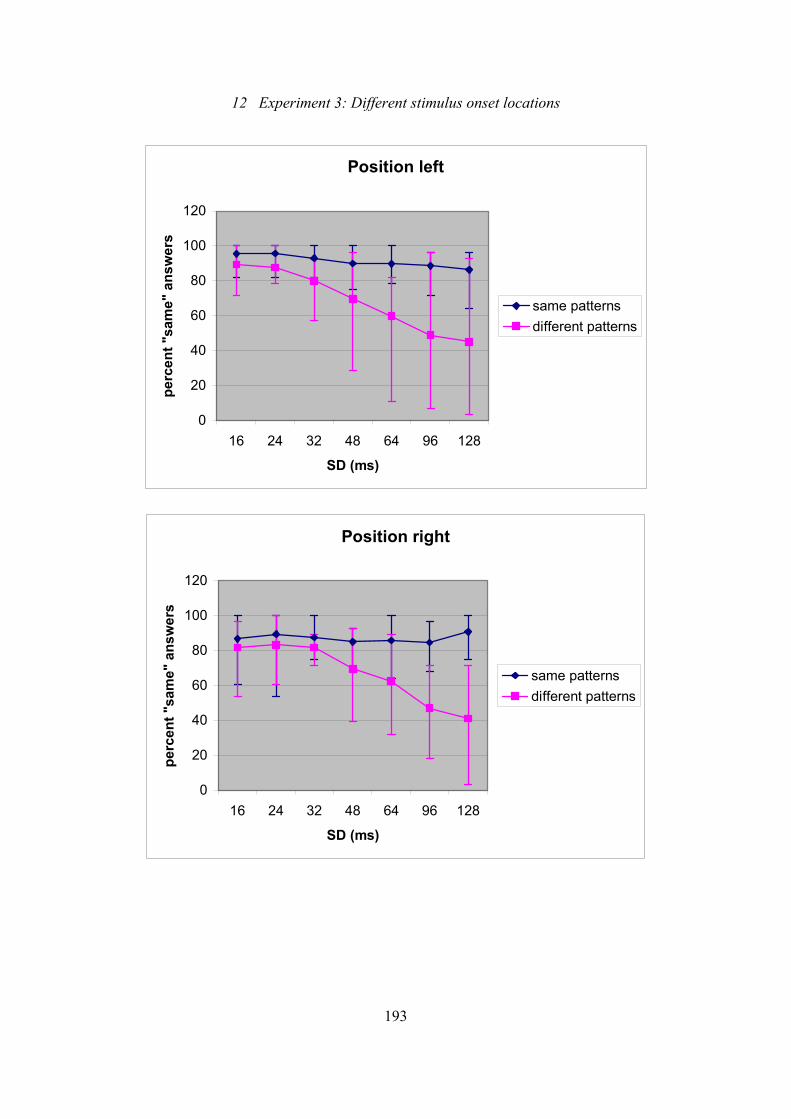
12 Experiment 3: Different stimulus onset locations
193
Position left
0
20
40
60
80
100
120
16 24 32 48 64 96 128
SD (ms)
perc
ent "
sam
e" a
nsw
ers
same patternsdifferent patterns
Position right
0
20
40
60
80
100
120
16 24 32 48 64 96 128
SD (ms)
perc
ent "
sam
e" a
nsw
ers
same patternsdifferent patterns
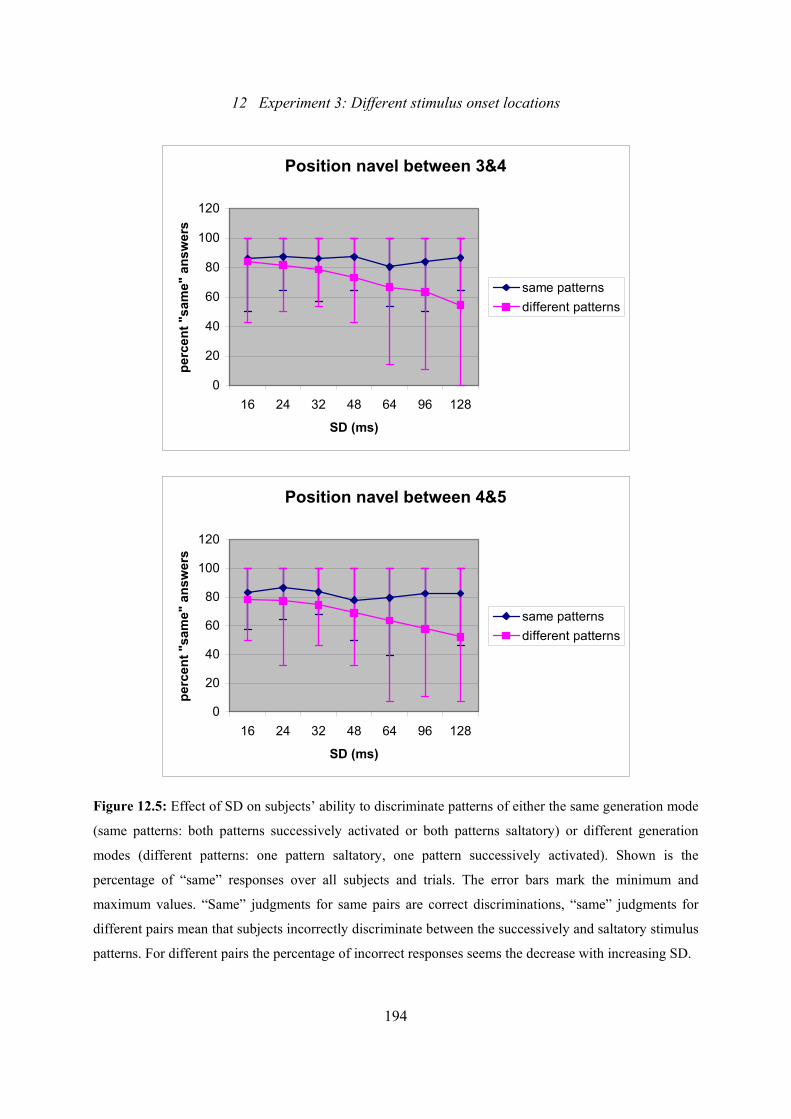
12 Experiment 3: Different stimulus onset locations
194
Position navel between 3&4
0
20
40
60
80
100
120
16 24 32 48 64 96 128
SD (ms)
perc
ent "
sam
e" a
nsw
ers
same patternsdifferent patterns
Position navel between 4&5
0
20
40
60
80
100
120
16 24 32 48 64 96 128
SD (ms)
perc
ent "
sam
e" a
nsw
ers
same patternsdifferent patterns
Figure 12.5: Effect of SD on subjects’ ability to discriminate patterns of either the same generation mode
(same patterns: both patterns successively activated or both patterns saltatory) or different generation
modes (different patterns: one pattern saltatory, one pattern successively activated). Shown is the
percentage of “same” responses over all subjects and trials. The error bars mark the minimum and
maximum values. “Same” judgments for same pairs are correct discriminations, “same” judgments for
different pairs mean that subjects incorrectly discriminate between the successively and saltatory stimulus
patterns. For different pairs the percentage of incorrect responses seems the decrease with increasing SD.
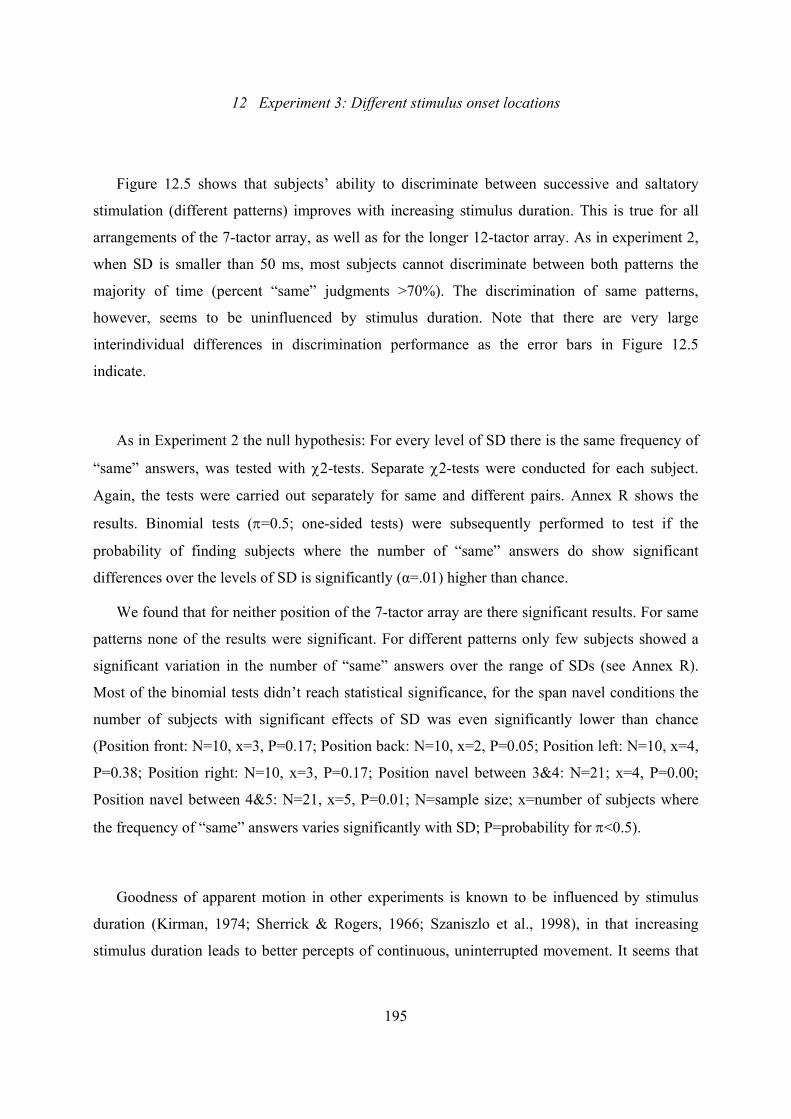
12 Experiment 3: Different stimulus onset locations
195
Figure 12.5 shows that subjects’ ability to discriminate between successive and saltatory
stimulation (different patterns) improves with increasing stimulus duration. This is true for all
arrangements of the 7-tactor array, as well as for the longer 12-tactor array. As in experiment 2,
when SD is smaller than 50 ms, most subjects cannot discriminate between both patterns the
majority of time (percent “same” judgments >70%). The discrimination of same patterns,
however, seems to be uninfluenced by stimulus duration. Note that there are very large
interindividual differences in discrimination performance as the error bars in Figure 12.5
indicate.
As in Experiment 2 the null hypothesis: For every level of SD there is the same frequency of
“same” answers, was tested with χ2-tests. Separate χ2-tests were conducted for each subject.
Again, the tests were carried out separately for same and different pairs. Annex R shows the
results. Binomial tests (π=0.5; one-sided tests) were subsequently performed to test if the
probability of finding subjects where the number of “same” answers do show significant
differences over the levels of SD is significantly (α=.01) higher than chance.
We found that for neither position of the 7-tactor array are there significant results. For same
patterns none of the results were significant. For different patterns only few subjects showed a
significant variation in the number of “same” answers over the range of SDs (see Annex R).
Most of the binomial tests didn’t reach statistical significance, for the span navel conditions the
number of subjects with significant effects of SD was even significantly lower than chance
(Position front: N=10, x=3, P=0.17; Position back: N=10, x=2, P=0.05; Position left: N=10, x=4,
P=0.38; Position right: N=10, x=3, P=0.17; Position navel between 3&4: N=21; x=4, P=0.00;
Position navel between 4&5: N=21, x=5, P=0.01; N=sample size; x=number of subjects where
the frequency of “same” answers varies significantly with SD; P=probability for π<0.5).
Goodness of apparent motion in other experiments is known to be influenced by stimulus
duration (Kirman, 1974; Sherrick & Rogers, 1966; Szaniszlo et al., 1998), in that increasing
stimulus duration leads to better percepts of continuous, uninterrupted movement. It seems that
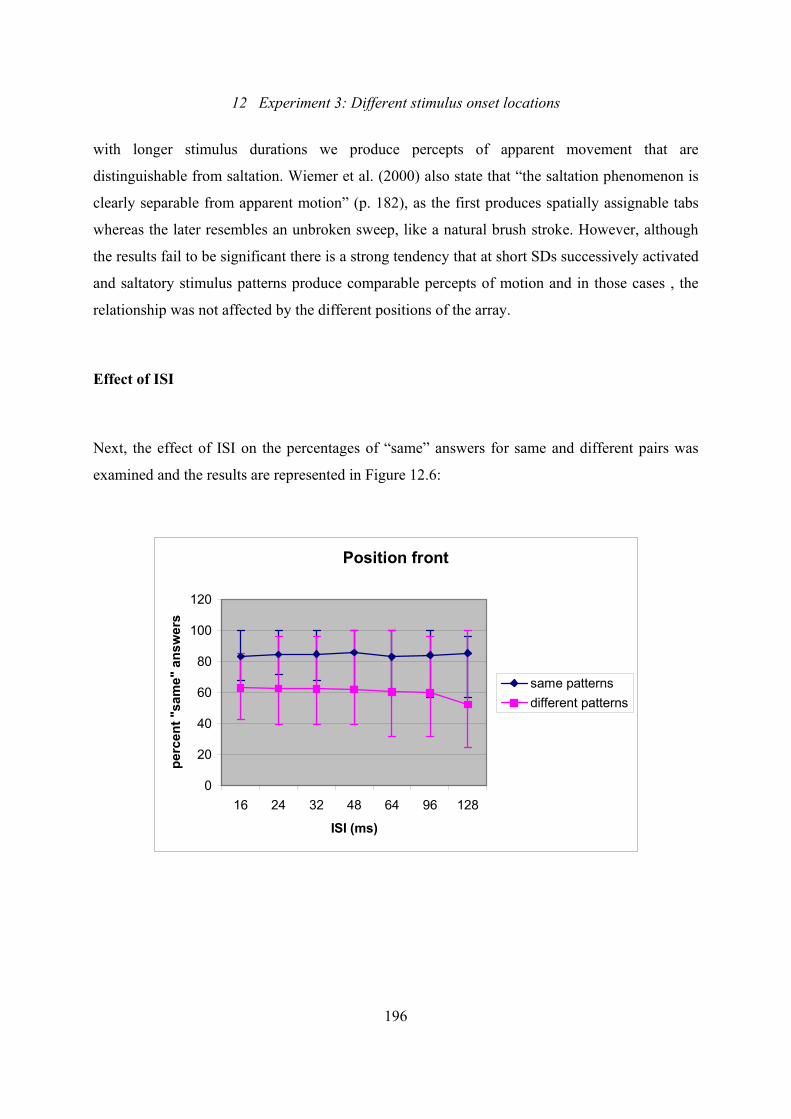
12 Experiment 3: Different stimulus onset locations
196
with longer stimulus durations we produce percepts of apparent movement that are
distinguishable from saltation. Wiemer et al. (2000) also state that “the saltation phenomenon is
clearly separable from apparent motion” (p. 182), as the first produces spatially assignable tabs
whereas the later resembles an unbroken sweep, like a natural brush stroke. However, although
the results fail to be significant there is a strong tendency that at short SDs successively activated
and saltatory stimulus patterns produce comparable percepts of motion and in those cases , the
relationship was not affected by the different positions of the array.
Effect of ISI
Next, the effect of ISI on the percentages of “same” answers for same and different pairs was
examined and the results are represented in Figure 12.6:
Position front
0
20
40
60
80
100
120
16 24 32 48 64 96 128
ISI (ms)
perc
ent "
sam
e" a
nsw
ers
same patternsdifferent patterns
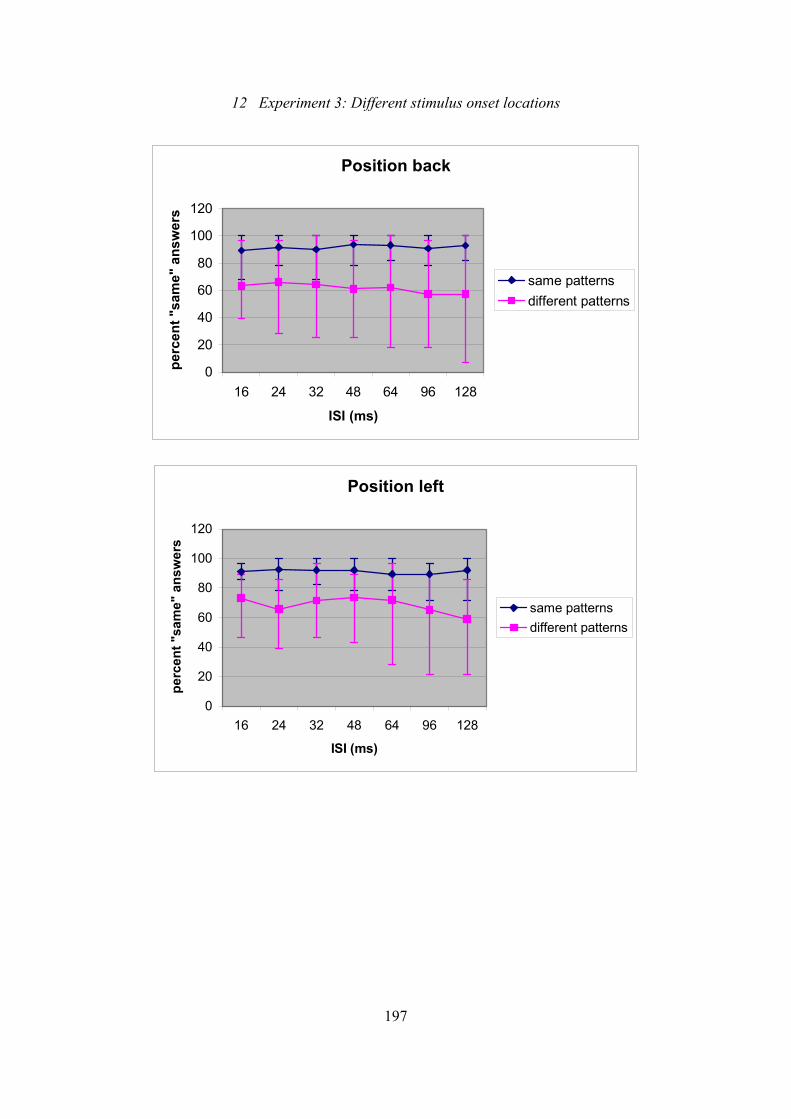
12 Experiment 3: Different stimulus onset locations
197
Position back
0
20
40
60
80
100
120
16 24 32 48 64 96 128
ISI (ms)
perc
ent "
sam
e" a
nsw
ers
same patternsdifferent patterns
Position left
0
20
40
60
80
100
120
16 24 32 48 64 96 128
ISI (ms)
perc
ent "
sam
e" a
nsw
ers
same patternsdifferent patterns
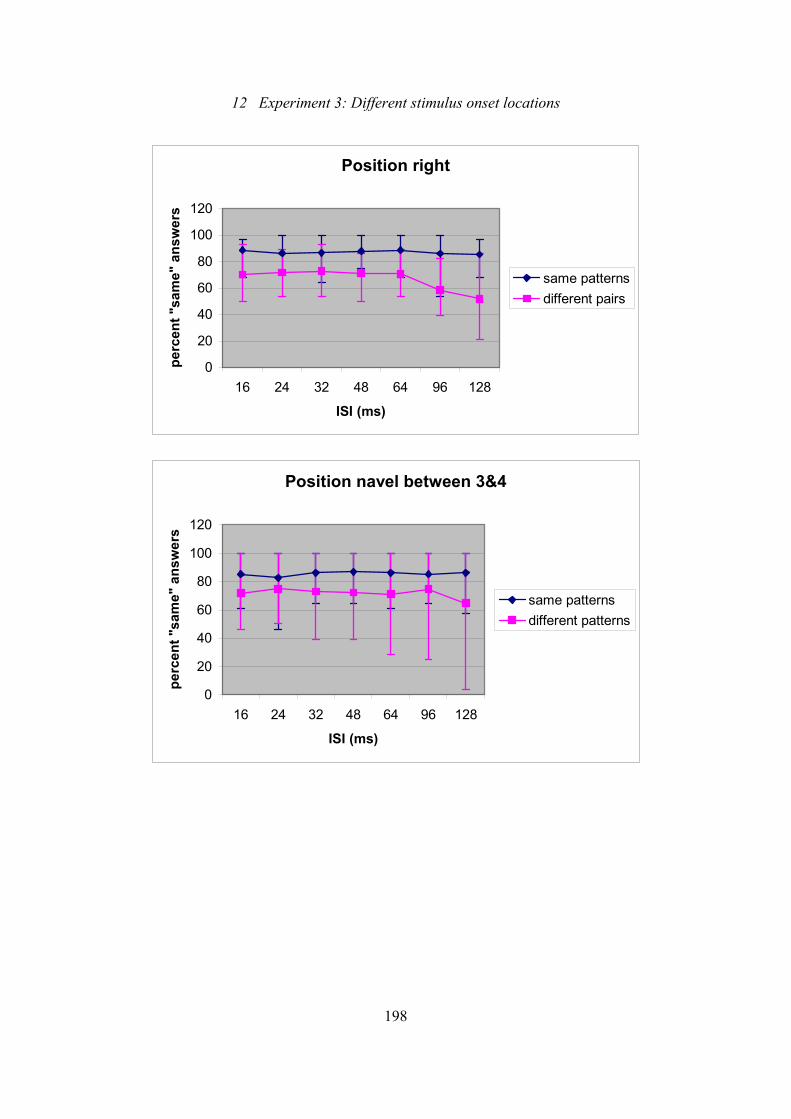
12 Experiment 3: Different stimulus onset locations
198
Position right
0
20
40
60
80
100
120
16 24 32 48 64 96 128
ISI (ms)
perc
ent "
sam
e" a
nsw
ers
same patternsdifferent pairs
Position navel between 3&4
0
20
40
60
80
100
120
16 24 32 48 64 96 128
ISI (ms)
perc
ent "
sam
e" a
nsw
ers
same patternsdifferent patterns
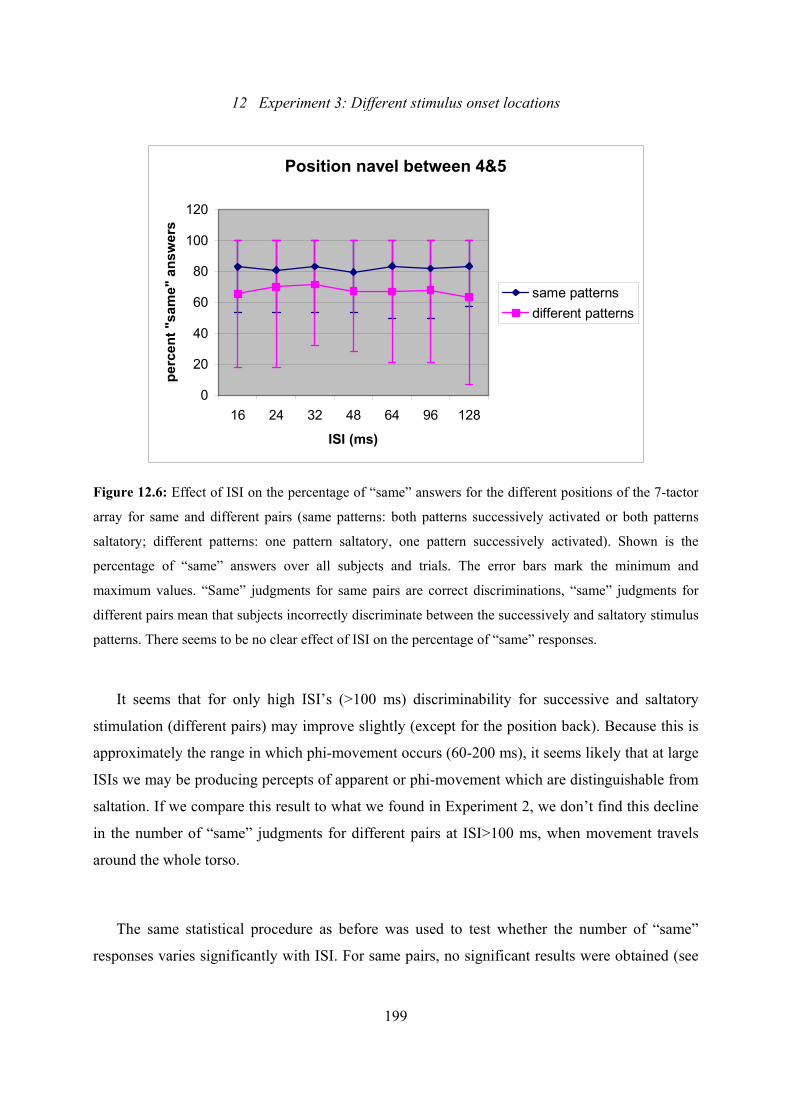
12 Experiment 3: Different stimulus onset locations
199
Position navel between 4&5
0
20
40
60
80
100
120
16 24 32 48 64 96 128
ISI (ms)
perc
ent "
sam
e" a
nsw
ers
same patternsdifferent patterns
Figure 12.6: Effect of ISI on the percentage of “same” answers for the different positions of the 7-tactor
array for same and different pairs (same patterns: both patterns successively activated or both patterns
saltatory; different patterns: one pattern saltatory, one pattern successively activated). Shown is the
percentage of “same” answers over all subjects and trials. The error bars mark the minimum and
maximum values. “Same” judgments for same pairs are correct discriminations, “same” judgments for
different pairs mean that subjects incorrectly discriminate between the successively and saltatory stimulus
patterns. There seems to be no clear effect of ISI on the percentage of “same” responses.
It seems that for only high ISI’s (>100 ms) discriminability for successive and saltatory
stimulation (different pairs) may improve slightly (except for the position back). Because this is
approximately the range in which phi-movement occurs (60-200 ms), it seems likely that at large
ISIs we may be producing percepts of apparent or phi-movement which are distinguishable from
saltation. If we compare this result to what we found in Experiment 2, we don’t find this decline
in the number of “same” judgments for different pairs at ISI>100 ms, when movement travels
around the whole torso.
The same statistical procedure as before was used to test whether the number of “same”
responses varies significantly with ISI. For same pairs, no significant results were obtained (see
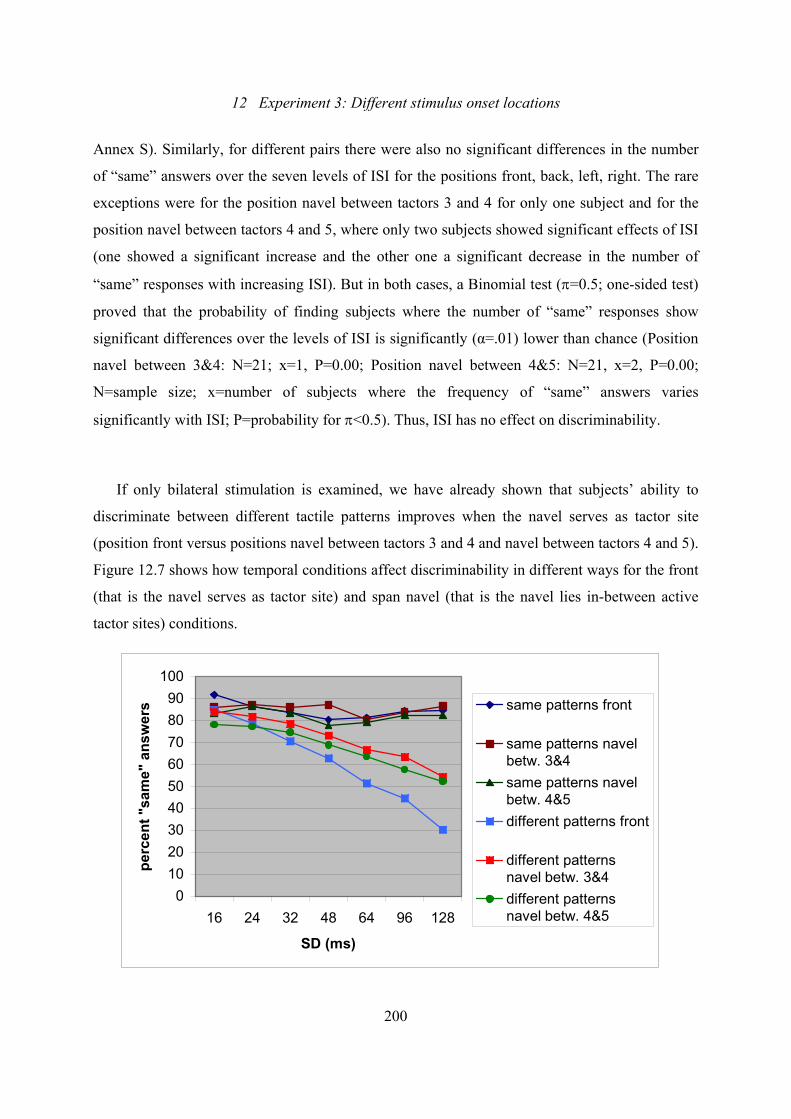
12 Experiment 3: Different stimulus onset locations
200
Annex S). Similarly, for different pairs there were also no significant differences in the number
of “same” answers over the seven levels of ISI for the positions front, back, left, right. The rare
exceptions were for the position navel between tactors 3 and 4 for only one subject and for the
position navel between tactors 4 and 5, where only two subjects showed significant effects of ISI
(one showed a significant increase and the other one a significant decrease in the number of
“same” responses with increasing ISI). But in both cases, a Binomial test (π=0.5; one-sided test)
proved that the probability of finding subjects where the number of “same” responses show
significant differences over the levels of ISI is significantly (α=.01) lower than chance (Position
navel between 3&4: N=21; x=1, P=0.00; Position navel between 4&5: N=21, x=2, P=0.00;
N=sample size; x=number of subjects where the frequency of “same” answers varies
significantly with ISI; P=probability for π<0.5). Thus, ISI has no effect on discriminability.
If only bilateral stimulation is examined, we have already shown that subjects’ ability to
discriminate between different tactile patterns improves when the navel serves as tactor site
(position front versus positions navel between tactors 3 and 4 and navel between tactors 4 and 5).
Figure 12.7 shows how temporal conditions affect discriminability in different ways for the front
(that is the navel serves as tactor site) and span navel (that is the navel lies in-between active
tactor sites) conditions.
0102030405060708090
100
16 24 32 48 64 96 128
SD (ms)
perc
ent "
sam
e" a
nsw
ers same patterns front
same patterns navelbetw. 3&4same patterns navelbetw. 4&5different patterns front
different patternsnavel betw. 3&4different patternsnavel betw. 4&5
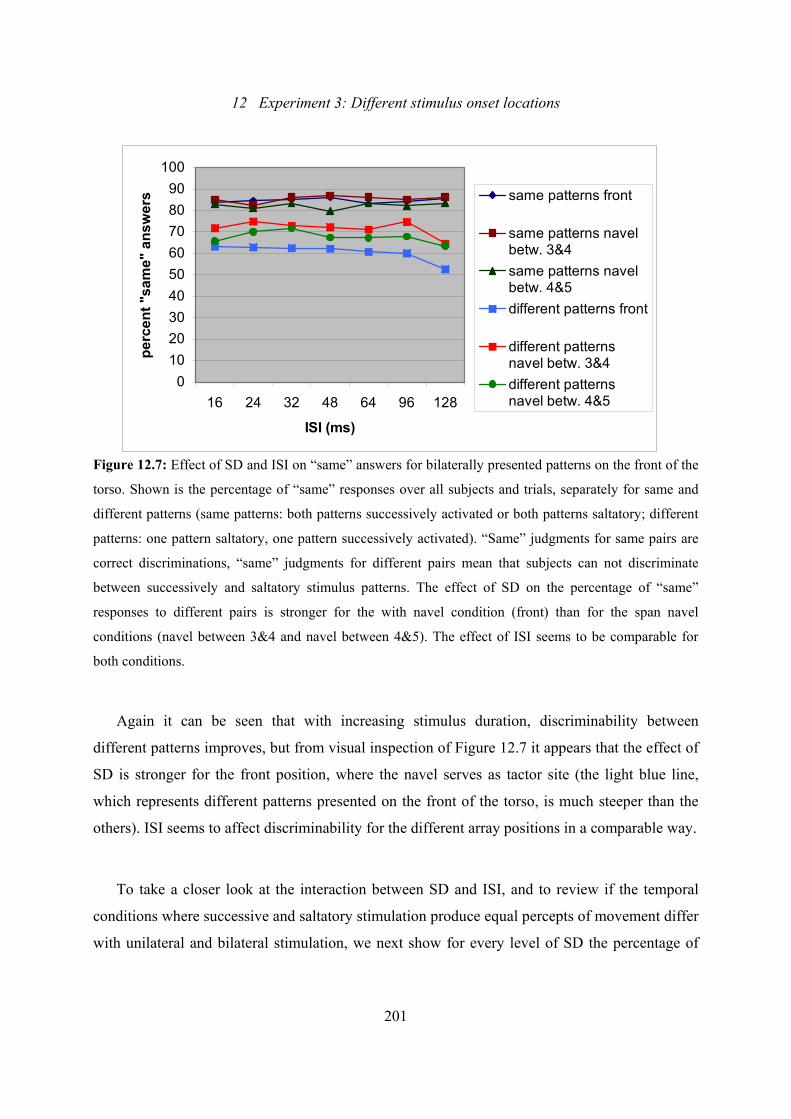
12 Experiment 3: Different stimulus onset locations
201
0102030405060708090
100
16 24 32 48 64 96 128
ISI (ms)
perc
ent "
sam
e" a
nsw
ers same patterns front
same patterns navelbetw. 3&4same patterns navelbetw. 4&5different patterns front
different patternsnavel betw. 3&4different patternsnavel betw. 4&5
Figure 12.7: Effect of SD and ISI on “same” answers for bilaterally presented patterns on the front of the
torso. Shown is the percentage of “same” responses over all subjects and trials, separately for same and
different patterns (same patterns: both patterns successively activated or both patterns saltatory; different
patterns: one pattern saltatory, one pattern successively activated). “Same” judgments for same pairs are
correct discriminations, “same” judgments for different pairs mean that subjects can not discriminate
between successively and saltatory stimulus patterns. The effect of SD on the percentage of “same”
responses to different pairs is stronger for the with navel condition (front) than for the span navel
conditions (navel between 3&4 and navel between 4&5). The effect of ISI seems to be comparable for
both conditions.
Again it can be seen that with increasing stimulus duration, discriminability between
different patterns improves, but from visual inspection of Figure 12.7 it appears that the effect of
SD is stronger for the front position, where the navel serves as tactor site (the light blue line,
which represents different patterns presented on the front of the torso, is much steeper than the
others). ISI seems to affect discriminability for the different array positions in a comparable way.
To take a closer look at the interaction between SD and ISI, and to review if the temporal
conditions where successive and saltatory stimulation produce equal percepts of movement differ
with unilateral and bilateral stimulation, we next show for every level of SD the percentage of
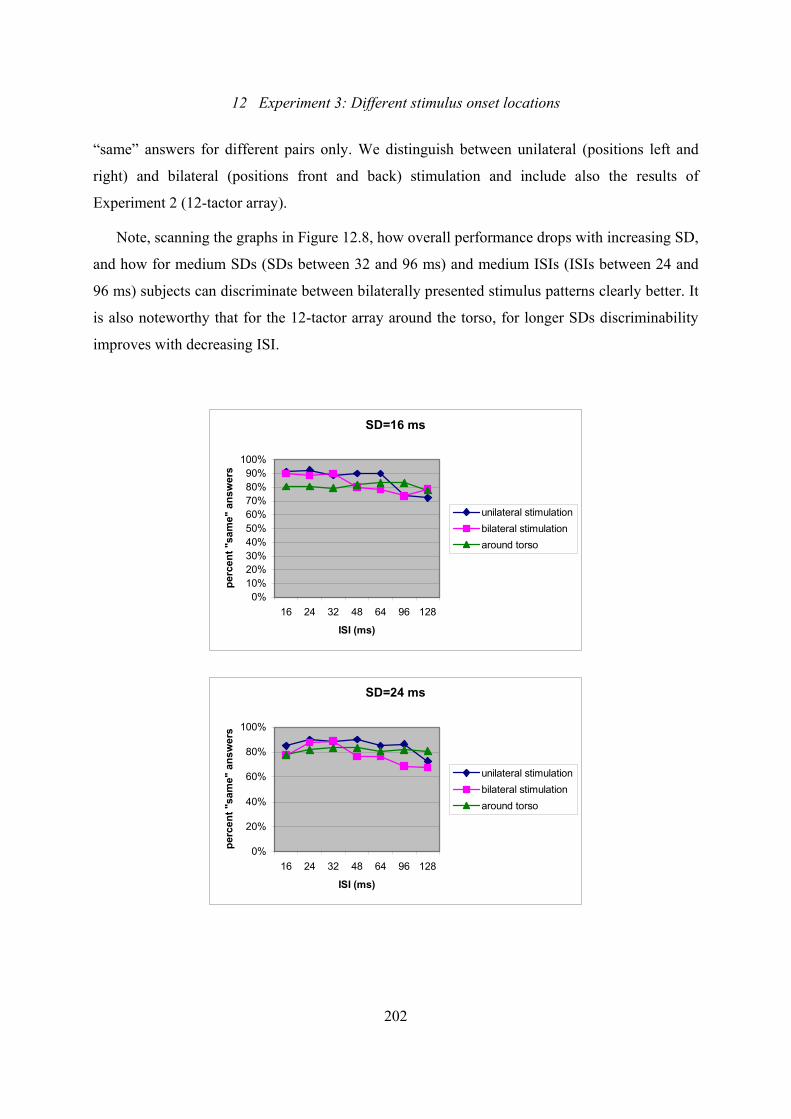
12 Experiment 3: Different stimulus onset locations
202
“same” answers for different pairs only. We distinguish between unilateral (positions left and
right) and bilateral (positions front and back) stimulation and include also the results of
Experiment 2 (12-tactor array).
Note, scanning the graphs in Figure 12.8, how overall performance drops with increasing SD,
and how for medium SDs (SDs between 32 and 96 ms) and medium ISIs (ISIs between 24 and
96 ms) subjects can discriminate between bilaterally presented stimulus patterns clearly better. It
is also noteworthy that for the 12-tactor array around the torso, for longer SDs discriminability
improves with decreasing ISI.
SD=16 ms
0%10%20%30%40%50%60%70%80%90%
100%
16 24 32 48 64 96 128
ISI (ms)
perc
ent "
sam
e" a
nsw
ers
unilateral stimulationbilateral stimulationaround torso
SD=24 ms
0%
20%
40%
60%
80%
100%
16 24 32 48 64 96 128
ISI (ms)
perc
ent "
sam
e" a
nsw
ers
unilateral stimulationbilateral stimulationaround torso
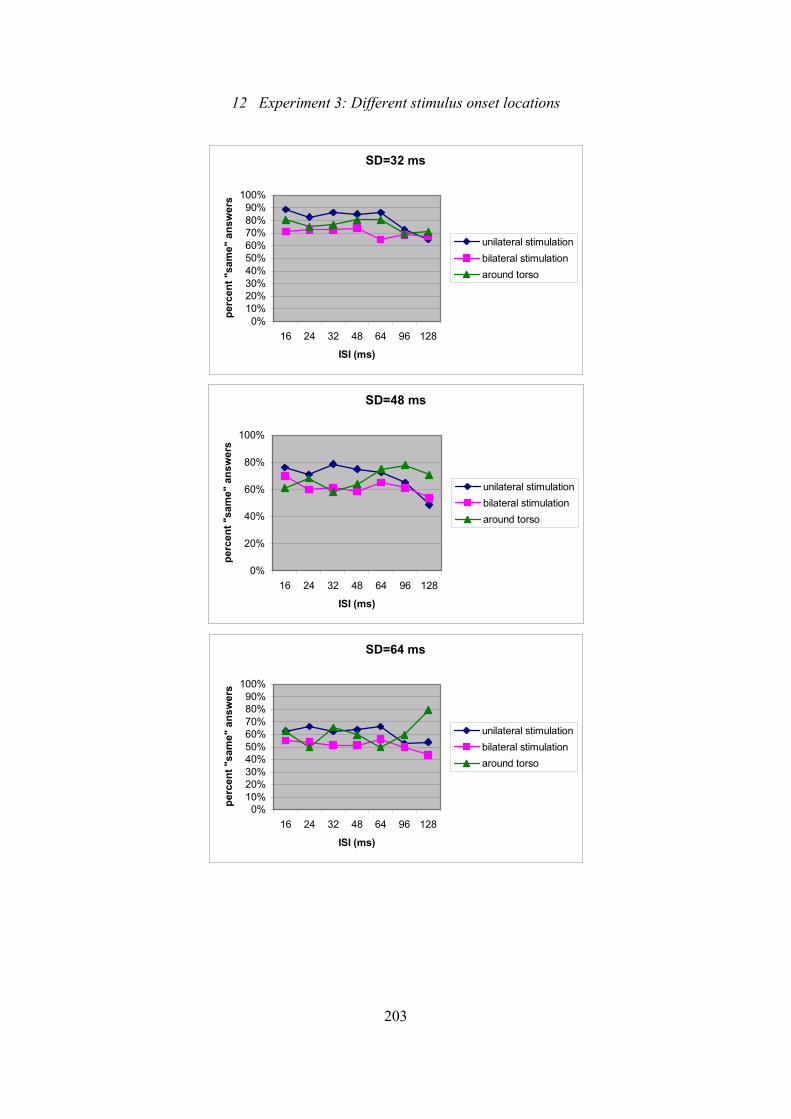
12 Experiment 3: Different stimulus onset locations
203
SD=32 ms
0%10%20%30%40%50%60%70%80%90%
100%
16 24 32 48 64 96 128
ISI (ms)
perc
ent "
sam
e" a
nsw
ers
unilateral stimulationbilateral stimulationaround torso
SD=48 ms
0%
20%
40%
60%
80%
100%
16 24 32 48 64 96 128
ISI (ms)
perc
ent "
sam
e" a
nsw
ers
unilateral stimulationbilateral stimulationaround torso
SD=64 ms
0%10%20%30%40%50%60%70%80%90%
100%
16 24 32 48 64 96 128
ISI (ms)
perc
ent "
sam
e" a
nsw
ers
unilateral stimulationbilateral stimulationaround torso
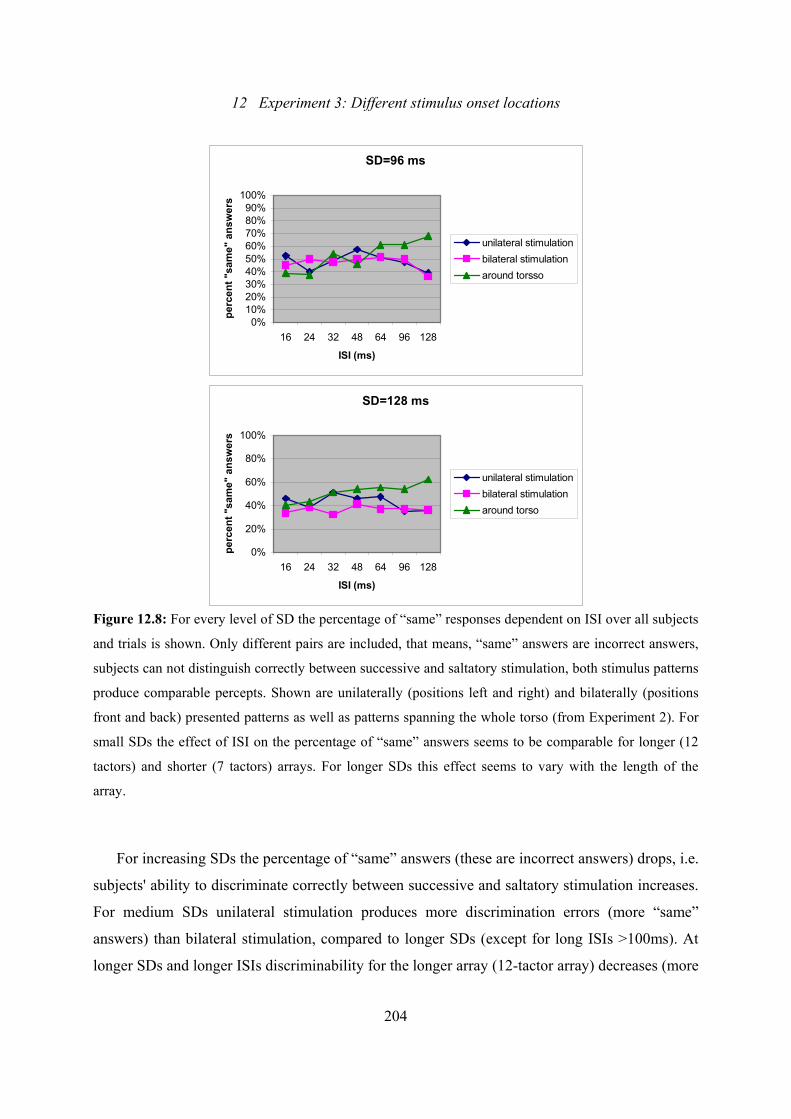
12 Experiment 3: Different stimulus onset locations
204
SD=96 ms
0%10%20%30%40%50%60%70%80%90%
100%
16 24 32 48 64 96 128
ISI (ms)
perc
ent "
sam
e" a
nsw
ers
unilateral stimulationbilateral stimulationaround torsso
SD=128 ms
0%
20%
40%
60%
80%
100%
16 24 32 48 64 96 128
ISI (ms)
perc
ent "
sam
e" a
nsw
ers
unilateral stimulationbilateral stimulationaround torso
Figure 12.8: For every level of SD the percentage of “same” responses dependent on ISI over all subjects
and trials is shown. Only different pairs are included, that means, “same” answers are incorrect answers,
subjects can not distinguish correctly between successive and saltatory stimulation, both stimulus patterns
produce comparable percepts. Shown are unilaterally (positions left and right) and bilaterally (positions
front and back) presented patterns as well as patterns spanning the whole torso (from Experiment 2). For
small SDs the effect of ISI on the percentage of “same” answers seems to be comparable for longer (12
tactors) and shorter (7 tactors) arrays. For longer SDs this effect seems to vary with the length of the
array.
For increasing SDs the percentage of “same” answers (these are incorrect answers) drops, i.e.
subjects' ability to discriminate correctly between successive and saltatory stimulation increases.
For medium SDs unilateral stimulation produces more discrimination errors (more “same”
answers) than bilateral stimulation, compared to longer SDs (except for long ISIs >100ms). At
longer SDs and longer ISIs discriminability for the longer array (12-tactor array) decreases (more
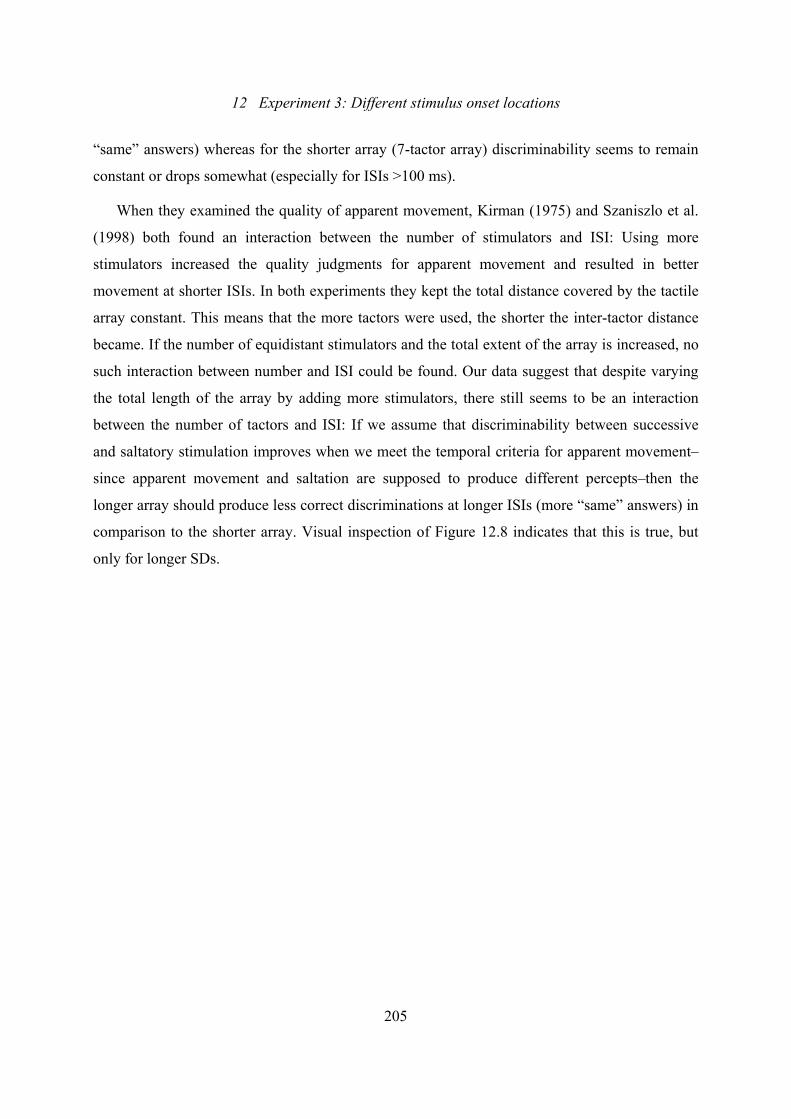
12 Experiment 3: Different stimulus onset locations
205
“same” answers) whereas for the shorter array (7-tactor array) discriminability seems to remain
constant or drops somewhat (especially for ISIs >100 ms).
When they examined the quality of apparent movement, Kirman (1975) and Szaniszlo et al.
(1998) both found an interaction between the number of stimulators and ISI: Using more
stimulators increased the quality judgments for apparent movement and resulted in better
movement at shorter ISIs. In both experiments they kept the total distance covered by the tactile
array constant. This means that the more tactors were used, the shorter the inter-tactor distance
became. If the number of equidistant stimulators and the total extent of the array is increased, no
such interaction between number and ISI could be found. Our data suggest that despite varying
the total length of the array by adding more stimulators, there still seems to be an interaction
between the number of tactors and ISI: If we assume that discriminability between successive
and saltatory stimulation improves when we meet the temporal criteria for apparent movement–
since apparent movement and saltation are supposed to produce different percepts–then the
longer array should produce less correct discriminations at longer ISIs (more “same” answers) in
comparison to the shorter array. Visual inspection of Figure 12.8 indicates that this is true, but
only for longer SDs.
12 Experiment 3: Different stimulus onset locations
206
12.3 Summary and discussion
Effect of position of the 7-tactor array Two different patterns of tactile movement–one:
successive stimulation, one: saltatory stimulation–can be discriminated better–and therefore
produce better distinguishable percepts of motion–when the 7-tactor array is placed on the front
or back of the torso (bilateral stimulation) than when it is placed on the right or left side of the
torso (unilateral stimulation). This result supports Geldard's finding that tactual phi and saltation
only coexist when stimuli are presented unilaterally. However, it should be noted that even for
bilateral stimulation the percentage of incorrect responses exceeded 60%, which is significantly
more than chance (50%). That means, in more than 60% of trials percepts of motion produced by
successive and saltatory stimulation crossing the body-midline are not discriminable. Thus,
bilaterally presented saltation and successive stimulation can produce similar percepts, they seem
to be integrated on higher cortical levels. Yet, the resemblance between saltation and successive
stimulation is greater for unilateral stimulation.
The better discrimination performance for bilaterally presented stimulus patterns may be due
to the better localization of stimuli presented near anatomical anchor points like the spine or
navel. In their experiments Cholewiak et al. (2004) evaluated conditions for correct localization
of seven vibrotactile stimuli that were presented to various locations on the torso. Since their
tactors as well as their experimental settings were identical to ours, we can directly compare the
two studies. In their case, localization of the seven tactor sites on the front or back of the torso
was more accurate than localization of the sites on the left or right side of the torso. At the navel
and spine anchor points, performance was near perfect. Van Erp (2007) also demonstrated that
spatial resolution for horizontally oriented arrays (subjects had to indicate if the second of two
successively presented vibratory stimuli is located left or right from the first) is higher at the
midline of the torso (1-2 cm) than at the side of the torso (3-4 cm). He explains the midline effect
by the fact that cutaneous areas at or adjacent to the trunk midline are represented bilaterally in
the first and second somatiosensory cortex.
A possible explanation for the similarity between the localization and discrimination
experiments might be that during the discrimination experiment the subjects are looking for clues
12 Experiment 3: Different stimulus onset locations
207
to discriminate between successive and saltatory stimulation. In the front and back condition, the
navel and spine, respectively, serve as tactor sites and are stimulated once, when all tactors are
stimulated successively, but are skipped, when the saltatory pattern is presented (see Figure
12.2). Since the navel and spine can be localized very well, subjects might realize that in one
pattern the navel is stimulated (successive activation) whereas in the other pattern (saltatory
stimulation) the navel is skipped.
We also know that two-point discrimination is enhanced when the two stimuli cross the
body-midline, since there are few bilateral receptive fields (Fuchs & Brown, 1984). Although we
present our stimuli successively–not simultaneously, as the two-point discrimination paradigm
requires−, this finding may also add to the observation, that subjects detect differences in
successively and saltatory presented patterns better when they straddle the body midline.
Discrimination was also found to be superior when the body-midline (navel) served as a
tactor site (with navel position: Front) compared to when it fell between two tactor sites (Span
navel positions: Navel between 3& 4 and navel between 4&5). One might expect that saltation
should be better in the with navel condition rather than in the span-navel condition (because of
the completion across the midline), so it should be more similar to the successive pattern. But
again, note, that in the position front, the navel is only stimulated in the successively presented
pattern, but skipped in the saltatory pattern. It is possible that we would have obtained a different
result if we would have rotated the array slightly so that the navel would have been stimulated in
the successive and in the saltatory pattern, allowing the stimulus at the navel “to bridge the
neurological gap” (Tan, Lim, & Traylor, 2000; p. 1111) at the body-midline in the saltatory
pattern.
Again, we find an analogy between our results and those of Cholewiak et al. (2004): They
rotated their arrays containing 6 or 8 equally spaced tactors around the torso so that tactors fell 1)
on either side of the navel or spine, or 2) on the navel and spine. Overall localization
performance in condition 1) was poorer compared to that in condition 2), when the navel and
spine served as tactor sites. Our results were similar in that we could also show that
discrimination performance drops when the 7-tactor array spans the navel.
When we compare the results of this experiment to the results of Experiment 2–where we
12 Experiment 3: Different stimulus onset locations
208
used a 12-tactor array that circled the whole torso−we can show that the shorter 7-tactor array
only leads to better discrimination when it was placed on the front or back of the torso.
The localization results of Cholewiak et al. (2004) are identical to our discrimination findings
between different patterns of tactile movement: Discriminability improves when the 7-tactor
array is placed on the front or back of the torso compared to the 12-tactor array that spans the
whole torso. No statistical significant difference can be found when the 7-tactor array is worn in
the left-right orientation compared to the 12-tactor array. In the 7-tactor bilateral (front/back)
array three tactor sites serve as anchor points: The start and endpoint of the array as well as the
body midline (navel or spine), which might increase the discrimination performance in
comparison to the 12-tactor array where the larger number of tactors increases the cognitive load
and there is only one distinct endpoint (see also Cholewiak & Collins’ 2000 discussion about
anatomical anchor points).
To summarize, one might assume, that anatomical anchor points might attract subjects’
attention and enable them to discriminate different stimulus patterns better. Thus subjects’
selective attention–which is known to influence point localization, or the perceived position of
the mislocalized stimulus during saltation (Kilgard & Merzenich, 1995)–might have an impact
on the perception of similarity or dissimilarity of different stimulus patterns
Effect of temporal stimulus parameters Although discriminability between different stimulus
patterns–one successive, one saltatory−is poor for short SDs and increases for longer SDs, this
trend is not statistically significant. ISI has no effect on discriminability, too. Our data suggest
that, when we meet the temporal criteria needed for producing apparent movement (long SDs),
successive and saltatory stimulation produce discriminable percepts of movement. Although
these optimal temporal conditions don’t vary fundamentally with the location of the array on the
body, there are some minor variations (see Figure 12.7: Effect of SD on discriminability is
higher for the array position front where the navel serves as tactor site as for the positions span
navel; see also Figure 12.8: Discriminability for bilaterally presented patterns is better than for
unilaterally presented patterns, this difference is more distinct for shorter and medium SDs). To
my knowledge no publication has ever examined the optimal temporal conditions for apparent
12 Experiment 3: Different stimulus onset locations
209
movement when it crosses the body midline. Our data indicate that optimal temporal conditions
for apparent movement might differ for unilateral and bilateral stimulation, as well as for arrays
using anatomical anchor points like the navel as stimulus site or not. Another experimental
design–such as judging the quality of apparent movement for uni- and bilateral
stimulation−might bring more clarity to this question.
13 General summary and discussion
210
13. General summary and discussion
When a visually moving grating is divided by a gap, subjects perceive the grating continuing
through the gap, indicating that a neural filling-in process must have occurred. Meng, Remus,
and Tong (2005) demonstrated that there is enhanced activity in early visual areas, which
represent the gap region, independent of subjects’ attention, and reason that the filling-in
process during such visual illusions occurs automatically. Their findings are supported by the
study of Larsen et al. (2006): They showed that the pattern of activity in primary visual cortex
(area V1), is similar for real and apparent motion; during apparent motion, the gaps between
activated sites are filled-in with cortical activation. Chen et al. (2003) and Blankenburg et al.
(2006) proved in the tactile sense, that illusory stimuli produced by funneling or saltation are
topographically represented in somatosensory cortex.
We assume that motion produced by successive activation and saltation requires similar
cortical “filling-in” of the “silent” sites in-between the activated tactors, since illusory stimuli
are perceived at sites in-between the physical location of the stimuli. That saltation and
successive activation can produce equal sensations of movement, has been demonstrated in
the tactile sense (Cholewiak & Collins, 2000; Geldard, 1975) and the auditory sense (e.g.
Kidd & Hogben, 2004), provided that appropriate stimulus timing parameters are chosen.
In our experiments, we explored the conditions for which successive and saltatory motion
produce the same percepts of motion and thus initiate the same cortical integration or “filling
in” process. Different spatio-temporal vibratory patterns (successively activated and saltatory)
supposed to induce apparent motion were judged by different qualities of motion to explore
possible rating differences (Experiment 1). In a second experiment, stimulus patterns had to
be discriminated, and subjects had to decide, which pattern felt “best”, i.e. for which pattern
the integration process was more successful. Finally we examined whether patterns crossing
the body-midline, and patterns presented on one body-half were similarly integrated.
Effect of ISI/SD The qualities straightness and smoothness are rated higher for shorter ISIs,
spatial distribution and length are barely affected by ISI (Experiment 1). With only two
exceptions (250 Hz, length, 12 tactors and 80 Hz straightness, 8 tactors), the effect of ISI on
subjects’ judgments is the same for both stimulus patterns (successively activated and
saltatory). ISI has no effect on discriminability or preference for one stimulus pattern
(Experiment 2), and this is true for a 12 –tactor array that covers the whole circumference of
13 General summary and discussion
211
the waist (Experiment 2), as well as for an array half as long and for all positionings of the
shorter 7-tactor array, which was either unilaterally or bilaterally placed on the torso
(Experiment 3).
We can conclude therefore, that over the ISI range tested in our experiment (~10-130 ms)
both patterns are integrated similarly. Perhaps at larger values we would have found effects of
ISI (see Experiment 3: At ISI>100 ms discriminability starts to improve). It is possible that at
higher ISIs, the single stimuli in the patterns start being segregated and differences between
the patterns are more easily detected.
Our findings are in line with the neural network model of Wiemer et al. (1998, 2000):
Stimuli following closely in time (ISI<300 ms) are expected to belong together, therefore they
should be presented close together in cortex (see also Gardner & Constanzo, 1980c, who state
that the perception of stimuli are influenced by preceding stimuli). In our experiments ISI was
always smaller than the critical limit of 300 ms, therefore it is not surprising that both
stimulus patterns are integrated into similar percepts of continuous movement, which are
difficult to differentiate.
In Wiemer’s model, the effect of SD on the integration of spatio-temporal stimuli is not
discussed. Nor is an interaction between SD and ISI considered. We know from the literature
that tactile apparent movement is affected by SD as well as by an interaction between SD and
ISI. To my knowledge only one study on saltation has ever varied SD systematically:
Cholewiak and Collins (2000) found two main effects on the perception of movement
generated by saltatory stimulus patterns on the back: Saltatory patterns appeared longer and
less straight for increasing SD (SDs between 4 and 140 ms were used). The same effect was
found for successively activated patterns. There was no clear effect of SD on discriminability.
In our experiments, the effect of SD was stronger for saltatory patterns, which was
unexpected. Saltatory patterns appear to be straighter, smoother and more equally distributed
with shorter SD. Apparent movement was mostly unaffected by SD. There was an interaction
between SD and ISI, such that for shorter SDs, judgments appear to be largely uninfluenced
by ISI, whereas for longer SDs, stimuli feel more evenly distributed for longer ISIs, which
was only significant for 250 Hz patterns (Experiment 1). For short SDs, discriminability
between successively activated and saltatory patterns seems poorer, although this trend is not
statistically significant. Additionally, preference for saltatory patterns is higher for short SDs,
when both patterns have to be compared in a forced-choice paradigm, but again this trend
failed to be statistically significant (Experiment 2). The same dependency of SD on
13 General summary and discussion
212
discriminability was found for the shorter array and for unilateral as well as for bilateral
placement of the array (Experiment 3). It seems that short SDs enhance the integration of
stimuli, especially for saltatory patterns. It is possible that with longer SDs, subjects’ ability to
spatially resolve the stimulus patterns enhances and enables them to perceive when saltatory
patterns are presented, single sites are activated twice.
Effect of number of stimuli We assumed that the spatial relatedness (that is spatial
proximity) of stimuli enhances their cortical integration, thus we expected that increasing the
number of stimulus sites (from 8 to 12) within an array of fixed length, thus decreasing the
distance between activated sites will lead to better quality judgments (Experiment 1). The
distance between activated tactors varied between 6- 9 cm for the 12 tactor array and 9-15 cm
for the 8 tactors array (depending on a subject’s waist circumference). Thus we exceed the
static two-point threshold (as a psychophysical measure of spatial resolution) which is about
35 mm on the belly and 40 mm on the back (Martin & Jessell, 1993), and which is even
lower, when the two touch stimuli are presented successively (Greenspan & Bolanowski,
1996).
While the number of tactors had no influence on the quality judgments of successively
activated patterns, in most cases, saltatory patterns containing 12 tactors produce better
quality judgments than saltatory patterns containing 8 tactors. It seems that we have exceeded
the minimum number of tactors which is needed to produce stable quality judgments for
successively activated patterns. But for saltatory patterns the inter-tactor distance (confounded
with the number of tactors), is still crucial for the range tested here, i.e. temporal resolution is
still affected. With only 8 tactors, subjects more likely recognize that stimuli are bundled at
certain locations in the saltatory pattern.
According to Cholewiak (1979) and Sherrick and Cholewiak (1986), increasing the
number of vibrators (while the intensity of vibration is held constant), results in an increase of
the sensory magnitude (vibrotactile loudness) in direct proportion. This effect is not altered by
changing the inter-vibrator distance at least in the range 1.5-10.5 cm. Using more tactors (12
instead of 8) might have had the secondary effect of increasing magnitude, which might have
also affected quality judgments.
As a second spatial parameter we varied stimulus width, by placing three tactors at each of
the 8 or 12 sites in a column, one above the other. We assume that three simultaneously
13 General summary and discussion
213
applied stimuli produce a single sensation located under the middle stimulator, which is more
intense than the sensation produced by a single stimulator alone (a phenomenon called
funneling; see e.g. Békésy, 1958 or Gardner & Constanzo, 1980b). In the first and second
experiment we tested if this funneled sensation (called “wider” stimulus) affects quality
judgments or discriminability.
We generally found that the effects of stimulus width were a function of the number of
tactors that were involved: Simulated movement produced by a 24-tactor array (three rows of
8 tactors) produced fewer significant effects than simulated movement produced by a 36-
tactor array (three rows of 12 tactors). Wide stimuli are mostly perceived as less straight, less
smooth, more evenly distributed and longer than the narrow stimuli. In most cases the effect
is the same for the two different stimulus patterns (successively and saltatory).
Although there is a tendency for wider stimuli to produce more similar percepts of
movement, we found only one significant result: Wider 80 Hz different pairs were less often
discriminated correctly. Stimulus width has no significant influence on subjects’ preference
for one stimulus pattern. It seems that the use of the more dense array (wider stimuli)
enhances the integration of stimuli, letting them “meld together” more easily.
Effect of vibration frequency Since previous studies have shown that vibration frequency
has only a minor effect on apparent motion (Sherrick, 1968a) or the saltatory illusion
(Cholewiak (reported by Geldard, 1982)), we did not expect to find any significant
differences in our measures of quality of movement (Experiment 1) nor in discrimination
performance (Experiment 2). But, contrary to our expectations, vibration frequency did affect
the perception of the different qualities of movement: 80 Hz stimuli are perceived to be less
straight, less smooth, more equally distributed in space and longer than 250 Hz stimuli. The
effect of frequency was generally the same for both stimulus patterns (successively activated
and saltatory). We explain these differences by appealing to Békésy’s (1967) observation, that
there is an increase in lateral spread of travelling waves produced by vibratory stimuli with
decreasing frequency. Since surface waves produced by 80 Hz stimuli travel further over the
skin, 80 Hz patterns might feel longer, because it is more likely that they activate distant
receptors. They might also feel more equally distributed, as single stimuli “meld together”. At
the same time 80 Hz patterns are perceived as less straight, since they are not as spatially
defined as 250 Hz stimuli and start to diverge from a straight path.
13 General summary and discussion
214
In the second experiment (part 1: “same-different”) we found that 250 Hz patterns feel
significantly more alike than 80 Hz patterns, whereas vibration frequency had no effect on
subjects’ preference for one stimulus pattern (part 2: “which is best”). It seems that spatial
resolution and therefore discriminability is better for low-frequency stimuli, which might be
explained by the different populations of mechanoreceptors that are activated by the two
vibration frequencies and their ability to resolve fine spatial detail. More experiments like the
one from Bensmaia et al. (2006), who measured spatial resolution via gap detection and found
a decrease with increasing vibration frequency over the range of 5-80 Hz), need to be done on
that issue, since the two standard measures of tactile acuity, two-point threshold and
localization error (which are both unaffected by frequency; see Greenspan & Bolanowski,
1996), are not sufficient to study spatial resolution (Johnson, van Boven & Hsaio, 1994).
Especially for hairy skin where “the relationship between hairy skin afferent fibers and tactile
perception is still largely unknown” (Greenspan & Bolanowski, 1996, p. 43) more
information is needed.
Effect of repetitive stimulation Repetitive spatiotemporal stimulation induces changes in
the cortical topography in area SI. These changes in turn are correlated to changes in
perception (see e.g. Stolle, 2003). We therefore asked if discriminability is affected by
repetitive stimulation (Experiment 2). According to Stolle (2003) the size of the stimulated
area decreases in perception after repeated stimulation. In addition, a decrease in point
localization was observed with repetitive stimulation, due to an integration of the stimulated
areas and a fusion of the representational cortical areas, whereas for simultaneously presented
stimuli, discriminability increases (Pleger et al., 2001; Stolle, 2003). Braun et al. (2000)
found, when fingers are stimulated in a fixed order (like in our experiment), the distance
between the cortical representations of these fingers decreased. We therefore hypothesized
that temporal resolution between successive stimuli might decrease with time (due to a fusion
of stimulated areas, decreased point localization); and thus disciriminability should be
impaired with stimulus repetition. Although we observed a marginal trend in the expected
direction (2-3% more “same” answers in the second run, when different stimulus patterns had
to be compared) the result was not statistically significant.
In most studies in the literature the fingers (or arm) were used as test site. Since fingers
are extensively used (and moved) for daily tasks, it seems advantageous that plastic changes
would occur quickly in order to adapt to the demands of specific stimulation and tasks. It is
13 General summary and discussion
215
possible that on the torso, which was the test site in our experiments, more stimulus
repetitions are required for plastic changes to occur, since for this body site which is rarely
used to explore the environment, adaptation processes may take more time. Future studies
might clarify the question if the time course of cortical reorganisation related to spatio-
temporal stimulation varies with body site.
Effect of attention Attention alters the perceived location of the mislocalized stimulus in
saltation (Kilgard and Merzenich, 1995). Also, cortical representations can shift
corresponding to the locus of attention (Braun et al., 2001; Noppeney et al., 1999). Such shifts
of activation due to selective attention occur within minutes (Iguchi, Hoshi, & Hashimoto,
2001).
In our second experiment we varied the response paradigm to evaluate if a shift of
attention affects subjects’ responses. Subjects had to distinguish between two stimulus
patterns–either indicating whether pairs of patterns were the same or different, or deciding
which of the two patterns was best in terms of straight, smooth, and evenly distributed
motion. Although subjects perceived different stimulus patterns (one successively activated,
the other one saltatory) as being the same in more than 65% of the trials, they preferred the
successively activated pattern over the saltatory pattern in nearly 70% of the trials. It seems
that by drawing subjects’ attention towards specific features of the spatio-temporal stimulus
patterns, they are able to make distinctions between the patterns, indicating possible shifts of
cortical activation due to selective attention.
Integration of stimuli presented on both body halves Geldard (1982) demonstrated that
saltatory areas are truncated at the body midline: When the two generating stimulators are
placed on either side of the body-midline, no saltation occurs. However Eimer et al. (2005)
provided evidence that a stimulus presented on one body-half can be attracted by a subsequent
stimulus presented on the other body-half. Auditory saltation travels the body-midline
(however at lower ISIs), in touch and in vision, it does not (Phillips & Hall, 2001).
Sherrick (1968b) found that apparent haptic movement qualitatively declined (more
partial movement was observed), when stimuli were presented bilaterally (on both forearms),
but the relation between SD and ISOI remained constant, compared to unilateral stimulation.
In the auditory sense, apparent motion is vivid when it crosses the body-midline (Strybel et
al., 1989), also in vision (Naikar & Corballis, 1996).
13 General summary and discussion
216
In our third experiment we used a 7-tactor array that spans half of the subjects’ waist and
varied the starting location of this array, so that either only one body-half was stimulated or
the array crossed the body-midline, activating both body-halves. We expected that illusory
movement generated by successively and saltatory stimulus patterns shouldn’t stop at the
body-midline since the cortex integrates perceptions from the two body-sites into an integral
whole, and thus subjects’ ability to discriminate between the two stimulus patterns should not
differ for unilateral (array placed on one body-site) and bilateral (array crosses body-midline)
presentation.
We found that discrimination performance is better for bilateral than for unilateral
stimulation. Thus, when successively activated and saltatory stimulus patterns both travel the
body-midline, the percepts they evoke seem to be degraded, which increases subjects’ ability
to distinguish between the patterns. It has to be noted however, that in more than 60% of the
trials, subjects could not differentiate between both patterns correctly, which is better than
chance. Discrimination performance for unilaterally-presented patterns differs by only
approximately 7% from discrimination performance for bilaterally presented patterns (when
only different pairs are considered).
To summarize, although crossing the body-midline seems to impair illusory percepts of
motion produced by successively and saltatory patterns, both patterns are still indiscriminable
in the majority of cases, indicating, that integration of spatio-temporal stimuli occurred over
the body-midline. This finding is in line with Eimer et al.’s (2005) result, that temporally
related stimuli attract each other over the body-midline, although the magnitude of attraction
might differ for unilateral and bilateral presentation.
Other psychophysical findings also support the notion that spatially and/or temporally-
related tactile stimuli are integrated over both body-halves:
- Masking also occurs, when stimuli are presented to different body halves (Sherrick &
Cholewiak, 1986), indicating that stimuli presented on both body-halves perceptually
interact.
- Enhancement and suppression effects (a conditioning stimulus enhances the sensation
magnitude of a test stimulus when ISI ranges between 100 and 500 ms and suppresses
sensation magnitude at very short ISIs < 100 ms), can not only be observed when both
stimuli are presented unilaterally, but also occur when stimuli are presented on
contralateral sides (Gescheider & Verrillo, 1982).
13 General summary and discussion
217
- Stimuli simultaneously presented at multiple sites produce a more intense tactile
perception localized to only one site of stimulation–a phenomenon called funneling (see
Greenspan & Bolanowski, 1996, p.53; compare also: Békésy, 1958, 1967; Gardner &
Constanco, 1980b,c; Gardner & Spencer, 1972)−even when stimuli are widely spread or
bilaterally presented.
All these findings suggest that the integration of spatio-temporal stimuli does not happen
peripherally, but must require some degree of central involvement. The question remains if
the temporal conditions for the integration of stimuli differs, when they are presented
unilaterally and bilaterally.
Geffen et al. (1996) demonstrated that bimanual simultaneity thresholds are higher than
unimanual simultaneity thresholds (minimum ISI at which the observer can perceive that two
stimuli have occurred separately). Such judgments, of whether two stimuli are presented
successively rather than simultaneously, are based upon the detection of inferred motion: If no
motion is detected, then a judgment of simultaneity is made. In the bimanual condition,
thresholds are assumed to be higher due to interhemispheric transmission time: The time
needed to cross hemispheres increases the ISI required for subjects to perceive the two stimuli
separately.
Visual inspection of Figure 12.6 (Effect of ISI on the percentage of “same” answers for
the different positions of the 7-tactor array), shows that for unilateral presentation (positions
right and left) discriminability increases (fewer “same” judgments for different stimulus
patterns) for ISI>64 ms. For bilateral presentation (positions front and back), this increase is
barely noticeable, probably occurring only at higher ISIs. Thus, it seems that larger ISIs are
required for bilateral patterns to be spatially resolved and discriminated correctly, which is in
line with Geffen et al.’s (1996) finding.
Variability in subjects’ performance and correlation with vibratory threshold In all our
experiments, we found large variations in subjects performance: Their quality judgments of
simulated movement (Experiment 1) showed large interindividual differences as well as their
ability to discriminate between tactile stimulus patterns (Experiments 2 and 3). One could
hypothesize, that some subjects are more “sensitive” (and thus have lower vibration
thresholds) to tactile stimulation than others.
Large individual differences exist in the ability to perform tactile pattern perceptions
tasks, even for simple tasks, as reported by Cholewiak and Collins (1997; see also Cholewiak,
13 General summary and discussion
218
Sherrick, & Collins, 1992): Discrimination performance between the letters X and O,
presented on the OPTACON ranged between about 50-90 %, after subjects had some training
in identifying the patterns. When performance was poor in the identification task, it was also
poor in a discrimination and masking task. No correlation between vibratory threshold
measure and performance was found. Similarly, when vibrotactile thresholds are measured
over a relatively homogeneous population of college students, the range is found to be as
much as 20 dB (a 10-fold difference) between the least and most sensitive subjects
(Cholewiak, Sherrick & Collins, 1992; Fig 52-2).
In Experiment 2 we measured discrimination performance: The percentage of correct
discriminations varied between 50 and 75 % in the 80 Hz group, and between 51 and 84 % in
the 250 Hz group (note: Cholewiak & Collins, 1997, used a corrected-percent-correct value
that minimizes the effects of response biases, but this value only differed by 2% from percent
correct obtained from the raw data). Since our discrimination task is supposedly more
complex than that of Cholewiak and Collins (1997), the maximum percentage of correct
answers is lower in our experiment. But similar to their study, in our study, threshold does not
correlate with discrimination performance (in our experiments, two sessions were conducted,
in the beginning of each session vibratory threshold was measured; for details see
corresponding chapter; correlations were calculated between threshold and percent correct
discriminations: 80 Hz: session 1: Pearson correlation r=.05; session 2: r=-.04; 250 Hz:
session1: r=-.08; session 2: r=-.23; although there is a tendency that subjects with lower
thresholds obtain more correct answers, this trend is far from being significant). In an attempt
to find subject characteristics contributing to successful pattern perception Cholewiak et al.
(1992) discovered that neither gender nor handedness could predict pattern-perception
performance, only a measure of imagery (geometric puzzle that had to be fit together)
correlated with pattern perception.
It is also possible that the large individual variations are due to differences in subjects’
perceptual maps of their waistline (perceptual maps are subjectively perceived somatotopic
maps of stimulation, as described by Trojan et al., 2006). Trojan et al. (2006) asked subjects
to perform a localization task, using a CO2 laser and found that the perceptual space was
either expanded or reduced or dislocated in one or the other direction. Thus, maybe
differences in body perception (that can be psychophysically measured as perceptual maps)–
e.g. if subjects consider themselves as being overweight−account for the large individual
variations. Recently Schaefer, Flor, Heinze, and Rotte (2007) have demonstrated that changes
in the perception of body size (in this study the use of an artificial hand elicited the illusory
13 General summary and discussion
219
feeling of an elongated arm) lead to dynamic changes in SI (reduced representational
distances of two finger digits of the elongated arm that were stimulated with pneumatically
driven tactors). That such bodily illusions in turn affect tactile perception was shown by de
Vignemont, Ehrsson, and Haggard (2005): Creating the illusion of an elongated finger caused
an increase in length judgments of two simultaneously applied tactile stimuli. The authors
reason that “tactile perception of an external stimulus is mediated by the proprioceptive
representation if the body part that is touched” (de Vignemont, 2005; p. 1286). Disturbances
of the body image also occur, when afferent input increases: Perceived size of the thumb
increased after electrical stimulation (Gandevia & Phegan, 1999). Factors like differences in
individual body maps and elongated peripheral stimulation might have affected our results.
Conclusions In our experiments we generated illusory movement with a vibrotactile array
around the torso, using two stimulus patterns: Saltation and successive activation. Both
patterns are indiscriminable–indicating that a similar cortical filling-in process occurred−at
short SDs. ISI does not affect discriminability, at least in range that we tested (~10-130 ms).
Short inter-stimulus distances improve the integration of saltatory patterns. Our results are in
line with neural network models (Wiemer et al., 1998, 2000), stating that temporal and spatial
relatedness of stimuli, lead to an integration of cortical representations. Although adaptive
changes in somatosensory cortex can occur within minutes with repetitive spatio-temporal
stimulation (e.g. Stolle, 2003), we didn’t find an effect of repeated stimulation on
discriminability, probably because on lesser innervated and lesser used body-sites like the
trunk, the temporal course of plastic changes is longer.
As a result of our experiments, we assume that spatio-temporal integration requires the
involvement of higher cortical areas (SII), where the somatotopy is less fine-grained (e.g. the
second and fifth finger of the right hand have overlapping representational areas, in contrast
to SI; see Ruben et al., 2001)–which might explain the poor discriminability between
successively and saltatory patterns−and the contralateral as well as the ipsilateral body sites
are somatotopically represented (which would explain findings of Experiment 3: For bilateral
stimulation the percentage of incorrect responses exceeded 60%, which is significantly more
than chance). Although the filling-in process that produces illusory percepts of motion or the
saltatory illusion seems to occur in early cortices (Blankenburg et al., 2006; Larsen et al.,
2006), the computation of the path of motion apparently involves higher-level cortical areas.
13 General summary and discussion
220
Our experiments might also shed further light on cutaneous spatial resolution. Johnson et
al. (1994): “… other methods [than two-point threshold] based on the identification of many
complex spatial forms have several desirable properties for the measurement of spatial
resolution” (p. 400), as the large number of stimuli forces subjects to focus on the spatial
structure of the neural image, not on nonspatial cues.
Our results extend the findings of Cholewiak and Collins (2000) who examined different
body sites (finger, forearm, and back) using the same experimental design as we did in
Experiments 1 and 2. Yet, a notable difference between the two studies is that their arrays
always had distinctive endpoint, being constructed of a linear array of 7 tactors, while ours
often involved circular arrays that surrounded the abdomen. Although the effect of the timing
parameters on the quality judgments and discriminability differed slightly in their and our
experiment, both studies indicate a strong equivalence of the percepts evoked by successive
and saltatory stimulation within the spatio-temporal parameters examined.
From the perspective of application, our findings may contribute to the design of tactile
torso displays like TSAS (see Chapter 1). The spatio-temporal parameters used in our study
were found to be feasible for generating vectors on the skin, that can be used, for example, to
indicate direction of motion. The saltatory illusion can also be advantageous in this respect, as
fewer activated sites and thus fewer tactors–producing savings in costs and weight–are needed
to generate vibrotactile lines.
References
221
References
Békésy, G. von (1958). Funneling in the nervous system and its role in loudness and sensation
intensity on the skin. Journal of the Acoustical Society of America, 30, 399-412.
Békésy, G. von (1967). Sensory inhibition. Princeton, New Jersey: Princeton University
Press.
Bensmaia, S.J., Craig, J.C. & Johnson, K.O. (2006). Temporal factors in tactile spatial acuity:
Evidence for RA interference in fine spatial processing. Journal of Neurophysiology, 95
(3), 1783-91.
Blake, D.T., Strata, F., Kempter, R. & Merzenich, M.M. (2005). Experience-Dependent
Plasticity in SI Caused by Noncoincident Inputs. Journal of Neurophysiology, 94, 2239-
2250.
Blankenburg, F., Ruff, C.C., Deichmann, R., Rees, G. & Driver, J. (2006). The cutaneous
rabbit illusion affects human primary sensory cortex somatotopically. PloS Biology, 4,
369.
Boehnke, S.E. & Phillips, D.P. (2005). Auditory saltation in the vertical midsagittal plane.
Perception, 34, 371-377.
Bolanowski, S.J., Gescheider, G.A. & Verrillo, R.T. (1994). Hairy Skin: Psychophysical
Channels and Their Physiological Substrates. Somatosensory and Motor Research, 11 (3),
279-290.
Bolanowski, S.J., Gescheider, G.A., Verrillo, R.T. & Checkosky, C.M. (1988). Four channels
mediate the mechanical aspects of touch. Journal of the Acoustical Society of America, 84
(5), 1680-1694.
Bortz, J. (1999). Statistik für Sozialwissenschaftler (5., vollständig überarbeitete Aufl.).
Berlin: Springer.
References
222
Bortz, J., Lienert, G.A. & Boehnke, K. (2000). Verteilungsfreie Methoden in der Biostatistik.
Berlin: Springer.
Brassel, S.E. (1993). Visual Saltation Illusion: A model relating prolonged neuronal timing,
potentiation deficits, and memory impairment in chronic male schizophrenics (Doctoral
dissertation, Long Island University, The Brooklyn Center, 1993). Dissertation Abstracts
International, 53 (12-B), 6148.
Braun, C., Haug, M., Wiech, K. & Birbaumer N. (2001). Selective attention modulates
somatosensory cortex organization. Neuroimage, 13, 1134.
Braun, C., Wilms, A., Schweitzer, R., Godde, B., Preissl, H. & Birbaumer, N. (2000).
Activity patterns of human somatosensory cortex adapt dynamically to stimulus
properties. NeuroReport, 11 (13), 2977-2980.
Bremer, C.D., Pittenger, J.B., Warren, R. & Jenkins, J.J. (1977). An illusion of auditory
saltation similar to the cutaneous rabbit. American Journal of Psychology, 90 (4), 645-
654.
Briggs, R.M. & Perrott, D.R. (1972). Auditory apparent movement under dichotic listening
conditions. Journal of Experimental Psychology, 92 (1), 83-91.
Burtt, H.E. (1917a). Auditory illusions of movement – A preliminary study. Journal of
Experimental Psychology, 2, 63-75.
Burtt, H.E. (1917b). Tactual illusions of movement. Journal of Experimental Psychology, 2,
371-385.
Chen, L.M., Friedman, R.M. & Roe, A.W. (2003). Optical Imaging of a Tactile Illusion in
Area 3b of the Primary Somatosensory Cortex. Nature, 302, 881-885.
Cholewiak, R.W. (1979). Spatial factors in the perceived intensity of vibrotactile patterns.
Sensory Processes, 3, 141-156.
References
223
Cholewiak, R.W. (1999). The perception of tactile distance: Influences of body site, space,
and time. Perception, 28, 851-875.
Cholewiak, R.W., Brill, J.C. & Schwab, A. (2004). Vibrotactile Localization On The
Abdomen: Effects Of Place And Space. Perception & Psychophysics, 66, 970-987.
Cholewiak, R.W. & Collins, A.A. (1991). Sensory and physiological bases of touch. In M.A.
Heller & W.R. Schiff (Eds.), The Psychology of Touch (pp. 23-60). Hillsdale, N. J.:
Lawrence Erlbaum Associates.
Cholewiak, R.W. & Collins, A.A. (1997). Individual differences in the vibrotactile perception
of a “simple” pattern set. Perception & Psychophysics, 59 (6), 850-866.
Cholewiak, R.W. & Collins, A.A. (2000). The generation of vibrotactile patterns on a linear
array: Influences of body site, space, and time. Perception & Psychophysics, 62 (6), 1220-
1235.
Cholewiak, R.W. & Collins, A.A. (2003). Vibrotactile localization on the arm: Effects of
place, space, and age. Perception & Psychophysics, 65 (7), 1058-1077.
Cholewiak, R.W., Collins, A.A. & Brill, J.C. (n.d.). Spatial Factors in Vibrotactile Pattern
Perception. Retrieved December 8, 2007, from http://www.eurohaptics.vision.ee.ethz.ch/
2001/cholewiak.pdf
Cholewiak, R.W., Sherrick, C.E. & Collins, A.A. (1992). Princeton Cutaneous Research
Project (Report #60). Unpublished manuscript, Princeton University, Department of
Psychology.
Cohen, J., Hansel, C.E.M. & Sylvester, J.D. (1955). Interdependence in judgments of space,
time, and movement. Acta Psychologica, 11, 360-372.
Costanzo, R. & Gardner, E.P. (1980). A Quantitative Analysis of Responses of Direction-
Sensitive Neurons in Somatosensory Cortex of Awake Monkeys. Journal of
Neurophysiology, 43 (5), 1319-1341.
References
224
Deutsche Gesellschaft für Psychologie. (2007). Richtlinien zur Manuskriptgestaltung (3.,
überabeitete und erweiterte Aufl.). Göttingen: Hogrefe Verlag.
De Vignemont, F., Ehrsson, H.H. & Haggard, P. (2005). Bodily Illusions Modulate Tactile
Perception. Current Biology, 15, 1286-1290.
Eimer, M., Forster, B. & Vibell, J. (2005). Cutaneous saltation within and across arms: A new
measure of the saltation illusion in somatosensation. Perception & Psychophysics, 67 (3),
458-468.
Essick, G.H. (1998). Factors affecting direction discrimination of moving tactile stimuli. In
J.W. Morley (Ed.), Neural aspects in tactile sensation (pp. 1-54), Amsterdam: Elsevier.
Essick, G.K. & Edin, B.B. (1995). Receptor Encoding of Moving Tactile Stimuli in Humans.
II. The Mean Response of Individual Low-Threshold Mechanoreceptors to Motion Across
the Receptive Field. The Journal of Neuroscience, 15 (1), 848-864.
Essick, G.K., Franzen, O., McMillian, A. & Whitsel, B. (1991). Utilization of temporal and
spatial cues to judge the velocity and traverse length of a moving tactile stimulus. In: O.
Franzen & J. Westman (Eds.), Information Processing in the Somatosensory System, (pp.
341-352), New York NY: Stockton.
Essick, G.K. & Whitsel, B.L. (1985). Factors influencing cutaneous directional sensitivity: A
correlative psychophysical and neurophysiological investigation. Brain Research Review,
10, 213-230.
Essick, G.K., Whitsel, B.L., Dolan, P.J. & Kelly, D.G. (1989). Effects of traverse length on
human perioral directional sensitivity. Journal of Neurological Science, 93, 175-190.
Flor, H., Denke, C., Scheafer, M. & Grüsser, S. (2001). Effect of sensory discrimination
training on cortical reorganisation and phantom limb pain. The Lancet, 357, 1763-1764.
References
225
Friedman, R.M., Chen, L.M. & Roe, A.W. (2004). Modality maps within primate somato-
sensory cortex [Electronic version]. Proceedings of the National Academy of Sciences of
the United States of America, 101 (34), 12724-12729.
Fuchs, J.L. & Brown, P.B. (1984). Two-point discriminability: Relation to Properties of the
Somatosensory System. Somatosensory Research, 2 (2), 163-169.
Gandevia, S.C. & Phegan, C.M.L. (1999). Perceptual distortions of the human body image
produced by local anaestesia, pain and cutaneous stimulation. Journal of Physiology, 514
(2), 609-616.
Gardner, E.P. & Constanzo, R.M. (1980a). Neuronal mechanisms underlying direction
sensitivity of somatosensory cortical neurons in alert monkeys. Journal of Neuro-
physiology, 43, 1342-1354.
Gardner, E.P. & Constanzo, R.M. (1980b). Spatial integration of multiple-point stimuli in
primary somatosensory cortical receptive fields of alert monkeys. Journal of
Neurophysiology, 43, 420-443.
Gardner, E.P. & Constanzo, R.M. (1980c). Temporal integration of multiple-point stimuli in
primary somatosensory cortical receptive fields of alert monkeys. Journal of
Neurophysiology, 43, 444-468.
Gardner, E.P. & Palmer, C.I. (1989a). Simulation of Motion on the Skin. I. Receptive Fields
and Temporal Frequency Coding by Cutaneous Mechanoreceptors of OPTACON Pulses
Delivered to the Hand. Journal of Neurophysiology, 62 (6), 1410-1436.
Gardner, E.P. & Palmer, C.I. (1989b). Simulation of Motion on the Skin. II. Cutaneous
Mechanoreceptor Coding of the Width and Texture of Bar Patterns. Journal of
Neurophysiology, 62 (6), 1437-1460.
References
226
Gardner, E.P., Palmer, C.I., Hämäläinen, H.A. & Warren, S. (1992). Simulation of Motion on
the Skin. V. Effect of Stimulus Temporal Frequency on the Representation of Moving Bar
Patterns in Primary Somatosensory Cortex of Monkeys. Journal of Neurophysiology, 67
(1), 37-63.
Gardner, E.P. & Sklar, B.F. (1986). Factors influencing discrimination of direction of motion
on the human hand. Society of Neuroscience Abstr., 12, 798.
Gardner, E.P. & Sklar, B.F. (1994). Discrimination of the direction of motion on the human
hand: A psychophysical study of stimulation parameters. Journal of Neurophysiology, 71
(6), 2414-2429.
Gardner, E.P. & Spencer, W.A. (1972). Sensory funneling I: Psychophysical Observations of
Human Subjects and Responses of Cutaneous Mechanoreceptive Afferents in the Cat to
Patterned Skin Stimuli. Journal of Neurophysiology, 35, 925-953.
Geffen, G., Mason, C., Butterworth, P., Mclean, S. & Clark, C.R. (1996). Tactile simultaneity
thresholds within and between hemispheres: The effect of hemispace. Cognitive Neuro-
psychology, 13 (2), 257-276.
Geldard, F.A. (1975). Sensory Saltation: Metastability in the Perceptual World. Hillsdale,
New Jersey: Lawrence Erlbaum Associates.
Geldard, F.A. (1976). The Saltatory Effect in Vision. Sensory Process, 1, 77-86.
Geldard, F.A. (1982). Saltation in Somesthesis. Psychological Bulletin, 92 (1), 136-175.
Geldard, F.A. (1985). The mutability of time and space on the skin. Journal of the Acoustical
Society of America, 77 (1), 233-237.
Geldard, F.A. & Sherrick, C.E. (1972). The Cutaneous „Rabbit“: A Perceptual illusion.
Science, 178, 178-179.
References
227
Geldard, F.A. & Sherrick, C.E. (1983). The cutaneous saltatory area and its presumed neural
basis. Perception & Psychophysics, 33 (4), 299-304.
Geldard, F.A. & Sherrick, C.E. (1986). Space, Time and Touch. Scientific American, 254 (7),
90-95.
Gemperle, F., Ota, N. & Siewiorek, D. (2001, October 7-9). Design of a wearable Tactile
Display. Paper presented at the 2001 International Symposium of Wearable Computers,
Zurich. Retrieved May 21, 2007, from http://www.wearablegroup.org/publications/tactile-
display.pdf
Gescheider, G.A. & Verrillo, R.T. (1982). Contralateral enhancement and suppression of
vibrotactile sensation. Perception & Psychophysics, 32 (1), 69-74.
Getzmann, S. (2007). Saltation in pitch perception. Experimental Brain Research, 179 (4),
571-581.
Getzmann, S., Lewald, J. & Guski, R. (2004). Representational momentum in spatial hearing.
Perception, 33, 591-599.
Gilmer, B.H. (1935). The measurement of the sensitivity of the skin to mechanical vibration.
Journal of experimental psychology, 13, 42-61.
Goble, A.K., Collins, A.A. & Cholewiak, R.W. (1996). Vibrotactile thresholds in young and
old observers: The effect of spatial summation and the presence of a rigid surround.
Journal of the Acoustical Society of America, 99 (4), 2256-2.
Godde, B., Ehrhardt, J. & Braun, C. (2003). Behavioral significance of input-dependent
plasticity of human somatosensory cortex. NeuroReport, 14 (4), 543-546.
Godde, B., Spengler, F. & Dinse, H.R. (1996). Associative pairing of tactile stimulation
induces somatosensory cortical reorganization in rats and humans. Neuroreport: An
International Journal for the Rapid Communication of Research in Neuroscience, 8 (1),
281-285.
References
228
Gonzales, G.R., Lewis, S.A. & Weaver, A.L. (2001). Tactile illusion perception in patients
with central pain. Mayo Clinic Proceedings, 76, 267-274.
Greenlee, M.W. (2000). Human cortical areas underlying the perception of optic flow: Brain
imaging studies. International Review of Neurobiology, 44, 269-292.
Greenspan, J.D. (1992). Influence of velocity and direction of surface-parallel cutaneous
stimuli on responses of mechanoreceptors in feline hairy skin. Journal of
Neurophysiology, 68 (3), 876-89.
Greenspan, J.D. & Bolanowski, S.J. (1996). The Psychophysics of Tactile Perception and Its
Peripheral Physiological Basis. In L. Kruger (Ed.), Pain and Touch (pp. 25-104). San
Diego, CA: Academic Press, Inc.
Halnan, C.R.E. & Wright, G.H. (1960). Tactile localization. Brain, 83, 677-700.
Hamalainen, H.A., Warren, S. & Gardner, E.P. (1985). Differential sensitivity to airpuffs on
human hairy and glabrous skin. Somatosensory Research, 2 (4), 281-302.
Hari, R. (1995). Illusory directional hearing in humans. Neuroscience Letters, 189, 29-30.
Hegner, Y., Wiech, K., Preissl, H. & Braun, C. (2006). Do cortical maps depend on the timing
of sensory input? Experimental evidence and computational model. Biological
Cybernetics, 94, 110-117.
Ho, C., Tan, H.Z. & Spence, C. (2005). Using spatial vibrotactile cues to direct visual
attention in driving scenes. Transportation Research Part F: Traffic Psychology and
Behavior, 8, 397-412.
Hsiao, S., Johnson, K. & Yoshioka, T. (2003). Processing tactile information in the primate
brain. In: R.J. Nelson & M. Gallagher (Eds.), Handbook of Psychology: Biological
Psychology, Vol. 3 (pp. 211-236). New York NY: John Wiley & Sons Inc.
References
229
Hubbart, T.L. (2005). Representational momentum and related displacements in spatial
memory: A review of findings. Psychonomic Bulletin & Review, 12 (5), 822-851.
Hubbart, T.L. & Motes, M.A. (2002). Does representational momentum reflect a distortion of
the length of the trajectory or the endpoint of a trajectory? Cognition, 82, B89-B99.
Ide, H., Akimura, H. & Obata, S. (1985). Effect of skin temperature on vibrotactile
sensitivity. Medical & Biological Engineering & Computing, 23, 306-310.
Iguchi, Y., Hoshi, Y. & Hashimoto, I. (2001). Selective spatial attention induces short-term
plasticity in human somatosensory cortex. NeuroReport, 12 (14), 3133-3136.
Itomi, K., Kakigi, R., Meada, K. & Hoshiyama, M. (2000). Dermatome versus homunculus:
Detailed topography of the primary somatosensory cortex following trunk stimulation.
Clinical Neurophysiology, 111, 405-412.
Johansson, R.S. (1978). Tactile sensibility in the human hand: Receptive field characteristics
of mechanoreceptive units in the glabrous skin area. Journal of Physiology, 281, 101-123.
Johansson, R.S. & Vallbo, A.B. (1979). Detection of tactile stimuli. Thresholds of afferent
units related to psychophysical thresholds in the human hand. Journal of Physiology, 297,
405-422.
Johnson, K.O. (2001). The roles and functions of cutaneous mechanoreceptors. Current
Opinion in Neurobiology, 11, 455-481.
Johnson, K.O. & Hsiao, S.S. (1992). Neural mechanisms of tactual form and texture
perception. Annual Review of Neuroscience, 15, 227-250.
Johnson, K.O. & Lamb, G.D. (1981). Neural mechanisms of spatial tactile discrimination:
Neural patterns evoked by Braille-like dot patterns in the monkey. Journal of Physiology,
310, 117-144.
References
230
Johnson, K.O., Van Boven, R.W. & Hsiao, S.S. (1994). The Perception of Two Points is Not
the Spatial resolution threshold. In: J. Boivie, P. Hansson & U. Lindblom (Eds.), Touch,
Temperature, and Pain in Health and Disease:Mechanisms and Assessment, Progress in
Pain Research and Management, Vol. 3 (pp. 389- 404). Seattle: IASP Press.
Johnson, K.O., Yoshioka, T. & Vega-Bermudez, F. (2000). Tactile Functions of
Mechanoreceptive Afferents Innervating the Hand. Journal of Clinical Neurophysiology,
17 (6), 539-558.
Joublin, F., Spengler, F., Wacquant, H.R. & Dinse, H.R. (1996). A columnar model of
somatosensory plasticity based on Hebbian and non-Hebbian learning rules. Biological
Cybernetics, 74, 275-286.
Kaas, J.H. (1983). What, if anything, is SI? Organization of first somatosensory area of
cortex. Physiological Reviews, 63 (1), 206-231.
Kaas, J.H., Nelson, R.J., Sur, M., Lin, C.-S. & Merzenich, M.M. (1979). Multiple
representations of the body within the primary somatosensory cortex of primates. Nature,
204, 521-523.
Kajimoto, H., Kawakami, N., Maeda, T. & Tachi, S. (2001). Electro-Tactile Display with
Force Feedback. Retrieved May 25, 2007, from www.star.t.u-tokyo.ac.jp
Kaneoke, Y., Bundou, M., Koyama, S., Suzuki, H. & Kakigi, R. (1997). Human cortical area
responding to stimuli in apparent motion. NeuroReport, 8, 677-682.
Karnath, H.O., Schenkel, P. & Fischer, B. (1991). Trunk orientation as the determining factor
of the “contralateral” deficit in the neglect syndrome and as the physical anchor of the
internal representation of body orientation in space. Brain, 114 (4), 1997-2014.
Kawakami, O., Kaneoke, Y. & Kakigi, R. (2000). Perception of apparent motion is related to
the neural activity in the human extrastriate cortex as measured by
magnetoencephalography. Neuroscience Letters, 285, 135-138.
References
231
Kerzel, D. (2003). Attention maintains mental extrapolation of target position: Irrelevant
distractors eliminate forward displacement after implied motion. Cognition, 88, 109-131.
Kidd, J.C. & Hogben, J.H. (2004). Quantifying the auditory saltation illusion: An objective
psychophysical methodology. Journal of the Acoustical Society of America, 116 (2),
1116-1122.
Kilgard, M.P. & Merzenich, M.M. (1995). Anticipated stimuli across skin. Nature, 373, 663.
Kirman, J.H. (1974a). Tactile apparent movement: The effects of number of stimulators.
Journal of Neurophysiology, 103 (6), 1175-1180.
Kirman, J.H. (1974b). Tactile apparent movement: The effects of interstimulus onset interval
and stimulus duration. Perception & Psychophysics, 15 (1), 1-6.
Kirman, J.H. (1975). The effect of number of stimulators on the optimal interstimulus onset
interval in tactile apparent movement. Perception & Psychophysics, 17 (3), 263-267.
Kirman, J.H. (1983). Tactile apparent movement: The effects of shape and type of motion.
Perception & Psychophysics, 34 (1), 96-102.
Kohn, A. & Whitsel, B.L. (2002). Sensory cortical dynamics. Behavioral Brain Research,
135, 119-126.
Kontarinis, D.A. & Howe, R.D. (1995). Tactile Display of Vibratory Information in
Teleoperation and Virtual Environments. Presence, 44 (4), 387-402.
Krause, T., Kurth, R., Ruben, J., Schwiemann, J., Villringer, K., Deuchert, M. et al. (2001).
Representational overlap of adjacent fingers in multiple areas of human primary
somatosensory cortex depends on electrical stimulus intensity: an fMRI study. Brain
Research, 899, 36-46.
References
232
Lakatos, S. & Shepard, R.N. (1997). Constrains Common to Apparent Motion in Visual,
Tactile, and Auditory Space. Journal of Experimental Psychology: Human Perception and
Performance, 23 (4), 1050-1060.
Langford, N., Hall, J. & Monty, R.A. (1973). Cutaneous Perception of a Track Produced by a
Moving Point across the Skin. Journal of Experimental Psychology, 97 (1), 59-63.
Larsen, A., Kyllingsbæk, S., Law, I. & Bundesen, C. (2005). Activation in the MT-complex
during visual perception of apparent motion and temporal succession. Neuropsychologia,
43, 1060-1071.
Larsen, A., Madsen, K.H., Lund, T.E. & Bundesen, C. (2006). Images of Illusory Motion in
Primary Visual Cortex. Journal of Cognitive Neuroscience, 18 (7), 1174-1180.
Levitt, H. (1971). Transformed Up-Down Methods in Psychoacoustics. Journal of the
Acoustical Society of America, 49 (2), 467-477.
Lloyd, D.M., Bolanowski, S.J., Howard, L. & McGlone, F. (1999). Mechanisms of attention
in touch. Somatosensory and Motor Research, 16 (1), 3-10.
Lockhead, G.R., Johnson, R.C. & Gold, F.M. (1980). Saltation through the blind spot.
Perception & Psychophysics, 27 (6), 545-549.
Maeda, K., Kakigi, R., Hoshiyama, M. & Koyama, S. (1999). Topography of the somato-
sensory cortex in humans: A magnetoencephalographic study. NeuroReport 10, 301-306.
Mahns, D.A., Perkins, N.M., Sahai, V., Robinson, L. & Rowe, M.J. (2006). Vibrotactile
frequency discrimination in human hairy skin. Journal of Neurophysiology, 95, 1442-
1450.
Maldjian, J.A., Gottschalk, A., Patel, R.S., Pincus, D., Detre, J.A. & Alsop, D.C. (1999).
Mapping of secondary somatosensory cortex activation induced by vibrational
stimulation: an fMRI study. Brain Research, 824 (2), 291-295.
References
233
Martin, J.H. & Jessell, T.M. (1993). Modality Coding in the Somatic Sensory System. In E.R.
Kandel, J.H. Schwartz & T.M. Jessell (Eds.), Principles of neural science (pp. 341-352).
Norwalk, Conn.: Appleton & Lange.
Meng, M., Remus, D.A. & Tong, F. (2005). Filling-in of visual phantoms in the human brain.
Nature Neuroscience, 8 (9), 1248-1254.
Merzenich, M.M., Kaas, J.H., Wall, J., Nelson, R.J., Sur, M. & Felleman, D. (1983).
Topographic reorganization of somatosensory cortical areas 3b and 1 in adult monkeys
following restricted deafferentation. Neuroscience, 8 (1), 33-55.
Mrsic, A., Hölzl, R., Kleinböhl, D., Stolle, A.M. & Tan, H.Z. (2004, January/February).
Sensory saltation on the abdomen. Poster presented at the 7th Tübingen Perception
Conference 2004, Tübingen.
Muckli, L., Kriegeskorte, N., Lanfermann, H., Zanella, F., Singer, W. & Goebel, R. (2002).
Apparent Motion: Event-related Functional Magnetic Resonance Imaging of Perceptual
Switches and States. The Journal of Neuroscience, 22, RC219, 1-5.
Nagai, M. & Saiki, J. (2005). Illusory movement and representational momentum. Perception
& Psychophysics, 67 (5), 855-866.
Naikar, N. & Corballis, M.C. (1996). Perception of apparent motion across the retinal midline
following commissurotomy. Neuropsychologia, 34 (4), 297-309.
Noppeney, U., Waberski, T.D., Gobbelé, R. & Buchner, H. (1999). Spatial attention
modulates the cortical somatosensory representation of the digits in humans.
NeuroReport, 10, 3137-3141.
Page, E.B. (1963). Ordered hypothesis for multiple treatments: A significance test for linear
ranks. Journal of the American Statistical Association, 58, 216-230.
Phillips, D.P. & Hall, S.E. (2001). Spatial and temporal factors in auditory saltation. Journal
of the Acoustical Society of America, 110 (3), 1539-1547.
References
234
Phillips, D.P., Hall, S.E., Boehnke, S.E. & Rutherford, L.E.D. (2002). Spatial stimulus cue
information supplying auditory saltation. Perception, 31, 875-885.
Pleger, B., Dinse, H.R., Ragert, P., Schwenkreis, P., Malin, J.P. & Tegenthoff, M. (2001).
Shifts in cortical representations predict human discrimination improvement [Electronic
version]. Proceedings of the National Academy of Sciences of the United States of
America, 98 (21), 12255-12260.
Polley, D.B., Steinberg, E.E. & Merzenich, M.M. (2006). Perceptual Learning Directs
Auditory Cortical Map Reorganization through Top-Down Influences. Journal of
Neuroscience, 26 (18), 4970-4982.
Ramachandran, V.S. & Anstis, S.M. (1986). The Perception of Apparent Motion. Scientific
American, 254 (6), 80-87.
Rauschecker (1995). Compensatory plasticity and sensory substitution in the cerebral cortex.
Trends in Neurosciences, 18 (1), 36-43.
Recanzone, G.H., Schreiner, C.E. & Merzenich, M.M. (1993). Plasticity in the Frequency
Representation of Primary Auditory Cortex following Discrimination Training in Adult
Owl Monkeys. Journal of Neuroscience, 13 (1), 87-109.
Rochlis, J.L. & Newman, D.J. (2000). A tactile display for International Space Station (ISS)
Extra Vehicular Activity (EVA). Aviation, Space, and Environmental Medicine, 71, 571-
578.
Ruben, J., Schwiemann, J., Deuchert, M., Meyer, R., Krause, T., Curio, G. et al. (2001).
Somatotopic Organization of Human Secondary Somatosensory Cortex. Cerebral Cortex,
11, 463-473.
Rupert, A.H. (2000). Tactile Situation Awareness System: Proprioceptive Prostheses for
Sensory Deficiencies. Aviation, Space, and Environmental Medicine, 71 (9), A92-A99.
References
235
Sarris, V. (1989). Max Wertheimer on seen motion: Theory and evidence. Psychological
Research, 51, 58-68.
Schaefer, M., Flor, H., Heinze, H.J. & Rotte, M. (2007). Morphing the body: Illusory feelings
of an elongated arm affects somatosensory humunculus. NeuroImage, 36 (3), 700-705.
Schiffmann, H.R. (1996). Sensation and Perception: An integrated Approach (4th ed.). New
York NY: John Wiley & Sons, Inc.
Sherrick, C.E. (1953). Variables affecting sensitivity of the human skin to mechanical
vibration. Journal of Experimental Psychology, 45 (5), 273-282.
Sherrick, C.E. (1968a). Apparent haptic movement. In D. Kenshalo (Ed.), The Skin Senses
(pp. 331-344). Springfield, Ill.: Thomas.
Sherrick, C.E. (1968b). Bilateral apparent haptic movement. Perception & Psychophysics, 4
(3), 159-160.
Sherrick, C.E. & Cholewiak, R.W. (1986). Cutaneous Sensitivity. In K.R. Boff, L. Kaufmann
& J.P. Thomas (Eds.), Handbook of Perception and Human Performance, Vol. I, Sensory
Processes and Perception (pp. 12-2 – 12-58). New York NY: John Wiley and Sons.
Sherrick, C.E., Cholewiak, R.W. & Collins, A.A. (1990). The localization of low- and high-
frequency vibrotactile stimuli. Journal of the Acoustical Society of America, 88 (1), 169-
179.
Sherrick, C.E. & Rogers, R. (1966). Apparent haptic movement. Perception & Psychophysics,
1, 175-180.
Shore, D.I., Hall, S. & Klein, R.M. (1998). Auditory saltation: A new measure for an old
illusion. Journal of the Acoustical Society of America, 103 (6), 3730-3733.
Sparks, W. (1979). The identification of the direction of electrocutaneous stimulation along
linear multistimulator arrays. Perception & Psychophysics, 25 (2), 80-87.
References
236
Stolle, A.M. (2003). Taktile Illusionen: Wahrnehmung und neuronale Analyse
spatiotemporaler Reizmuster. Unpublished doctoral dissertation, University of Mannheim.
Strybel, T.Z., Manligas, C.L. & Perrott, D.R. (1989). Auditory apparent motion under
binaural and monaural listening conditions. Perception & Psychophysics, 45 (4), 371-377.
Strybel, T.Z. & Neale, W. (1994). The effect of burst duration, interstimulus onset interval,
and loudspeaker arrangement on auditory apparent motion in the free field. Journal of the
Acoustical Society of America, 96 (6), 3463-3475.
Strybel, T.Z., Span, S.A. & Witty, A.M. (1998). The effect of timing and spatial separation on
the velocity of auditory apparent motion. Perception & Psychophysics, 60 (8), 1441-1451.
Strybel, T.Z. & Vatakis, A. (2004). A comparison of auditory and visual apparent motion
presented individually and with crossmodal moving distractors. Perception, 33, 1033-
1048.
Strybel, T.Z., Witty, A.M. & Perrott, D.R. (1992). Auditory apparent motion in the free field:
The effects of stimulus duration and separation. Perception & Psychophysics, 52 (2), 139-
143.
Summers I.R. (1992). Tactile Aids for the Hearing Impaired. London: Whurr Publishers Ltd.
Sur, M., Merzenich, M.M. & Kaas, J.H. (1980). Magnification, receptive-field area, and
"hypercolumn" size in Areas 3b and 1 of somatosensory cortex in owl monkeys. Journal
of Neurophysiology, 44, 295-311.
Szaniszlo, J.A., Essick, K.E., Kelly, D.G., Joseph, A.K. & Bredehoeft, K.R. (1998).
Evocation and characterization of percepts of apparent motion on the face. Perception &
Psychophysics, 60 (5), 785-804.
References
237
Tan, H., Gray, R., Young, J.J. & Traylor, R. (2003). A haptic back display for attentional and
directional cueing [Electronic version]. Haptics-e: The Electronic Journal of Haptics
Research, 3 (1), 1-20. Retrieved May 23, 2007, from http://www.haptics-e.org/Vol_03/he-
v3n1.pdf
Tan, H., Lim, A. & Traylor, R. (2000). A psychophysical study of sensory saltation with an
open response paradigm [Electronic version]. Proceedings of the ASME, Dynamic Systems
and Control Division, DSC-Vol. 69-2, 1109-1115. Retrieved May 23, 2007, from
http://cobweb.ecn.purdue.edu/~hongtan/pubs/Index.html
Tegenthoff, M., Ragert, P., Pleger, B., Schwenkreis, P., Förster, A.-F., Nicolas, V. et al.
(2005). Improvement of Tactile Discrimination Performance and Enlargement of Cortical
Somatosensory Maps after 5 Hz rTMS. PloS Biology, 3 (11), 2031-2040.
Tipper, S.P., Lloyd, D., Shorland, B., Dancer, C., Howard, L.A. & McGlone, F. (1998).
Vision influences tactile perception without proprioceptive orienting. NeuroReport, 9,
1741-1744.
Tipper, S.P., Phillips, N., Dancer, C., Lloyd, D., Howard, L.A. & McGlone, F. (2001). Vision
influences tactile perception at body sites that cannot be viewed directly. Experimental
Brain Research, 139, 160-167.
Trojan, J., Kleinböhl, D., Stolle, A.M., Andersen, O.K., Hölzl, R. & Arendt-Nielsen, L.
(2006). Psychophysical „perceptual maps“ of heat and pain sensation by direct
localization of CO2 laser stimuli on the skin. Brain Research, 1120, 106-113.
Trojan, J., Stolle, A.M., Kleinböhl, D., Morch, C.D. Arendt-Nielsen, L. & Hölzl, R. (2006).
The saltation illusion demonstrates integrative processing of spatiotemporal information
in thermoceptive and nociceptive networks. Experimental Brain Research, 170, 88-96.
Vallbo, A.B., Olausson, H., Wessberg, J. & Kakuda, N. (1995). Receptive field characteristics
of tactile units with myelinated afferents in hairy skin of human subjects. Journal of
Physiology, 483 (3), 783-795.
References
238
Vallbo, A.B., Olausson, H., Wessberg, J. & Norrsell, U. (1993). A system of unmyelinated
afferents for innocuous mechanoreception in the human skin. Brain Research, 628, 301-
304.
van Erp J.B.F. (2007). Tactile displays for navigation and orientation: Perception and
behaviour. Unpublished doctoral dissertation, Utrecht University, the Netherlands.
van Erp, J.B.F. & van Veen H.A.H.C. (2003). A Multi-Purpose Tactile Vest for Astronauts in
the International Space Station. In: Proceedings of Eurohaptics 2003 (pp. 405-408).
Dublin: Trinity College.
Verrillo, R.T. (1965). Temporal summation in vibrotactile sensitivity. Journal of the
Acoustical Society of America, 37 (5), 843-846.
Verrillo, R.T. & Bolanowski, S.J. (1986). The effects of skin temperature on the
psychophysical responses to vibration on glabrous and hairy skin. Journal of the
Acoustical Society of America, 80 (2), 528-532.
Vierck, C.J.Jr. & Jones, M.B. (1970). Influences of low and high frequency oscillation upon
spatio-tactile resolution. Physiology & Behavior, 5 (12), 1431-1435.
Wang, X., Merzenich, M.M., Sameshima, K. & Jenkins, W.M. (1995). Remodelling of hand
representation in adult cortex determined by timing of tactile stimulation. Nature, 378
(6552), 71-75.
Weinstein, S. (1968). Intensive and extensive aspects of tactile sensitivity as a function of
body part, sex and laterality. In: D.R. Kenshalo (Ed.), The skin senses (pp. 195-222).
Springfield, IL: Thomas.
Weitz, J. (1941). Vibratory sensitivity as a function of skin temperature. Journal of
experimental Psychology, 28, 21-36.
References
239
Whitsel, B.L., Franzen, O., Dreyer, D.A., Hollins, M., Young, M., Essick, G.K. et al. (1986).
Dependence of Subjective Traverse Length on Moving Tactile Stimuli. Somatosensory
Research, 3 (3), 185-196.
Whitsel, B.L., Roppolo, J.R. & Werner, G. (1972). Cortical Information Processing of
Stimulus Motion on Primate Skin. Journal of Neurophysiology, 35, 691-717.
Wiemer, J., Spengler, F., Joublin, F., Stagge, P. & Waquant, S. (1998). A Model of Cortical
Plasticity: Integration and Segregation based on Temporal Input Patterns. In L. Niklasson,
N. Boden & T. Ziemke (Eds.), ICANN’98, Proceedings of the 8th Conference of Artificial
Neural Networks (pp. 367-372). London: Springer Verlag.
Wiemer, J.W., Spengler, F., Joublin, F., Stagge, P. & Wacquant, S. (2000). Learning cortical
topography from spatiotemporal stimuli. Biological Cybernetics, 82, 173-187.
Wilska, A. (1954). On the vibrational sensitivity in different regions of the body surface. Acta
Psychologica, Scandinavia, 31, 285-289.
Yang, T.T., Gallen, C., Schwartz, B., Bloom, F.E., Ramachandran, V.S. & Cobbs, S. (1994).
Sensory maps in the human brain. Nature, 368 (6472), 592-593.
Zhuo, Y., Zhou, T.G., Rao, H.Y., Wang, J.J., Meng, M., Chen, M. et al. (2003). Contributions
of the Visual Ventral Pathway to Long-Range Apparent Motion. Science, 299, 417-420.

240
Annex A Voluntary Consent Form
Rupert / Cholewiak - 6.1 DOD #30083 - 10/18/01 Page 1
Appendix A. SAMPLE OF CONSENT DOCUMENT(S) AND PRIVACY ACT STATEMENT USED
Localization of vibrotactile Stimuli on the trunk.
VOLUNTARY CONSENT TO PARTICIPATE
1. I am being asked to volunteer to participate in a research study titled, "Perception of vibrotactile Stimuli/' The purpose of this study is to explore the best way to present spatial patterns to the skin by testing my ability to identify the locations, quality, and direction of movement of points of Vibration on my torso. I am being asked to participate for a total of l hour per day over a 4-day period. During my participation in this study, I will be involved in the following procedures or tests: * I will be asked to familiarize myself with the keyboards that will be used in some of the studies to follow, by
pressing a randomly ordered series of keys in response to oral or visual instructions. This will take about 5 minutes.
* Initially I will feel several series of vibrations presented to a number of locations on the trunk of my body with tactile arrays, and will be asked in each series to indicate if they all feel about the same. The researchers can then increase or decrease the intensities of notable locations so they all feel about the same. All of the vibrators will be varied in intensity Steps above this level to make sure that l can. feel all of the sites. The intensity of each Vibration will approximate that produced by a vibrating pager. This procedure will take at most 5 minutes.
* In two sessions, I will serve in a number of trials in which I will be presented with bursts of Vibration at two locations on my torso and will be asked to indicate the locations of those by pressing the appropriate keys on the special keyboard. In one Session there will be several (as many as nine) blocks of trials, separated by rest periods, where we will vary aspects of the experiment like the position of the array of vibrators on my torso (low, around my waist, or at positions higher on my chest). There may be as many as 100 trials in a block, but a single whole series should take less then 30 minutes.
* In the final two sessions, I will be presented with multiple bursts of Vibration on my torso over several sites in the array (a "pattern"). Each trial will consist of one or two patterns to be judged or compared. [n one session I will be asked to judge the direction, rate, or quality of the resulting Sensation of movement of those bursts when only one pattern is presented, by pressing the appropriate key on a keyboard. In the other session I will be asked to compare the two patterns presented in a trial, judging whether they were the same or different, or which was best. In one session there will be several (as many as nine) blocks of trials, separated by rest periods. There may be as many as 100 trials in a block, but the whole series of blocks should take less then 30 minutes in each of these final two sessions.
* At the end of each session, I will be given the opportunity to ask any questions that might have come up during my lest series. This procedure will take as much time as I need.
2. The investigators believe that there will be no risks or discomforts to me resulting from the mechanical Stimulation of the skin in this study.
3. The benefits to me from participating in this research will be a greater appreciation of the use of the skin as an alternative communication modality, particularly as it is used by persons who are deaf or blind. The potential benefits include the possible improvements in aviation safety that might someday benefit all members of the aerospace community, as well as the improvement in our basic understanding of the Operation of the sense of touch, an underappreciated and poorly-studied sensory modality.
4. My privacy will be ensured during and after the study. The researchers will assign a code to my data. This will be the only identifying entry on any of my research records. A cross-reference between my name and my code will be maintained under lock by the research staff. It will be decoded only if to do so would benefit me or enhance the scientific value of the data.
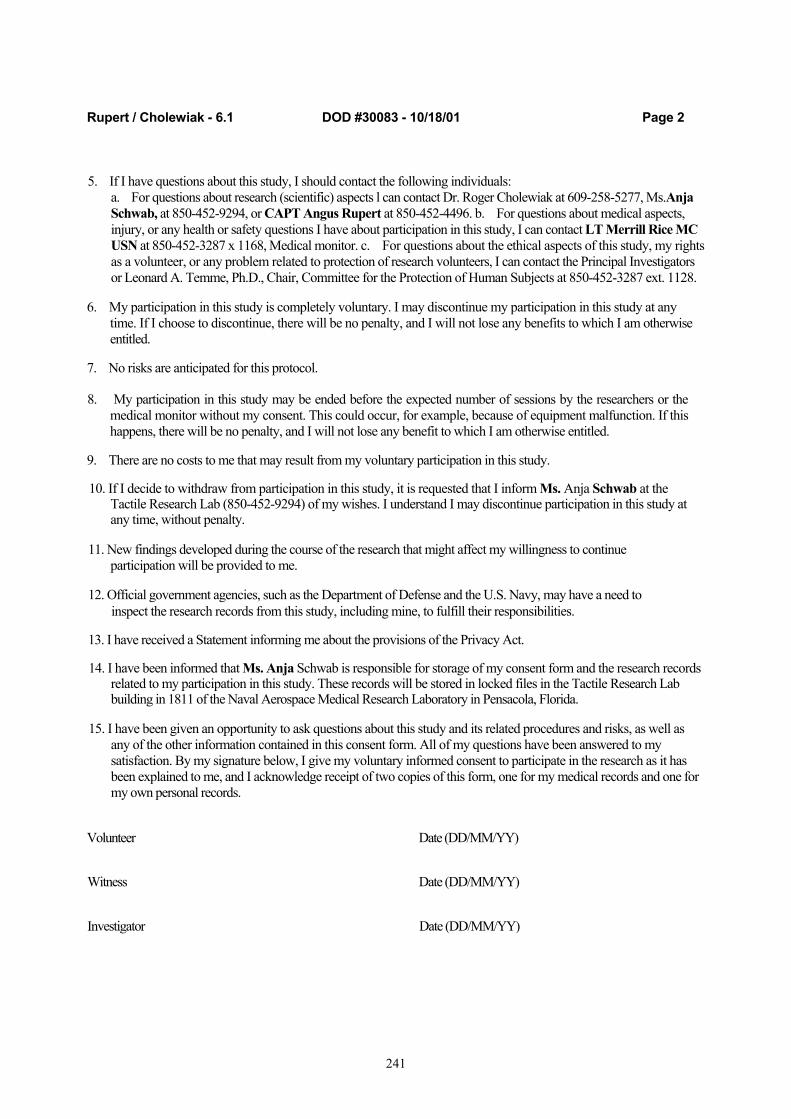
241
Rupert / Cholewiak - 6.1 DOD #30083 - 10/18/01 Page 2
5. If I have questions about this study, I should contact the following individuals: a. For questions about research (scientific) aspects l can contact Dr. Roger Cholewiak at 609-258-5277, Ms.Anja Schwab, at 850-452-9294, or CAPT Angus Rupert at 850-452-4496. b. For questions about medical aspects, injury, or any health or safety questions I have about participation in this study, I can contact LT Merrill Rice MC USN at 850-452-3287 x 1168, Medical monitor. c. For questions about the ethical aspects of this study, my rights as a volunteer, or any problem related to protection of research volunteers, I can contact the Principal Investigators or Leonard A. Temme, Ph.D., Chair, Committee for the Protection of Human Subjects at 850-452-3287 ext. 1128.
6. My participation in this study is completely voluntary. I may discontinue my participation in this study at any time. If I choose to discontinue, there will be no penalty, and I will not lose any benefits to which I am otherwise entitled.
7. No risks are anticipated for this protocol.
8. My participation in this study may be ended before the expected number of sessions by the researchers or the medical monitor without my consent. This could occur, for example, because of equipment malfunction. If this happens, there will be no penalty, and I will not lose any benefit to which I am otherwise entitled.
9. There are no costs to me that may result from my voluntary participation in this study.
10. If I decide to withdraw from participation in this study, it is requested that I inform Ms. Anja Schwab at the Tactile Research Lab (850-452-9294) of my wishes. I understand I may discontinue participation in this study at any time, without penalty.
11. New findings developed during the course of the research that might affect my willingness to continue participation will be provided to me.
12. Official government agencies, such as the Department of Defense and the U.S. Navy, may have a need to inspect the research records from this study, including mine, to fulfill their responsibilities.
13. I have received a Statement informing me about the provisions of the Privacy Act.
14. I have been informed that Ms. Anja Schwab is responsible for storage of my consent form and the research records related to my participation in this study. These records will be stored in locked files in the Tactile Research Lab building in 1811 of the Naval Aerospace Medical Research Laboratory in Pensacola, Florida.
15. I have been given an opportunity to ask questions about this study and its related procedures and risks, as well as any of the other information contained in this consent form. All of my questions have been answered to my satisfaction. By my signature below, I give my voluntary informed consent to participate in the research as it has been explained to me, and I acknowledge receipt of two copies of this form, one for my medical records and one for my own personal records.
Volunteer Date (DD/MM/YY)
Witness Date (DD/MM/YY)
Investigator Date (DD/MM/YY)

242
Annex B
Medical Questionnaire

243

244
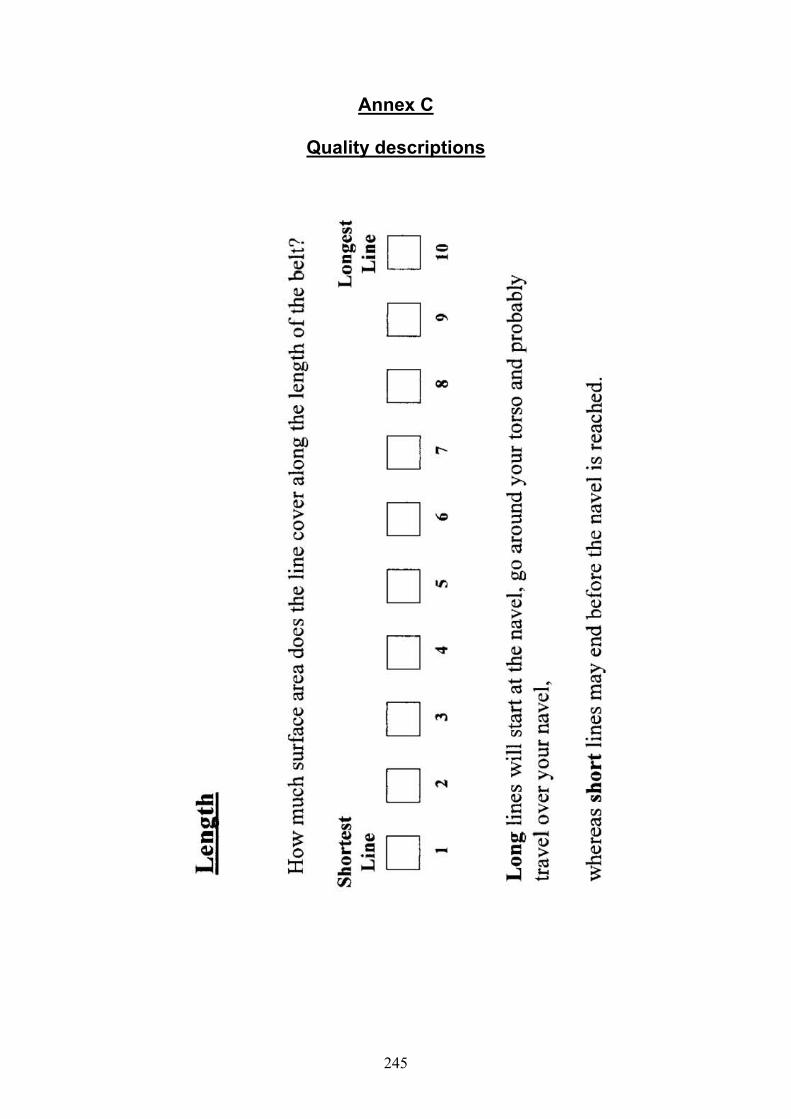
245
Annex C
Quality descriptions
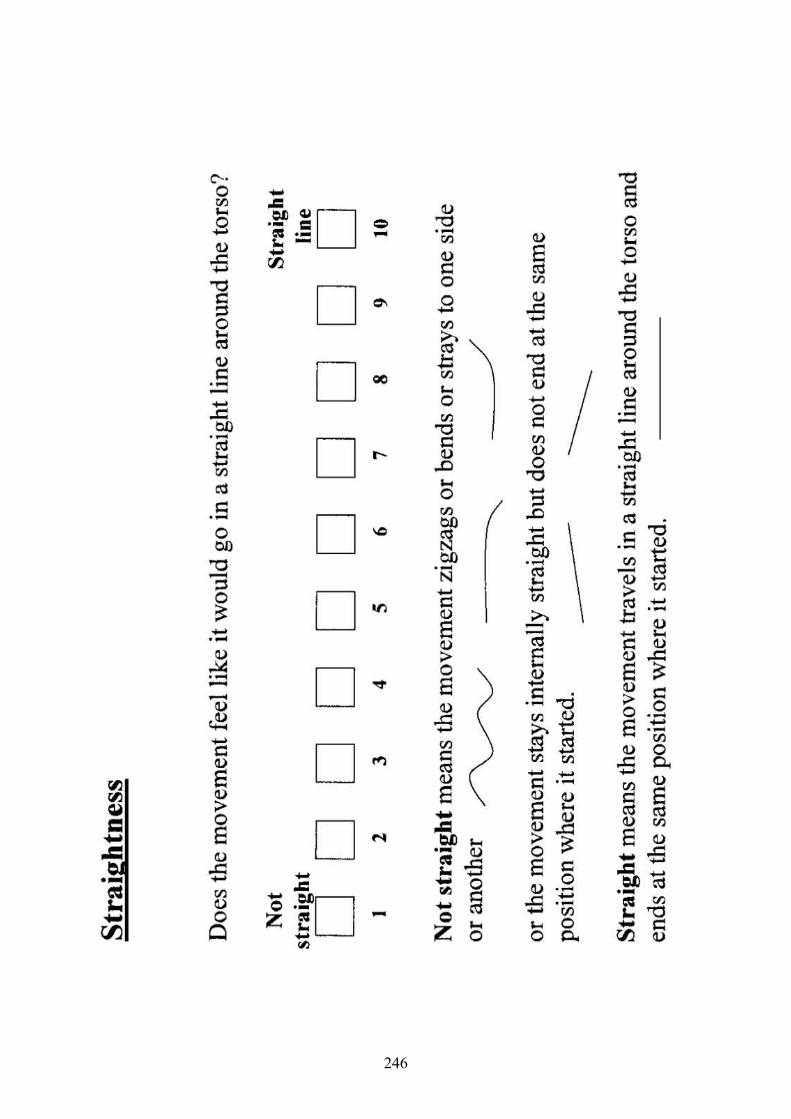
246
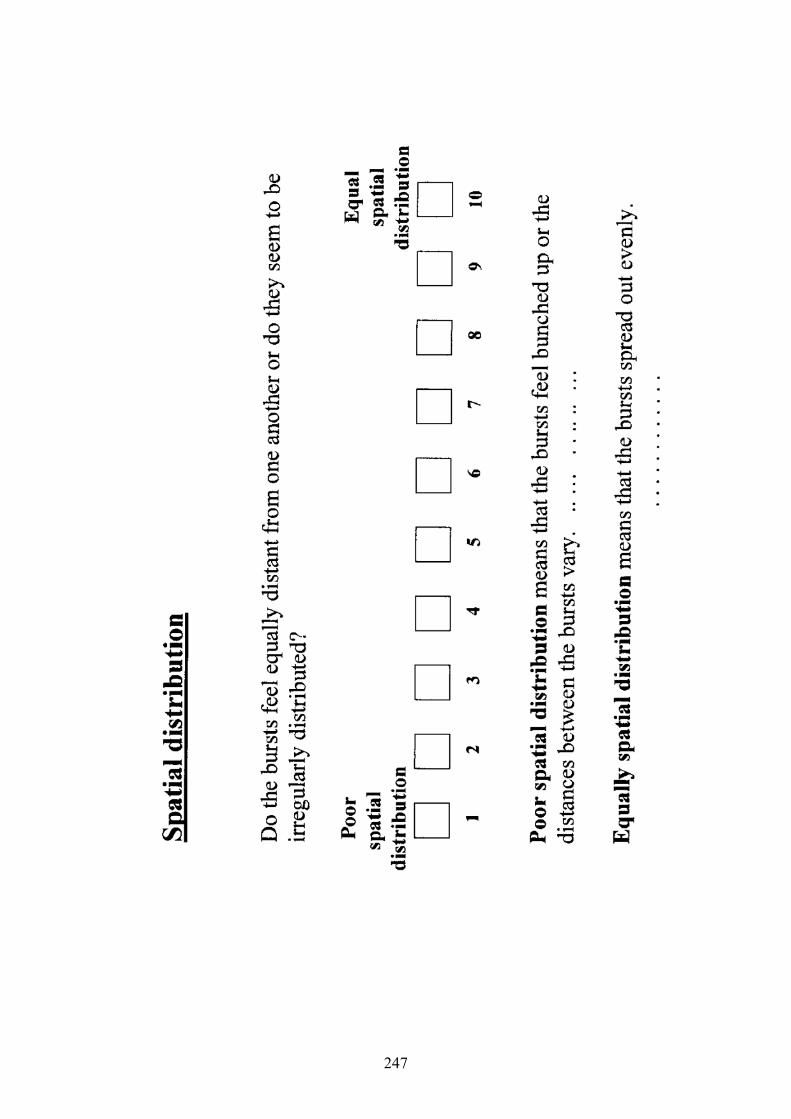
247
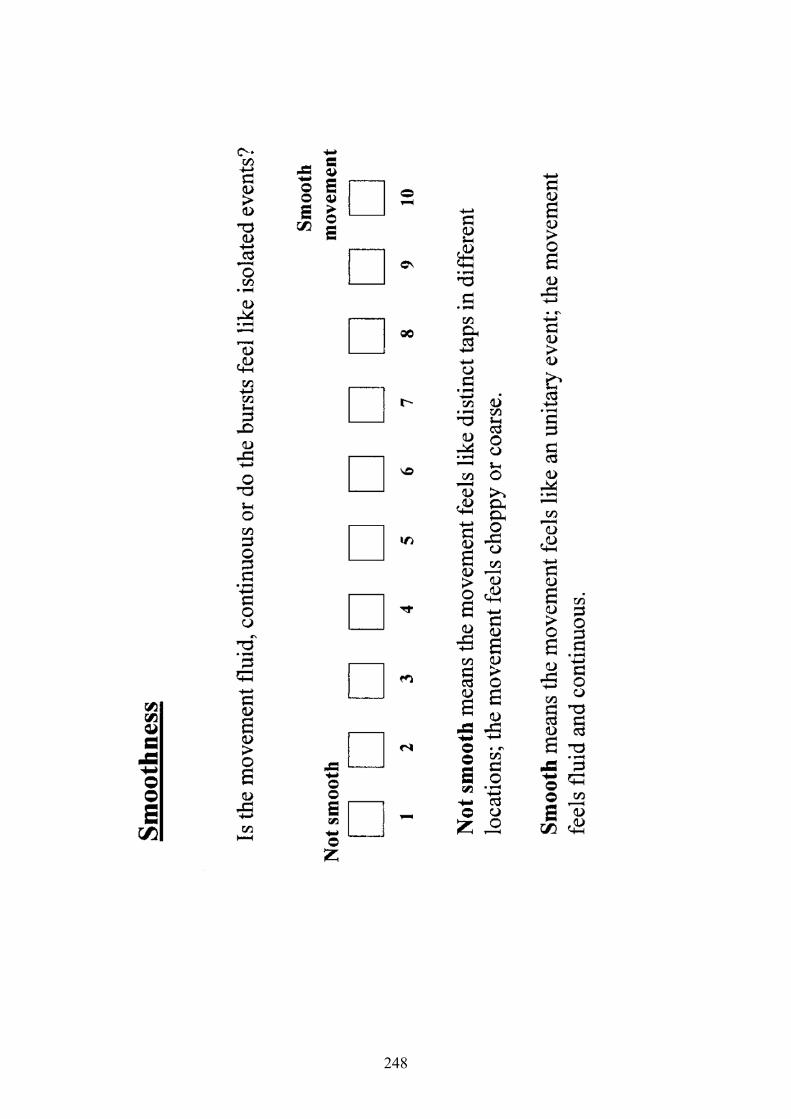
248

249
Annex D
Experimenter Script for Pilot Study 1: Direction discrimination Purpose This test will help us to evaluate how well people can determine the direction of “flo” of the vibrotactile stimuli on the torso (in a clockwise or counter-clockwise direction). I will place a belt with 36 vibrating motors (called “tactors”) around you; only the middle row with 12 tactors will be activated during this experiment. Ultimately, we are hoping that this experiment will tell us what tactile cues may help in preventing spatial disorientation and motion sickness in pilots. Throughout the entire experiment, we will be testing different modalities – direction, smoothness, length etc. Today, direction will be tested. First, I need you to change into a t-shirt for the testing. This is important, because we cannot fairly compare the results if our participants are wearing different types of clothing. This is a newly cleaned t-shirt that we will keep in the lab for testing you. Now, I need to measure your waist and I will mark your naval by drawing a line on the t-shirt. Then I would like to collect some basic information from you. I would like you to read and sign the consent-form and then to fill out the Medical Questionnaire. Meanwhile: Put tactors on belt. Place belt on participant. I’ve placed a belt containing 36 tactors around you. The tactors vibrate much like a pager motor. When all of the tactors activate around your body, do the best you can to hit the key corresponding to the direction of movement as quickly and as accurately as possible. (#1 = clockwise and #2 = counter-clockwise) We will now go through the instruction phase together: First, I want to tell you that, throughout the test, you will get no feedback as to whether your answer was correct or incorrect. Now, if you look on the visual display, you will read “Rotating Tactors”. Here, you will have the opportunity to feel the sensation of the tactors. If you press the “Align “ button, each tactor will activate in a circle around your torso. Please repeat the “Rotating Tactors” two more times.

250
Next, you will read “Threshold Measure” on the display screen. This is a measure to determine your individual threshold – or point where you can just feel all of the tactors. After we determine that point, we will increase the intensity by 10% to ensure that you will be able to feel all of the tactors activate during the test. In order to determine your threshold, push the “Align” button and all of the tactors will activate in a circle around your torso. Each time you push this button, the intensity will decrease. When you cannot feel any one tactor, push the “#1” key to lock in your threshold. If you cannot feel any one tactor on the first attempt, let me know and I will increase the intensity. Also, please inform me of the tactor which you did not feel first. Now the display will read “Block 1.” Press the “Align” button and the display will read “direction,” press the “Align” button again and the display will read “ready.” Your next keystroke, the “Align” button, will activate the system. The tactors will activate around your body either in a clockwise or counter-clockwise direction. When you determine which direction they moved press the corresponding key (#1=clockwise, #2 = counter-clockwise). After you answer, press the “Align” button to get the next stimuli. You control when the stimuli are presented by pressing the align key. There is no time limit to this test. Today’s test will consist of 2 blocks of trials. Each block of trial will consist of 98 stimuli. You can take a brief break in between the blocks if you wish. To start the next block of trials, hit the “Align” button again. Do you have any questions? Headphones!
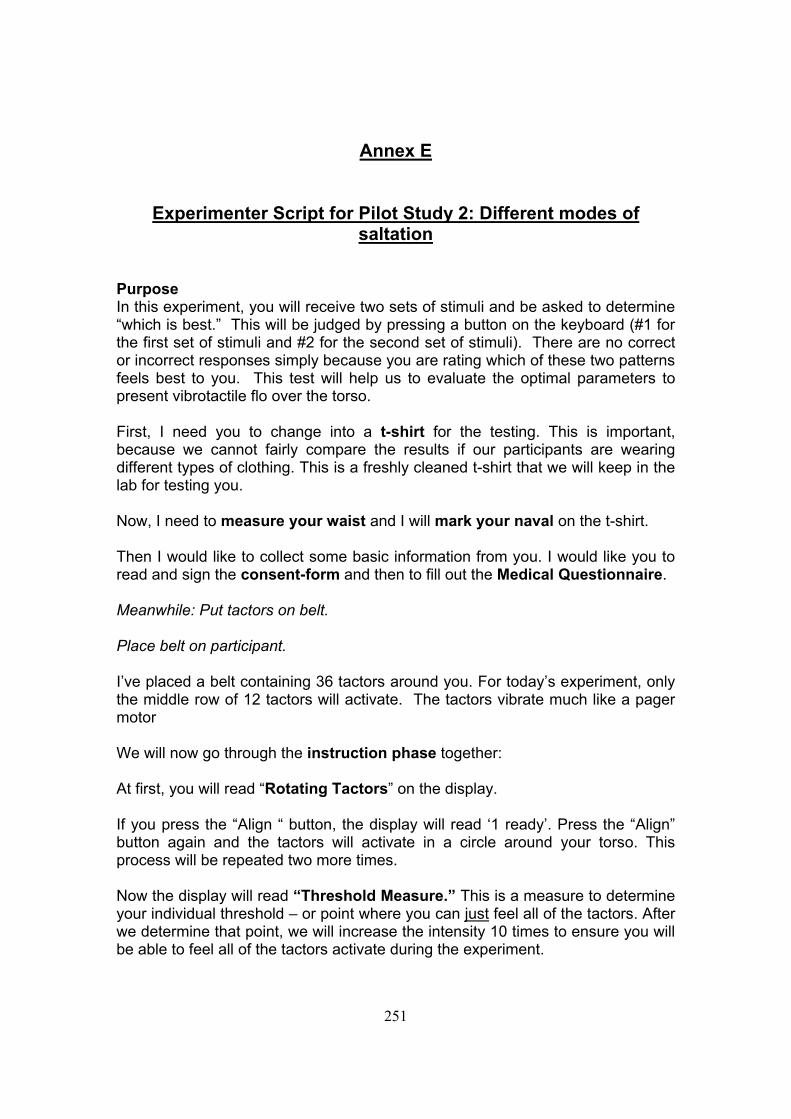
251
Annex E
Experimenter Script for Pilot Study 2: Different modes of
saltation Purpose In this experiment, you will receive two sets of stimuli and be asked to determine “which is best.” This will be judged by pressing a button on the keyboard (#1 for the first set of stimuli and #2 for the second set of stimuli). There are no correct or incorrect responses simply because you are rating which of these two patterns feels best to you. This test will help us to evaluate the optimal parameters to present vibrotactile flo over the torso. First, I need you to change into a t-shirt for the testing. This is important, because we cannot fairly compare the results if our participants are wearing different types of clothing. This is a freshly cleaned t-shirt that we will keep in the lab for testing you. Now, I need to measure your waist and I will mark your naval on the t-shirt. Then I would like to collect some basic information from you. I would like you to read and sign the consent-form and then to fill out the Medical Questionnaire. Meanwhile: Put tactors on belt. Place belt on participant. I’ve placed a belt containing 36 tactors around you. For today’s experiment, only the middle row of 12 tactors will activate. The tactors vibrate much like a pager motor We will now go through the instruction phase together: At first, you will read “Rotating Tactors” on the display. If you press the “Align “ button, the display will read ‘1 ready’. Press the “Align” button again and the tactors will activate in a circle around your torso. This process will be repeated two more times. Now the display will read “Threshold Measure.” This is a measure to determine your individual threshold – or point where you can just feel all of the tactors. After we determine that point, we will increase the intensity 10 times to ensure you will be able to feel all of the tactors activate during the experiment.

252
In order to determine your threshold, push the “Align” button and all of the tactors will activate in a circle around your torso. Each time you push this button, the intensity will decrease. When you cannot feel any one tactor, push the “#1” key to lock in your threshold. If you cannot feel any one tactor on the first attempt, let me know and I will increase the intensity. Also, please inform me of the tactor that you did not feel first. Now the display will read “Block 1.” Press the “Align” button and the display will read “ready.” Your next keystroke, the “Align” button, will activate the system. During the experiment, you will be presented with two sets of stimuli. Each set will go around your torso. After the first set of stimuli is presented, there will be a brief break and then the second will automatically begin. After the second set was presented, you will answer “which is best” by pressing either #1 for the first set of stimuli or #2 for the second set of stimuli. Again, there is no right or wrong answer and no feedback will be given. We are interested in determining which set of stimuli you perceive to be the best. By “which is best,” we mean what set feels overall better. Guidelines to determine this include: which line felt straighter, smoother, or equally distributed in both space and time. All patterns will vary in terms of how long the burst lasts and the time in between bursts. After you answer, press the “Align” button to get the next stimuli. You control when the stimuli are presented by pressing the align key. Today’s test will consist of 3 blocks of trials. Each block of trials will consist of 98 stimuli. You can take a brief break in between the blocks if you wish. To start the next block of trials, hit the “Align” button again. Do you have any questions? Headphones!
253
WHICH IS BEST?
Which line felt:
• Straighter
• Smoother
• Equally distributed in both space & time

254
Annex F
Experimenter Script for Experiment 1: Quality judgments In this experiment, you will be presented with a single pattern of stimuli and be asked to make judgments on certain characteristics of the pattern based on how it feels on your torso. The specific qualities you will be asked to judge are smoothness, straightness, length and spatial distribution. You will make your decision by pressing a button on the keyboard (#1 =least/not to #10= most). There are no correct or incorrect responses simply because you are rating how these patterns feel to you. This test will help us to evaluate the optimal parameters to present vibrotactile flo over the torso. First, I need you to change into a t-shirt for the testing. This is important, because we cannot fairly compare the results if our participants are wearing different types of clothing. This is a freshly cleaned t-shirt that we will keep in the lab for testing you. Now, I need to measure your waist and I will mark your naval on the t-shirt. Then I would like to collect some basic information from you. I would like you to read and sign the consent-form and then to fill out the Medical Questionnaire. Meanwhile: Put tactors on belt. Place belt on participant. I’ve placed a belt containing 36 (24) tactors around you. For today’s experiment, only the middle row of 12/8 tactors (or all 36/24 tactors) will activate. When the tactors activate they vibrate like a pager motor or cell phone. You are asked to come back three more times because there are four different conditions we would like to measure. The four conditions are: 1 row with 12 tactors, 3 rows with 36 tactors, 1 row with 8 tactors, and 3 rows with 24 tactors. We will now go through the instruction phase together: At first, you will read “Rotating Tactors” on the display. If you press the “Align “ button, the display will read ‘1 ready’. Press the “Align” button again and the tactors will activate in a circle around your torso. There will be 8/12 positions that activate. Count them as they go along to ensure you can feel a tactor activate at every position. This process will be repeated two more times.

255
Now the display will read “Threshold Measure.” This is a measure to determine your individual threshold – or point where you can just feel all of the tactors. After we determine that point, we will increase the intensity by 10 times to ensure you will be able to feel all of the tactors activate during the experiment. In order to determine your threshold, push the “Align” button and all of the tactors will activate in a circle around your torso. Each time you push this button, the intensity will decrease. When you cannot feel any one tactor, push the “#1” key to lock in your threshold. If you cannot feel any one tactor on the first attempt, let me know and I will increase the intensity. Also, please inform me of the tactor that you did not feel first. Now you will feel three stimuli samples similar to the patterns you will receive in the experiment. During the experiment, all of the patterns will vary in terms of how long the burst lasts and the time in between bursts. The sample patterns will be fast, medium, and slow in terms of stimulus duration around the torso. Press the “Align” button and you will read “Flo Samples” on the display. Press the “align” button again and you will read “Fast Ready.” Your next press of the “align” button will produce the fast sample pattern. Now the display reads “Medium Ready.” Press the align button again to receive the medium pattern. Now the display reads “Slow Ready.” Press the “align” button to receive the slow pattern. Now the display will read “Block 1.” Press the “Align” button and the first quality you will judge will appear on the visual display. Press the “align” button again and read “ready.” Your next keystroke, the “Align” button, will activate the system. During the experiment, you will be presented with patterns of stimuli around your torso. After the pattern is presented, you will judge its quality by pressing number 1 through 10 on the keyboard (#1 representing the least/not to #10 representing the most). Again, there is no right or wrong answer and no feedback will be given. We are interested in determining how you perceive the quality of the pattern. After you answer, press the “Align” button to get the next stimuli. You control when the stimuli are presented by pressing the align key. The four qualities you will be asked to judge are length, straightness, smoothness and spatial distribution. The blocks will be given in a random order during the test. You can use the following criteria for your judgments:
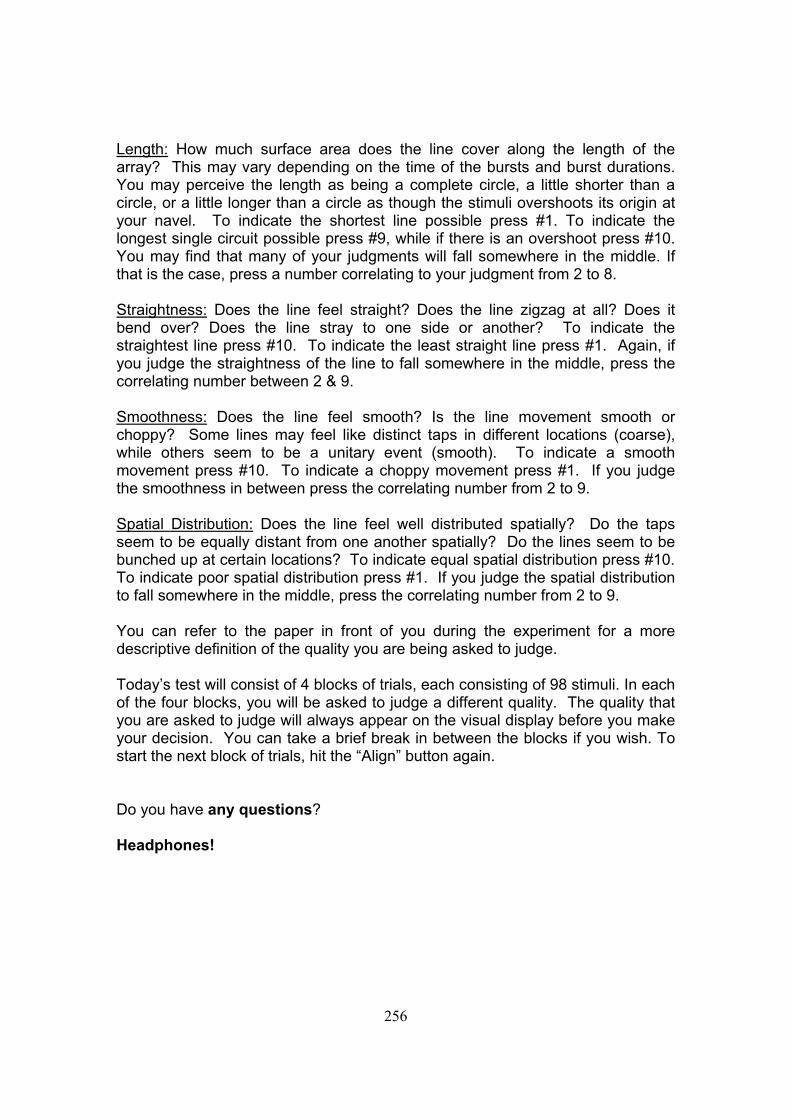
256
Length: How much surface area does the line cover along the length of the array? This may vary depending on the time of the bursts and burst durations. You may perceive the length as being a complete circle, a little shorter than a circle, or a little longer than a circle as though the stimuli overshoots its origin at your navel. To indicate the shortest line possible press #1. To indicate the longest single circuit possible press #9, while if there is an overshoot press #10. You may find that many of your judgments will fall somewhere in the middle. If that is the case, press a number correlating to your judgment from 2 to 8. Straightness: Does the line feel straight? Does the line zigzag at all? Does it bend over? Does the line stray to one side or another? To indicate the straightest line press #10. To indicate the least straight line press #1. Again, if you judge the straightness of the line to fall somewhere in the middle, press the correlating number between 2 & 9. Smoothness: Does the line feel smooth? Is the line movement smooth or choppy? Some lines may feel like distinct taps in different locations (coarse), while others seem to be a unitary event (smooth). To indicate a smooth movement press #10. To indicate a choppy movement press #1. If you judge the smoothness in between press the correlating number from 2 to 9. Spatial Distribution: Does the line feel well distributed spatially? Do the taps seem to be equally distant from one another spatially? Do the lines seem to be bunched up at certain locations? To indicate equal spatial distribution press #10. To indicate poor spatial distribution press #1. If you judge the spatial distribution to fall somewhere in the middle, press the correlating number from 2 to 9. You can refer to the paper in front of you during the experiment for a more descriptive definition of the quality you are being asked to judge. Today’s test will consist of 4 blocks of trials, each consisting of 98 stimuli. In each of the four blocks, you will be asked to judge a different quality. The quality that you are asked to judge will always appear on the visual display before you make your decision. You can take a brief break in between the blocks if you wish. To start the next block of trials, hit the “Align” button again. Do you have any questions? Headphones!
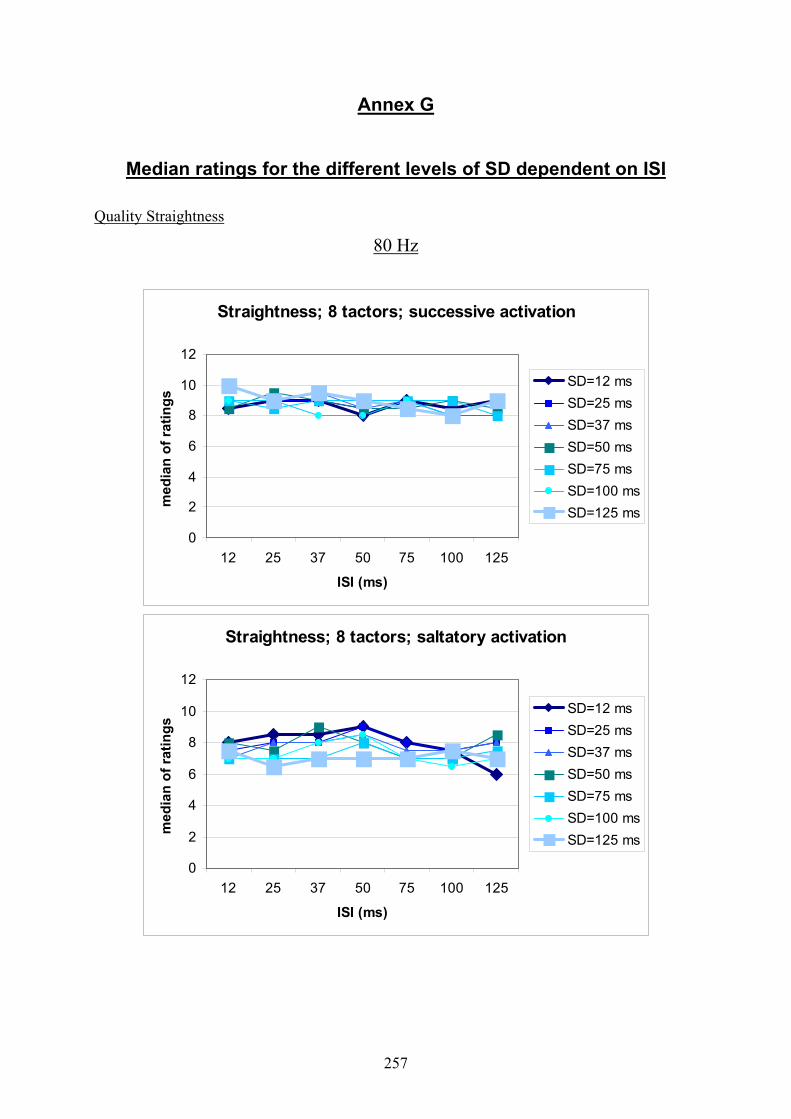
257
Annex G
Median ratings for the different levels of SD dependent on ISI
Quality Straightness
80 Hz
Straightness; 8 tactors; successive activation
0
2
4
6
8
10
12
12 25 37 50 75 100 125
ISI (ms)
med
ian
of ra
tings
SD=12 msSD=25 msSD=37 msSD=50 msSD=75 msSD=100 msSD=125 ms
Straightness; 8 tactors; saltatory activation
0
2
4
6
8
10
12
12 25 37 50 75 100 125
ISI (ms)
med
ian
of ra
tings
SD=12 msSD=25 msSD=37 msSD=50 msSD=75 msSD=100 msSD=125 ms
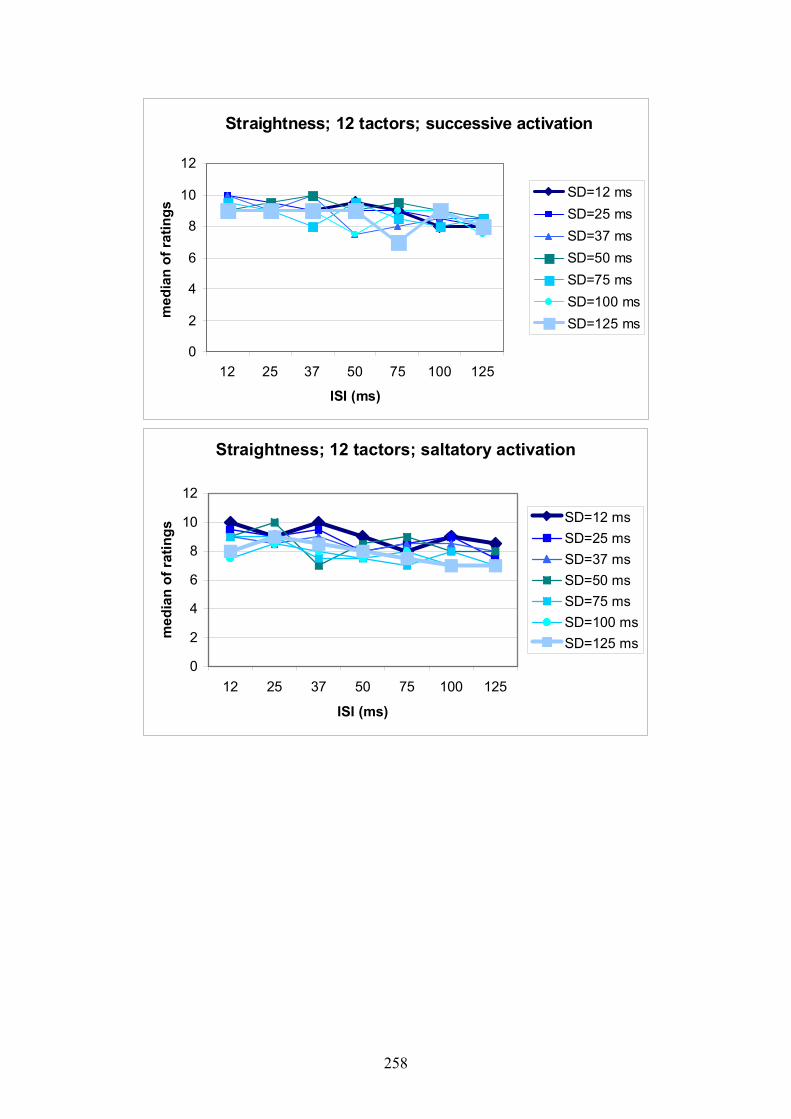
258
Straightness; 12 tactors; successive activation
0
2
4
6
8
10
12
12 25 37 50 75 100 125
ISI (ms)
med
ian
of ra
tings
SD=12 msSD=25 msSD=37 msSD=50 msSD=75 msSD=100 msSD=125 ms
Straightness; 12 tactors; saltatory activation
0
2
4
6
8
10
12
12 25 37 50 75 100 125
ISI (ms)
med
ian
of ra
tings
SD=12 msSD=25 msSD=37 msSD=50 msSD=75 msSD=100 msSD=125 ms
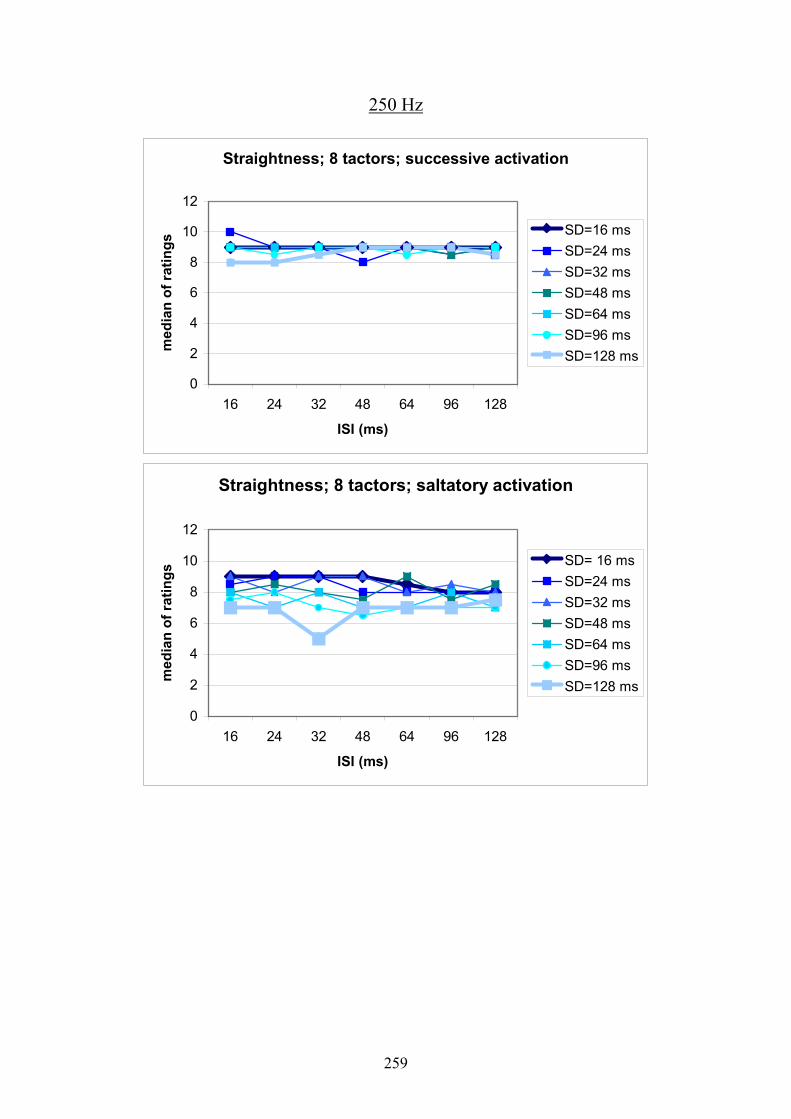
259
250 Hz
Straightness; 8 tactors; successive activation
0
2
4
6
8
10
12
16 24 32 48 64 96 128
ISI (ms)
med
ian
of ra
tings
SD=16 msSD=24 msSD=32 msSD=48 msSD=64 msSD=96 msSD=128 ms
Straightness; 8 tactors; saltatory activation
0
2
4
6
8
10
12
16 24 32 48 64 96 128
ISI (ms)
med
ian
of ra
tings
SD= 16 msSD=24 msSD=32 msSD=48 msSD=64 msSD=96 msSD=128 ms
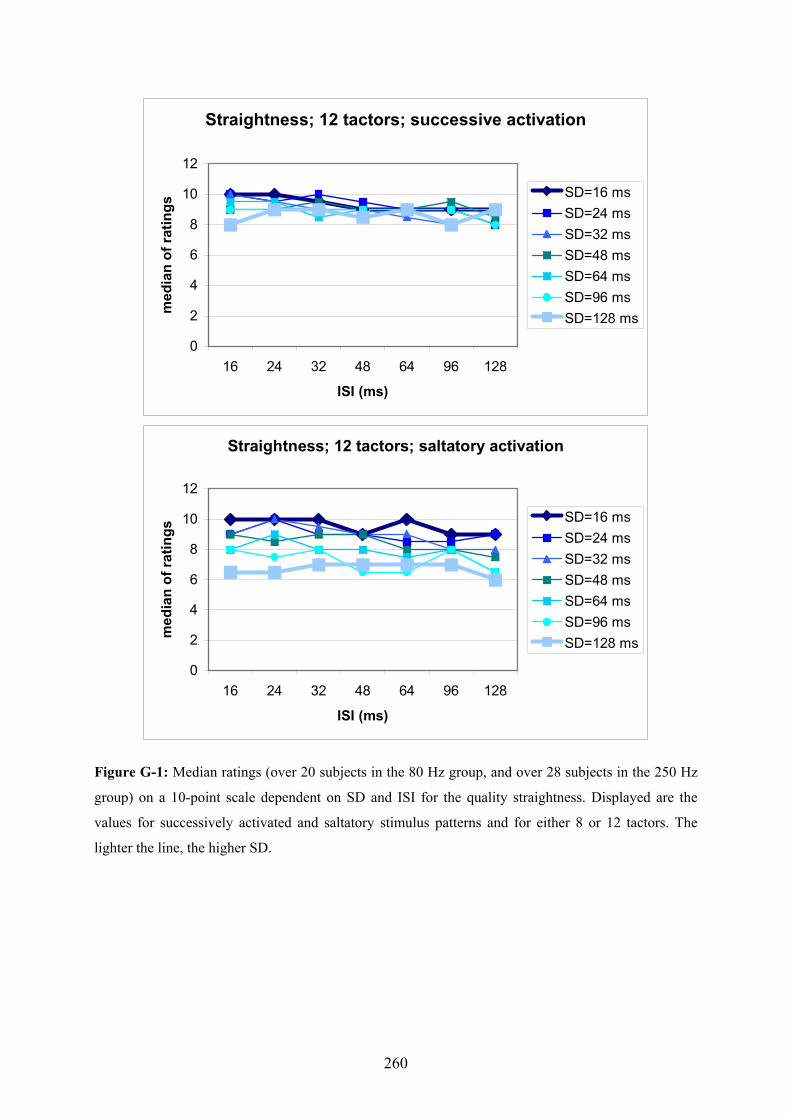
260
Straightness; 12 tactors; successive activation
0
2
4
6
8
10
12
16 24 32 48 64 96 128
ISI (ms)
med
ian
of ra
tings
SD=16 msSD=24 msSD=32 msSD=48 msSD=64 msSD=96 msSD=128 ms
Straightness; 12 tactors; saltatory activation
0
2
4
6
8
10
12
16 24 32 48 64 96 128
ISI (ms)
med
ian
of ra
tings
SD=16 msSD=24 msSD=32 msSD=48 msSD=64 msSD=96 msSD=128 ms
Figure G-1: Median ratings (over 20 subjects in the 80 Hz group, and over 28 subjects in the 250 Hz
group) on a 10-point scale dependent on SD and ISI for the quality straightness. Displayed are the
values for successively activated and saltatory stimulus patterns and for either 8 or 12 tactors. The
lighter the line, the higher SD.
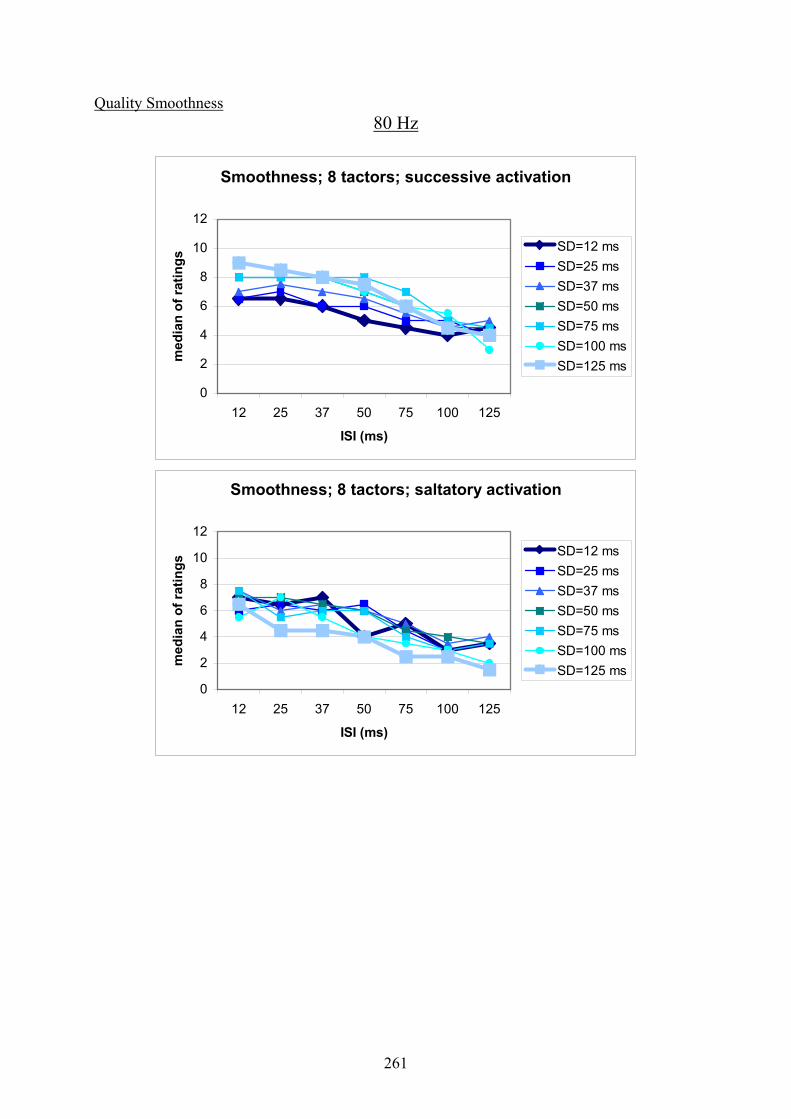
261
Quality Smoothness 80 Hz
Smoothness; 8 tactors; successive activation
0
2
4
6
8
10
12
12 25 37 50 75 100 125
ISI (ms)
med
ian
of ra
tings
SD=12 msSD=25 msSD=37 msSD=50 msSD=75 msSD=100 msSD=125 ms
Smoothness; 8 tactors; saltatory activation
0
2
4
6
8
10
12
12 25 37 50 75 100 125
ISI (ms)
med
ian
of ra
tings
SD=12 msSD=25 msSD=37 msSD=50 msSD=75 msSD=100 msSD=125 ms
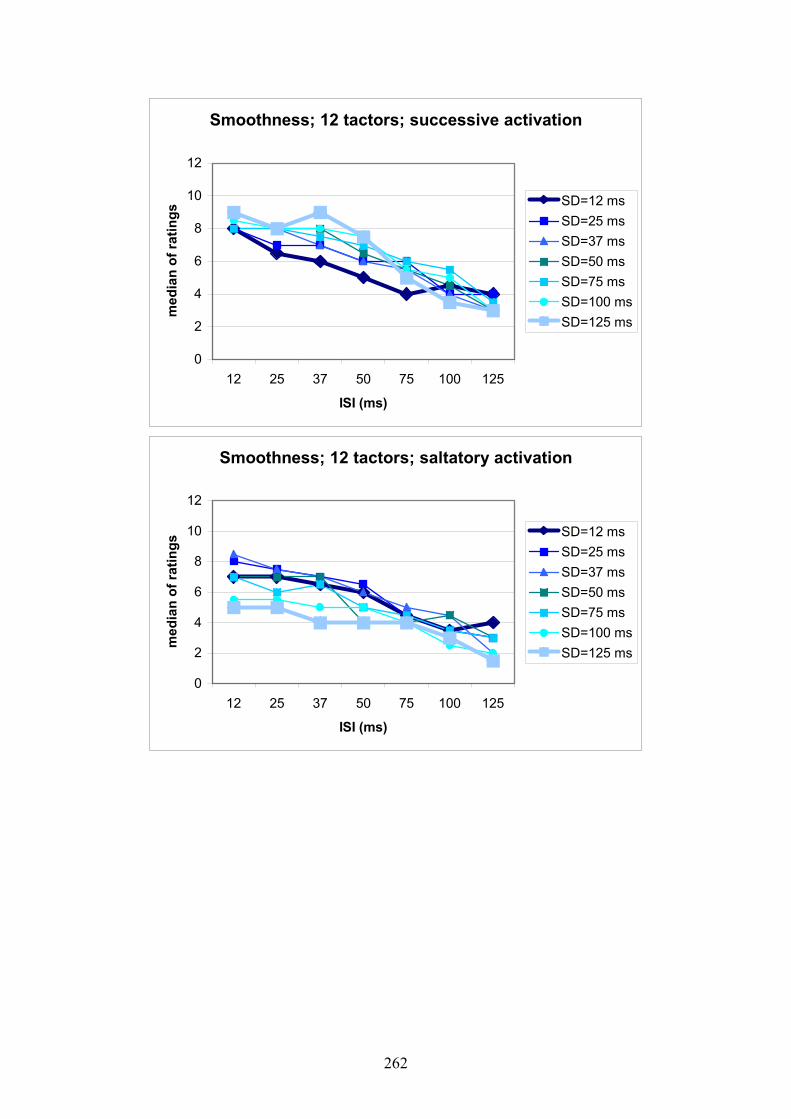
262
Smoothness; 12 tactors; successive activation
0
2
4
6
8
10
12
12 25 37 50 75 100 125
ISI (ms)
med
ian
of ra
tings
SD=12 msSD=25 msSD=37 msSD=50 msSD=75 msSD=100 msSD=125 ms
Smoothness; 12 tactors; saltatory activation
0
2
4
6
8
10
12
12 25 37 50 75 100 125
ISI (ms)
med
ian
of ra
tings
SD=12 msSD=25 msSD=37 msSD=50 msSD=75 msSD=100 msSD=125 ms
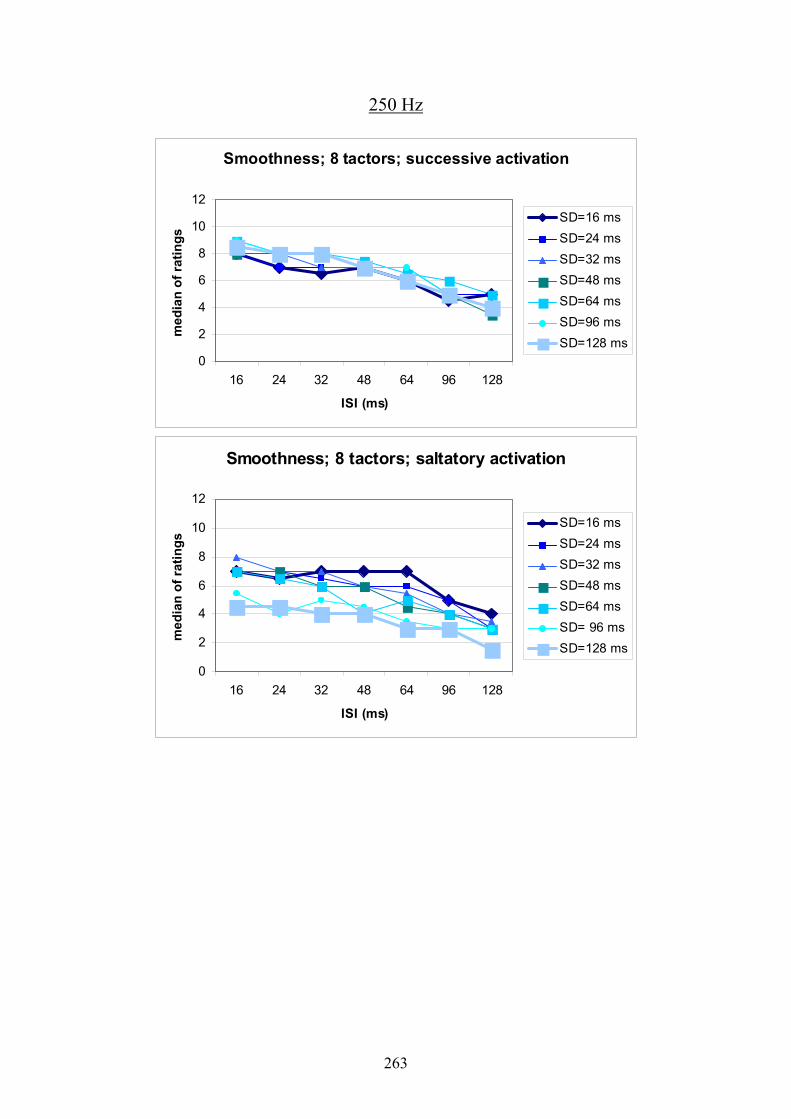
263
250 Hz
Smoothness; 8 tactors; successive activation
0
2
4
6
8
10
12
16 24 32 48 64 96 128
ISI (ms)
med
ian
of ra
tings
SD=16 msSD=24 msSD=32 msSD=48 msSD=64 msSD=96 msSD=128 ms
Smoothness; 8 tactors; saltatory activation
0
2
4
6
8
10
12
16 24 32 48 64 96 128
ISI (ms)
med
ian
of ra
tings
SD=16 msSD=24 msSD=32 msSD=48 msSD=64 msSD= 96 msSD=128 ms
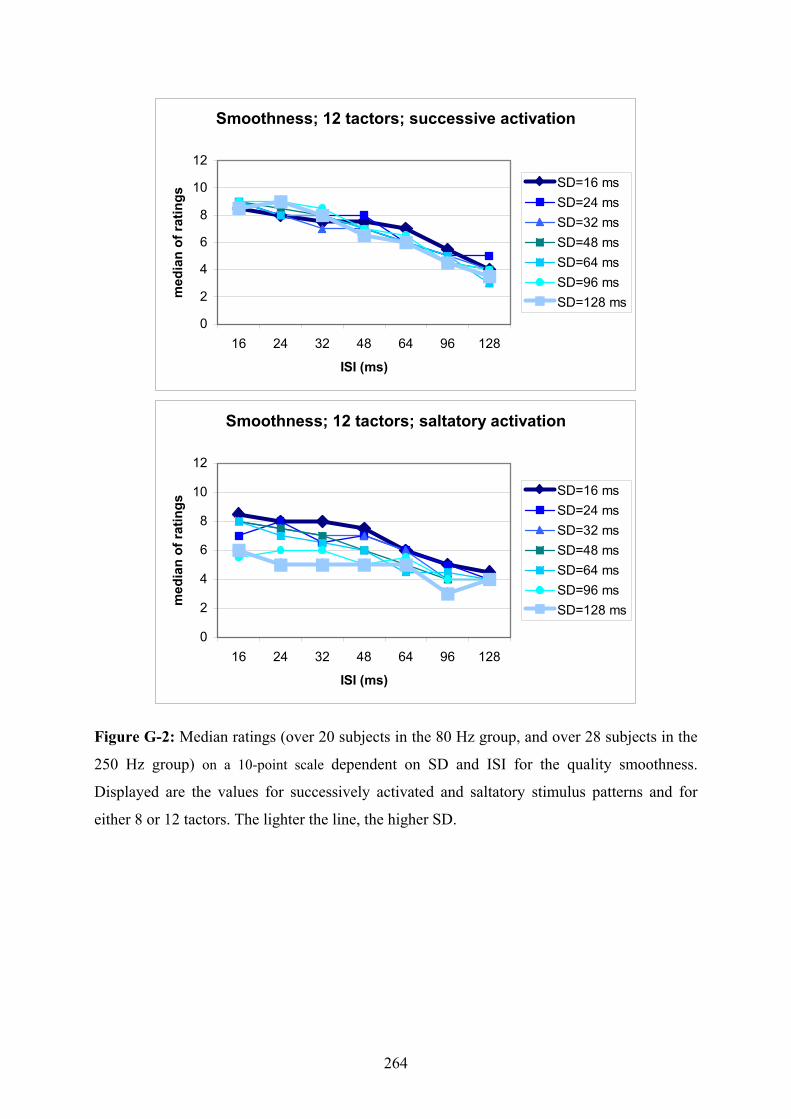
264
Smoothness; 12 tactors; successive activation
0
2
4
6
8
10
12
16 24 32 48 64 96 128
ISI (ms)
med
ian
of ra
tings
SD=16 msSD=24 msSD=32 msSD=48 msSD=64 msSD=96 msSD=128 ms
Smoothness; 12 tactors; saltatory activation
0
2
4
6
8
10
12
16 24 32 48 64 96 128
ISI (ms)
med
ian
of ra
tings
SD=16 msSD=24 msSD=32 msSD=48 msSD=64 msSD=96 msSD=128 ms
Figure G-2: Median ratings (over 20 subjects in the 80 Hz group, and over 28 subjects in the
250 Hz group) on a 10-point scale dependent on SD and ISI for the quality smoothness.
Displayed are the values for successively activated and saltatory stimulus patterns and for
either 8 or 12 tactors. The lighter the line, the higher SD.
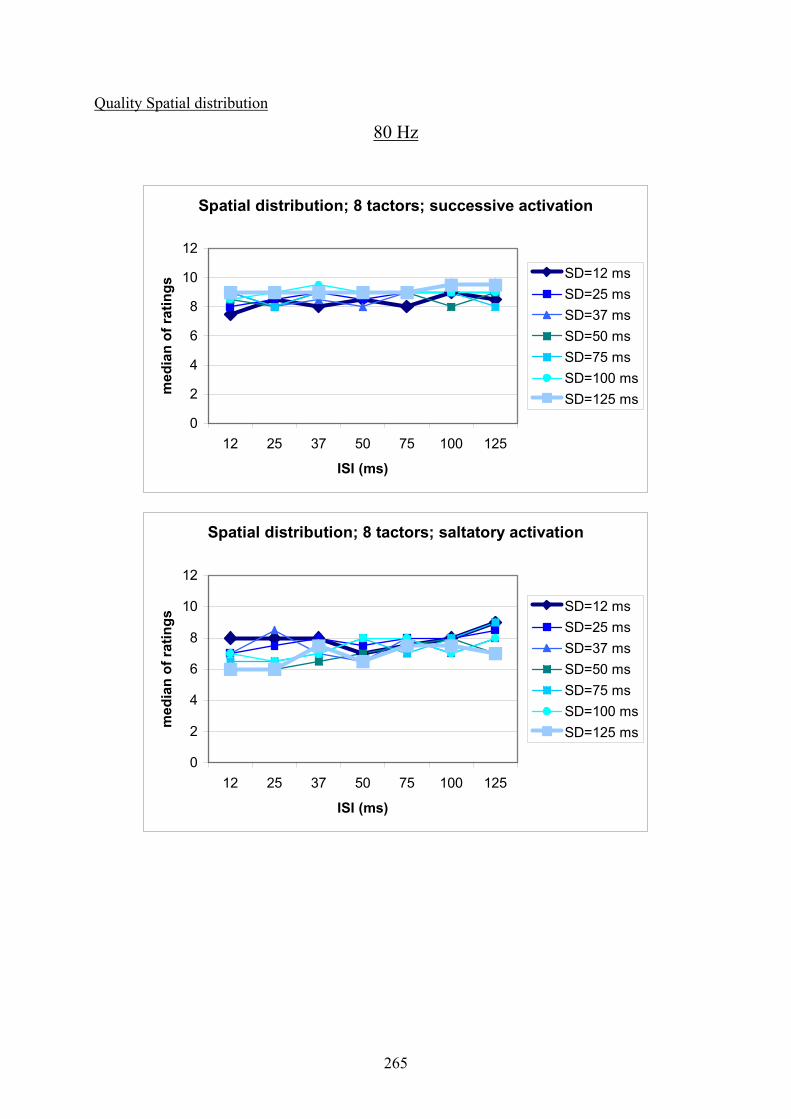
265
Quality Spatial distribution
80 Hz
Spatial distribution; 8 tactors; successive activation
0
2
4
6
8
10
12
12 25 37 50 75 100 125
ISI (ms)
med
ian
of ra
tings
SD=12 msSD=25 msSD=37 msSD=50 msSD=75 msSD=100 msSD=125 ms
Spatial distribution; 8 tactors; saltatory activation
0
2
4
6
8
10
12
12 25 37 50 75 100 125
ISI (ms)
med
ian
of ra
tings
SD=12 msSD=25 msSD=37 msSD=50 msSD=75 msSD=100 msSD=125 ms
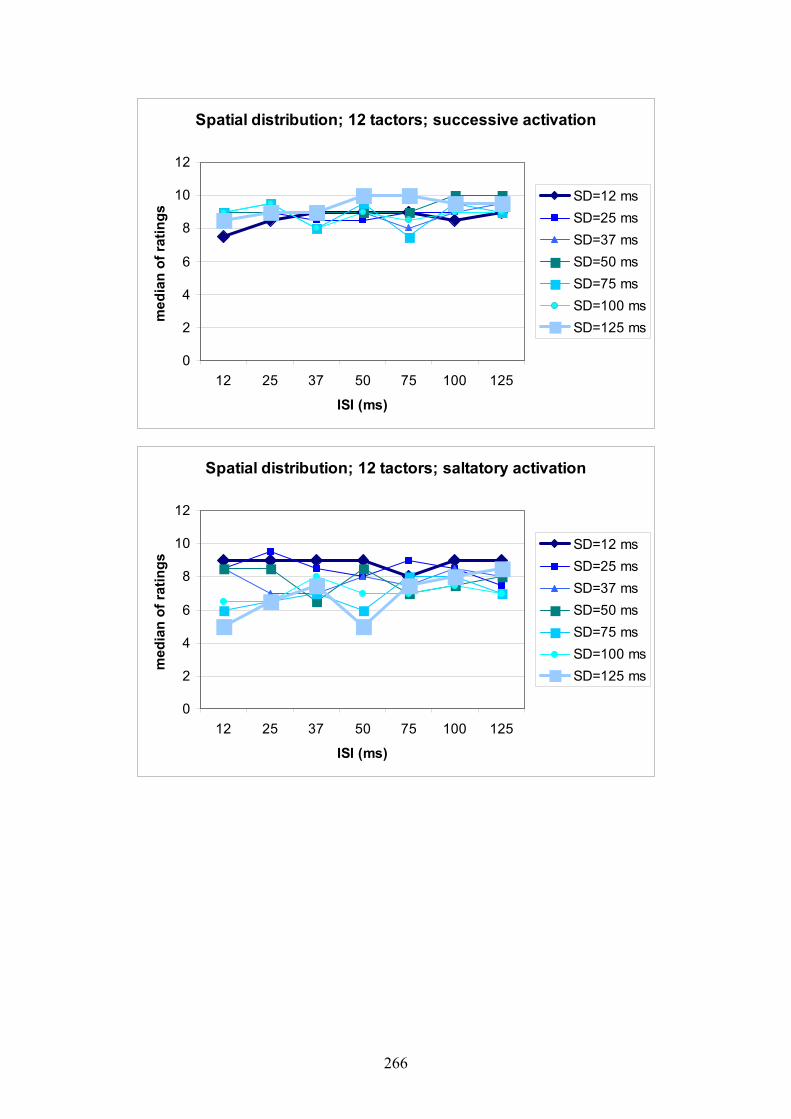
266
Spatial distribution; 12 tactors; successive activation
0
2
4
6
8
10
12
12 25 37 50 75 100 125
ISI (ms)
med
ian
of ra
tings
SD=12 msSD=25 msSD=37 msSD=50 msSD=75 msSD=100 msSD=125 ms
Spatial distribution; 12 tactors; saltatory activation
0
2
4
6
8
10
12
12 25 37 50 75 100 125
ISI (ms)
med
ian
of ra
tings
SD=12 msSD=25 msSD=37 msSD=50 msSD=75 msSD=100 msSD=125 ms
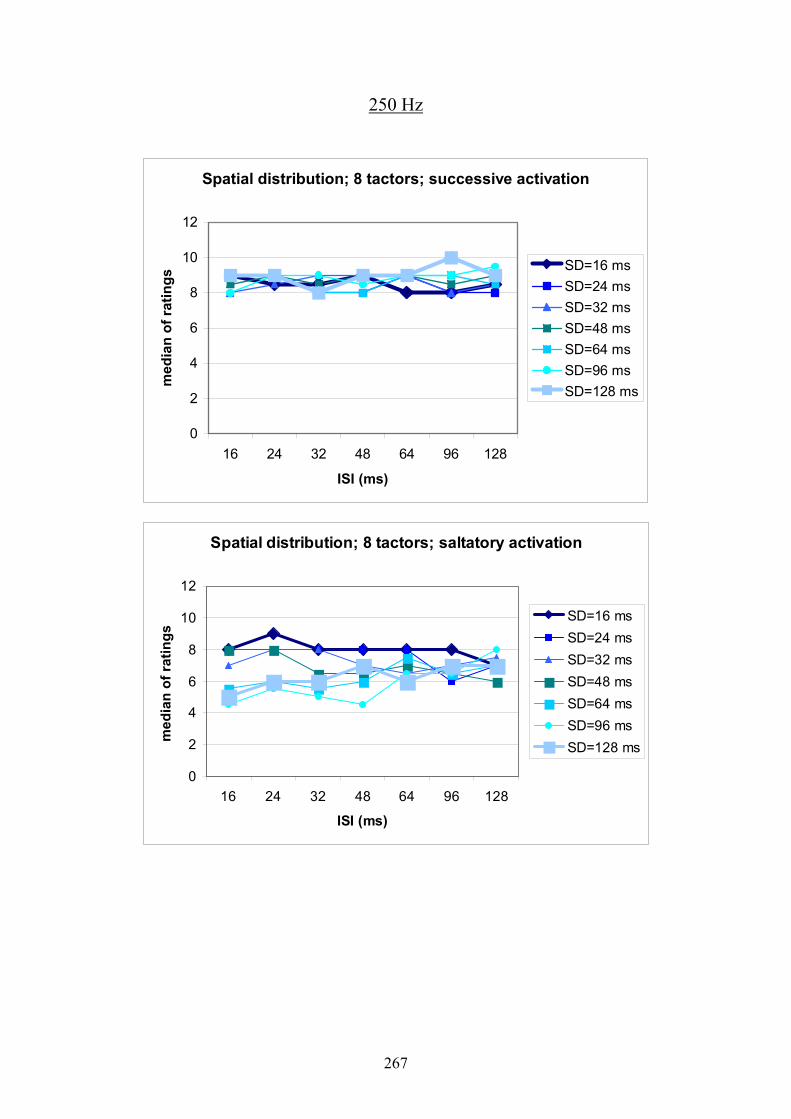
267
250 Hz
Spatial distribution; 8 tactors; successive activation
0
2
4
6
8
10
12
16 24 32 48 64 96 128
ISI (ms)
med
ian
of ra
tings
SD=16 msSD=24 msSD=32 msSD=48 msSD=64 msSD=96 msSD=128 ms
Spatial distribution; 8 tactors; saltatory activation
0
2
4
6
8
10
12
16 24 32 48 64 96 128
ISI (ms)
med
ian
of ra
tings
SD=16 msSD=24 msSD=32 msSD=48 msSD=64 msSD=96 msSD=128 ms
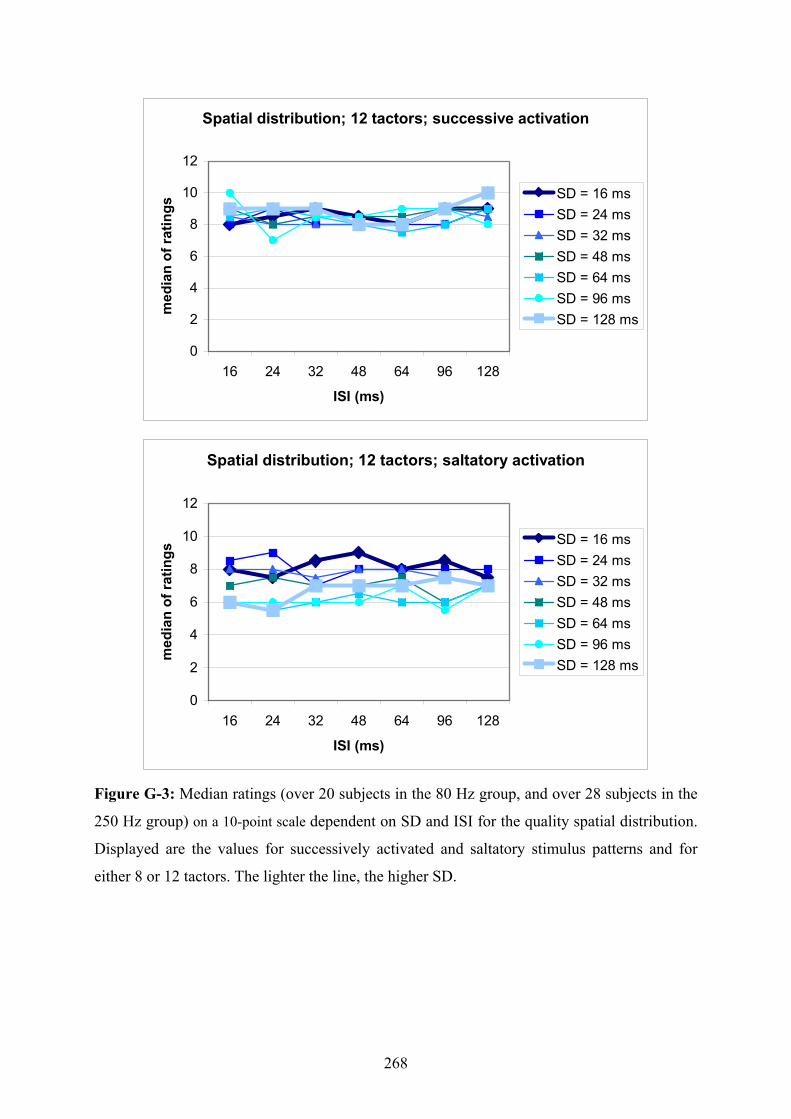
268
Spatial distribution; 12 tactors; successive activation
0
2
4
6
8
10
12
16 24 32 48 64 96 128
ISI (ms)
med
ian
of ra
tings
SD = 16 msSD = 24 msSD = 32 msSD = 48 msSD = 64 msSD = 96 msSD = 128 ms
Spatial distribution; 12 tactors; saltatory activation
0
2
4
6
8
10
12
16 24 32 48 64 96 128
ISI (ms)
med
ian
of ra
tings
SD = 16 msSD = 24 msSD = 32 msSD = 48 msSD = 64 msSD = 96 msSD = 128 ms
Figure G-3: Median ratings (over 20 subjects in the 80 Hz group, and over 28 subjects in the
250 Hz group) on a 10-point scale dependent on SD and ISI for the quality spatial distribution.
Displayed are the values for successively activated and saltatory stimulus patterns and for
either 8 or 12 tactors. The lighter the line, the higher SD.
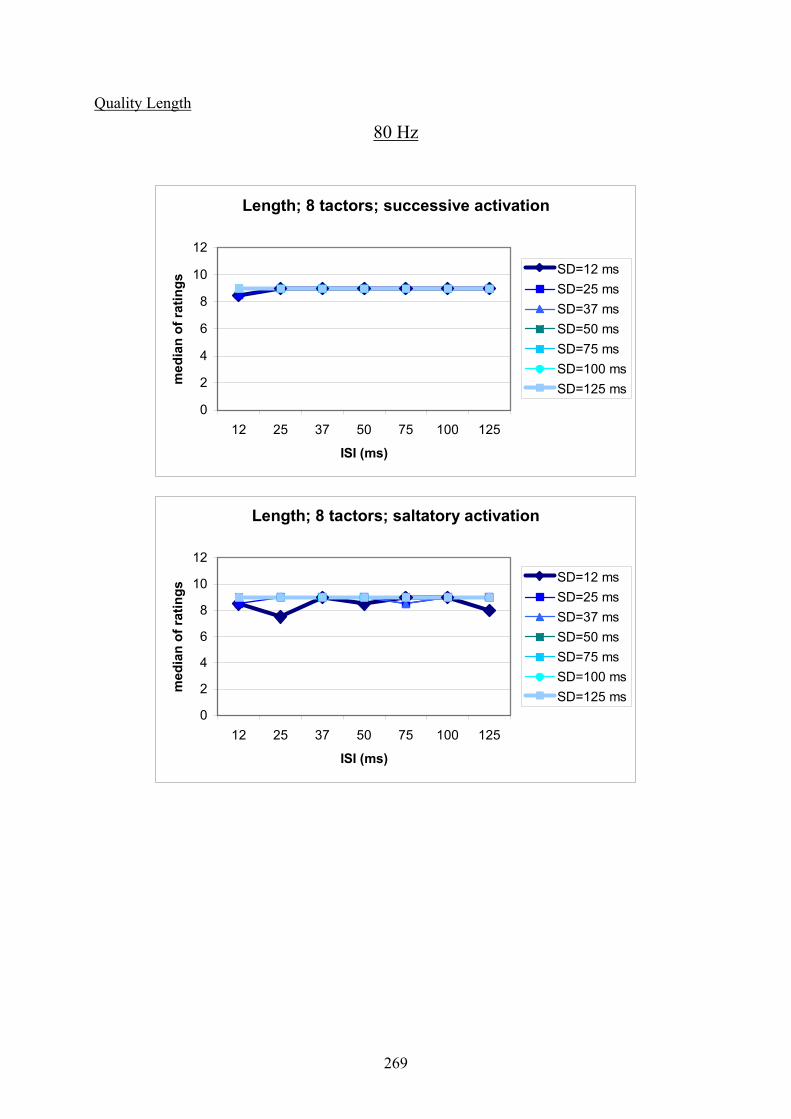
269
Quality Length
80 Hz
Length; 8 tactors; successive activation
0
2
4
6
8
10
12
12 25 37 50 75 100 125
ISI (ms)
med
ian
of ra
tings
SD=12 msSD=25 msSD=37 msSD=50 msSD=75 msSD=100 msSD=125 ms
Length; 8 tactors; saltatory activation
0
2
4
6
8
10
12
12 25 37 50 75 100 125
ISI (ms)
med
ian
of ra
tings
SD=12 msSD=25 msSD=37 msSD=50 msSD=75 msSD=100 msSD=125 ms
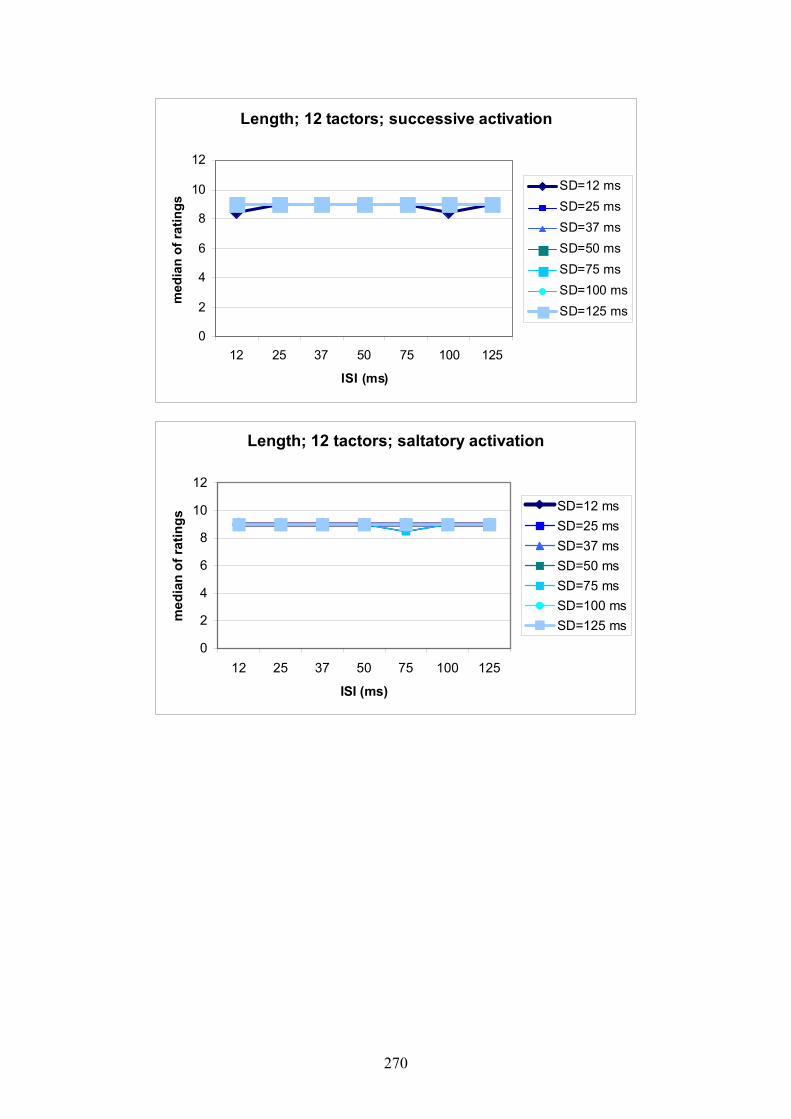
270
Length; 12 tactors; successive activation
0
2
4
6
8
10
12
12 25 37 50 75 100 125
ISI (ms)
med
ian
of ra
tings
SD=12 msSD=25 msSD=37 msSD=50 msSD=75 msSD=100 msSD=125 ms
Length; 12 tactors; saltatory activation
0
2
4
6
8
10
12
12 25 37 50 75 100 125
ISI (ms)
med
ian
of ra
tings
SD=12 msSD=25 msSD=37 msSD=50 msSD=75 msSD=100 msSD=125 ms
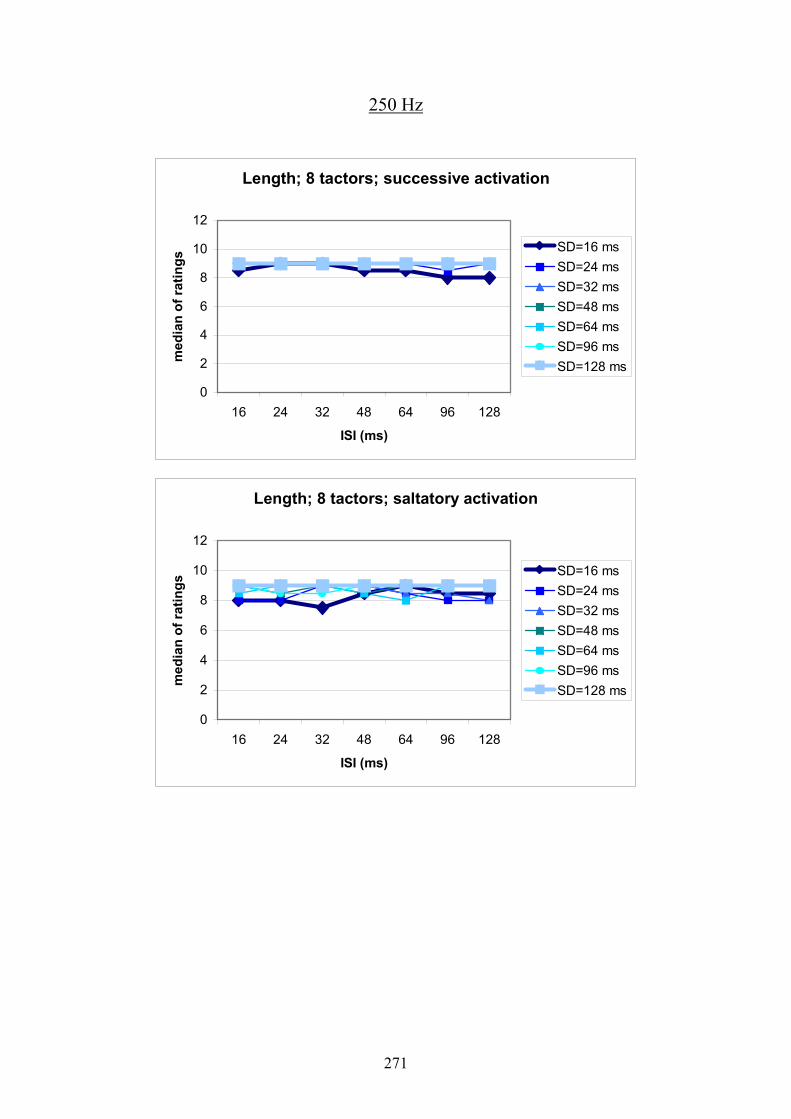
271
250 Hz
Length; 8 tactors; successive activation
0
2
4
6
8
10
12
16 24 32 48 64 96 128
ISI (ms)
med
ian
of ra
tings
SD=16 msSD=24 msSD=32 msSD=48 msSD=64 msSD=96 msSD=128 ms
Length; 8 tactors; saltatory activation
0
2
4
6
8
10
12
16 24 32 48 64 96 128
ISI (ms)
med
ian
of ra
tings
SD=16 msSD=24 msSD=32 msSD=48 msSD=64 msSD=96 msSD=128 ms
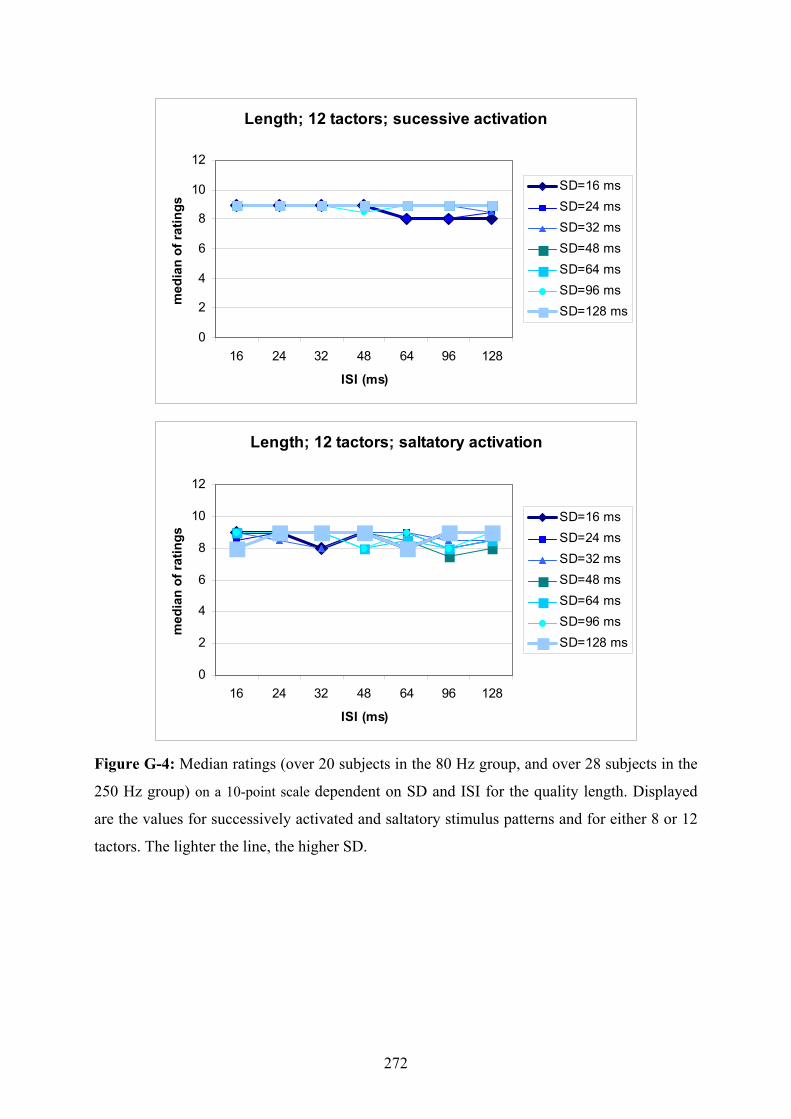
272
Length; 12 tactors; sucessive activation
0
2
4
6
8
10
12
16 24 32 48 64 96 128
ISI (ms)
med
ian
of ra
tings
SD=16 msSD=24 msSD=32 msSD=48 msSD=64 msSD=96 msSD=128 ms
Length; 12 tactors; saltatory activation
0
2
4
6
8
10
12
16 24 32 48 64 96 128
ISI (ms)
med
ian
of ra
tings
SD=16 msSD=24 msSD=32 msSD=48 msSD=64 msSD=96 msSD=128 ms
Figure G-4: Median ratings (over 20 subjects in the 80 Hz group, and over 28 subjects in the
250 Hz group) on a 10-point scale dependent on SD and ISI for the quality length. Displayed
are the values for successively activated and saltatory stimulus patterns and for either 8 or 12
tactors. The lighter the line, the higher SD.
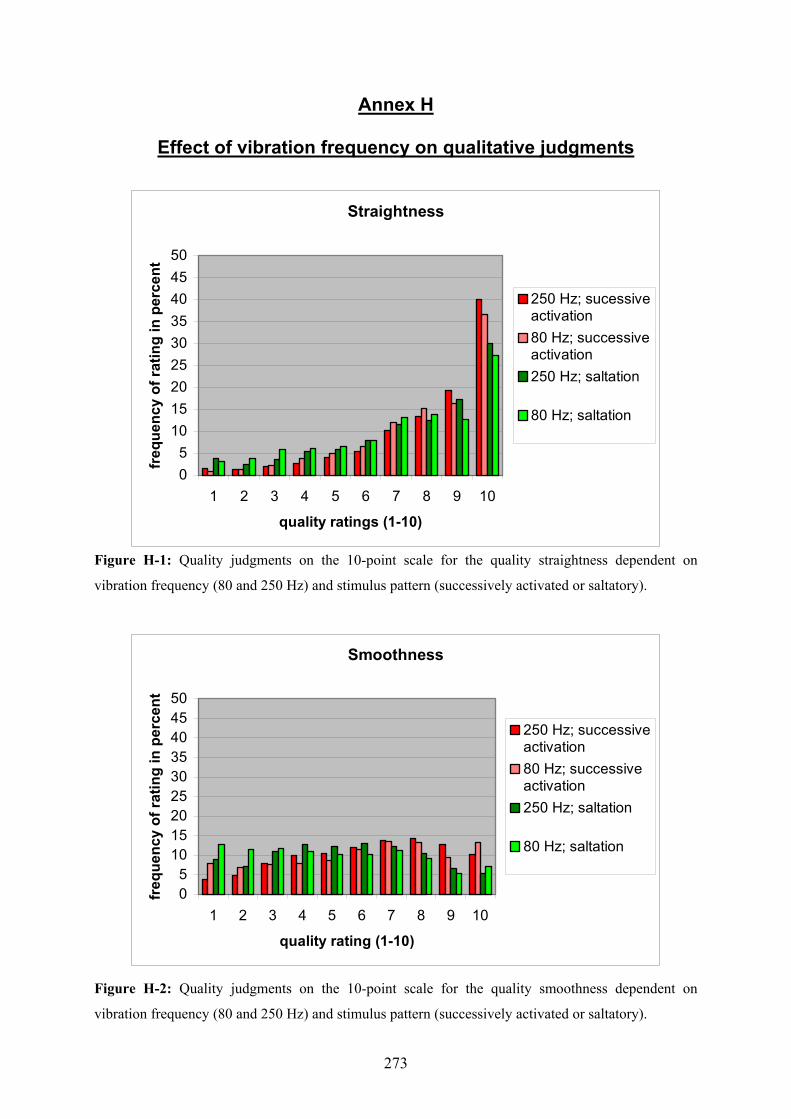
273
Annex H
Effect of vibration frequency on qualitative judgments
Straightness
05
101520253035404550
1 2 3 4 5 6 7 8 9 10
quality ratings (1-10)
freq
uenc
y of
ratin
g in
per
cent
250 Hz; sucessiveactivation80 Hz; successiveactivation250 Hz; saltation
80 Hz; saltation
Figure H-1: Quality judgments on the 10-point scale for the quality straightness dependent on
vibration frequency (80 and 250 Hz) and stimulus pattern (successively activated or saltatory).
Smoothness
05
101520253035404550
1 2 3 4 5 6 7 8 9 10
quality rating (1-10)
freq
uenc
y of
ratin
g in
per
cent
250 Hz; successiveactivation80 Hz; successiveactivation250 Hz; saltation
80 Hz; saltation
Figure H-2: Quality judgments on the 10-point scale for the quality smoothness dependent on
vibration frequency (80 and 250 Hz) and stimulus pattern (successively activated or saltatory).
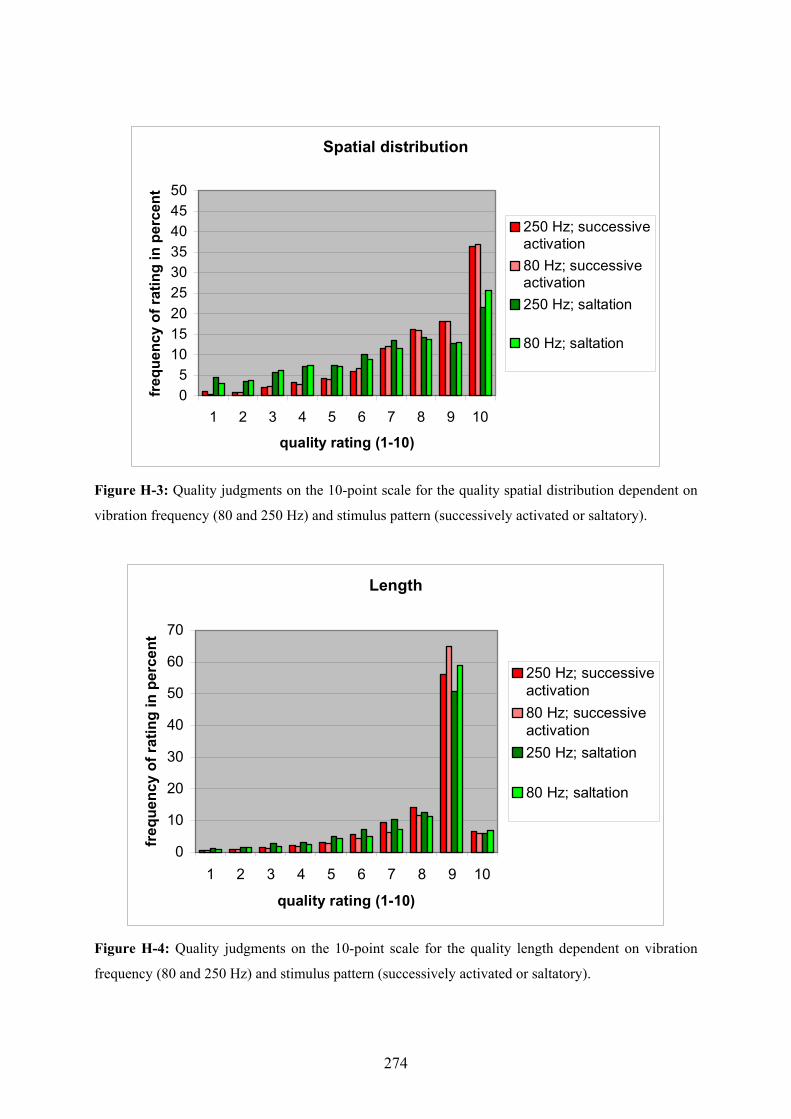
274
Spatial distribution
05
101520253035404550
1 2 3 4 5 6 7 8 9 10
quality rating (1-10)
freq
uenc
y of
ratin
g in
per
cent
250 Hz; successiveactivation80 Hz; successiveactivation250 Hz; saltation
80 Hz; saltation
Figure H-3: Quality judgments on the 10-point scale for the quality spatial distribution dependent on
vibration frequency (80 and 250 Hz) and stimulus pattern (successively activated or saltatory).
Length
0
10
20
30
40
50
60
70
1 2 3 4 5 6 7 8 9 10
quality rating (1-10)
freq
uenc
y of
ratin
g in
per
cent
250 Hz; successiveactivation80 Hz; successiveactivation250 Hz; saltation
80 Hz; saltation
Figure H-4: Quality judgments on the 10-point scale for the quality length dependent on vibration
frequency (80 and 250 Hz) and stimulus pattern (successively activated or saltatory).

275
Annex I
Experimenter Script for Experiment 2 (Part 1): Same/different discrimination
In this experiment, you will receive two sets of stimuli and be asked to determine whether they were the “Same or Different” from one another. You will make your judgment by pressing a button on the keyboard (S if both lines are the Same or D if both lines are Different). This test will help us to evaluate the optimal parameters to present vibrotactile flo over the torso. First, I need you to change into a t-shirt for the testing. This is important, because we cannot fairly compare the results if our participants are wearing different types of clothing. This is a freshly cleaned t-shirt that we will keep in the lab for testing you. Now, I need to measure your waist and I will mark your naval on the t-shirt. Then I would like to collect some basic information from you. I would like you to read and sign the consent-form and then to fill out the Medical Questionnaire. Meanwhile: Put tactors on belt. Place belt on participant. I’ve placed a belt containing 36 tactors around you. Either only the middle row, or all three rows will be activated. When the tactors activate they vibrate like a pager motor or cell phone. The only difference between today and tomorrow’s session is the number of activated tactors. We will now go through the instruction phase together: At first, you will read “Rotating Tactors” on the display. If you press the “Align “ button, the display will read ‘1 ready’. Press the “Align” button again and the tactors will activate in a circle around your torso. There will be 12 tactors (columns of tactors) that activate. Count them as they go along to ensure you can feel a tactor activate at every position. This process will be repeated two more times. Now the display will read “Threshold Measure.” This is a measure to determine your individual threshold – or point where you can just feel all of the tactors activate. After we determine that point, we will increase the intensity by 10 times to ensure you will be able to feel all of the tactors activate during the experiment.
276
In order to determine your threshold, push the “Align” button and all of the tactors will activate in a circle around your torso. Each time you push this button, the intensity will decrease. As the pattern goes from tactor site to tactor site, count them off in your head so you can tell me which one disappeared first. If you cannot fell all tactors on the first attempt, let me know and I will increase the intensity. You are asked to wear the headphones for this section of the experiment. (headphones, subject presses “S” when threshold is reached). The display will reads “Test Series”, press the Align button and the display will read “Block 1.” Press the “Align” button and “same/different” will appear on the visual display. Press the “Align” button again and read “Ready.” Your next keystroke, the “Align” button, will activate the system. During the experiment, you will be presented with two sets of stimuli around your torso. After the first set of stimuli is presented, there will be a brief break and then the second will automatically begin. After the second set is presented, you will answer “Same or Different” by pressing either the “S” button for Same or the “D” button for Different. No feedback will be given throughout the test. After you answer, press the “Align” button to get the next stimuli. You control when the stimuli are presented by pressing the align key. Today’s test will consist of 4 blocks of trials, each consisting of 98 sets of stimuli. You will perform the same task in all of the blocks. You can take a brief break in between the blocks if you wish. To start the next block of trials, hit the “Align” button again. Do you have any questions? Headphones!

277
Annex K
Experimenter Script for Experiment 2 (Part 2): Which is best Purpose In this experiment, you will receive two sets of stimuli and be asked to determine “which is best.” This will be judged by pressing a button on the keyboard (#1 for the first set of stimuli and #2 for the second set of stimuli). There are no correct or incorrect responses simply because you are rating which of these two patterns feels best to you. This test will help us to evaluate the optimal parameters to present vibrotactile flo over the torso. First, I need you to change into a t-shirt for the testing. This is important, because we cannot fairly compare the results if our participants are wearing different types of clothing. This is a freshly cleaned t-shirt that we will keep in the lab for testing you. Now, I need to measure your waist and I will mark your naval on the t-shirt. Then I would like to collect some basic information from you. I would like you to read and sign the consent-form and then to fill out the Medical Questionnaire. Meanwhile: Put tactors on belt. Place belt on participant. I’ve placed a belt containing 36 tactors around you. For the first part of today’s experiment, only the middle row of 12 (all 36 tactors) will activate. During the second part of today’s experiment the middle row of 12 (all 36) tactors will activate. When the tactors activate they vibrate much like a pager motor We will now go through the instruction phase together: At first, you will read “Rotating Tactors” on the display. If you press the “Align “ button, the display will read ‘1 ready’. The next time you press the “Align” button the tactors will activate in a circle around your torso. The intention of this display is to give you an opportunity to experience what the tactors feel like, and to make sure that all 12 sites can be felt. This process will be repeated two more times. Now the display will read “Threshold Measure.” This is a measure to determine your individual threshold – or point where you can just feel all of the tactors. After we determine that point, we will increase the intensity by a factor of
278
10 to ensure you will be able to feel all of the tactors activate during the experiment. In order to determine your threshold, push the “Align” button and all of the tactors will activate in a circle around your torso. Each time you push this button, the intensity will decrease. As the pattern goes from tactor site to tactor site, count them off from 1 through 12 so you can tell me which one disappears first. Let me know the first time you cannot feel any one tactor and we will lock your threshold in at that level (this is done by pressing the #1 button). Also, please inform me of which tactor it was that you did not feel. If you cannot feel any one tactor on the first attempt, let me know and I will increase the overall intensity. Now the display will read “Test Series.” Press the ‘Align” button and the display will read “Block 1.” Press the “Align” button again and the display will read “which is best”. Press the “Align” button one more time and the display will read “ready.” Your next keystroke on the “Align” button will activate the system to present you with a stimulus trial consisting of the pair of patterns. During the experiment, you will be presented with two sets of stimuli around your torso. After the first set of stimuli is presented, there will be a brief break and then the second will automatically begin. After the second set is presented, you will answer “which is best” by pressing either #1 for the first set of stimuli or #2 for the second set of stimuli. Again, there are no right or wrong answers and no feedback will be given. We are interested in determining which set of stimuli you perceive to be the best. By “which is best,” we mean what set felt overall better. Guidelines to determine this include: which line felt straighter, smoother, or had sites that felt equally distributed in both space and time. All patterns will vary in terms of how long the burst lasts and the time in between bursts. After you answer, press the “Align” button to get the next stimulus. Again, when you see “ready,” your next keystroke will activate the system to present you with a stimulus trial. You always control when the stimuli are presented by pressing the align key until you see “ready,” preparing you for your next trial. Today’s test will have 2 sessions, each consisting of two blocks of trials. Each block of trials will have of 98 sets of stimuli. When the second block has been completed I will remove the belt so you can take a break. After the break, we will begin the second part of today’s experiment. The total test time is approximately 1 hour. Do you have any questions? Headphones!

279
WHICH IS BEST?
Which line felt:
• Straighter
• Smoother
• Equally distributed in both space & time
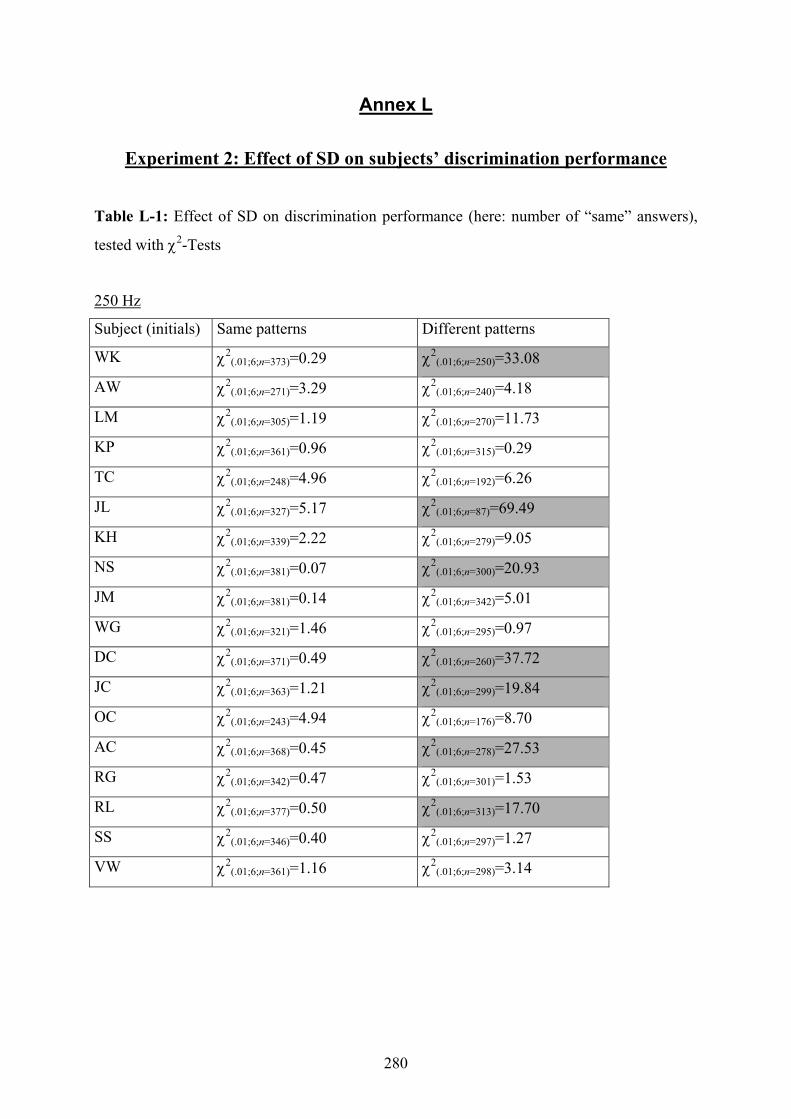
280
Annex L
Experiment 2: Effect of SD on subjects’ discrimination performance
Table L-1: Effect of SD on discrimination performance (here: number of “same” answers),
tested with χ2-Tests
250 Hz
Subject (initials) Same patterns Different patterns
WK χ2(.01;6;n=373)=0.29 χ2
(.01;6;n=250)=33.08
AW χ2(.01;6;n=271)=3.29 χ2
(.01;6;n=240)=4.18
LM χ2(.01;6;n=305)=1.19 χ2
(.01;6;n=270)=11.73
KP χ2(.01;6;n=361)=0.96 χ2
(.01;6;n=315)=0.29
TC χ2(.01;6;n=248)=4.96 χ2
(.01;6;n=192)=6.26
JL χ2(.01;6;n=327)=5.17 χ2
(.01;6;n=87)=69.49
KH χ2(.01;6;n=339)=2.22 χ2
(.01;6;n=279)=9.05
NS χ2(.01;6;n=381)=0.07 χ2
(.01;6;n=300)=20.93
JM χ2(.01;6;n=381)=0.14 χ2
(.01;6;n=342)=5.01
WG χ2(.01;6;n=321)=1.46 χ2
(.01;6;n=295)=0.97
DC χ2(.01;6;n=371)=0.49 χ2
(.01;6;n=260)=37.72
JC χ2(.01;6;n=363)=1.21 χ2
(.01;6;n=299)=19.84
OC χ2(.01;6;n=243)=4.94 χ2
(.01;6;n=176)=8.70
AC χ2(.01;6;n=368)=0.45 χ2
(.01;6;n=278)=27.53
RG χ2(.01;6;n=342)=0.47 χ2
(.01;6;n=301)=1.53
RL χ2(.01;6;n=377)=0.50 χ2
(.01;6;n=313)=17.70
SS χ2(.01;6;n=346)=0.40 χ2
(.01;6;n=297)=1.27
VW χ2(.01;6;n=361)=1.16 χ2
(.01;6;n=298)=3.14
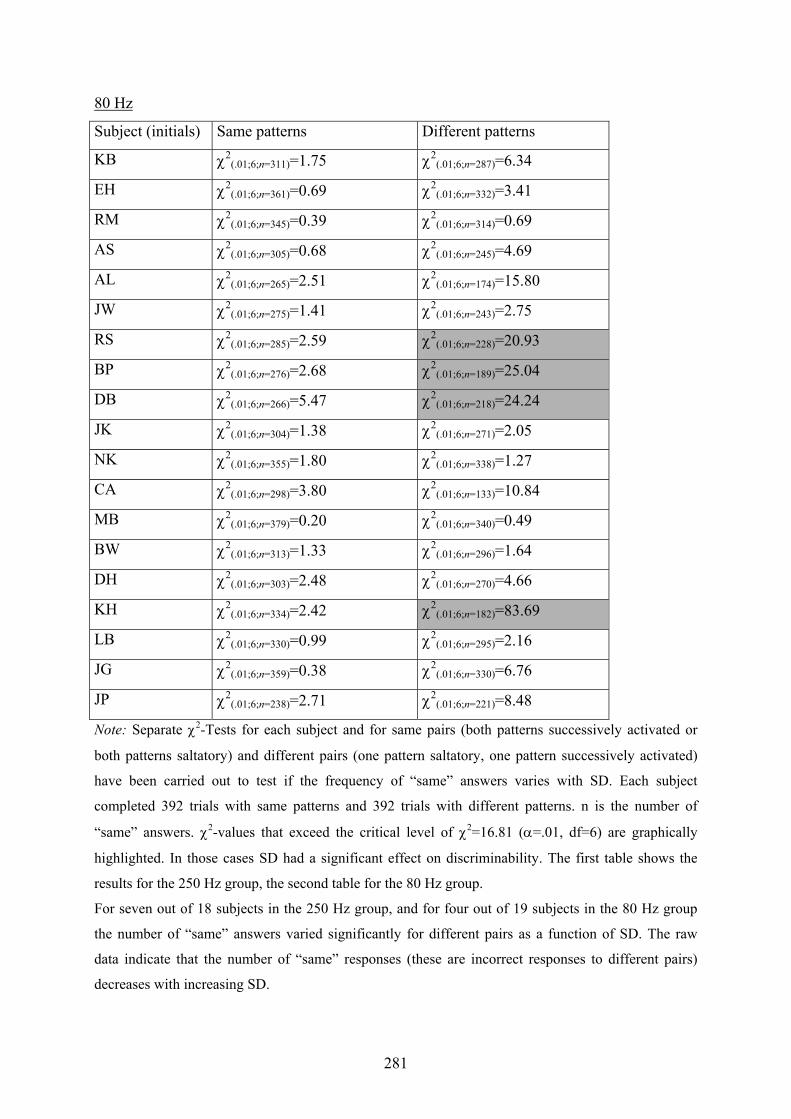
281
80 Hz
Subject (initials) Same patterns Different patterns
KB χ2(.01;6;n=311)=1.75 χ2
(.01;6;n=287)=6.34
EH χ2(.01;6;n=361)=0.69 χ2
(.01;6;n=332)=3.41
RM χ2(.01;6;n=345)=0.39 χ2
(.01;6;n=314)=0.69
AS χ2(.01;6;n=305)=0.68 χ2
(.01;6;n=245)=4.69
AL χ2(.01;6;n=265)=2.51 χ2
(.01;6;n=174)=15.80
JW χ2(.01;6;n=275)=1.41 χ2
(.01;6;n=243)=2.75
RS χ2(.01;6;n=285)=2.59 χ2
(.01;6;n=228)=20.93
BP χ2(.01;6;n=276)=2.68 χ2
(.01;6;n=189)=25.04
DB χ2(.01;6;n=266)=5.47 χ2
(.01;6;n=218)=24.24
JK χ2(.01;6;n=304)=1.38 χ2
(.01;6;n=271)=2.05
NK χ2(.01;6;n=355)=1.80 χ2
(.01;6;n=338)=1.27
CA χ2(.01;6;n=298)=3.80 χ2
(.01;6;n=133)=10.84
MB χ2(.01;6;n=379)=0.20 χ2
(.01;6;n=340)=0.49
BW χ2(.01;6;n=313)=1.33 χ2
(.01;6;n=296)=1.64
DH χ2(.01;6;n=303)=2.48 χ2
(.01;6;n=270)=4.66
KH χ2(.01;6;n=334)=2.42 χ2
(.01;6;n=182)=83.69
LB χ2(.01;6;n=330)=0.99 χ2
(.01;6;n=295)=2.16
JG χ2(.01;6;n=359)=0.38 χ2
(.01;6;n=330)=6.76
JP χ2(.01;6;n=238)=2.71 χ2
(.01;6;n=221)=8.48
Note: Separate χ2-Tests for each subject and for same pairs (both patterns successively activated or
both patterns saltatory) and different pairs (one pattern saltatory, one pattern successively activated)
have been carried out to test if the frequency of “same” answers varies with SD. Each subject
completed 392 trials with same patterns and 392 trials with different patterns. n is the number of
“same” answers. χ2-values that exceed the critical level of χ2=16.81 (α=.01, df=6) are graphically
highlighted. In those cases SD had a significant effect on discriminability. The first table shows the
results for the 250 Hz group, the second table for the 80 Hz group.
For seven out of 18 subjects in the 250 Hz group, and for four out of 19 subjects in the 80 Hz group
the number of “same” answers varied significantly for different pairs as a function of SD. The raw
data indicate that the number of “same” responses (these are incorrect responses to different pairs)
decreases with increasing SD.
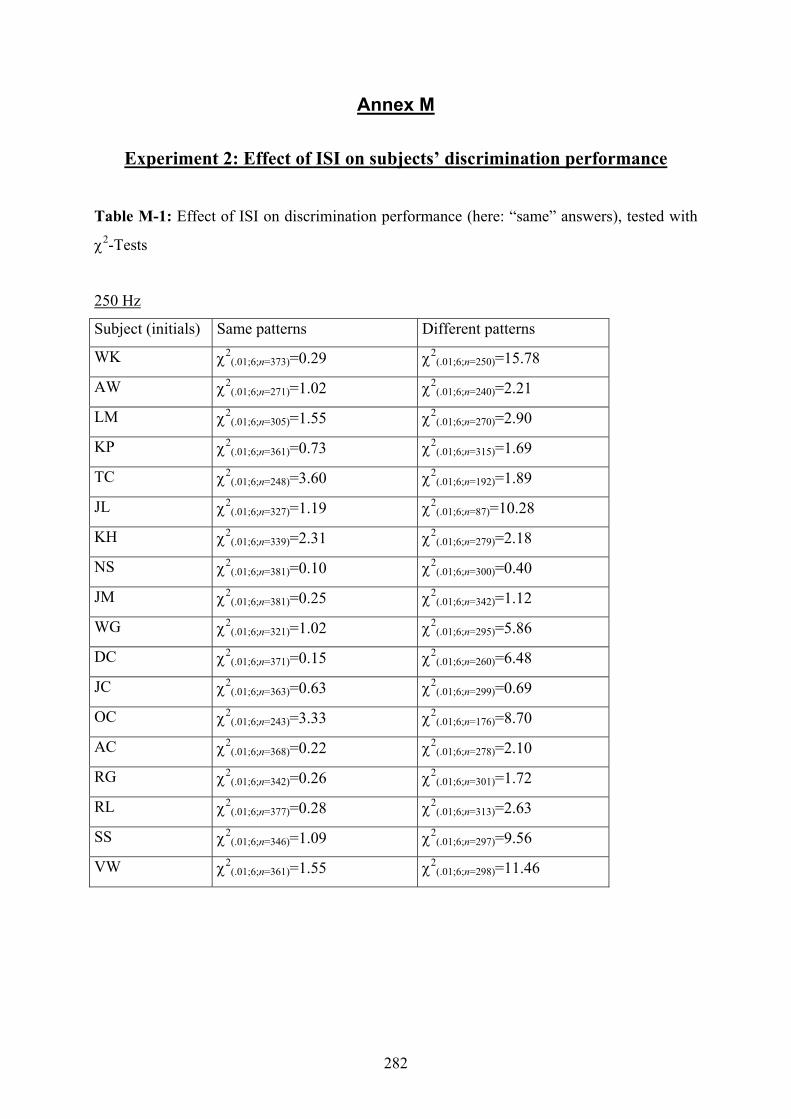
282
Annex M
Experiment 2: Effect of ISI on subjects’ discrimination performance
Table M-1: Effect of ISI on discrimination performance (here: “same” answers), tested with
χ2-Tests
250 Hz
Subject (initials) Same patterns Different patterns
WK χ2(.01;6;n=373)=0.29 χ2
(.01;6;n=250)=15.78
AW χ2(.01;6;n=271)=1.02 χ2
(.01;6;n=240)=2.21
LM χ2(.01;6;n=305)=1.55 χ2
(.01;6;n=270)=2.90
KP χ2(.01;6;n=361)=0.73 χ2
(.01;6;n=315)=1.69
TC χ2(.01;6;n=248)=3.60 χ2
(.01;6;n=192)=1.89
JL χ2(.01;6;n=327)=1.19 χ2
(.01;6;n=87)=10.28
KH χ2(.01;6;n=339)=2.31 χ2
(.01;6;n=279)=2.18
NS χ2(.01;6;n=381)=0.10 χ2
(.01;6;n=300)=0.40
JM χ2(.01;6;n=381)=0.25 χ2
(.01;6;n=342)=1.12
WG χ2(.01;6;n=321)=1.02 χ2
(.01;6;n=295)=5.86
DC χ2(.01;6;n=371)=0.15 χ2
(.01;6;n=260)=6.48
JC χ2(.01;6;n=363)=0.63 χ2
(.01;6;n=299)=0.69
OC χ2(.01;6;n=243)=3.33 χ2
(.01;6;n=176)=8.70
AC χ2(.01;6;n=368)=0.22 χ2
(.01;6;n=278)=2.10
RG χ2(.01;6;n=342)=0.26 χ2
(.01;6;n=301)=1.72
RL χ2(.01;6;n=377)=0.28 χ2
(.01;6;n=313)=2.63
SS χ2(.01;6;n=346)=1.09 χ2
(.01;6;n=297)=9.56
VW χ2(.01;6;n=361)=1.55 χ2
(.01;6;n=298)=11.46
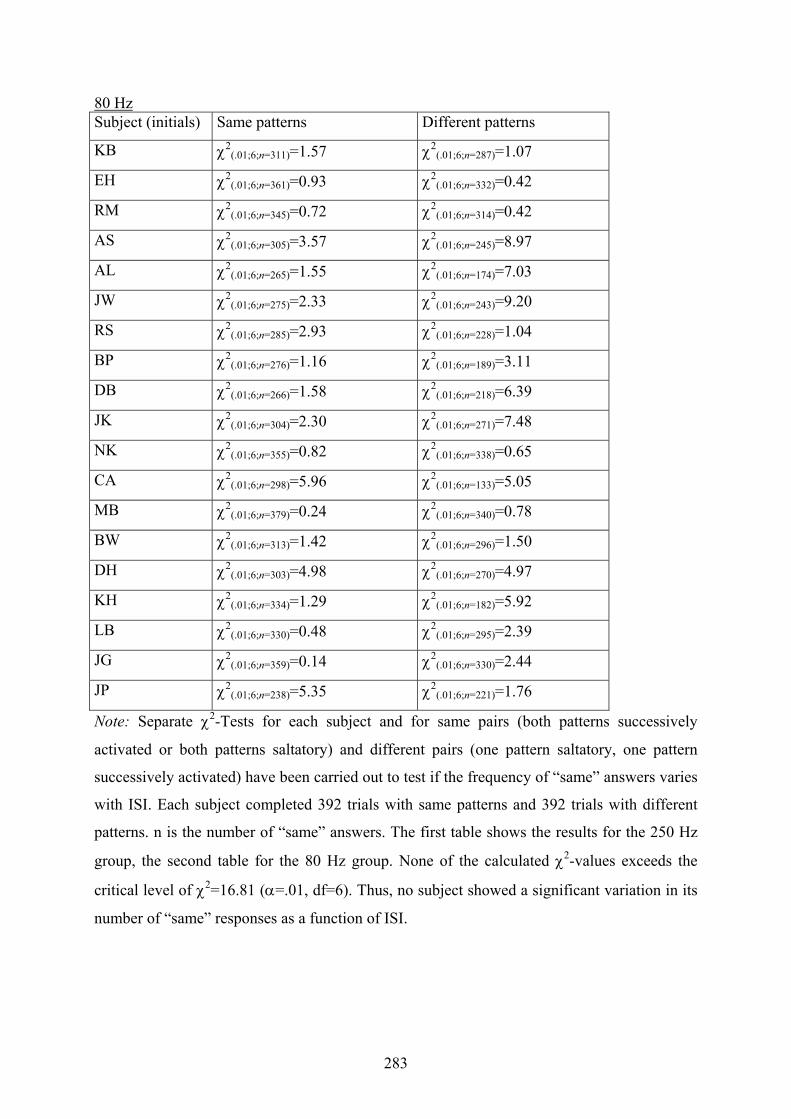
283
80 Hz Subject (initials) Same patterns Different patterns
KB χ2(.01;6;n=311)=1.57 χ2
(.01;6;n=287)=1.07
EH χ2(.01;6;n=361)=0.93 χ2
(.01;6;n=332)=0.42
RM χ2(.01;6;n=345)=0.72 χ2
(.01;6;n=314)=0.42
AS χ2(.01;6;n=305)=3.57 χ2
(.01;6;n=245)=8.97
AL χ2(.01;6;n=265)=1.55 χ2
(.01;6;n=174)=7.03
JW χ2(.01;6;n=275)=2.33 χ2
(.01;6;n=243)=9.20
RS χ2(.01;6;n=285)=2.93 χ2
(.01;6;n=228)=1.04
BP χ2(.01;6;n=276)=1.16 χ2
(.01;6;n=189)=3.11
DB χ2(.01;6;n=266)=1.58 χ2
(.01;6;n=218)=6.39
JK χ2(.01;6;n=304)=2.30 χ2
(.01;6;n=271)=7.48
NK χ2(.01;6;n=355)=0.82 χ2
(.01;6;n=338)=0.65
CA χ2(.01;6;n=298)=5.96 χ2
(.01;6;n=133)=5.05
MB χ2(.01;6;n=379)=0.24 χ2
(.01;6;n=340)=0.78
BW χ2(.01;6;n=313)=1.42 χ2
(.01;6;n=296)=1.50
DH χ2(.01;6;n=303)=4.98 χ2
(.01;6;n=270)=4.97
KH χ2(.01;6;n=334)=1.29 χ2
(.01;6;n=182)=5.92
LB χ2(.01;6;n=330)=0.48 χ2
(.01;6;n=295)=2.39
JG χ2(.01;6;n=359)=0.14 χ2
(.01;6;n=330)=2.44
JP χ2(.01;6;n=238)=5.35 χ2
(.01;6;n=221)=1.76
Note: Separate χ2-Tests for each subject and for same pairs (both patterns successively
activated or both patterns saltatory) and different pairs (one pattern saltatory, one pattern
successively activated) have been carried out to test if the frequency of “same” answers varies
with ISI. Each subject completed 392 trials with same patterns and 392 trials with different
patterns. n is the number of “same” answers. The first table shows the results for the 250 Hz
group, the second table for the 80 Hz group. None of the calculated χ2-values exceeds the
critical level of χ2=16.81 (α=.01, df=6). Thus, no subject showed a significant variation in its
number of “same” responses as a function of ISI.
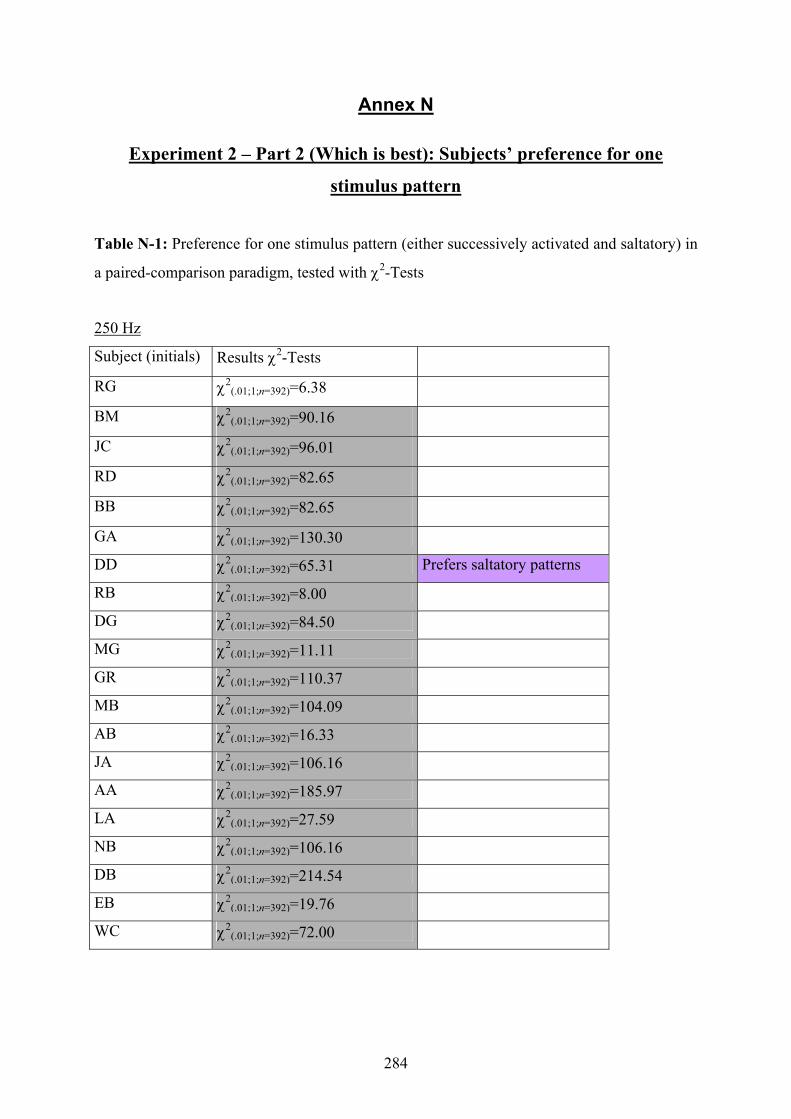
284
Annex N
Experiment 2 – Part 2 (Which is best): Subjects’ preference for one
stimulus pattern
Table N-1: Preference for one stimulus pattern (either successively activated and saltatory) in
a paired-comparison paradigm, tested with χ2-Tests
250 Hz
Subject (initials) Results χ2-Tests
RG χ2(.01;1;n=392)=6.38
BM χ2(.01;1;n=392)=90.16
JC χ2(.01;1;n=392)=96.01
RD χ2(.01;1;n=392)=82.65
BB χ2(.01;1;n=392)=82.65
GA χ2(.01;1;n=392)=130.30
DD χ2(.01;1;n=392)=65.31 Prefers saltatory patterns
RB χ2(.01;1;n=392)=8.00
DG χ2(.01;1;n=392)=84.50
MG χ2(.01;1;n=392)=11.11
GR χ2(.01;1;n=392)=110.37
MB χ2(.01;1;n=392)=104.09
AB χ2(.01;1;n=392)=16.33
JA χ2(.01;1;n=392)=106.16
AA χ2(.01;1;n=392)=185.97
LA χ2(.01;1;n=392)=27.59
NB χ2(.01;1;n=392)=106.16
DB χ2(.01;1;n=392)=214.54
EB χ2(.01;1;n=392)=19.76
WC χ2(.01;1;n=392)=72.00
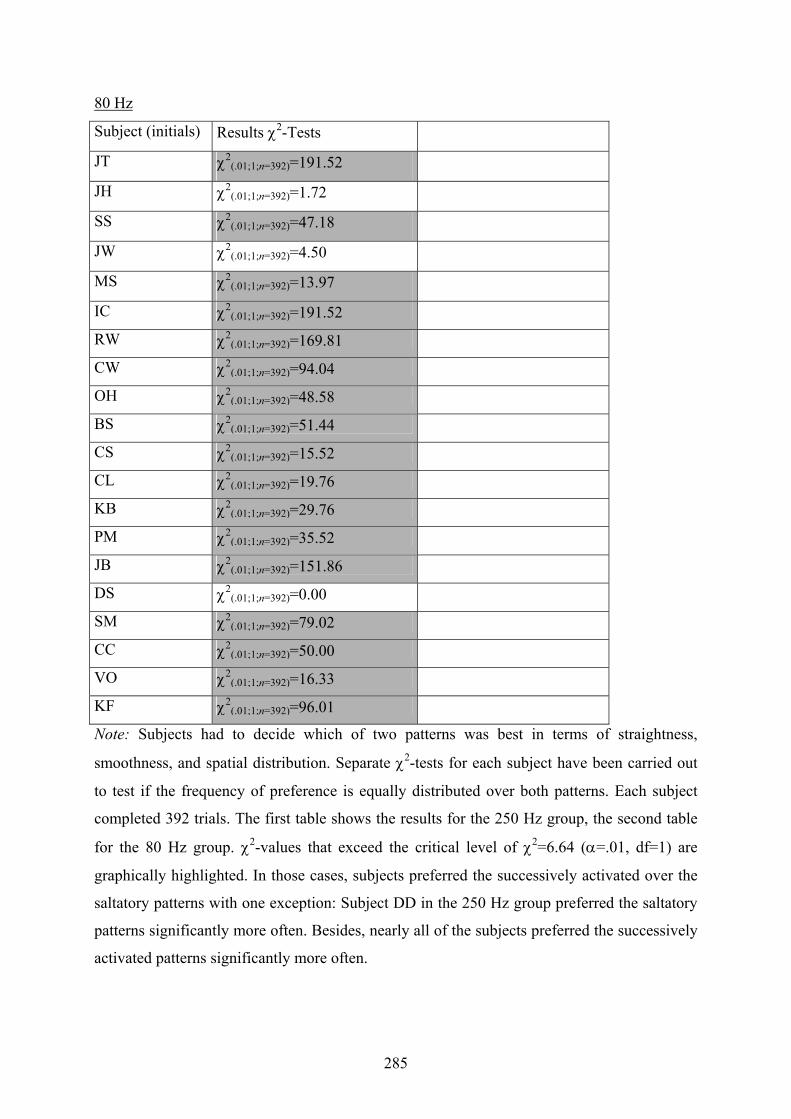
285
80 Hz
Subject (initials) Results χ2-Tests
JT χ2(.01;1;n=392)=191.52
JH χ2(.01;1;n=392)=1.72
SS χ2(.01;1;n=392)=47.18
JW χ2(.01;1;n=392)=4.50
MS χ2(.01;1;n=392)=13.97
IC χ2(.01;1;n=392)=191.52
RW χ2(.01;1;n=392)=169.81
CW χ2(.01;1;n=392)=94.04
OH χ2(.01;1;n=392)=48.58
BS χ2(.01;1;n=392)=51.44
CS χ2(.01;1;n=392)=15.52
CL χ2(.01;1;n=392)=19.76
KB χ2(.01;1;n=392)=29.76
PM χ2(.01;1;n=392)=35.52
JB χ2(.01;1;n=392)=151.86
DS χ2(.01;1;n=392)=0.00
SM χ2(.01;1;n=392)=79.02
CC χ2(.01;1;n=392)=50.00
VO χ2(.01;1;n=392)=16.33
KF χ2(.01;1;n=392)=96.01
Note: Subjects had to decide which of two patterns was best in terms of straightness,
smoothness, and spatial distribution. Separate χ2-tests for each subject have been carried out
to test if the frequency of preference is equally distributed over both patterns. Each subject
completed 392 trials. The first table shows the results for the 250 Hz group, the second table
for the 80 Hz group. χ2-values that exceed the critical level of χ2=6.64 (α=.01, df=1) are
graphically highlighted. In those cases, subjects preferred the successively activated over the
saltatory patterns with one exception: Subject DD in the 250 Hz group preferred the saltatory
patterns significantly more often. Besides, nearly all of the subjects preferred the successively
activated patterns significantly more often.
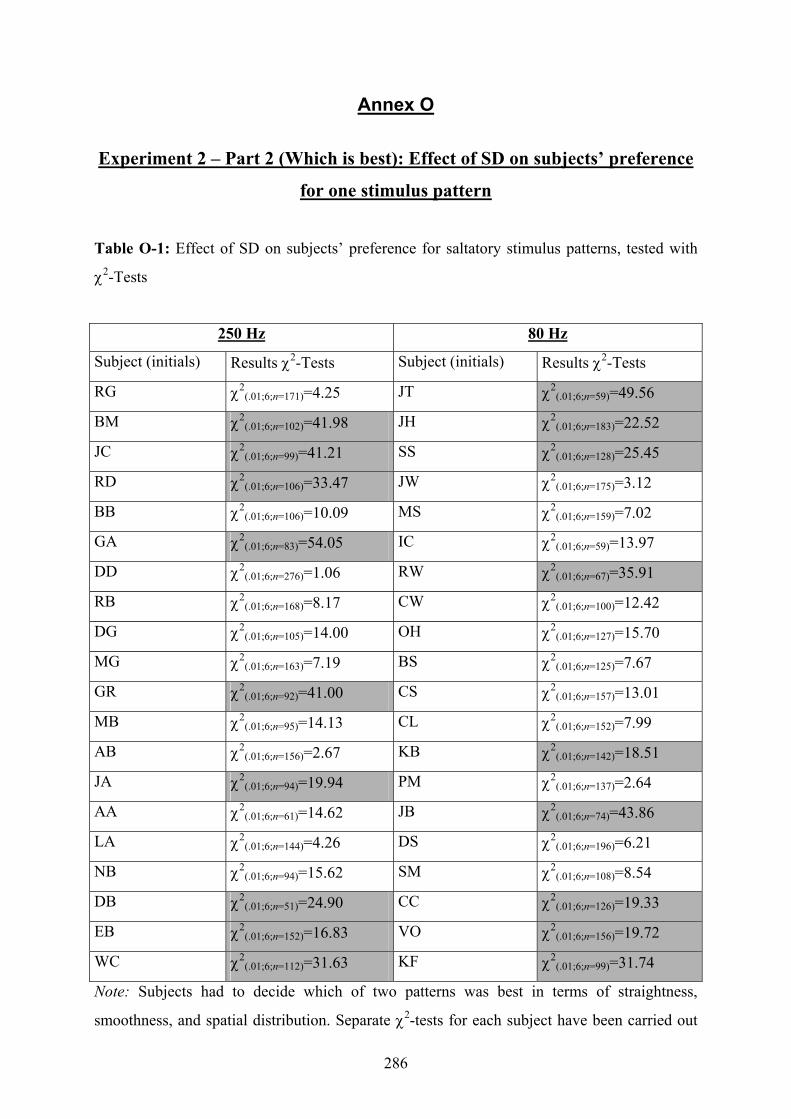
286
Annex O
Experiment 2 – Part 2 (Which is best): Effect of SD on subjects’ preference
for one stimulus pattern
Table O-1: Effect of SD on subjects’ preference for saltatory stimulus patterns, tested with
χ2-Tests
250 Hz 80 Hz
Subject (initials) Results χ2-Tests Subject (initials) Results χ2-Tests
RG χ2(.01;6;n=171)=4.25 JT χ2
(.01;6;n=59)=49.56
BM χ2(.01;6;n=102)=41.98 JH χ2
(.01;6;n=183)=22.52
JC χ2(.01;6;n=99)=41.21 SS χ2
(.01;6;n=128)=25.45
RD χ2(.01;6;n=106)=33.47 JW χ2
(.01;6;n=175)=3.12
BB χ2(.01;6;n=106)=10.09 MS χ2
(.01;6;n=159)=7.02
GA χ2(.01;6;n=83)=54.05 IC χ2
(.01;6;n=59)=13.97
DD χ2(.01;6;n=276)=1.06 RW χ2
(.01;6;n=67)=35.91
RB χ2(.01;6;n=168)=8.17 CW χ2
(.01;6;n=100)=12.42
DG χ2(.01;6;n=105)=14.00 OH χ2
(.01;6;n=127)=15.70
MG χ2(.01;6;n=163)=7.19 BS χ2
(.01;6;n=125)=7.67
GR χ2(.01;6;n=92)=41.00 CS χ2
(.01;6;n=157)=13.01
MB χ2(.01;6;n=95)=14.13 CL χ2
(.01;6;n=152)=7.99
AB χ2(.01;6;n=156)=2.67 KB χ2
(.01;6;n=142)=18.51
JA χ2(.01;6;n=94)=19.94 PM χ2
(.01;6;n=137)=2.64
AA χ2(.01;6;n=61)=14.62 JB χ2
(.01;6;n=74)=43.86
LA χ2(.01;6;n=144)=4.26 DS χ2
(.01;6;n=196)=6.21
NB χ2(.01;6;n=94)=15.62 SM χ2
(.01;6;n=108)=8.54
DB χ2(.01;6;n=51)=24.90 CC χ2
(.01;6;n=126)=19.33
EB χ2(.01;6;n=152)=16.83 VO χ2
(.01;6;n=156)=19.72
WC χ2(.01;6;n=112)=31.63 KF χ2
(.01;6;n=99)=31.74
Note: Subjects had to decide which of two patterns was best in terms of straightness,
smoothness, and spatial distribution. Separate χ2-tests for each subject have been carried out
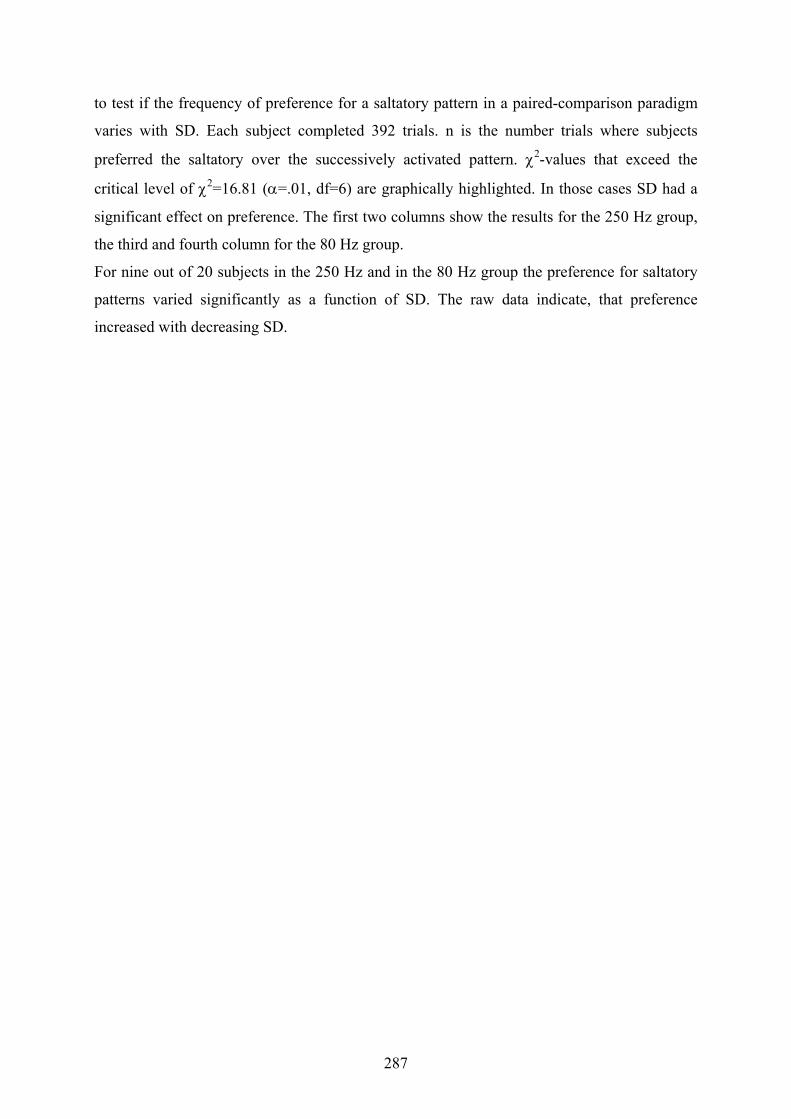
287
to test if the frequency of preference for a saltatory pattern in a paired-comparison paradigm
varies with SD. Each subject completed 392 trials. n is the number trials where subjects
preferred the saltatory over the successively activated pattern. χ2-values that exceed the
critical level of χ2=16.81 (α=.01, df=6) are graphically highlighted. In those cases SD had a
significant effect on preference. The first two columns show the results for the 250 Hz group,
the third and fourth column for the 80 Hz group.
For nine out of 20 subjects in the 250 Hz and in the 80 Hz group the preference for saltatory
patterns varied significantly as a function of SD. The raw data indicate, that preference
increased with decreasing SD.

288
Annex P
Experiment 2 – Part 2 (Which is best): Effect of ISI on subjects’ preference
for one stimulus pattern
Table P-1: Effect of ISI on subjects’ preference for saltatory stimulus patterns, tested with χ2-
Tests
250 Hz 80 Hz
Subject (initials) Results χ2-Tests Subject (initials) Results χ2-Tests
RG χ2(.01;6;n=171)=4.00 JT χ2
(.01;6;n=59)=5.19
BM χ2(.01;6;n=102)=17.41 JH χ2
(.01;6;n=183)=2.86
JC χ2(.01;6;n=99)=6.71 SS χ2
(.01;6;n=128)=2.70
RD χ2(.01;6;n=106)=5.60 JW χ2
(.01;6;n=175)=1.12
BB χ2(.01;6;n=106)=8.11 MS χ2
(.01;6;n=159)=4.11
GA χ2(.01;6;n=83)=17.28 IC χ2
(.01;6;n=59)=2.58
DD χ2(.01;6;n=276)=3.80 RW χ2
(.01;6;n=67)=8.54
RB χ2(.01;6;n=168)=1.75 CW χ2
(.01;6;n=100)=2.76
DG χ2(.01;6;n=105)=0.80 OH χ2
(.01;6;n=127)=7.98
MG χ2(.01;6;n=163)=2.21 BS χ2
(.01;6;n=125)=5.09
GR χ2(.01;6;n=92)=5.09 CS χ2
(.01;6;n=157)=6.05
MB χ2(.01;6;n=95)=3.07 CL χ2
(.01;6;n=152)=5.41
AB χ2(.01;6;n=156)=3.21 KB χ2
(.01;6;n=142)=3.52
JA χ2(.01;6;n=94)=14.87 PM χ2
(.01;6;n=137)=6.32
AA χ2(.01;6;n=61)=1.08 JB χ2
(.01;6;n=74)=11.70
LA χ2(.01;6;n=144)=5.04 DS χ2
(.01;6;n=196)=4.57
NB χ2(.01;6;n=94)=3.85 SM χ2
(.01;6;n=108)=1.67
DB χ2(.01;6;n=51)=3.49 CC χ2
(.01;6;n=126)=10.00
EB χ2(.01;6;n=152)=2.18 VO χ2
(.01;6;n=156)=2.13
WC χ2(.01;6;n=112)=3.75 KF χ2
(.01;6;n=99)=6.14
Note: Subjects had to decide which of two patterns was best in terms of straightness,
smoothness, and spatial distribution. Separate χ2-tests for each subject have been carried out
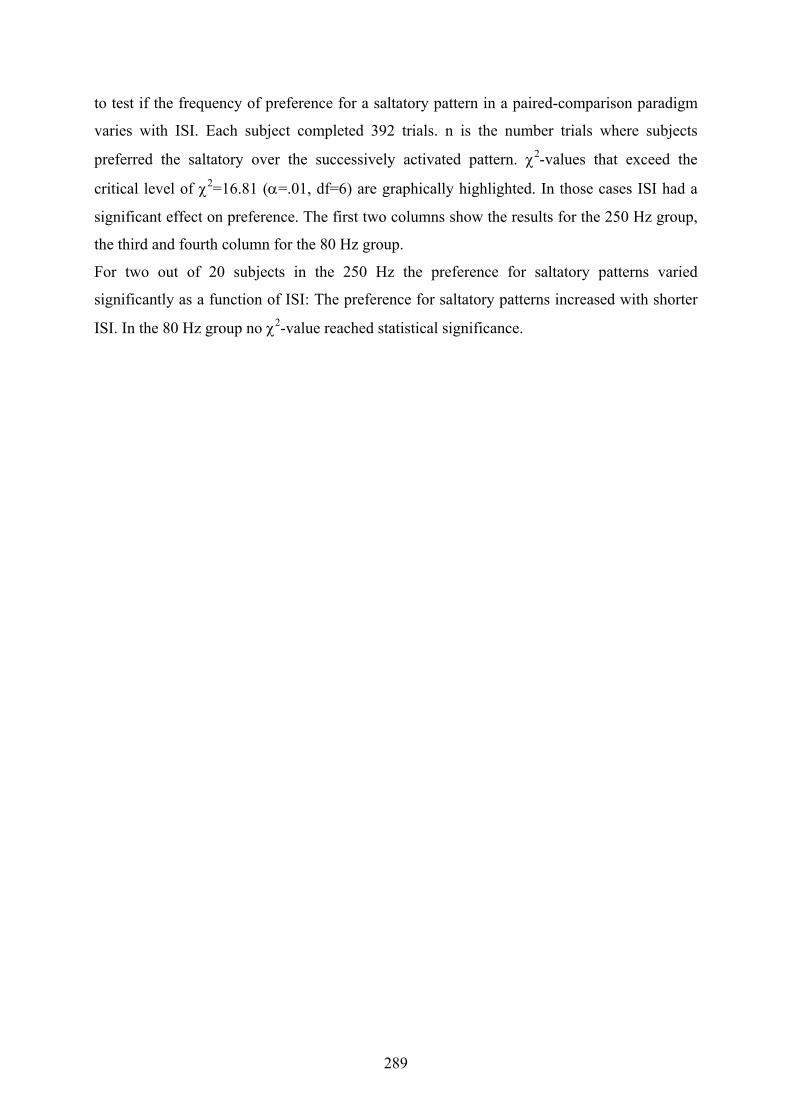
289
to test if the frequency of preference for a saltatory pattern in a paired-comparison paradigm
varies with ISI. Each subject completed 392 trials. n is the number trials where subjects
preferred the saltatory over the successively activated pattern. χ2-values that exceed the
critical level of χ2=16.81 (α=.01, df=6) are graphically highlighted. In those cases ISI had a
significant effect on preference. The first two columns show the results for the 250 Hz group,
the third and fourth column for the 80 Hz group.
For two out of 20 subjects in the 250 Hz the preference for saltatory patterns varied
significantly as a function of ISI: The preference for saltatory patterns increased with shorter
ISI. In the 80 Hz group no χ2-value reached statistical significance.

290
Annex Q
Experimenter Script for Experiment 3: Same/different discrimi-nations with 7-tactor arrays on different positions
In this experiment, you will receive two sets of stimuli and be asked to determine whether they were the “Same or Different” from one another. You will make your judgment by pressing a button on the keyboard (S if both lines are the Same or D if both lines are Different). This test will help us to evaluate the optimal parameters to present vibrotactile flo over the torso. First, I need you to change into a t-shirt for the testing. This is important, because we cannot fairly compare the results if our participants are wearing different types of clothing. This is a freshly cleaned t-shirt that we will keep in the lab for testing you. Now, I need to measure your waist and I will mark your naval on the t-shirt. Then I would like to collect some basic information from you. I would like you to read and sign the consent-form and then to fill out the Medical Questionnaire. Meanwhile: Put tactors on belt. Place belt on participant. I’ve placed a belt containing 7 tactors around you. When the tactors activate they vibrate like a pager motor or cell phone. The only difference between today and tomorrow’s session is the position of the tactors. Tomorrow the belt will be positioned so that the tactors are on your (right, left, front, back) side. We will now go through the instruction phase together: At first, you will read “Rotating Tactors” on the display. If you press the “Align “ button, the display will read ‘1 ready’. Press the “Align” button again and the tactors will activate in a circle around your torso. There will be 7 tactors that activate. Count them as they go along to ensure you can feel a tactor activate at every position. This process will be repeated two more times. Now the display will read “Threshold Measure.” This is a measure to determine your individual threshold – or point where you can just feel all of the tactors activate. After we determine that point, we will increase the intensity by 10 times to ensure you will be able to feel all of the tactors activate during the experiment.

291
In order to determine your threshold, push the “Align” button and all of the tactors will activate in a circle around your torso. Each time you push this button, the intensity will decrease. As the pattern goes from tactor site to tactor site, count them off in your head from 1 to 7 so you can tell me which one disappeared first. If you cannot fell all 7 tactors on the first attempt, let me know and I will increase the intensity. You are asked to wear the headphones for this section of the experiment. (headphones, subject presses “S” when threshold is reached). The display will reads “Test Series”, press the Align button and the display will read “Block 1.” Press the “Align” button and “same/different” will appear on the visual display. Press the “Align” button again and read “Ready.” Your next keystroke, the “Align” button, will activate the system. During the experiment, you will be presented with two sets of stimuli around your torso. After the first set of stimuli is presented, there will be a brief break and then the second will automatically begin. After the second set is presented, you will answer “Same or Different” by pressing either the “S” button for Same or the “D” button for Different. No feedback will be given throughout the test. After you answer, press the “Align” button to get the next stimuli. You control when the stimuli are presented by pressing the align key. Today’s test will consist of 4 blocks of trials, each consisting of 98 sets of stimuli. You will perform the same task in all of the blocks. You can take a brief break in between the blocks if you wish. To start the next block of trials, hit the “Align” button again. Do you have any questions? Headphones!
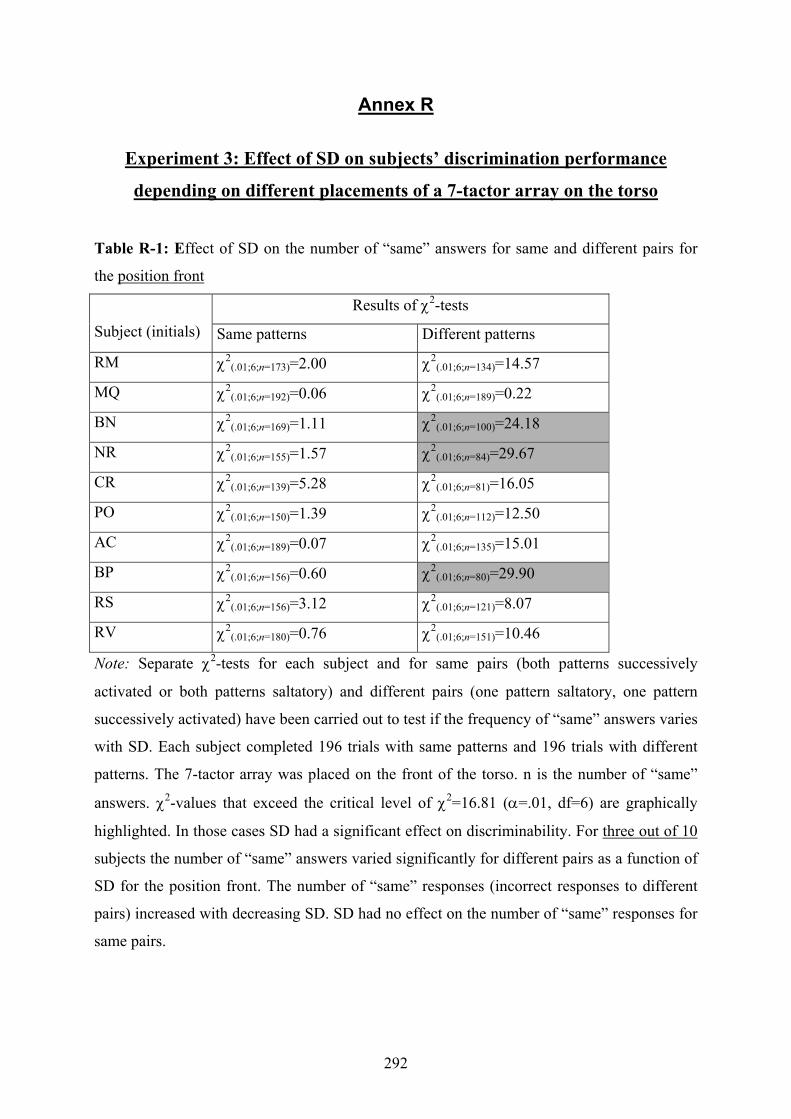
292
Annex R
Experiment 3: Effect of SD on subjects’ discrimination performance
depending on different placements of a 7-tactor array on the torso
Table R-1: Effect of SD on the number of “same” answers for same and different pairs for
the position front
Results of χ2-tests
Subject (initials) Same patterns Different patterns
RM χ2(.01;6;n=173)=2.00 χ2
(.01;6;n=134)=14.57
MQ χ2(.01;6;n=192)=0.06 χ2
(.01;6;n=189)=0.22
BN χ2(.01;6;n=169)=1.11 χ2
(.01;6;n=100)=24.18
NR χ2(.01;6;n=155)=1.57 χ2
(.01;6;n=84)=29.67
CR χ2(.01;6;n=139)=5.28 χ2
(.01;6;n=81)=16.05
PO χ2(.01;6;n=150)=1.39 χ2
(.01;6;n=112)=12.50
AC χ2(.01;6;n=189)=0.07 χ2
(.01;6;n=135)=15.01
BP χ2(.01;6;n=156)=0.60 χ2
(.01;6;n=80)=29.90
RS χ2(.01;6;n=156)=3.12 χ2
(.01;6;n=121)=8.07
RV χ2(.01;6;n=180)=0.76 χ2
(.01;6;n=151)=10.46
Note: Separate χ2-tests for each subject and for same pairs (both patterns successively
activated or both patterns saltatory) and different pairs (one pattern saltatory, one pattern
successively activated) have been carried out to test if the frequency of “same” answers varies
with SD. Each subject completed 196 trials with same patterns and 196 trials with different
patterns. The 7-tactor array was placed on the front of the torso. n is the number of “same”
answers. χ2-values that exceed the critical level of χ2=16.81 (α=.01, df=6) are graphically
highlighted. In those cases SD had a significant effect on discriminability. For three out of 10
subjects the number of “same” answers varied significantly for different pairs as a function of
SD for the position front. The number of “same” responses (incorrect responses to different
pairs) increased with decreasing SD. SD had no effect on the number of “same” responses for
same pairs.
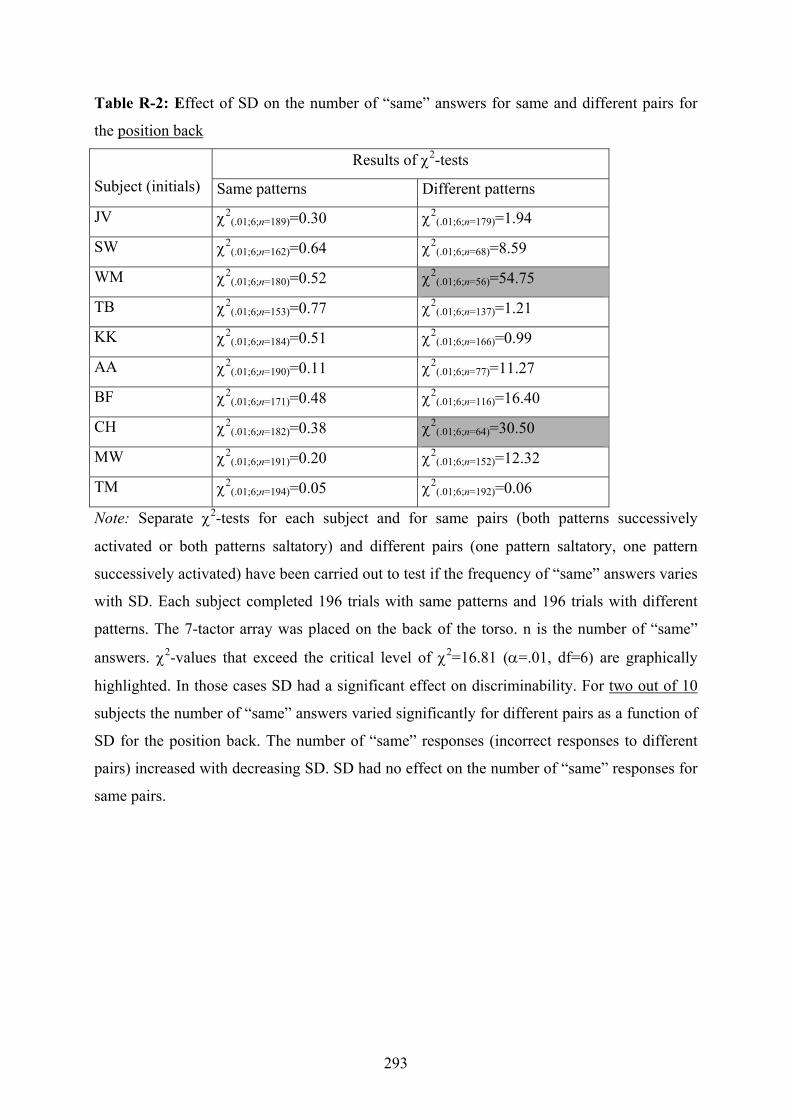
293
Table R-2: Effect of SD on the number of “same” answers for same and different pairs for
the position back
Results of χ2-tests
Subject (initials) Same patterns Different patterns
JV χ2(.01;6;n=189)=0.30 χ2
(.01;6;n=179)=1.94
SW χ2(.01;6;n=162)=0.64 χ2
(.01;6;n=68)=8.59
WM χ2(.01;6;n=180)=0.52 χ2
(.01;6;n=56)=54.75
TB χ2(.01;6;n=153)=0.77 χ2
(.01;6;n=137)=1.21
KK χ2(.01;6;n=184)=0.51 χ2
(.01;6;n=166)=0.99
AA χ2(.01;6;n=190)=0.11 χ2
(.01;6;n=77)=11.27
BF χ2(.01;6;n=171)=0.48 χ2
(.01;6;n=116)=16.40
CH χ2(.01;6;n=182)=0.38 χ2
(.01;6;n=64)=30.50
MW χ2(.01;6;n=191)=0.20 χ2
(.01;6;n=152)=12.32
TM χ2(.01;6;n=194)=0.05 χ2
(.01;6;n=192)=0.06
Note: Separate χ2-tests for each subject and for same pairs (both patterns successively
activated or both patterns saltatory) and different pairs (one pattern saltatory, one pattern
successively activated) have been carried out to test if the frequency of “same” answers varies
with SD. Each subject completed 196 trials with same patterns and 196 trials with different
patterns. The 7-tactor array was placed on the back of the torso. n is the number of “same”
answers. χ2-values that exceed the critical level of χ2=16.81 (α=.01, df=6) are graphically
highlighted. In those cases SD had a significant effect on discriminability. For two out of 10
subjects the number of “same” answers varied significantly for different pairs as a function of
SD for the position back. The number of “same” responses (incorrect responses to different
pairs) increased with decreasing SD. SD had no effect on the number of “same” responses for
same pairs.
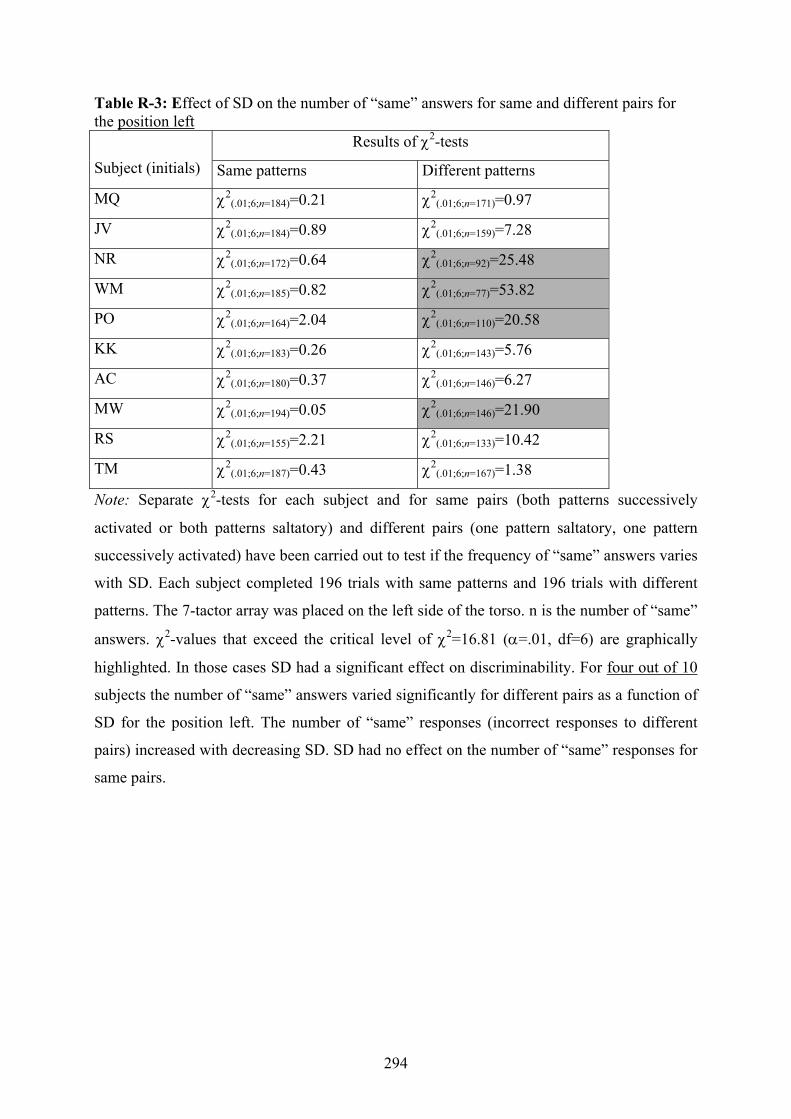
294
Table R-3: Effect of SD on the number of “same” answers for same and different pairs for the position left
Results of χ2-tests
Subject (initials) Same patterns Different patterns
MQ χ2(.01;6;n=184)=0.21 χ2
(.01;6;n=171)=0.97
JV χ2(.01;6;n=184)=0.89 χ2
(.01;6;n=159)=7.28
NR χ2(.01;6;n=172)=0.64 χ2
(.01;6;n=92)=25.48
WM χ2(.01;6;n=185)=0.82 χ2
(.01;6;n=77)=53.82
PO χ2(.01;6;n=164)=2.04 χ2
(.01;6;n=110)=20.58
KK χ2(.01;6;n=183)=0.26 χ2
(.01;6;n=143)=5.76
AC χ2(.01;6;n=180)=0.37 χ2
(.01;6;n=146)=6.27
MW χ2(.01;6;n=194)=0.05 χ2
(.01;6;n=146)=21.90
RS χ2(.01;6;n=155)=2.21 χ2
(.01;6;n=133)=10.42
TM χ2(.01;6;n=187)=0.43 χ2
(.01;6;n=167)=1.38
Note: Separate χ2-tests for each subject and for same pairs (both patterns successively
activated or both patterns saltatory) and different pairs (one pattern saltatory, one pattern
successively activated) have been carried out to test if the frequency of “same” answers varies
with SD. Each subject completed 196 trials with same patterns and 196 trials with different
patterns. The 7-tactor array was placed on the left side of the torso. n is the number of “same”
answers. χ2-values that exceed the critical level of χ2=16.81 (α=.01, df=6) are graphically
highlighted. In those cases SD had a significant effect on discriminability. For four out of 10
subjects the number of “same” answers varied significantly for different pairs as a function of
SD for the position left. The number of “same” responses (incorrect responses to different
pairs) increased with decreasing SD. SD had no effect on the number of “same” responses for
same pairs.
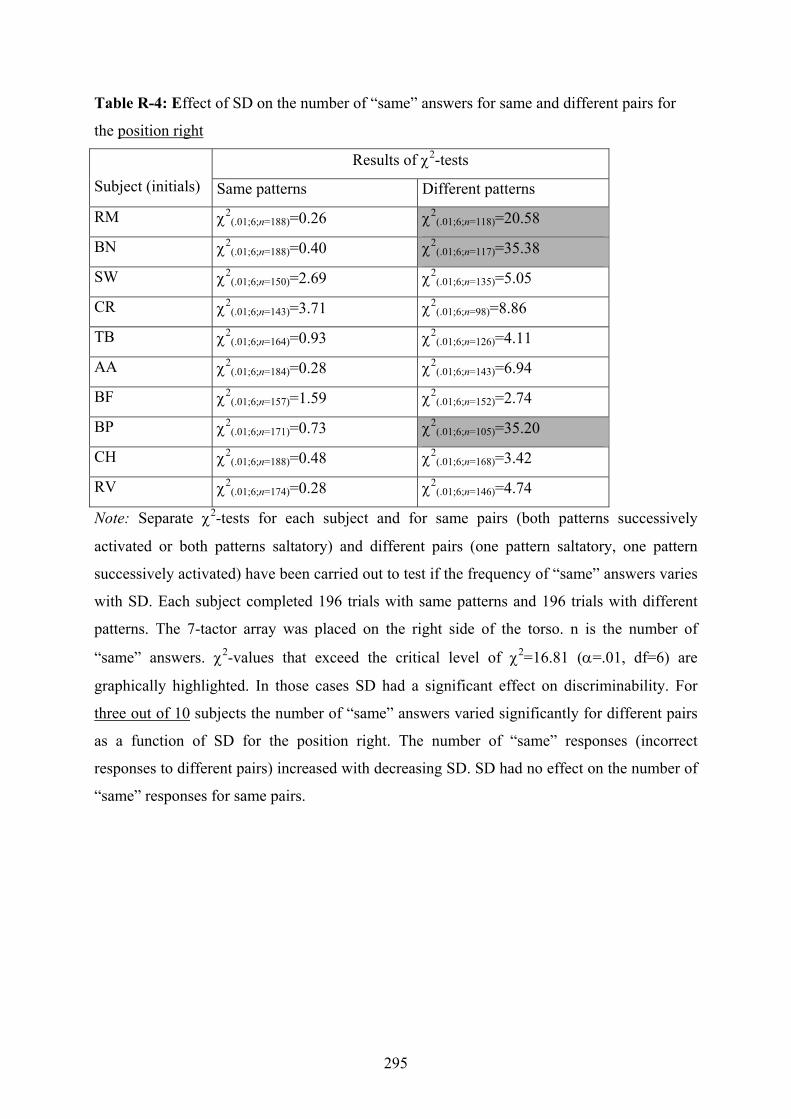
295
Table R-4: Effect of SD on the number of “same” answers for same and different pairs for
the position right
Results of χ2-tests
Subject (initials) Same patterns Different patterns
RM χ2(.01;6;n=188)=0.26 χ2
(.01;6;n=118)=20.58
BN χ2(.01;6;n=188)=0.40 χ2
(.01;6;n=117)=35.38
SW χ2(.01;6;n=150)=2.69 χ2
(.01;6;n=135)=5.05
CR χ2(.01;6;n=143)=3.71 χ2
(.01;6;n=98)=8.86
TB χ2(.01;6;n=164)=0.93 χ2
(.01;6;n=126)=4.11
AA χ2(.01;6;n=184)=0.28 χ2
(.01;6;n=143)=6.94
BF χ2(.01;6;n=157)=1.59 χ2
(.01;6;n=152)=2.74
BP χ2(.01;6;n=171)=0.73 χ2
(.01;6;n=105)=35.20
CH χ2(.01;6;n=188)=0.48 χ2
(.01;6;n=168)=3.42
RV χ2(.01;6;n=174)=0.28 χ2
(.01;6;n=146)=4.74
Note: Separate χ2-tests for each subject and for same pairs (both patterns successively
activated or both patterns saltatory) and different pairs (one pattern saltatory, one pattern
successively activated) have been carried out to test if the frequency of “same” answers varies
with SD. Each subject completed 196 trials with same patterns and 196 trials with different
patterns. The 7-tactor array was placed on the right side of the torso. n is the number of
“same” answers. χ2-values that exceed the critical level of χ2=16.81 (α=.01, df=6) are
graphically highlighted. In those cases SD had a significant effect on discriminability. For
three out of 10 subjects the number of “same” answers varied significantly for different pairs
as a function of SD for the position right. The number of “same” responses (incorrect
responses to different pairs) increased with decreasing SD. SD had no effect on the number of
“same” responses for same pairs.
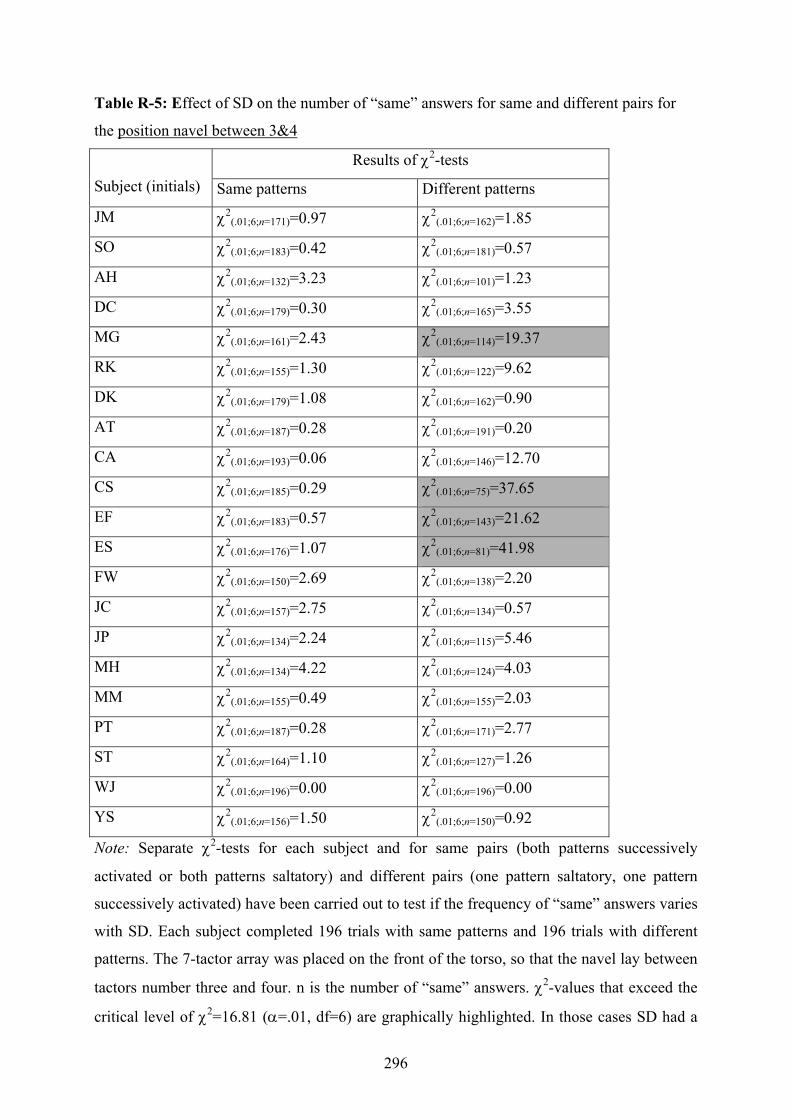
296
Table R-5: Effect of SD on the number of “same” answers for same and different pairs for
the position navel between 3&4
Results of χ2-tests
Subject (initials) Same patterns Different patterns
JM χ2(.01;6;n=171)=0.97 χ2
(.01;6;n=162)=1.85
SO χ2(.01;6;n=183)=0.42 χ2
(.01;6;n=181)=0.57
AH χ2(.01;6;n=132)=3.23 χ2
(.01;6;n=101)=1.23
DC χ2(.01;6;n=179)=0.30 χ2
(.01;6;n=165)=3.55
MG χ2(.01;6;n=161)=2.43 χ2
(.01;6;n=114)=19.37
RK χ2(.01;6;n=155)=1.30 χ2
(.01;6;n=122)=9.62
DK χ2(.01;6;n=179)=1.08 χ2
(.01;6;n=162)=0.90
AT χ2(.01;6;n=187)=0.28 χ2
(.01;6;n=191)=0.20
CA χ2(.01;6;n=193)=0.06 χ2
(.01;6;n=146)=12.70
CS χ2(.01;6;n=185)=0.29 χ2
(.01;6;n=75)=37.65
EF χ2(.01;6;n=183)=0.57 χ2
(.01;6;n=143)=21.62
ES χ2(.01;6;n=176)=1.07 χ2
(.01;6;n=81)=41.98
FW χ2(.01;6;n=150)=2.69 χ2
(.01;6;n=138)=2.20
JC χ2(.01;6;n=157)=2.75 χ2
(.01;6;n=134)=0.57
JP χ2(.01;6;n=134)=2.24 χ2
(.01;6;n=115)=5.46
MH χ2(.01;6;n=134)=4.22 χ2
(.01;6;n=124)=4.03
MM χ2(.01;6;n=155)=0.49 χ2
(.01;6;n=155)=2.03
PT χ2(.01;6;n=187)=0.28 χ2
(.01;6;n=171)=2.77
ST χ2(.01;6;n=164)=1.10 χ2
(.01;6;n=127)=1.26
WJ χ2(.01;6;n=196)=0.00 χ2
(.01;6;n=196)=0.00
YS χ2(.01;6;n=156)=1.50 χ2
(.01;6;n=150)=0.92
Note: Separate χ2-tests for each subject and for same pairs (both patterns successively
activated or both patterns saltatory) and different pairs (one pattern saltatory, one pattern
successively activated) have been carried out to test if the frequency of “same” answers varies
with SD. Each subject completed 196 trials with same patterns and 196 trials with different
patterns. The 7-tactor array was placed on the front of the torso, so that the navel lay between
tactors number three and four. n is the number of “same” answers. χ2-values that exceed the
critical level of χ2=16.81 (α=.01, df=6) are graphically highlighted. In those cases SD had a

297
significant effect on discriminability. For four out of 21 subjects the number of “same”
answers varied significantly for different pairs as a function of SD. The number of “same”
responses (incorrect responses to different pairs) increased with decreasing SD. SD had no
effect on the number of “same” responses for same pairs.
Table R-6: Effect of SD on the number of “same” answers for same and different pairs for
the position navel between 4&5
Results of χ2-tests
Subject (initials) Same patterns Different patterns
JM χ2(.01;6;n=149)=4.01 χ2
(.01;6;n=78)=2.41
SO χ2(.01;6;n=173)=1.27 χ2
(.01;6;n=162)=4.19
AH χ2(.01;6;n=144)=1.64 χ2
(.01;6;n=121)=3.21
DC χ2(.01;6;n=162)=1.59 χ2
(.01;6;n=152)=5.50
MG χ2(.01;6;n=144)=3.39 χ2
(.01;6;n=107)=11.61
RK χ2(.01;6;n=141)=4.71 χ2
(.01;6;n=111)=2.83
DK χ2(.01;6;n=157)=2.31 χ2
(.01;6;n=141)=3.91
AT χ2(.01;6;n=196)=0.00 χ2
(.01;6;n=196)=0.00
CA χ2(.01;6;n=180)=0.60 χ2
(.01;6;n=159)=7.55
CS χ2(.01;6;n=160)=1.44 χ2
(.01;6;n=83)=24.53
EF χ2(.01;6;n=183)=0.87 χ2
(.01;6;n=137)=21.34
ES χ2(.01;6;n=178)=1.25 χ2
(.01;6;n=90)=33.82
FW χ2(.01;6;n=139)=4.58 χ2
(.01;6;n=139)=2.76
JC χ2(.01;6;n=180)=0.60 χ2
(.01;6;n=153)=5.90
JP χ2(.01;6;n=148)=2.69 χ2
(.01;6;n=138)=5.55
MH χ2(.01;6;n=124)=5.39 χ2
(.01;6;n=104)=5.85
MM χ2(.01;6;n=159)=1.91 χ2
(.01;6;n=165)=1.94
PT χ2(.01;6;n=167)=2.38 χ2
(.01;6;n=160)=2.31
ST χ2(.01;6;n=132)=1.42 χ2
(.01;6;n=70)=32.80
WJ χ2(.01;6;n=190)=0.11 χ2
(.01;6;n=142)=21.17
YS χ2(.01;6;n=180)=0.52 χ2
(.01;6;n=174)=0.68
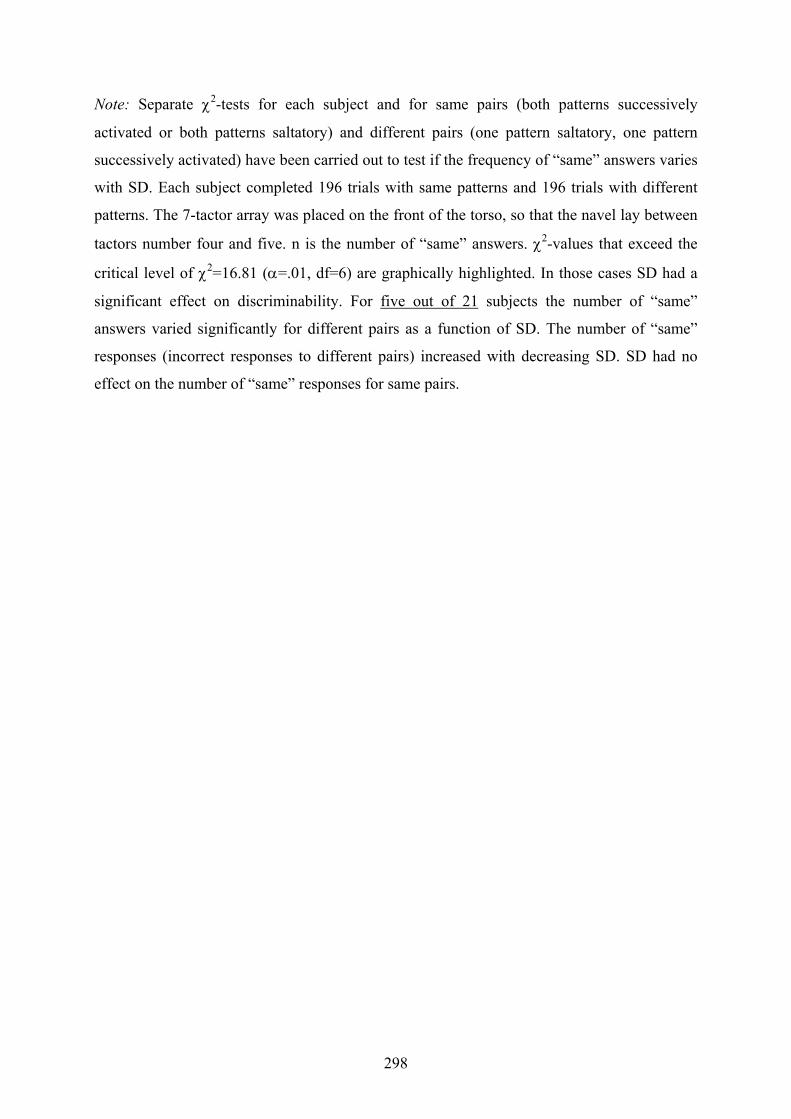
298
Note: Separate χ2-tests for each subject and for same pairs (both patterns successively
activated or both patterns saltatory) and different pairs (one pattern saltatory, one pattern
successively activated) have been carried out to test if the frequency of “same” answers varies
with SD. Each subject completed 196 trials with same patterns and 196 trials with different
patterns. The 7-tactor array was placed on the front of the torso, so that the navel lay between
tactors number four and five. n is the number of “same” answers. χ2-values that exceed the
critical level of χ2=16.81 (α=.01, df=6) are graphically highlighted. In those cases SD had a
significant effect on discriminability. For five out of 21 subjects the number of “same”
answers varied significantly for different pairs as a function of SD. The number of “same”
responses (incorrect responses to different pairs) increased with decreasing SD. SD had no
effect on the number of “same” responses for same pairs.
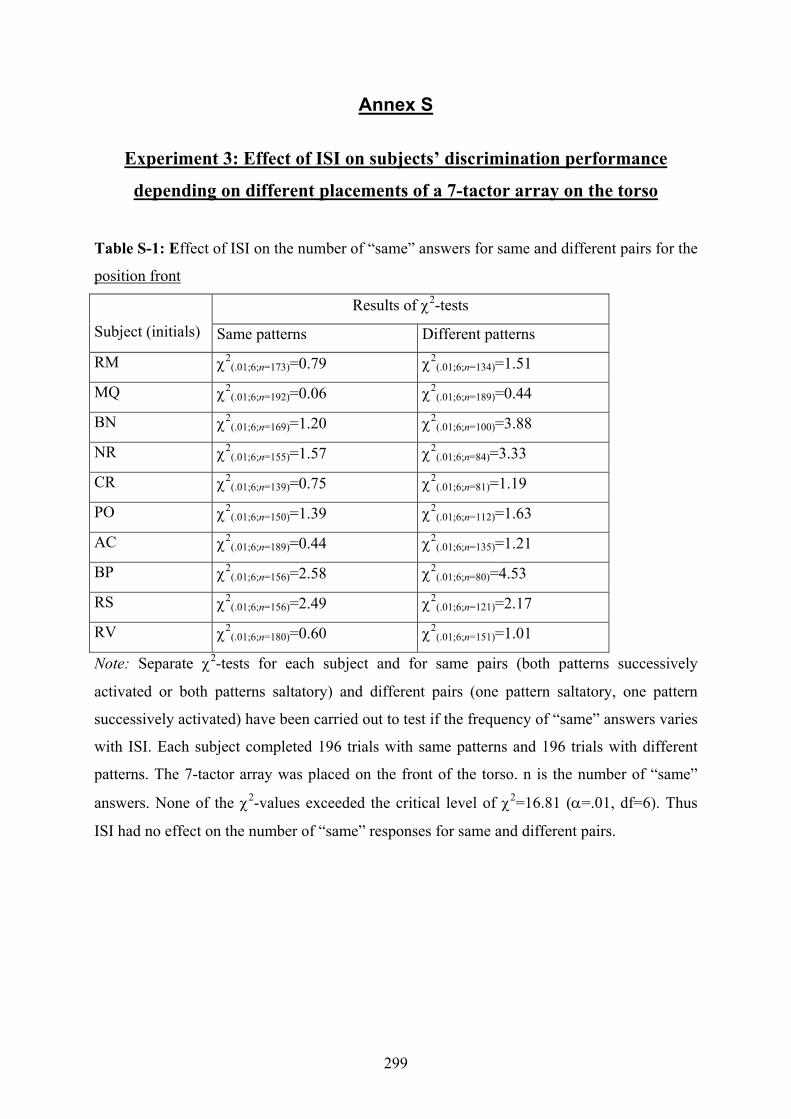
299
Annex S
Experiment 3: Effect of ISI on subjects’ discrimination performance
depending on different placements of a 7-tactor array on the torso
Table S-1: Effect of ISI on the number of “same” answers for same and different pairs for the
position front
Results of χ2-tests
Subject (initials) Same patterns Different patterns
RM χ2(.01;6;n=173)=0.79 χ2
(.01;6;n=134)=1.51
MQ χ2(.01;6;n=192)=0.06 χ2
(.01;6;n=189)=0.44
BN χ2(.01;6;n=169)=1.20 χ2
(.01;6;n=100)=3.88
NR χ2(.01;6;n=155)=1.57 χ2
(.01;6;n=84)=3.33
CR χ2(.01;6;n=139)=0.75 χ2
(.01;6;n=81)=1.19
PO χ2(.01;6;n=150)=1.39 χ2
(.01;6;n=112)=1.63
AC χ2(.01;6;n=189)=0.44 χ2
(.01;6;n=135)=1.21
BP χ2(.01;6;n=156)=2.58 χ2
(.01;6;n=80)=4.53
RS χ2(.01;6;n=156)=2.49 χ2
(.01;6;n=121)=2.17
RV χ2(.01;6;n=180)=0.60 χ2
(.01;6;n=151)=1.01
Note: Separate χ2-tests for each subject and for same pairs (both patterns successively
activated or both patterns saltatory) and different pairs (one pattern saltatory, one pattern
successively activated) have been carried out to test if the frequency of “same” answers varies
with ISI. Each subject completed 196 trials with same patterns and 196 trials with different
patterns. The 7-tactor array was placed on the front of the torso. n is the number of “same”
answers. None of the χ2-values exceeded the critical level of χ2=16.81 (α=.01, df=6). Thus
ISI had no effect on the number of “same” responses for same and different pairs.
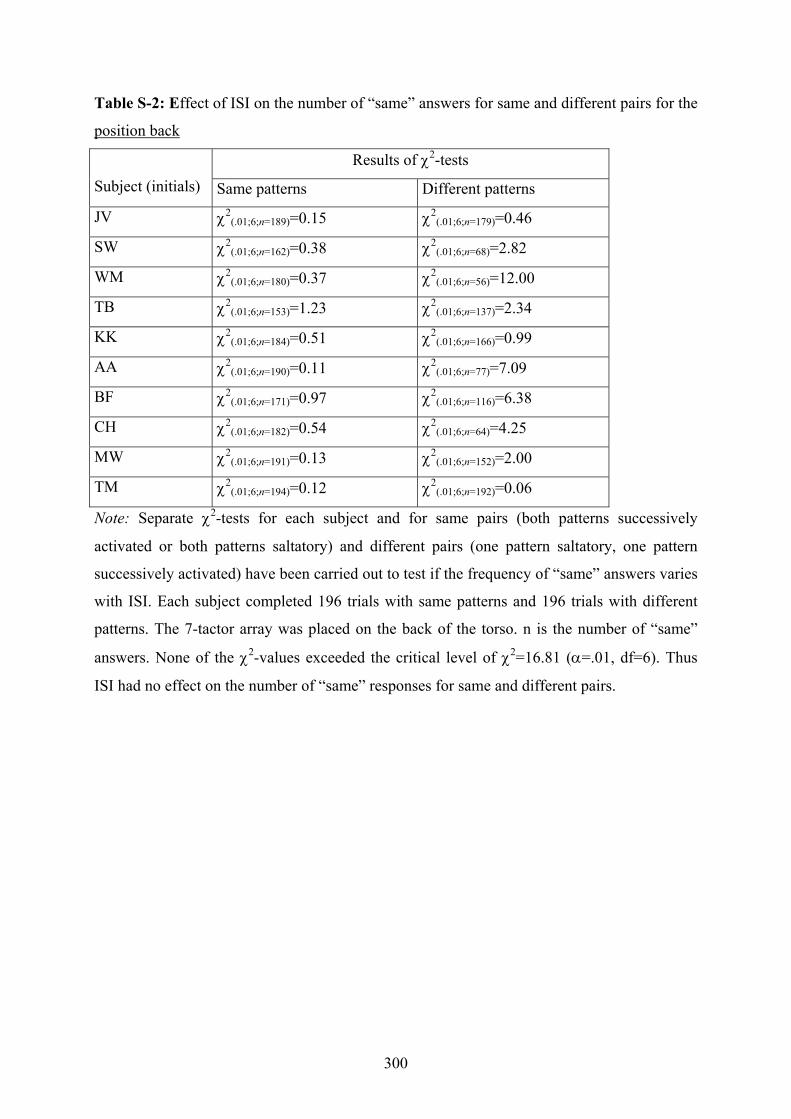
300
Table S-2: Effect of ISI on the number of “same” answers for same and different pairs for the
position back
Results of χ2-tests
Subject (initials) Same patterns Different patterns
JV χ2(.01;6;n=189)=0.15 χ2
(.01;6;n=179)=0.46
SW χ2(.01;6;n=162)=0.38 χ2
(.01;6;n=68)=2.82
WM χ2(.01;6;n=180)=0.37 χ2
(.01;6;n=56)=12.00
TB χ2(.01;6;n=153)=1.23 χ2
(.01;6;n=137)=2.34
KK χ2(.01;6;n=184)=0.51 χ2
(.01;6;n=166)=0.99
AA χ2(.01;6;n=190)=0.11 χ2
(.01;6;n=77)=7.09
BF χ2(.01;6;n=171)=0.97 χ2
(.01;6;n=116)=6.38
CH χ2(.01;6;n=182)=0.54 χ2
(.01;6;n=64)=4.25
MW χ2(.01;6;n=191)=0.13 χ2
(.01;6;n=152)=2.00
TM χ2(.01;6;n=194)=0.12 χ2
(.01;6;n=192)=0.06
Note: Separate χ2-tests for each subject and for same pairs (both patterns successively
activated or both patterns saltatory) and different pairs (one pattern saltatory, one pattern
successively activated) have been carried out to test if the frequency of “same” answers varies
with ISI. Each subject completed 196 trials with same patterns and 196 trials with different
patterns. The 7-tactor array was placed on the back of the torso. n is the number of “same”
answers. None of the χ2-values exceeded the critical level of χ2=16.81 (α=.01, df=6). Thus
ISI had no effect on the number of “same” responses for same and different pairs.

301
Table S-3: Effect of ISI on the number of “same” answers for same and different pairs for the
position left
Results of χ2-tests
Subject (initials) Same patterns Different patterns
MQ χ2(.01;6;n=184)=0.21 χ2
(.01;6;n=171)=0.23
JV χ2(.01;6;n=184)=0.36 χ2
(.01;6;n=159)=2.70
NR χ2(.01;6;n=172)=0.72 χ2
(.01;6;n=92)=5.85
WM χ2(.01;6;n=185)=0.22 χ2
(.01;6;n=77)=10.36
PO χ2(.01;6;n=164)=0.41 χ2
(.01;6;n=110)=2.64
KK χ2(.01;6;n=183)=0.19 χ2
(.01;6;n=143)=1.06
AC χ2(.01;6;n=180)=0.44 χ2
(.01;6;n=146)=1.10
MW χ2(.01;6;n=194)=0.05 χ2
(.01;6;n=146)=2.92
RS χ2(.01;6;n=155)=1.12 χ2
(.01;6;n=133)=4.74
TM χ2(.01;6;n=187)=0.43 χ2
(.01;6;n=167)=0.87
Note: Separate χ2-tests for each subject and for same pairs (both patterns successively
activated or both patterns saltatory) and different pairs (one pattern saltatory, one pattern
successively activated) have been carried out to test if the frequency of “same” answers varies
with ISI. Each subject completed 196 trials with same patterns and 196 trials with different
patterns. The 7-tactor array was placed on the left side of the torso. n is the number of “same”
answers. None of the χ2-values exceeded the critical level of χ2=16.81 (α=.01, df=6). Thus
ISI had no effect on the number of “same” responses for same and different pairs.
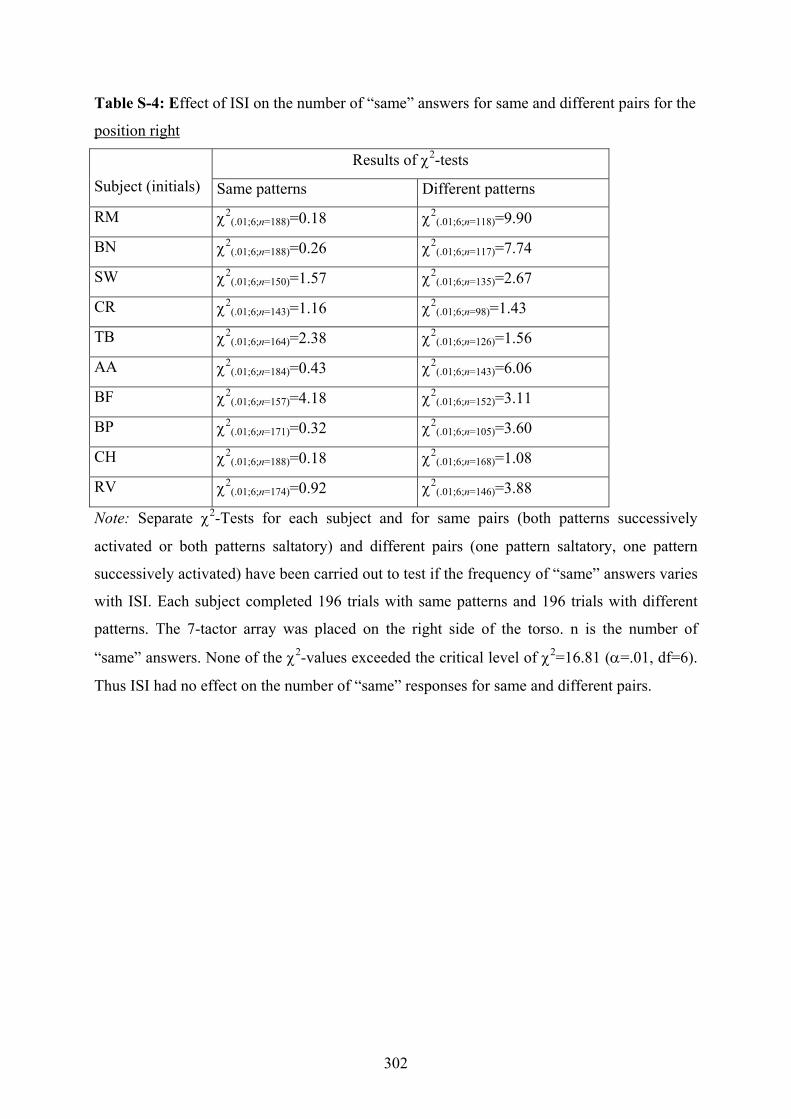
302
Table S-4: Effect of ISI on the number of “same” answers for same and different pairs for the
position right
Results of χ2-tests
Subject (initials) Same patterns Different patterns
RM χ2(.01;6;n=188)=0.18 χ2
(.01;6;n=118)=9.90
BN χ2(.01;6;n=188)=0.26 χ2
(.01;6;n=117)=7.74
SW χ2(.01;6;n=150)=1.57 χ2
(.01;6;n=135)=2.67
CR χ2(.01;6;n=143)=1.16 χ2
(.01;6;n=98)=1.43
TB χ2(.01;6;n=164)=2.38 χ2
(.01;6;n=126)=1.56
AA χ2(.01;6;n=184)=0.43 χ2
(.01;6;n=143)=6.06
BF χ2(.01;6;n=157)=4.18 χ2
(.01;6;n=152)=3.11
BP χ2(.01;6;n=171)=0.32 χ2
(.01;6;n=105)=3.60
CH χ2(.01;6;n=188)=0.18 χ2
(.01;6;n=168)=1.08
RV χ2(.01;6;n=174)=0.92 χ2
(.01;6;n=146)=3.88
Note: Separate χ2-Tests for each subject and for same pairs (both patterns successively
activated or both patterns saltatory) and different pairs (one pattern saltatory, one pattern
successively activated) have been carried out to test if the frequency of “same” answers varies
with ISI. Each subject completed 196 trials with same patterns and 196 trials with different
patterns. The 7-tactor array was placed on the right side of the torso. n is the number of
“same” answers. None of the χ2-values exceeded the critical level of χ2=16.81 (α=.01, df=6).
Thus ISI had no effect on the number of “same” responses for same and different pairs.
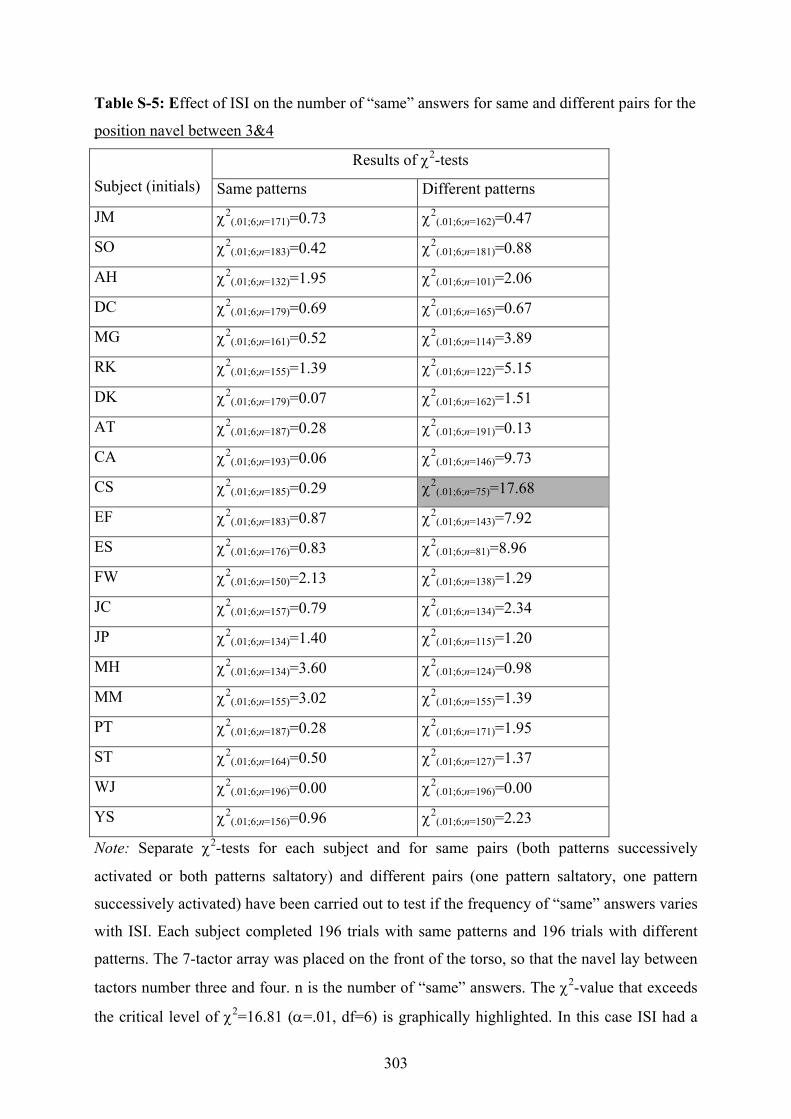
303
Table S-5: Effect of ISI on the number of “same” answers for same and different pairs for the
position navel between 3&4
Results of χ2-tests
Subject (initials) Same patterns Different patterns
JM χ2(.01;6;n=171)=0.73 χ2
(.01;6;n=162)=0.47
SO χ2(.01;6;n=183)=0.42 χ2
(.01;6;n=181)=0.88
AH χ2(.01;6;n=132)=1.95 χ2
(.01;6;n=101)=2.06
DC χ2(.01;6;n=179)=0.69 χ2
(.01;6;n=165)=0.67
MG χ2(.01;6;n=161)=0.52 χ2
(.01;6;n=114)=3.89
RK χ2(.01;6;n=155)=1.39 χ2
(.01;6;n=122)=5.15
DK χ2(.01;6;n=179)=0.07 χ2
(.01;6;n=162)=1.51
AT χ2(.01;6;n=187)=0.28 χ2
(.01;6;n=191)=0.13
CA χ2(.01;6;n=193)=0.06 χ2
(.01;6;n=146)=9.73
CS χ2(.01;6;n=185)=0.29 χ2
(.01;6;n=75)=17.68
EF χ2(.01;6;n=183)=0.87 χ2
(.01;6;n=143)=7.92
ES χ2(.01;6;n=176)=0.83 χ2
(.01;6;n=81)=8.96
FW χ2(.01;6;n=150)=2.13 χ2
(.01;6;n=138)=1.29
JC χ2(.01;6;n=157)=0.79 χ2
(.01;6;n=134)=2.34
JP χ2(.01;6;n=134)=1.40 χ2
(.01;6;n=115)=1.20
MH χ2(.01;6;n=134)=3.60 χ2
(.01;6;n=124)=0.98
MM χ2(.01;6;n=155)=3.02 χ2
(.01;6;n=155)=1.39
PT χ2(.01;6;n=187)=0.28 χ2
(.01;6;n=171)=1.95
ST χ2(.01;6;n=164)=0.50 χ2
(.01;6;n=127)=1.37
WJ χ2(.01;6;n=196)=0.00 χ2
(.01;6;n=196)=0.00
YS χ2(.01;6;n=156)=0.96 χ2
(.01;6;n=150)=2.23
Note: Separate χ2-tests for each subject and for same pairs (both patterns successively
activated or both patterns saltatory) and different pairs (one pattern saltatory, one pattern
successively activated) have been carried out to test if the frequency of “same” answers varies
with ISI. Each subject completed 196 trials with same patterns and 196 trials with different
patterns. The 7-tactor array was placed on the front of the torso, so that the navel lay between
tactors number three and four. n is the number of “same” answers. The χ2-value that exceeds
the critical level of χ2=16.81 (α=.01, df=6) is graphically highlighted. In this case ISI had a
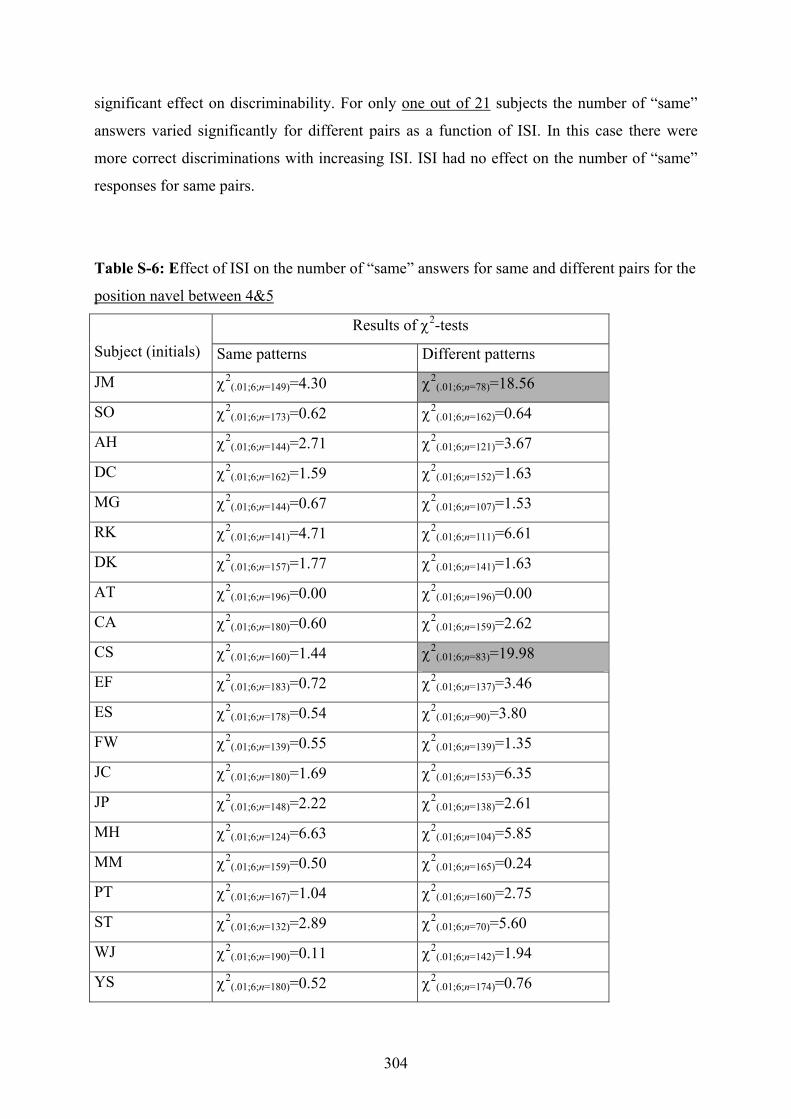
304
significant effect on discriminability. For only one out of 21 subjects the number of “same”
answers varied significantly for different pairs as a function of ISI. In this case there were
more correct discriminations with increasing ISI. ISI had no effect on the number of “same”
responses for same pairs.
Table S-6: Effect of ISI on the number of “same” answers for same and different pairs for the
position navel between 4&5
Results of χ2-tests
Subject (initials) Same patterns Different patterns
JM χ2(.01;6;n=149)=4.30 χ2
(.01;6;n=78)=18.56
SO χ2(.01;6;n=173)=0.62 χ2
(.01;6;n=162)=0.64
AH χ2(.01;6;n=144)=2.71 χ2
(.01;6;n=121)=3.67
DC χ2(.01;6;n=162)=1.59 χ2
(.01;6;n=152)=1.63
MG χ2(.01;6;n=144)=0.67 χ2
(.01;6;n=107)=1.53
RK χ2(.01;6;n=141)=4.71 χ2
(.01;6;n=111)=6.61
DK χ2(.01;6;n=157)=1.77 χ2
(.01;6;n=141)=1.63
AT χ2(.01;6;n=196)=0.00 χ2
(.01;6;n=196)=0.00
CA χ2(.01;6;n=180)=0.60 χ2
(.01;6;n=159)=2.62
CS χ2(.01;6;n=160)=1.44 χ2
(.01;6;n=83)=19.98
EF χ2(.01;6;n=183)=0.72 χ2
(.01;6;n=137)=3.46
ES χ2(.01;6;n=178)=0.54 χ2
(.01;6;n=90)=3.80
FW χ2(.01;6;n=139)=0.55 χ2
(.01;6;n=139)=1.35
JC χ2(.01;6;n=180)=1.69 χ2
(.01;6;n=153)=6.35
JP χ2(.01;6;n=148)=2.22 χ2
(.01;6;n=138)=2.61
MH χ2(.01;6;n=124)=6.63 χ2
(.01;6;n=104)=5.85
MM χ2(.01;6;n=159)=0.50 χ2
(.01;6;n=165)=0.24
PT χ2(.01;6;n=167)=1.04 χ2
(.01;6;n=160)=2.75
ST χ2(.01;6;n=132)=2.89 χ2
(.01;6;n=70)=5.60
WJ χ2(.01;6;n=190)=0.11 χ2
(.01;6;n=142)=1.94
YS χ2(.01;6;n=180)=0.52 χ2
(.01;6;n=174)=0.76
305
Note: Separate χ2-tests for each subject and for same pairs (both patterns successively
activated or both patterns saltatory) and different pairs (one pattern saltatory, one pattern
successively activated) have been carried out to test if the frequency of “same” answers varies
with ISI. Each subject completed 196 trials with same patterns and 196 trials with different
patterns. The 7-tactor array was placed on the front of the torso, so that the navel lay between
tactors number four and five. n is the number of “same” answers. χ2-values that exceed the
critical level of χ2=16.81 (α=.01, df=6) are graphically highlighted. In those cases ISI had a
significant effect on discriminability. For two out of 21 subjects the number of “same”
answers varied significantly for different pairs as a function of ISI. The raw data indicate that
one subject showed a significant increase and the other one a significant decrease in the
number of “same” responses with increasing ISI. ISI had no effect on the number of “same”
responses for same pairs.
306
Affirmation
I hereby affirm that I made this dissertation without illegal assistance. All the resources
(literature, equipment, hardware,…) used are indicated and specified in this paper.
This dissertation has never been submitted to another examination authority.
Augsburg, den 02.02.2008 Anja Schwab