this paper combines representative worker-level data that ... · pdf filein industrialized...
TRANSCRIPT

econstor www.econstor.eu
Der Open-Access-Publikationsserver der ZBW – Leibniz-Informationszentrum WirtschaftThe Open Access Publication Server of the ZBW – Leibniz Information Centre for Economics
Standard-Nutzungsbedingungen:
Die Dokumente auf EconStor dürfen zu eigenen wissenschaftlichenZwecken und zum Privatgebrauch gespeichert und kopiert werden.
Sie dürfen die Dokumente nicht für öffentliche oder kommerzielleZwecke vervielfältigen, öffentlich ausstellen, öffentlich zugänglichmachen, vertreiben oder anderweitig nutzen.
Sofern die Verfasser die Dokumente unter Open-Content-Lizenzen(insbesondere CC-Lizenzen) zur Verfügung gestellt haben sollten,gelten abweichend von diesen Nutzungsbedingungen die in der dortgenannten Lizenz gewährten Nutzungsrechte.
Terms of use:
Documents in EconStor may be saved and copied for yourpersonal and scholarly purposes.
You are not to copy documents for public or commercialpurposes, to exhibit the documents publicly, to make thempublicly available on the internet, or to distribute or otherwiseuse the documents in public.
If the documents have been made available under an OpenContent Licence (especially Creative Commons Licences), youmay exercise further usage rights as specified in the indicatedlicence.
zbw Leibniz-Informationszentrum WirtschaftLeibniz Information Centre for Economics
Becker, Sascha O.; Muendler, Marc-Andreas
Working Paper
Trade and Tasks: An Exploration over ThreeDecades in Germany
CESifo Working Paper, No. 5122
Provided in Cooperation with:Ifo Institute – Leibniz Institute for Economic Research at the University ofMunich
Suggested Citation: Becker, Sascha O.; Muendler, Marc-Andreas (2014) : Trade and Tasks: AnExploration over Three Decades in Germany, CESifo Working Paper, No. 5122
This Version is available at:http://hdl.handle.net/10419/107326

Trade and Tasks: An Exploration over Three Decades in Germany
Sascha O. Becker Marc-Andreas Muendler
CESIFO WORKING PAPER NO. 5122 CATEGORY 8: TRADE POLICY
DECEMBER 2014
An electronic version of the paper may be downloaded • from the SSRN website: www.SSRN.com • from the RePEc website: www.RePEc.org
• from the CESifo website: Twww.CESifo-group.org/wp T

CESifo Working Paper No. 5122
Trade and Tasks: An Exploration over Three Decades in Germany
Abstract This paper combines representative worker-level data that cover time-varying job-level task characteristics of an economy over a long time span with sector-level bilateral trade data for merchandize and services. We carefully create longitudinally consistent workplace characteristics from the German Qualification and Career Survey 1979-2006 and prepare trade flow statistics from varying sources. Four main facts emerge: (i) intermediate inputs constitute a major share of imports, and their relevance grows especially in the early decade; (ii) the German workforce increasingly specializes in workplace activities and job requirements that are typically considered non-offshorable, mainly within and not between sectors and occupations; (iii) the imputed activity and job requirement content of German imports grows relatively more intensive in work characteristics typically considered offshorable; and (iv) labour-market institutions at German trade partners are largely unrelated to the changing task content of German imports but German sector-level outcomes exhibit some covariation consistent with faster task offshoring in sectors exposed to lower labour-market tightness. We discuss policy implications of these findings.
JEL-Code: F160, F140, J230, J240.
Keywords: trade in tasks, offshoring, demand for labour, labour force survey.
Sascha O. Becker Department of Economics
University of Warwick United Kingdom - CV4 7AL Coventry
Marc-Andreas Muendler Department of Economics
University of California, San Diego USA - 92093-0508 La Jolla CA
October 23, 2014 We thank Lisandra Flach for outstanding research assistance. We thank Alexandra Spitz-Oener for sharing her task coding for comparisons with our measures, Alfons Geis of GESIS Mannheim for helpful advice on occupational concordances, Karl-Dietrich Fischer of destatis for national accounts information, and Franziska Luding, Sabrina Pitzler and Christof Schmitt of Deutsche Bundesbank for the time consistent preparation of services trade data. Ingo Geishecker, Gene Grossman, Esteban Rossi-Hansberg, Sebastien Miroudot and El Mouhoub Mouhoud provided helpful comments on earlier drafts. We acknowledge with gratitude EFIGE and CAGE for funding and IMT Lucca for hospitality. Becker is also affiliated with CAGE, Ifo, and IZA; Muendler is also affiliated with CAGE. This version was presented at the 60th Economic Policy Panel in Rome, October 2014.

1 Introduction
Offshoring of production stages, and the accompanying global integration of production, are widelythought to affect employment and wages. The direction of effects is theoretically ambiguous andlikely depends on the type of labour. If jobs of the least educated workers are those most fre-quently offshored, one might expect a widening of the wage gap between skilled and unskilledlabour (Feenstra and Hanson 1999). To the extent that offshoring is associated with consumer pricereductions, less skilled workers may still benefit overall from an increase in real wages. Grossmanand Rossi-Hansberg (2008) point to the theoretical possibility that quasi-rents from offshored jobsmight accrue to the apparently most vulnerable workers who command a wage premium in theoffshorable jobs that remain onshore in equilibrium. Jonesand Kierzkowski (1990) and Grossmanand Rossi-Hansberg (2008) stress that, if the associated cost reductions are particularly strong inindustries employing low-skilled labour intensively, offshoring might shrink the wage gap betweenskilled and unskilled labour as resources are reallocated towards low-skill intensive industries ingeneral equilibrium.1
The offshorability of jobs need not even be directly relatedto skills as measured by formaleducation. Blinder (2009) argues that low-skilled and high-skilled jobs are equally likely to beaffected by offshoring. The prominent two examples of janitors and tele-radiologists illustratethat there is no simple one-to-one relationship between skills and offshorability. Janitors are typ-ically low-skilled but the nature of their tasks ties them totheir local workplace. In contrast, themedical interpretation of computer-tomography images or X-rays typically requires at least upper-secondary or tertiary education but the images can easily beread remotely. The link between taskcontent and offshorability has been explored by Leamer and Storper (2001); Markusen (2006);Jensen and Kletzer (2006); Blinder (2006), among others. Blinder and Krueger (2013) argue thatmore educated workers appear to hold more offshorable jobs in the United States. Several impor-tant task characterizations have been proposed as relevantfor the offshorability of occupations: theprevalence of codifiable rather than tacit information to perform the job (Leamer and Storper 2001);the prevalence of routine tasks, especially if they can be summarized in deductive rules (Levy andMurnane 2004); or the job’s lacking requirement of physicalcontact and geographic proximity(Blinder 2006). Whereas the nature of tasks could be strongly correlated with the skill-intensity ofthe occupation, there is noa priori reason for this to be the case.
In this paper, we want to document how Germany’s trade pattern developed over three decadesat the turn to the 21st century, how the composition of tasks performed by German workers evolvesand whether those developments are connected. We believe that these issues are policy relevantbut even simple stylized facts characterizing trends over such a long time period are lacking. Toexamine the relationship between offshoring and the composition of tasks in the home economy, wecombines representative worker-level data that covertime-varyingjob-level task characteristics ofan economy over a period of decades. Rich micro data from the German Qualifications and CareerSurvey (BIBB survey) for the years 1979, 1986, 1992, 1999 and 2006 provide various measures ofworkplace characteristics, typically referred to as tasks.2 We carefully create mappings across the
1See also Baldwin and Robert-Nicoud (2007) and Kohler (2009)for alternative presentations of this argument.2For earlier studies using the BIBB survey in different contexts see, for instance, Acemoglu and Pischke (1998) or
2

five survey waves to obtain longitudinally consistent workplace characteristics.There are three sets of workplace characteristics. First, the BIBB survey asks workers to
state whether they perform activities from a given list—including activities such asmanufac-ture/produce, analyze/research, organize/planor oversee/control. These reported activities havebeen used in earlier research by Spitz-Oener (2006) and Gathmann and Schonberg (2010), forexample. Our data preparation goes beyond their work both intime span and in coverage of ad-ditional workplace variables. Second, the BIBB survey asks workers whether they use tools froma given list to carry out their work. Reported tool use—such asthe usage of computers, pencils,or fork lifts, for instance—has been extracted for researchby DiNardo and Pischke (1997) andAcemoglu and Pischke (1998) in different settings before, and by Becker, Ekholm and Muendler(2013) in the context of inhouse offshoring and vertical foreign direct investment. In this paper, weconcentrate on workplace characteristics beyond tool use.Third, the BIBB survey asks the workerhow frequently performance requirements apply to the job—including the frequency of deadlinesto complete tasks, the frequency with which the worker has toimprove or adopt new techniques,and the frequency with which work procedures are described in detail. This is a so far largelyunexplored group of BIBB survey questions and arguably closely related to task types that arerelevant for offshorability.
Combined with sector-level trade information, our worker data provide evidence on the re-sponsiveness of onshore tasks to trade flows and thereby indicate the degree of offshorability ortradability of jobs (Jensen and Kletzer 2010; Blinder 2009).Using the import matrix from the Ger-man input-output tables, we can separate imports of intermediate inputs and final goods importsby year. Imports of intermediate inputs are commonly associated with offshoring. The bilateralnature of the trade data allows us to relate trade flows to the composition of labour-market char-acteristics of the foreign countries, where German importsoriginate. Four main facts emerge.One, intermediate inputs constitute a major share of imports, and their relevance grows especiallyin the early decade. Two, the German workforce increasinglyspecializes in workplace activitiesand performance requirements that are typically considered non-offshorable, mainlywithin andnot between sectors and occupations. Three, the imputed activity and job requirement content ofGerman imports grows relatively more intensive in work characteristics typically considered off-shorable. Four, labour-market institutions at German trade partners are largely unrelated to thechanging task content of German imports but German sector-level unionization rates exhibit somecovariation consistent with faster task offshoring in moreunionized sectors.
Earlier empirical research typically pre-defines task dichotomies based on survey answers(Spitz-Oener 2006; Gathmann and Schonberg 2010; Becker et al. 2013). Two common such taskdichotomies are routine/non-routine and non-interactive/interactive. In this paper, we take a stepback and let the original data speak. We keep a rich set of individual workplace characteristics anduse regressions of employment frequencies to track how the task content has evolved across sectorsand occupations, and most importantly within sectors and occupations, over the period 1979-2006.In a preliminary imputation exercise, we weight sectoral import flows to Germany with typicalGerman task content seven years prior and use similar regressions to describe the evolution of tasktrade, for the full set of individual workplace characteristics. The stylized facts that emerge from
Spitz-Oener (2006).
3

our data document the importance of time-varying task information within sectoral occupations,where most variation occurs, and draw attention to subtle distinctions between offshorability andworkplace changes. In contrast, much existing research uses time-invariant classifications from theU.S. Dictionary of Occupational Titles Job Description (DOT) or the Occupational InformationNetwork (ONET) descriptions of occupations (Autor, Levy and Murnane 2003; Goos, Manningand Salomons 2009).
Our research relates to the widely documented hollowing-out of intermediate-skill employmentin industrialized countries, and the accompanying polarization of the earnings distribution with rel-ative compensation losses for intermediate-skill groups (Autor, Katz and Kearney 2006; Goos etal. 2009). Beyond offshoring and task trade (Grossman and Rossi-Hansberg 2008), which is thefocus of our paper, those labour-market changes may be related to four additional explanations: (i)immigration (Ottaviano, Peri and Wright 2013); (ii) productdemand shifts at high earning house-holds that favor low-skill compensation (Mazzolari and Ragusa 2013); (iii) technical change (e.g.Acemoglu 2002; Autor et al. 2003; Spitz-Oener 2006); and (iv) changing human resource man-agement practices such as training and teamwork (Lazear andShaw 2007). As to the former twohypotheses, our empirical treatment controls for both labour-supply effects from immigration andlabour-demand effects from product-demand shifts, by conditioning out sector and year effects. Asto the latter two hypotheses, our data include information on the use of technically advanced equip-ment and human-resource management practices such as training and teamwork. In future workwe will include those additional workplace characteristics and implement identification strategiesto empirically discern alternative explanations.
This paper has six more sections. In Section 2, we give an overview of the data. Section 3documents trade patterns in Germany between 1979 and 2006. Section 4 turns to evidence on theGerman workforce and investigates the shifts in workplace activities and tasks over time, withinand between sectors and occupations. Section 5 then combines the data and imputes the likelytask content of Germany import and export trade flows, and documents their changes over time.Section 6 relates the workplace and trade flow changes to select labour-market institutions: thesectoral degree of unionization in Germany and the extent oflabour-market rigidity among Germantrade partners. Section 7 discusses potential policy implications. Section 8 concludes.
2 Data
This section describes our novel micro-level data set, covering nearly three decades (1979-2006)of workplace and trade information. We draw on various sources: (i) the German Qualificationsand Career survey, which we use to construct detailed and timeconsistent task measures at theworker-level; (ii) sector-level bilateral trade data fromthe World Trade Flows (WTF) database;(iii) sector-level unionization rates from the German Socioeconomic Panel (GSOEP); (iv) inter-nationally comparable measures of labour-market institutions from the World Bank, characteriz-ing labour-market rigidities of Germany and its trading partners. We describe each of these datasources in turn.
We take account of German unification in 1990 and of changes inthe WTF data construction
4

by including year dummies in all our regressions. We have confirmed the robustness of our resultsby restricting the analysis to West Germany alone.
2.1 German Qualifications and Career survey
Our main data source is the German Qualifications and Career survey (Qualifikation und Berufsver-lauf), meanwhile renamed to German work survey (Erwerbstatigenbefragung). We refer to thisdata source for short as the BIBB survey because Germany’s Federal Institute for Vocational Edu-cation and Training BIBB (Bundesinstitut fur Berufsbildung) is the lead institution conducting thesurvey. The BIBB survey allows us to infer the time varying activity content and job requirementsof occupations and to obtain detailed worker characteristics. The survey has been conducted in fivewaves—in 1979, 1985-86, 1991-92, 1998-99 and 2005-06. The BIBB data is a random sample ofaround one tenth of a percent of the German labour force in each wave and forms a repeated crosssection of workers with detailed information on workplace characteristics, worker characteristics,the occupation and earnings, as well as the job’s industry. (There is only rudimentary informationon the employer, such as the employer’s region and employer size in some years.)
We have created time consistent information across all five waves (see the Data Appendix formore detail). For the first time, these data enable us to trackthe changing workplace characteristicsof jobs within sectors and occupations for a country over almost three decades. The BIBB datacharacterize the task profile of German workplaces through the surveyed worker’s response torelatively objective questions (such as the declaration ofthe main activity on the job and the use ofworkplace tools) as well as somewhat more subjective questions (the worker’s assessment of theskills required to perform a job and the worker’s assessmentof the intensity of job requirements toconduct the job such as the degree of repetitiveness, the relevance of deadlines, or the adaptationto new situations).3 In this paper, we restrict our attention to the worker’s declaration of performedactivities and the worker’s assessment of the job’s performance requirements.
Activities. For a longitudinally consistent series of activities on thejob, we extract binary indica-tors from the BIBB data. These activity indicators record whether an activity is performed or not ona worker’s job. To our knowledge for the first time, we obtain fifteen longitudinally consistent ac-tivity indicators across all five survey waves. For details on the activity variables see Appendix A.1.Examples of longitudinally consistent BIBB activities are:Manufacture, Produce Goods; GatherInformation, Develop, Research, Construct; Organize, Plan, Prepare (others’ work); or Oversee,Control Machinery and Techn. Processes. We will use manufacturing activities (Manufacture,Produce Goods) as our arguably easily offshorable benchmark in subsequent activity analysis.
The activities are not mutually exclusive. As Table 1 shows,workers report that they performconsiderably more simultaneous activities in later waves than in early waves. While 58.7 percentof workers report no more than one activity in 1979, the fraction of workers who report to perform
3For earlier work on select workplace characteristics in a labour-market context see DiNardo and Pischke (1997),Acemoglu and Pischke (1998) or Spitz-Oener (2006), for instance, and for tool use and global integration of Germanfirms see Becker et al. (2013).
5

Table 1: SIMULTANEOUS ACTIVITIES BY SURVEY WAVE
1979 1986 1992 1999 2006(1) (2) (3) (4) (5)
0 .184 .071 .105 .035 .0081 .403 .331 .350 .064 .0162 .204 .263 .236 .087 .0283 .096 .156 .138 .113 .0484 .053 .093 .078 .121 .0705 .029 .053 .046 .126 .1036 .015 .023 .025 .119 .1257 .008 .006 .013 .110 .1318 .004 .002 .006 .084 .1289 .002 .001 .003 .061 .11410 .001 .0006 .001 .038 .09211 .0005 .0001 .0004 .025 .06812 or more .0003 .0001 .017 .067
Total 1.000 1.000 1.000 1.000 1.000Average 1.67 2.17 2.11 5.25 7.24
Observations 29,737 26,361 24,090 27,634 16,964
Source: BIBB 1979-2006.Note: Shares of worker observations per wave with given number ofreported activities. Missing entries are less thanone-tenth percent of a percent of observations. Activitiesare: 1. Manufacture, Produce Goods; 2. Repair, Maintain;3. Entertain, Accommodate, Prepare Foods; 4. Transport, Store, Dispatch; 5. Measure, Inspect, Control Quality; 6.Gather Information, Develop, Research, Construct; 7. Purchase, Procure, Sell; 8. Program a Computer; 9. ApplyLegal Knowledge; 10. Consult and Inform; 11. Train, Teach, Instruct, Educate; 12. Nurse, Look After, Cure; 13.Advertise, Promote, Conduct Marketing and PR; 14. Organize, Plan, Prepare (others’ work); 15. Oversee, ControlMachinery and Techn. Processes.
no more than one activity drops to 2.4 percent by 2006. To account for potential differences inreporting conventions over time, we condition on survey-wave fixed effects in all later regressions.
Performance requirements. The BIBB survey reports task requirements to perform a job. Incontrast to the activity indicators, a job requirement is recorded in BIBB by the frequency withwhich a worker executes the tasks on the job. We obtain nine longitudinally consistent job require-ment categories but information for four requirement categories is missing in a single wave each.To our knowledge, the performance requirement variables are so far largely unexplored workplacecharacteristics in research and we construct longitudinally consistent variables for the first time.We describe details of our performance requirements construction in Appendix A.2.
For empirical comparability to the more widely known activities definitions, in this paper wetransform the intensity scale into a set of binary task variables that indicate frequent requirements(intensity of 3 or 4–occasionally, frequently or almost always) or infrequent requirements (intensityof 1 or 2–never or almost never, or seldom). We have conductedrobustness checks with alternative
6

Table 2: SIMULTANEOUS PERFORMANCEREQUIREMENTS BYSURVEY WAVE
1979 1986 1992 1999 2006(1) (2) (3) (4) (5)
0 .056 .022 .009 .004 .0041 .040 .034 .028 .035 .0142 .065 .061 .073 .054 .0353 .103 .099 .159 .101 .0744 .143 .138 .312 .150 .1625 .168 .186 .234 .184 .2406 .156 .196 .185 .182 .2287 .129 .138 .143 .1678 .085 .085 .088 .0769 .055 .041 .059
Total 1.000 1.000 1.000 1.000 1.000Average 4.91 5.13 4.18 4.76 5.83
Observations 29,737 26,361 24,090 27,634 16,964
Source: BIBB 1979-2006.Note: Shares of worker observations per wave with given number ofreported performance requirements that are appli-cable occasionally, frequently or almost always. Missing entries occur in survey waves 1991-92 (three missing perfor-mance requirements) and 2005-06 (one missing performance requirement), as documented in Table A.2. Performancerequirements are: 1. Deadlines/pressure to perform; 2. Improve/adopt new techniques; 3. New situations/activities;4.Repeated work steps; 5. Work procedures prescribed in detail; 6. Financial losses by small mistakes (missing in 1992);7. Minimum performance/time/quantity given to execute activity (missing in 1992); 8. Versatility/multiple activitiesat same time (missing in 1992); 9. Concentration on activity(missing in 2006).
cutoffs (such as 1-3 vs. 4, and 1 vs. 2-4, available upon request), and find consistent empiricalfacts. Examples of longitudinally consistent BIBB job requirements are:Deadlines/pressure toperform; Improve/adopt new techniques; New situations/activities; or Work procedures prescribedin detail. We will use the presence of detailed work routines (Work procedures prescribed in detail)as our arguably easily offshorable benchmark in subsequentanalysis of performance requirements.
Just as activities before, performance requirements are not mutually exclusive. In contrast toactivities, however, German workers do not report more simultaneous performance requirementsover time, as Table 2 documents. For the tabulation, we consider a performance requirement aspresent if the worker reports it to apply occasionally, or frequently or almost always. Except forthe survey waves 1991-92 and 2005-06, where three and one requirements are not reported respec-tively, the fractions of workers with a given number of simultaneous high-frequency performancerequirements remain remarkably stable. A plurality of workers faces between four and seven si-multaneous performance requirements with high frequency in all survey waves.
The lacking change in the simultaneity of performance requirements over time is not only in-teresting in its own right. The stability in performance requirement reporting perhaps also suggeststhat the observed change in the simultaneity of activities above is not a statistical artefact of chang-
7
ing reporting conventions over time, but may reflect an actual workplace enrichment over time.
2.2 Trade
Merchandize and services trade. We obtain bilateral merchandize trade data to and from Ger-many by foreign country and sector for the years 1979, 1986 and 1992 using the World TradeFlows (WTF) database over the period 1979-1993 by (Feenstra,Lipsey, Deng, Ma and Mo 2005),and using their recent revision files (2011) for the years 1994 to 2006. We aggregate the individualcountry information from the recent files (for 1999 and 2006)to the country groups as defined by(Feenstra et al. 2005) in the early years (1979, 1986 and 1992). We map theSITC Rev. 2 sectorinformation to our common sector definition with 39 industries across all waves of the BIBB data(20 merchandize producing industries; see Appendix A.4). We transform the US$ data to Euro anddeflate them with the German CPI to the end of the year 1998, at the eve of the Euro’s introductionfor financial transactions.
We obtain bilateral services trade data (Dienstleistungsverkehr) to and from Germany by for-eign countries or country groups and subsectors for the years 1979-2007 from the German centralbank Deutsche Bundesbank(BuBa), which kindly prepared its historic records for us so that apossibly large group of eleven individual source and destination countries as well as 19 servicesindustries can be identified (see Appendix B). Given the more aggregate country and regionalcoverage, we do not use services trade data for exercises that require country-level evidence in thispaper.
Imports of intermediate inputs. We collect the import matrices from input-output tables in1978 (no table for 1979), 1986, 1992, 1999 and 2006 by the German Statistical Officedestatis. Wemap the sector classification from theNACE oriented classifications in Germany’s import matricesto our common sector definition with 39 industries. In line with OECD standards, the Germanimport matrix is based on the import proportionality assumption. This technique assumes that anindustry uses an import of a particular input in proportion to its total use of that input. For example,if an industry such as motor vehicles uses steel in its production processes and 10 percent of allsteel is imported, it is assumed that 10 percent of the steel used by the motor vehicle industry isimported. So time variation in imported steel for intermediate use comes from two independentchanges over time: more steel imports and changing shares ofsteel use by industry, but does notcome from a direct measure of import use shares by input and output. Using the import matrix, wecompute the value of imports of intermediate inputs. We translate the import values in the earlyyears from Deutsche Mark to Euro and deflate all years with theGerman CPI to our base year1998.
2.3 Labour-market institutions
Unionization rates. We infer sector-level unionization rates from the German SocioeconomicPanel (GSOEP), a longitudinal survey of individuals in private households. We retain only obser-vations of West German households which provide an arguablymore precise reflection of unioniza-
8

tion, and map theNACE 1.1 sector information in GSOEP to our common sector definition acrossall waves of the BIBB data (see Section A.4). Then we compute unionization rates by sector asthe average over the years for which they are available (1985, 1989, 1993, 1998, 2001, 2003 and2007).
Labour market tightness. We obtain data on labour-market tightness produced by the GermanFederal Labour Office (IAB). This data is not available sectorby sector. Instead, labour-markettightness is defined as the number of vacancies per 1,000 unemployed persons at the level ofGerman states for the years 1980 through 2005. We use the sectoral distribution of workers inthe BIBB data across (West German) states to compute a (country-wide) sector-level measure oflabour-market tightness. If a sector is more strongly represented in a state with high labour-markettightness, the representative worker in that sector is exposed to a tighter labour market than aworker in another sector which has a stronger presence in a state with lower tightness. Then wecompute labour-market tightness sector by sector as the average over the years for which it isavailable (1980, 1990 through 2004).
Foreign labour-market rigidity. From the IMF and Fondazione Rodolfo DeBenedetti (fRDB),we use a database of labour-market regulations for the period 1980-2005 and 91 countries, preparedby Aleksynska and Schindler (2011) using ILO, OECD and national sources. The IMF-fRDBlabour-market regulations 1980-2005 data combine information on minimum wage regulations,unemployment insurance systems, and employment protection legislation and exhibit considerableinstitutional changes over the sample period in particularin low- and middle-income countries.Using the IMF-fRDB data, Boeri and Macis (2010) document, for example, that 27 out of 91countries introduced unemployment benefits for the first time between 1980 and 2002 and that theadoption of unemployment benefits had a marked effect on job reallocation in those economies.We use the information from 1980 for analysis related to German tasks in 1979. Country coveragedrops to just 54 countries in 2006, so we reuse the 2005 information for 91 countries in 2006.
As an alternative contemporary data source on labour-market institutions, the World Bank com-putes internationally comparable measures since 2004 following Botero, Djankov, La Porta, Lopezde Silanes and Shleifer (2004). These measures summarize employment laws across countries withrespect to the implied rigidity of labour markets, coveringhiring costs, restrictions on changingwork hours, firing costs, as well as the World Bank’s overall rigidity index summarizing the afore-mentioned three indexes. While the World Bank data offer information on alternative institutions,historical data are unavailable, so we use the initial WorldBank survey from 2004, which is closestto our sample period from 1979-2006.
3 German Trade Patterns
We start out by looking at the pattern of German imports over time. The left-hand panel of Fig-ure 1 shows that German imports grew considerably across allsectors. However, there is someheterogeneity. Imports of machinery and equipment as well as of transport equipment have grown
9

Figure 1:German Imports, 1979-2006
Total Imports by Sector Imported Inputs and Final Goods
25
50
100
200
400
Impo
rts
(bill
ion
EU
R in
199
8)
1979 1986 1992 1999 2006Calendar Year
Agriculture, mining, utilitiesManf: Metal products, wood, textiles, foodManf: Chemicals, machinery, equipmentServices
100
200
400
800
Impo
rts
(bill
ion
EU
R in
199
8)
1979 1986 1992 1999 2006Calendar Year
Total Imports Imported Inputs
Source: WTF 1979-1993 and recent revisions 1994-2006 (Feenstra et al. 2005, update 2011) for merchandize trade,Deutsche Bundesbank for services trade 1979-2006;Destatisimport matrices, releases 2009 (1978 and 1986) and2010 (1992, 1999, 2006).Notes: Converted to Euro, deflated with German CPI (end of year 1998as base). Log scale on vertical axes.
considerably faster than average imports, while agricultural imports have declined slightly in realterms until 1999 and then rebounded.
Classic trade theory used to emphasize trade in final goods. Table 3 and the right-hand panelof Figure 1 show, in contrast, that most imports are for intermediate use and not for final consump-tion. In the right-hand side panel for Figure 1, we pair up imported inputs and final products bythe same source-country sector, irrespective of what receiving sector in Germany might purchasethe imported inputs. The dominance of intermediate uses is particularly pronounced for servicesimports and imports of iron, steel and metals, where intermediate uses account for more than 80percent of uses over three decades. At the other extreme, in textiles and apparel as well as intransport equipment, imports of intermediate input make upless than 40 percent of total imports.The share of intermediates in total imports is relatively stable over time across most sectors. Insome sectors, such as transport equipment, machinery, woodand food, the fraction of imports forintermediate use increases in the early decade and half (from 1979 to 1986 or 1992). In all sectors,however, the share of intermediates imports falls between 1979 and 2006. This different shift intrade patterns between the early half and the late half of oursample period leads us to track changesin German workplace characteristics between 1979 and 1986 and between 1986 and 2006.
One economic interpretation of globalization is that the pattern of trade has shifted from aclassical exchange of final goods to trading predominantly unfinished products across productionstages in the past century. Table 3 quantifies the shifting pattern of trade and documents that tradein intermediates is not a recent phenomenon in Germany. The import of intermediate products hasbeen the predominant type of importation since 1978, exceeding 55 percent in all sample years.On average over all product groups, the share of imported intermediates in total imports has been
10

Table 3: SHARE OF INTERMEDIATE PRODUCT IMPORTS INTOTAL IMPORTS
1978 1986 1992 1999 2006Product groups (shares) (1) (2) (3) (4) (5)
Agriculture & Utilities .844 .838 .771 .718 .790Manf.: Chemicals and mineral products .758 .746 .757 .728 .607Manf.: Iron, steel and metal products .902 .880 .847 .845 .836Manf.: Transport equipment .379 .409 .355 .335 .326Manf.: Machinery, equipment and misc. prod. .428 .441 .371 .378 .376Manf.: Wood, paper and printing .793 .810 .867 .742 .675Manf.: Textiles, apparel and leather .350 .283 .280 .229 .187Manf.: Food and beverages .394 .453 .394 .396 .344Services .948 .839 .843 .856 .909
Total .658 .635 .591 .567 .563
Source: Destatisimport matrices, releases 2009 (1978 and 1986) and 2010 (1992, 1999, 2006).Notes: Deflated with German CPI, end of year 1998 as base year. Shares of imports for intermediate use in totalimports (including both intermediate and final uses) by product group. Services includes traded public and commercialservices.
declining in Germany since 1978 with only a recent rebound after 1999. For many product groupsimported into Germany, globalization understood as the shift from mostly final-goods trade totrade in intermediates has been faster in the early part of our sample period, and slower in morerecent years. To the extent that trade in intermediates is associated with tasks performed abroadthat would otherwise remain onshore, imports of intermediate inputs can be viewed as trade intasks. Interestingly, not only has the share of intermediate goods imports been remarkably stable.Germany’s main trading partners have barely changed over our sample period, nine out of the topten import source countries are the same in every single sample year since 1979, and eight of thosenine countries are also among Germany’s top ten export destinations in every sample year (seeAppendix B.1).
Table 4 assesses the importance of intermediate imports fordomestic production.4 The firstline of Table 4 reports the share of intermediate product imports in total intermediate inputs of theGerman economy, where total intermediate input includes both domestically produced Germanand foreign-made imported intermediate products. This share of offshore outsourcing in totalGerman outsourcing has risen from 14 percentage points to 22percentage points, a one-and-a-halffold increase. On the other hand, the share of outsourced inputs in the total production value,on the second line of the table, has remained the same at 51 percent between 1978 and 2006 forthe German economy as a whole (but there was a temporary decline during the 1990s). In otherwords, not the extent of outsourcing in the German economy asa whole has changed over thesample period of almost three decades, only the compositionof outsourcing has shifted towards
4Whereas Table 3 made a comparison across columns of uses within the rows of Germany’s input-output matrices,Table 4 makes comparisons across rows of production components within the total production column of Germany’sinput-output matrices.
11
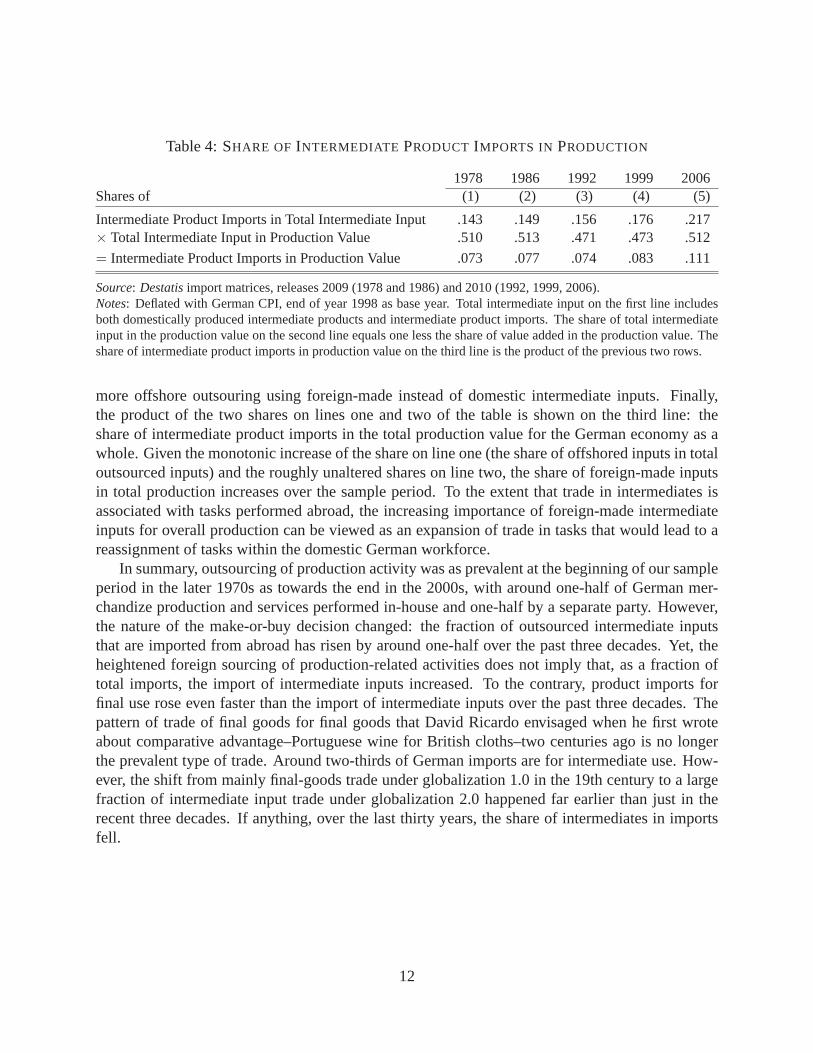
Table 4: SHARE OF INTERMEDIATE PRODUCT IMPORTS INPRODUCTION
1978 1986 1992 1999 2006Shares of (1) (2) (3) (4) (5)
Intermediate Product Imports in Total Intermediate Input .143 .149 .156 .176 .217× Total Intermediate Input in Production Value .510 .513 .471 .473 .512
= Intermediate Product Imports in Production Value .073 .077 .074 .083 .111
Source: Destatisimport matrices, releases 2009 (1978 and 1986) and 2010 (1992, 1999, 2006).Notes: Deflated with German CPI, end of year 1998 as base year. Totalintermediate input on the first line includesboth domestically produced intermediate products and intermediate product imports. The share of total intermediateinput in the production value on the second line equals one less the share of value added in the production value. Theshare of intermediate product imports in production value on the third line is the product of the previous two rows.
more offshore outsouring using foreign-made instead of domestic intermediate inputs. Finally,the product of the two shares on lines one and two of the table is shown on the third line: theshare of intermediate product imports in the total production value for the German economy as awhole. Given the monotonic increase of the share on line one (the share of offshored inputs in totaloutsourced inputs) and the roughly unaltered shares on linetwo, the share of foreign-made inputsin total production increases over the sample period. To theextent that trade in intermediates isassociated with tasks performed abroad, the increasing importance of foreign-made intermediateinputs for overall production can be viewed as an expansion of trade in tasks that would lead to areassignment of tasks within the domestic German workforce.
In summary, outsourcing of production activity was as prevalent at the beginning of our sampleperiod in the later 1970s as towards the end in the 2000s, witharound one-half of German mer-chandize production and services performed in-house and one-half by a separate party. However,the nature of the make-or-buy decision changed: the fraction of outsourced intermediate inputsthat are imported from abroad has risen by around one-half over the past three decades. Yet, theheightened foreign sourcing of production-related activities does not imply that, as a fraction oftotal imports, the import of intermediate inputs increased. To the contrary, product imports forfinal use rose even faster than the import of intermediate inputs over the past three decades. Thepattern of trade of final goods for final goods that David Ricardo envisaged when he first wroteabout comparative advantage–Portuguese wine for British cloths–two centuries ago is no longerthe prevalent type of trade. Around two-thirds of German imports are for intermediate use. How-ever, the shift from mainly final-goods trade under globalization 1.0 in the 19th century to a largefraction of intermediate input trade under globalization 2.0 happened far earlier than just in therecent three decades. If anything, over the last thirty years, the share of intermediates in importsfell.
12

4 Activity Content and Job Performance Requirements
The degree to which jobs can be offshored depends on their activity content and performance re-quirements (see e.g. Leamer and Storper 2001; Markusen 2006; Jensen and Kletzer 2006; Blinder2006). Several such activity types and performance requirements have been proposed as relevantfor the degree of offshorability in the literature: the prevalence of codifiable rather than tacit infor-mation to perform the job (Leamer and Storper 2001); the prevalence of routine tasks, especiallyif they can be summarized in deductive rules (Levy and Murnane 2004); or the job’s lacking re-quirement of personal interaction and physical proximity (Blinder 2006). Beyond previous work,we do not lump the detailed information on workplace tools, activities or job characteristics intosubjectively defined task dichotomies such as codifiable/non-codifiable, routine/non-routine andnon-interactive/interactive. Instead, we let the data speak for themselves.
We investigate two sets of task characteristics that a worker faces in a sectoral occupation:the activity content and the job performance requirements.For each set of tasks, we aggregate theBIBB data to cells by sector, occupation, survey year, gender,age and task (activity or performancerequirement) and count the number of workers performing thetask in each cell. Then we regressthe log number of workers,lnL, performing the task on a set of indicators in two specifications.First, allowing task employment counts to vary across sectors and occupations, we specify
lnLitsajk = βit + βt + βs + βa + εitsajk (1)
for taski (activity or performance requirement), yeart, genders and agea, as well as sectorj andoccupationk, where theβ parameters denote regression coefficients on according sets of dummyvariables. Second, restricting coefficient estimates to reflect effects within sectors and occupations,we specify the long regression5
lnLitsajk = βit + βt + βs + βa + βj + βk + εitsajk. (2)
We estimate standard errors under two-way clustering (Cameron, Gelbach and Miller 2011) at thelevel of 2-digit sectors and tasks, which are not nested within sectors.
First, for activity content, we choose as our omitted reference activity1 Manufacture, ProduceGoodsin each survey year. This activity is expectedly easily offshorable through merchandisetrade. At the beginning of our sample period, in 1979, was arguably the one activity that could beoffshored most easily because most naturally ties to final-goods trade alone. With the increasingslicing up of the production chain, other activities might as well become more and more off-shorable. Second, for performance requirements, we chooseas our omitted reference performancerequirementE Work procedures prescribed in detailin each survey year. This requirement is con-sidered easily offshorable because it involves codifiable,rather than tacit, information to performthe job (Leamer and Storper 2001). Note that our inclusion ofa full set of year dummiesβt meansthat we have to exclude one reference task category per survey year.
To standardize results, we scale the coefficients from the log regressions to reportexp{β} (andadjust the standard errors with the Delta method) so that theestimates reflect relative frequen-cies compared to the respective omitted reference categories. Under this convention the reference
5We can also condition on joint sector year effectsβst instead ofβt + βs to assess the robustness of our results.
13

Figure 2:Activity Content of German Work
Not Conditional on Sectors and Occupations Conditional on Sectorsand Occupations
1979
1986
2006
.444
.667
1.000
1.500
2.250
Rel
ativ
e F
requ
ency
1 Produce
2 Repair/M
aintain
3 Enterta
in/Acc
ommodate
4 Transport/S
tore
5 Measu
re/Insp
ect
6 Analyz
e/Rese
arch
7 Purch
ase/S
ell
8 Program C
omputer
9 Practi
ce Law
10 Consu
lt/Inform
11 Train/Educa
te
12 Nurse
/Cure
13 Adve
rtise/P
romote
14 Organize
/Plan
15 Ove
rsee/C
ontrol
Activity
1979 1986 2006
Source: BIBB 1979-2006, workers ages 16 through 65.Notes: Measures of relative activity frequencies from log employment OLS regression over 168,466 activity-year-gender-age-sector-occupation cells, as reported in Tables D.1 and D.2. Coefficientsβ from log employment regres-sions reported asexp{β} to reflect relative frequencies. Omitted baseline activityfrom regressions:1 Manufacture,Produce Goodsin each survey wave. Log scale on vertical axis.
performance requirementE Work procedures prescribed in detail, for example, is implicitly stan-dardized toexp{β
·t} = 1 for all survey years and a transformed coefficient estimateexp{βit}for any other performance requirementi then shows whether the respective performance require-ment is a more (exp{βit} > 1) or less frequent (exp{βit} ≤ 1) workplace characteristic than thereference category in a given year. Deviations from the reference category can vary over time.
Activity content. In Tables D.1 and D.2 in the Appendix, we report coefficient estimates forβit
and overall regression statistics. In Figure 2 we present the βit estimates in graphical form. Eachone of the two panels in Figure 2 depicts coefficient estimates from one single regression.6 Ourhypothesis is that under increasing offshorability of codifiable, routine and non-interactive tasks,we should see a shift in the relative frequency of activitiesother than1 Manufacture, ProduceGoodsto higher and higher levels over time, that is an upward turn of the activity profile to theright of the left-most reference activity1 Manufacture, Produce Goods.
Several important patterns can be discerned from Table D.1 and the corresponding left panelof Figure 2. First, every single activity gains in importance after the base year 1979, relative tothe arguably most offshorable reference category1 Manufacture, Produce Goods. Second, most ofthe shift away from the reference category has taken place already by 1986. Third, the shift awayfrom 1 Manufacture, Produce Goodsaffects both “high-end activities” such as14 Organize/Plan
6We use a logarithmic scale for the vertical axis, so divisionand multiplication by a given number both result in anidentical change starting from any level. The axis labels reflect negative and positive powers of two-thirds for this andall subsequent activity content graphs.
14

and15 Oversee/Controlas well as “low-end activities” such as2 Repair/Maintain.To give a sense of magnitudes, in 1979, the activity13 Advertise/Promoteis roughly 30 percent
less frequent than the reference category1 Manufacture, Produce Goods. By 1986, it is nearly asfrequent as as the reference activity. In 2006, it is 30 percent more frequent than the referenceactivity. These are substantial changes: they measure the percentage change in the number ofworkers performing a certain task. At the same time, remember that those activities are not mu-tually exclusive. According to Table 1, there is a trend towards more ‘multi-tasking’, so workersperform more activities over time, and in fact and more of those are ‘high-end’ activities.
The regressions underlying Table D.1 only control for gender, 48 age groups, and 5 years(survey waves), but not for occupation and sector. The trendtowards certain high-end activitiescould thus just reflect an expansion of sectors and occupations that are intensive in these activities.To probe this further, in Table D.2 and the corresponding right panel of Figure 2, we conditionout occupation and sector means (through according fixed effects). It turns out that the coefficientsbarely change, suggesting that the main driver of the trendsin activities is a shiftwithin occupationsand sectors towards less offshorable activities, not between occupations and sectors.
Intensity of performance requirements. Similarly to activity content, under increasing off-shorability of codifiable, routine and non-interactive tasks, we should see a shift in the relative fre-quency of performance requirements other thanE Work procedures prescribed in detailto higherand higher levels over time. Now using as a reference category the mid binE of the range fromAto I, we should see a U-shaped upward turn of the performance requirement profile to the left andto the right of the reference requirementE Work procedures prescribed in detail.
In Tables D.3 and D.4 in the Appendix, we report coefficient estimates forβit and overallregression statistics. In Figure 3 we present theβit estimates in graphical form.7
Several observations emerge. First, across all five waves, we detect the expected U-shape: per-formance requirements other than the reference categoryE Work procedures prescribed in detailare more prevalent. Second, this pattern varies little overtime. A noticeable exception is the cate-gory B Improve/adopt new techniques, whose importance increases significantly over time. Whilein 1979 and 1986, categoryB Improve/adopt new techniquesis as frequent as the reference cate-gory, in 2006 it is 15 percent more frequent than the reference category. Note that the “right arm”of the performance requirement profile is arguably less precisely measured because in 1992F-Hare missing, and in 2006I is missing. Similar to the lacking difference between the short andlong regressions for activities above, if anything coefficient estimates becomes somewhat morepronounced in the long regression that conditions on sectorand occupation fixed effects. This evi-dence suggests that the main source of variation in performance requirements iswithin occupationsand sectors, not between them.
7We use a logarithmic scale for the vertical axis. The labels are negative and positive powers of nine-tenths for thisand all subsequent performance requirement graphs.
15

Figure 3:Performance Requirements of German Work
Not Conditional on Sectors and Occupations Conditional on Sectorsand Occupations
1979
1986
2006
.810
.900
1.000
1.111
1.235
1.372
Rel
ativ
e F
requ
ency
A Deadlin
es
B Improve
tech
niques
C New si
tuations
D Repeat w
ork
E Presc
ribed w
ork
F Losses i
f mist
ake
G Multi
activit
ies
H Conce
ntratio
n
I Minim
um perform
Performance Requirement
1979 1986 2006
1979
1986
2006
.810
.900
1.000
1.111
1.235
1.372
Rel
ativ
e F
requ
ency
A Deadlin
es
B Improve
tech
niques
C New si
tuations
D Repeat w
ork
E Presc
ribed w
ork
F Losses i
f mist
ake
G Multi
activit
ies
H Conce
ntratio
n
I Minim
um perform
Performance Requirement
1979 1986 2006
Source: BIBB 1979-2006, workers ages 16 through 65.Notes: Measures of relative performance requirement frequencies from log employmentOLS regression over 180,022requirement-year-gender-age-sector-occupation cells,as reported in Tables D.3 and D.4. Coefficientsβ from logemployment regressions reported asexp{β} to reflect relative frequencies. Omitted baseline performance requirementfrom regressions:E Work procedures prescribed in detailin each survey wave. Performance requirements F-H missingin 1992, requirement I missing in 2006. Log scale on verticalaxis.
5 Activity Content, Job Performance Requirements and Trade
So far, we separately presented Germany’s import patterns and the evolution of activities and jobperformance requirements in Germany. Now we bring both together and investigate how trade andtasks interact. To obtain first proxies to the likely activity content and the likely job performancerequirements behind German trade flows, we impute implied task trade flows through a weightingprocedure. Consider import flows to Germany first. To obtain weights, we aggregate the BIBBdata to cells by sector, survey year, and task (activity or performance requirement) and count thenumber of workers in each cell. We compute a task’s employment share in the sector and yeartotal,
σijt ≡ Lijt/(∑
j Lijt),
for taski, survey yeart and sectorj. Then we match to these task shares the import flows of finalproducts in a given sectorMjtc from source countryc and obtain imputed task shares in importflows σij,t−7Mjtc, where we use the German task share in a sector in the prior survey wavet − 7under the assumption that a typical foreign source country’s task composition resembles that ofGermany seven years earlier. Finally, we impute the volume of final goods imports associated withtaski embedded in total imports from countryc with
mitc ≡∑
j σij,t−7Mjtc.
For German exports, we use task weightsσijt of the current period to obtain tasks embedded
16

in total exportsxitc ≡
∑j σijtXjtc,
whereXjt are sectoral export flows of final products to destination country c.8
We regress the log embedded task trade flow on a set of indicators in specifications similar tothe exercises before:
lnmitc = βit + βt + βc + εitc, (3)
ln xitc = βit + βt + βc + εitc, (4)
for task i (activity or performance requirement), yeart and countryc. We control for sourcecountry fixed effects (in regressions of log task imports) and for destination country fixed effects(in regressions of log task exports) but their omission changesβit estimates hardly at all. Weestimate standard errors under two-way clustering at the level of countries and tasks (Cameron etal. 2011).
On the import side, we strive to uncover possible shifts in the task content of trade flowsto Germany. The source-country composition of trade flows provides us with variation in thedata that help track the evolution of sectoral trade flows to Germany. After conditioning on bothsource-country and sector fixed effects, the remaining explanatory variation in the data is at thejoint sector-country level.9 However, the source-country information does not allow us to discernbetween uses of the imports for intermediate inputs or final consumption. We therefore defer theanalysis of intermediate inputs and final-product imports to an upcoming separate exercise.
As before, for activity content we choose as our omitted reference categories1 Manufacture,Produce Goodsin each survey year. For performance requirements, we choose as our omittedreference categories the performance requirementE Work procedures prescribed in detailin eachsurvey year. Our inclusion of a full set of year dummies meansthat we have to exclude onereference task category per survey year. To standardize results, we scale the coefficients from thelog regressions to reportexp{β} (and adjust the standard errors with the Delta method) so thatthe estimates reflect relative trade frequencies (relativetrade values) compared to the respectiveomitted reference categories.
German imports. Our hypothesis is that under increasing offshorability of codifiable, routineand non-interactive tasks, we should see a shift in the relative import frequency of activities otherthan1 Manufacture, Produce Goodsto lower and lower levels over time, that is a downward turn ofthe activity profile to the right of the reference activity1 Manufacture, Produce Goods. Similarly,we should see a shift in the relative frequency of performance requirements other thanE Work
8These are crude measures and, similar to much prior work on trade in the literature, based on final goods trade.However, as Table 3 above documented, most German imports are for intermediate use and not for final consumption.In future statistical work, we are planning to use ILO data onforeign occupations and industries to compute theoccupation composition behind country-level import flows and transform the import flows of final products into flowsof intermediate goods imports using the import matrix from German input-output tables.
9To use possibly much source-country variation, which is more limited for services trade flows, we restrict thesample to merchandize trade in this exercise.
17

Figure 4:Activity Content and Performance Requirements Embedded in German Imports
Activities in Total Imports Performance Requirements in Total Imports
1986
1999
2006
.198
.296
.444
.667
1.000
1.500
Rel
ativ
e F
requ
ency
1 Produce
2 Repair/M
aintain .
4 Transport/S
tore
5 Measu
re/Insp
ect
6 Analyz
e/Rese
arch
7 Purch
ase/S
ell
8 Program C
omputer
9 Practi
ce Law
10 Consu
lt/Inform . .
13 Adve
rtise/P
romote
14 Organize
/Plan
15 Ove
rsee/C
ontrol
Activity
1986 1999 2006
1986
1999
2006
.810
.900
1.000
1.111
1.235
1.372
Rel
ativ
e F
requ
ency
A Deadlin
es
B Improve
tech
niques
C New si
tuations
D Repeat w
ork
E Presc
ribed w
ork
F Losses i
f mist
ake
G Multi
activit
ies
H Conce
ntratio
n
I Minim
um perform
Performance Requirement
1986 1999 2006
Sources: WTF 1979-1993 and recent revisions 1994-2006 for merchandize trade, Deutsche Bundesbank for servicestrade 1979-2006; BIBB 1979-2006, workers ages 16 through 65.Notes: Measures of relative task (activity or performance requirement) frequencies from log import valueOLS regres-sion over task-year-source country cells (12,398 observations for activities and 6,918 observations for performancerequirements), as reported in Tables D.5 and D.6. Import value of embedded tasks imputed using 7-year lags of Ger-man task shares by sector. Services activities 3, 11 and 12 not reported in graphs, performance requirement I missingin 2006, requirement D dropped to avert multi-collinearity. Coefficientsβ from log import value regressions reportedasexp{β} to reflect relative import frequencies. Omitted baseline activity 1 Manufacture, Produce Goodsin eachsurvey wave, omitted baseline performance requirementE Work procedures prescribed in detailin each survey wave.Log scale on vertical axis.
procedures prescribed in detailto lower and lower levels over time, that is a U-shaped downwardturn of the performance requirement profile to the left and right of the reference requirementEWork procedures prescribed in detail. In the extreme case, we might see an inversion from aninitially U-shaped profile open upwards to an inverted U withthe opening downwards.
Table D.5 reports exponentiated coefficient estimates fromOLS regressions of activities em-bedded in German imports, relative to the activitymanufacture, produce goods. (Note that we use1979 weights also for 1979 because no data is available fort − 7 = 1972.) Similarly, Table D.6presents the estimates for performance requirements embedded in German imports. Graphically,we present estimates for the years 1986, 1999 and 2006 in Figure 4. We exclude 1992 becauseof many missing performance requirements. We exclude 1979 because weights for 1972 are notavailable so that we have to use concurrent weights instead.Given identical task weights for tradeflows in 1979 and 1986, and our conditioning on year fixed effects, it is not surprising that ourestimates for 1979 and 1986 are very similar (compare Table D.5 and in the Appendix).10
10From the activity graphs, we drop the pure services activities3 Entertain/Accommodate, 11 Train/Educateand12Nurse/Cureoff the shown task trade flow statistics because we do not haveservices trade data at this stage. However,we include these three services categories in the underlying regression to condition out their relative effects (seeAppendix tables).
18

The left panel of Figure 4 indicates that most activities embedded in German imports haveremained roughly constant over time or lost over in importance over time relative to the referencecategorymanufacture, produce goods. In terms of magnitudes, consider2 Repair/Maintain. Whilein 1986 and 1999, its relative trade frequency (relative trade value) compared to the respectiveomitted reference category was 95 percent and 96 percent respectively, this dropped to 76 percentin 2006. Prominent exceptions from the general pattern are activities 8 Program a Computerand9 Apply Legal Knowledge, which have become more prominent in German imports over time.Overall, we do not seem to observe dramatic effects of new forms of globalization on job activities.
The picture is more clear cut for performance requirements embedded in German imports. Theright panel of Figure 4 shows that, except forG Versatility/multi activities, where the 2006 valueis slightly above the 1986 one, the 1986 values exceed the ones from 1999 and 2006. So, we dosee that performance requirements embedded in German imports other than the reference categoryE Work procedures prescribed in detaillose importance over time. To the extent that these perfor-mance requirements are more “high-end” thanE Work procedures prescribed in detail, they matterrelatively less in German imports, mirroring their prominence in the job requirements of Germany’sdomestic labour force. Overall, the performance requirement profile roughly resembles a U shapein 1986 (and 1979) and the hypothesized inverted U shape in later years. The profile strictly resem-bles an inverted U shape in 1999 with its peak at the arguably easily offshorable baseline taskEWork procedures prescribed in detail, as expected. In 2006, however, there are two exceptions forthe performance featuresF Financial loss by small mistakeandG Versatility/multiple activities,consistent with a concentration of German imports in sectoral activities that enrich jobs with moreresponsibilities between 1999 and 2006. Overall, trade flows exhibit a marked difference in taskcontent across tasks within any period of time, but no dramatic shifts over time as new forms ofglobalization evolve.
German exports. We perform the same exercise for German exports. Our hypothesis is thatthe export pattern should reflect the task restructuring of the German economy as observed inSection 4 before. Under increasing offshorability of codifiable, routine and non-interactive tasks,we should see German export specialization with the relative frequency of activities other than1 Manufacture, Produce Goodsshifting to higher and higher levels over time, that is an upwardturn of the activity profile to the right of the reference activity 1 Manufacture, Produce Goods.Similarly, we should see a shift in the relative export frequency of performance requirements otherthanE Work procedures prescribed in detailto higher and higher levels over time, that is a U-shaped upward turn of the performance requirement profile tothe left and right of the referencerequirementE Work procedures prescribed in detail.
For activities, we do not find evidence of a strong temporal shift similar to the import side (seethe left panel of Figure 5, or Table D.7 in the Appendix).11 The similarity of the activity weightedexport patterns with the import patterns is consistent withthe idea that products from sectors withthese activity patterns become more tradable overall. For future more detailed analysis of shiftsin task content, we will need to account for exports of final products as well as for imports of
11For comparability to imports we choose the same years 1986, 1999, 2006 for exports in Figure 5.
19

Figure 5:Activity Content and Performance Requirements Embedded in German Exports
Activities in Exports Performance Requirements in Exports
1986
1999
2006
.198
.296
.444
.667
1.000
1.500
Rel
ativ
e F
requ
ency
1 Produce
2 Repair/M
aintain .
4 Transport/S
tore
5 Measu
re/Insp
ect
6 Analyz
e/Rese
arch
7 Purch
ase/S
ell
8 Program C
omputer
9 Practi
ce Law
10 Consu
lt/Inform . .
13 Adve
rtise/P
romote
14 Organize
/Plan
15 Ove
rsee/C
ontrol
Activity
1986 1999 2006
1986
1999
2006
.810
.900
1.000
1.111
1.235
1.372
Rel
ativ
e F
requ
ency
A Deadlin
es
B Improve
tech
niques
C New si
tuations
D Repeat w
ork
E Presc
ribed w
ork
F Losses i
f mist
ake
G Multi
activit
ies
H Conce
ntratio
n
I Minim
um perform
Performance Requirement
1986 1999 2006
Sources: WTF 1979-1993 and recent revisions 1994-2006 for merchandize trade, Deutsche Bundesbank for servicestrade 1979-2006; BIBB 1979-2006, workers ages 16 through 65.Notes: Measures of relative task (activity or performance requirement) frequencies from log export valueOLS regres-sion over task-year-destination country cells (12,629 observations for activities and 6,882 observations for performancerequirements), as reported in Tables D.7 and D.8. Export value of embedded tasks imputed using current German taskshares by sector. Services activities 3, 11 and 12 not reported in graphs, performance requirement I missing in 2006,requirement D dropped to avert multi-collinearity. Coefficientsβ from log export value regressions reported asexp{β}to reflect relative export frequencies. Omitted baseline activity 1 Manufacture, Produce Goodsin each survey wave,omitted baseline performance requirementE Work procedures prescribed in detailin each survey wave. Log scale onvertical axis.
competing goods in the product market and imports of intermediate goods in the input markets.Our hypothesis receives support for performance requirements in German exports, however.
Table D.8 and the right panel of Figure 5 show that German exports are increasingly intensivein “high-end” performance requirements. In all performance requirements except forG Versatil-ity/multiple activitiesthe coefficient estimates in 2006 are as high as (statistically not significantlydifferent) or statistically significantly higher than in prior years.
The predictive power of German imports and exports for task frequencies. An alternativeway to analyze the role German imports and exports in changing task patterns is to extend specifi-cations (1) and (2) as follows:
lnLitsajk =∑
T βTi X
Tjt + βit + βt + βs + βa + εitsajk (5)
for taski (activity or performance requirement), yeart, genders and agea, as well as sectorj andoccupationk, and a set of three trade regressorsT (imported intermediate inputs, imported finalproducts, exports). Theβ parameters denote regression coefficients on according sets of dummyvariables, where the trade flow coefficientsβT
i are task and trade-flow specific. Again, restrictingcoefficient estimates to reflect effects within sectors and occupations, we specify the corresponding
20

long regression
lnLitsajk =∑
T βTi X
Tjt + βit + βt + βs + βa + βj + βk + εitsajk. (6)
In both regressions, we can estimate a full set ofβTi coefficients (for all tasks), obviating the need
of a reference category for these specifications. For the mapping of import flows to sectors, weuse the source country’s sector for final-goods imports. But we use Germany’s receiving sector forintermediate-input imports, aggregating over all source-country sectors.
Figure 6 shows effects of trade based on equations (5) and (6). We estimate a full set oftask coefficients for each trade flow, so the coefficient include the mean effect of trade flows onsector-occupation employment in Germany. On the import side, we discern the predicted effects ofintermediate-input imports and final-product imports. Starting with the upper-left chart, and activ-ity 1 Produce, more exports are, not surprisingly, associated with a higher frequency of productiontasks. Conversely, more final-product imports predict a reduced frequency of production tasks,because final-goods imports arguably compete against production tasks. However, imported inter-mediate inputs predict the opposite consequence and an increase in the production-task frequency.Similar patterns hold quite generally in the upper-left chart for activities, and also in the lower-leftchart of Figure 6 for performance requirements: more exports from Germany and more importedinputs typically affect task frequencies positively, while final-goods imports affect task frequenciesnegatively. A possible reason for the predicted positive effects of imported inputs on task frequen-cies is that imported intermediates do typically not substitute in-house production in Germany butrather replace previously domestically outsourced inputs(recall the constant fraction of outsourcedinputs in total production values of around one-half in Table 4). The newly foreign-sourced inputsmight therefore help industries advance productivity and build towards their competitiveness, plau-sibly augmenting the frequencies of similar tasks as exports from those industries predict.
Consistently across all tasks, final-goods flows on both the import and the export side predict alarger marginal percentage change of task frequencies in absolute magnitude than do intermediate-input imports. The relatively weak effect of intermediate-input trade, compared to classic formsof trade in final goods, is consistent with our earlier descriptive evidence that intermediate inputtrade is not a recent phenomenon in our sample period but, if anything, losing again in relativeimportance compared to the beginning of our sample period inthe 1970s (recall Table 3). Newforms of trade matter for task frequencies, but so do classictrade flows. Among the tasks mostfrequently positively affected by both exports and imported inputs are activities that are not neces-sarily production related such as8 Program Computer, 10 Consult/Informand14 Organize/Planas well as the “high end” performance requirementsA Deadlines, C New situationsandI Minimumperformance.
From a purely statistical perspective, we expect predictedeffects of sector-year trade flowsto be mitigated in regressions that control for sector and occupation effects. Indeed, coefficientsin the two right-hand side charts of Figure 6 are smaller in magnitude than those from the un-conditional regressions on the left-hand side. It continues to be the case that the tasks most fre-quently positively affected by both exports and imported inputs are activities that are not neces-sarily production related such as10 Consult/Informand14 Organize/Planas well as the “highend” performance requirementsA Deadlines, C New situationsandI Minimum performance. The
21

Figure 6:Trade Predictions of Task Frequencies
Activity Content of German WorkNot Conditional on Sectors and Occupations Conditional on Sectorsand Occupations
0.75
0.87
1.00
1.15
1.33
Rel
ativ
e C
hang
e in
Fre
quen
cy
1 Produce
2 Repair/M
aintain
3 Enterta
in/Acc
ommodate
4 Transport/S
tore
5 Measu
re/Insp
ect
6 Analyz
e/Rese
arch
7 Purch
ase/S
ell
8 Program C
omputer
9 Practi
ce Law
10 Consu
lt/Inform
11 Train/Educa
te
12 Nurse
/Cure
13 Adve
rtise/P
romote
14 Organize
/Plan
15 Ove
rsee/C
ontrol
Imported Inputs Product Imports Product Exports
0.75
0.87
1.00
1.15
1.33
Rel
ativ
e C
hang
e in
Fre
quen
cy1 P
roduce
2 Repair/M
aintain
3 Enterta
in/Acc
ommodate
4 Transport/S
tore
5 Measu
re/Insp
ect
6 Analyz
e/Rese
arch
7 Purch
ase/S
ell
8 Program C
omputer
9 Practi
ce Law
10 Consu
lt/Inform
11 Train/Educa
te
12 Nurse
/Cure
13 Adve
rtise/P
romote
14 Organize
/Plan
15 Ove
rsee/C
ontrol
Imported Inputs Product Imports Product Exports
Performance Requirements of German WorkNot Conditional on Sectors and Occupations Conditional on Sectorsand Occupations
0.75
0.87
1.00
1.15
1.33
Rel
ativ
e C
hang
e in
Fre
quen
cy
A Deadlin
es
B Improve
tech
niques
C New si
tuations
D Repeat w
ork
E Presc
ribed w
ork
F Losses i
f mist
ake
G Multi
activit
ies
H Conce
ntratio
n
I Minim
um perform
Imported Inputs Product Imports Product Exports
0.75
0.87
1.00
1.15
1.33
Rel
ativ
e C
hang
e in
Fre
quen
cy
A Deadlin
es
B Improve
tech
niques
C New si
tuations
D Repeat w
ork
E Presc
ribed w
ork
F Losses i
f mist
ake
G Multi
activit
ies
H Conce
ntratio
n
I Minim
um perform
Imported Inputs Product Imports Product Exports
Sources: WTF 1979-1993 and recent revisions 1994-2006 (Feenstra et al. 2005, update 2011) for merchandize trade,Deutsche Bundesbank for services trade 1979-2006; BIBB 1979-2006, workers ages 16 through 65.Notes: Measures of relative activity and performance requirement frequencies from log employmentOLS regressionsover 168,466 and 180,022 activity-year-gender-age-sector-occupation cells, as reported in Tables D.9 and D.10 aswell as Tables D.11 and D.12. Coefficientsβ from log employment regressions reported asexp{β} to reflect rela-tive frequencies. Baseline activity omitted from regressions: 1 Manufacture, Produce Goods; baseline performancerequirement omitted:E Work procedures prescribed in detailin each survey wave. Performance requirements F-Hmissing in 1992, requirement I missing in 2006. Log scale on vertical axis.
22

strongest within-sector and within-occupation prediction now is associated with the activity3 En-tertain/Accommodate: direct exports of goods and services plausibly reduce the in-person provi-sion of hospitality services, whereas final-goods imports correlate positively with hospitality ser-vices. Given the main variation of trade flows at the sector-year level, however, results presentedin the left-hand side charts, which do not condition on sector and occupation, are arguably moreinformative.
In another variation of our main specification (2), which conditions on sector and occupationeffects, we follow the literature and investigate the potential sensitivity of our task frequency countsto technical change (workplace use of a computer), education (years of schooling), and to migrationstatus (non-German citizenship). For all those variables,we aggregate the worker-level measuresto the same cell levels as before and re-estimate (2). Remarkably, none of our task frequency countsappear to be noticeably affected (we report the results in Appendix E.1). For those three measuresof workplace changes, the added variation beyond the year, age, gender, sector, and occupationfixed effects exhibits little explanatory power. It is against the backdrop of those findings that weevaluate the relative importance of trade flows for task demand and labour-market outcomes inGermany. Though arguably still relatively small in magnitude, effects of trade are more noticeablethan those of technical change, education and migration status.
Taking stock. Summarizing our main findings from this and the preceding Section, we find anincreasing importance of “high end” activities in German workplace characteristics during the sam-ple period. At the same time, we find the task content of Germanimports to include fewer“high-end” performance requirements and the opposite for performance requirements embedded in Ger-man exports. This evidence supports theories of trade in tasks. Direct predictions of trade-flowvariables support the idea that Germany specializes in moreelaborate tasks as globalization pro-gresses: both exported final goods and imported inputs predict higher frequencies of high-end andnot necessarily production related workplace activities and job performance requirements—suchas organizing, planning, and consulting activities under deadlines, often changing business con-stellations and tougher performance standards.
6 Institutional Aspects
This section relates the workplace and trade flow changes to select labour-market institutions: onthe domestic side, we look at the sectoral degree of unionization and at the degree of regionallabour-market tightness as it affects sectors through their regional dispersion. On the foreign side,we look at labour-market rigidity among German trade partners.
6.1 Highly unionized vs. less unionized sectors in Germany
In our subsequent analysis, we run separate regression for highly unionized (above median) vs. lessunionized sectors (at or below median) in Germany. This gives us insights into whether changingtask patters vary with the degree of influence of a key domestic labour-market institution.
23

Figure 7:Unionization rates by sector over time
1985
1993
1998
2007
0
.1
.2
.3
.4
.5
.6
Uni
oniz
atio
n ra
te
1 Agri/U
til/Mining
2 Chem/M
inerals
3 Iron/S
teel/Metals
4 Transport e
quipmt
5 Mach
in & E
quipmt
6 Wood/P
aper/Prin
t
7 Text/App/Leath
8 Food/Beve
rage
1985 1993 1998 2007
Source: GSOEP, 1985-2007, workers ages 16 through 65; select yearswith unionization.Note: Unionization rate is share of West German household members who report union membership and employmentin an industry.
To inspect unionization rates across sectors over time, we aggregate sectors to the same eightaggregate sectors that we used to depict trends in German imports over time (Figure 1). Figure 7shows several interesting features: first, unionization rates vary considerably across (aggregated)sectors. They are highest in3 Iron/Steel/Manufacturingand4 Transport equipmentranging frombetween 40 to 50 percent, and lowest in8 Food/Beverageswith 10 to 30 percent unionization.Second, with the exception of textiles and apparel, unionization rates have fallen over time. Thechanges over time are similar across sectors.
In the regression analysis, we exploit variation not only across the eight sectors used in thegraphical presentation, but across all 39 sectors in our data. In order to split sectors into highunionization and low unionization sectors, we compute unionization rates as averages over timeand split the sample at the median sector. We re-run the regressions from Section 4, separately forstrongly unionized sectors and weakly unionized sectors. The regression results are in Tables D.13through D.16 in the Appendix.
For ease of comparison, we graphically depict the results inFigure 8. The upper panel showsthat, in the base year 1979, in strongly unionized sectors, the reference activity1 Produceis overallmore dominant than in weakly unionized sectors. Graphically, the 1979 curve reaches further downin strongly unionized sectors than in weakly unionized sectors. Over time, in both strongly andweakly unionized sectors, activities other than the reference activity become more prominent, butin weakly unionized sectors, the 2006 curve in weakly unionized sectors still lies above that ofstrongly unionized sectors (i.e. compare the 2006 curve across graphs, or compare column (5) inTables D.13 through D.16).
Similarly, as can be seen in the lower panel of the figure, performance requirements are overallmore demanding in weakly unionized sectors. Over time, the changes in performance require-
24

Figure 8:Activity Content and Performance Requirements of German Work by Unionization
Activity Content of German WorkStrongly Unionized Sectors Weakly Unionized Sectors
1979
1986
2006
.444
.667
1.000
1.500
2.250
Rel
ativ
e F
requ
ency
1 Produce
2 Repair/M
aintain
3 Enterta
in/Acc
ommodate
4 Transport/S
tore
5 Measu
re/Insp
ect
6 Analyz
e/Rese
arch
7 Purch
ase/S
ell
8 Program C
omputer
9 Practi
ce Law
10 Consu
lt/Inform
11 Train/Educa
te
12 Nurse
/Cure
13 Adve
rtise/P
romote
14 Organize
/Plan
15 Ove
rsee/C
ontrol
Activity
1979 1986 2006
Performance Requirements of German WorkStrongly Unionized Sectors Weakly Unionized Sectors
1979
1986
2006
.810
.900
1.000
1.111
1.235
1.372
Rel
ativ
e F
requ
ency
A Deadlin
es
B Improve
tech
niques
C New si
tuations
D Repeat w
ork
E Presc
ribed w
ork
F Losses i
f mist
ake
G Multi
activit
ies
H Conce
ntratio
n
I Minim
um perform
Performance Requirement
1979 1986 2006
1979
1986
2006
.810
.900
1.000
1.111
1.235
1.372
Rel
ativ
e F
requ
ency
A Deadlin
es
B Improve
tech
niques
C New si
tuations
D Repeat w
ork
E Presc
ribed w
ork
F Losses i
f mist
ake
G Multi
activit
ies
H Conce
ntratio
n
I Minim
um perform
Performance Requirement
1979 1986 2006
Sources: BIBB 1979-2006, workers ages 16 through 65; GSOEP select years with unionization.Notes: Measures of relative activity frequencies from log employment OLS regression over 76,676 activity-year-gender-age-sector-occupation cells with high unionization and 84,480 cells with low unionization, as reported inTables D.13 and D.14, and 89,092 requirement-year-gender-age-sector-occupation cells with high unionization and83,667 cells with low unionization, as reported in Tables D.15 and D.16. Coefficientsβ from log employment re-gressions reported asexp{β} to reflect relative frequencies. Omitted baseline task fromregressions: activity1 Man-ufacture, Produce Goodsand performance requirementE Work procedures prescribed in detailin each survey wave.Performance requirements F-H missing in 1992, requirementI missing in 2006. Log scale on vertical axis.
25

ments are less straightforward to interpret, but seem to point towards increasing performance re-quirements in most (but not all) categories other than the reference groupE Prescribed work.
Labour market institutions in the form of domestic unionization rates, while related to differ-ences in task patterns across sectors, do not seem to have a differential impact on ‘slowing down’or ‘speeding up’ the trend toward more high-end tasks we observe to evolve during this period ofrapid globalization.
6.2 Sectors facing tight vs. less tight labour markets in Germany
We look at a second measure characterizing domestic labour markets: labour-market tightness.There is no direct measure of sector-level labour-market tightness. Instead, we start from regionalinformation on the number of vacancies per 1,000 unemployedpersons at the level of Germanstates for the years 1980 through 2005. We use the sectoral distribution of workers across statesto compute a (country-wide) sector-level measure of labour-market tightness. If a sector is morestrongly represented in a state with high labour-market tightness, the representative worker in thatsector is exposed to a tighter labour market than a worker in another sector which has a strongerpresence in a state with lower tightness. As before, we compute tightness rates as averages overtime and split the sample at the median sector. We re-run the regressions from Section 4, separatelyfor sectors exposed to labour markets with high and low tightness. The regression results are inTables D.17 through D.20 in the Appendix.
The upper panel of Figure 9 shows that, in 1979, activities other than the reference activity1Produceare overall more dominant in sectors exposed to low labour-market tightness (right-handchart) compared to sectors exposed to high tightness. Interestingly, the changes over time work tofurther strengthen the differences across the two groups ofsectors. Note that what seems to be asimilarly sized parallel shift upward in the left- and right-hand side graphs corresponds to a largerpercentage increase in the right-hand side graph due to the log-scale.
Similarly, as can be seen in the lower panel of the figure, performance requirements are overallmore demanding in sectors exposed to low labour-market tightness. For performance requirements,the changes over time do not seem to display discernible differences across the two sector samples.
Both pieces of evidence together suggest that firms operate ina constrained environment andreact to the threats and opportunities of globalization in the context of the institutional and labourmarket setting they operate in. These findings are consistent with the idea that labour-marketconditions in Germany influence changes in German workplacetasks.
6.3 Labour regulations among German trade partners
To assess a potential impact of labour regulations on incentives for task assignments, we turn toIMF-fRDB data on labour-market regulations. The data cover minimum wage regulations, unem-ployment insurance benefits, and employment protection legislation. Germany has no legally man-dated minimum wage in place during the sample period and its employment protection legislationdoes not institute severance pay requirements upon job loss. We therefore compare Germany to its
26

Figure 9:Activity Content and Performance Requirements of German Work by Labour Mar-ket Tightness
Activity Content of German WorkSectors Exposed to High Tightness Sectors Exposed to Low Tightness
1979
1986
2006
.444
.667
1.000
1.500
2.250
Rel
ativ
e F
requ
ency
1 Produce
2 Repair/M
aintain
3 Enterta
in/Acc
ommodate
4 Transport/S
tore
5 Measu
re/Insp
ect
6 Analyz
e/Rese
arch
7 Purch
ase/S
ell
8 Program C
omputer
9 Practi
ce Law
10 Consu
lt/Inform
11 Train/Educa
te
12 Nurse
/Cure
13 Adve
rtise/P
romote
14 Organize
/Plan
15 Ove
rsee/C
ontrol
Activity
1979 1986 2006
Performance Requirements of German WorkSectors Exposed to High Tightness Sectors Exposed to Low Tightness
1979
1986
2006
.810
.900
1.000
1.111
1.235
1.372
Rel
ativ
e F
requ
ency
A Deadlin
es
B Improve
tech
niques
C New si
tuations
D Repeat w
ork
E Presc
ribed w
ork
F Losses i
f mist
ake
G Multi
activit
ies
H Conce
ntratio
n
I Minim
um perform
Performance Requirement
1979 1986 2006
1979
1986
2006
.810
.900
1.000
1.111
1.235
1.372
Rel
ativ
e F
requ
ency
A Deadlin
es
B Improve
tech
niques
C New si
tuations
D Repeat w
ork
E Presc
ribed w
ork
F Losses i
f mist
ake
G Multi
activit
ies
H Conce
ntratio
n
I Minim
um perform
Performance Requirement
1979 1986 2006
Sources: BIBB 1979-2006, workers ages 16 through 65; IAB select years with labour market tightness.Notes: Measures of relative activity frequencies from log employment OLS regression over 68,941 activity-year-gender-age-sector-occupation cells with high labour market tightness and 95,910 cells with low labour market tight-ness, as reported in Tables D.17 and D.18, and 80,051 requirement-year-gender-age-sector-occupation observationswith high labour market tightness and 95,989 cells with low labour market tightness, as reported in Tables D.19and D.20. Coefficientsβ from log employment regressions reported asexp{β} to reflect relative frequencies. Omittedbaseline task from regressions: activity1 Manufacture, Produce Goodsand performance requirementE Work proce-dures prescribed in detailin each survey wave. Performance requirements F-H missing in 1992, requirement I missingin 2006. Log scale on vertical axis.
27
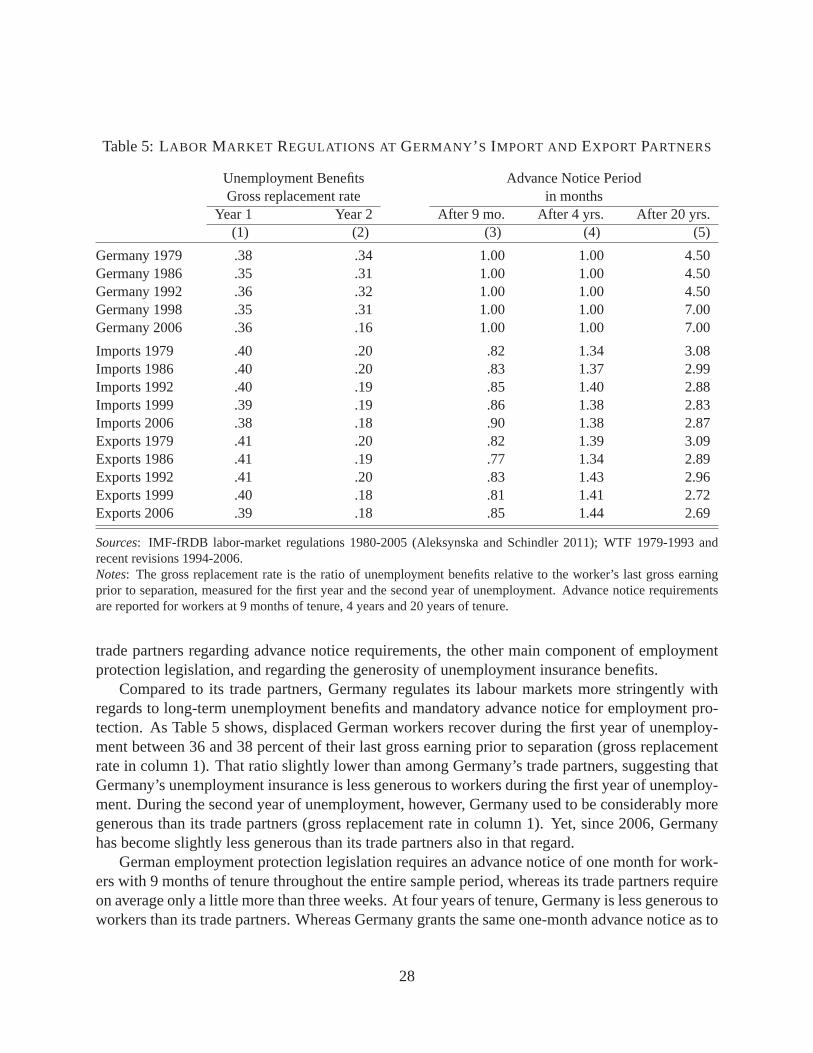
Table 5: LABOR MARKET REGULATIONS AT GERMANY ’ S IMPORT AND EXPORT PARTNERS
Unemployment Benefits Advance Notice PeriodGross replacement rate in months
Year 1 Year 2 After 9 mo. After 4 yrs. After 20 yrs.(1) (2) (3) (4) (5)
Germany 1979 .38 .34 1.00 1.00 4.50Germany 1986 .35 .31 1.00 1.00 4.50Germany 1992 .36 .32 1.00 1.00 4.50Germany 1998 .35 .31 1.00 1.00 7.00Germany 2006 .36 .16 1.00 1.00 7.00
Imports 1979 .40 .20 .82 1.34 3.08Imports 1986 .40 .20 .83 1.37 2.99Imports 1992 .40 .19 .85 1.40 2.88Imports 1999 .39 .19 .86 1.38 2.83Imports 2006 .38 .18 .90 1.38 2.87Exports 1979 .41 .20 .82 1.39 3.09Exports 1986 .41 .19 .77 1.34 2.89Exports 1992 .41 .20 .83 1.43 2.96Exports 1999 .40 .18 .81 1.41 2.72Exports 2006 .39 .18 .85 1.44 2.69
Sources: IMF-fRDB labor-market regulations 1980-2005 (Aleksynska and Schindler 2011); WTF 1979-1993 andrecent revisions 1994-2006.Notes: The gross replacement rate is the ratio of unemployment benefits relative to the worker’s last gross earningprior to separation, measured for the first year and the second year of unemployment. Advance notice requirementsare reported for workers at 9 months of tenure, 4 years and 20 years of tenure.
trade partners regarding advance notice requirements, theother main component of employmentprotection legislation, and regarding the generosity of unemployment insurance benefits.
Compared to its trade partners, Germany regulates its labourmarkets more stringently withregards to long-term unemployment benefits and mandatory advance notice for employment pro-tection. As Table 5 shows, displaced German workers recoverduring the first year of unemploy-ment between 36 and 38 percent of their last gross earning prior to separation (gross replacementrate in column 1). That ratio slightly lower than among Germany’s trade partners, suggesting thatGermany’s unemployment insurance is less generous to workers during the first year of unemploy-ment. During the second year of unemployment, however, Germany used to be considerably moregenerous than its trade partners (gross replacement rate incolumn 1). Yet, since 2006, Germanyhas become slightly less generous than its trade partners also in that regard.
German employment protection legislation requires an advance notice of one month for work-ers with 9 months of tenure throughout the entire sample period, whereas its trade partners requireon average only a little more than three weeks. At four years of tenure, Germany is less generous toworkers than its trade partners. Whereas Germany grants the same one-month advance notice as to
28
workers at lower tenure, its trade partners require an advance notice of one-and-a-third months onaverage. At very high tenure of 20 years, Germany is again more generous to workers and raisedthe advance notice even further from 4.5 to 7 months over the over the sample period, whereas itstrade partners gradually lowered advance notice from on average over three months to under threemonths. Overall, neither regarding unemployment benefits nor employment protection legislationis Germany uniformly more or less generous than its trade partners. At different time horizonsGermany can be less or more worker friendly.
For both unemployment benefits and advance notice there is nomarked difference betweenGermany’s import and Germany’s export partners, suggestive of the possibility that trade flows arenot driven by labour-market institutions.
Similar to unemployment benefits, a legally mandated and binding minimum wage raiseslabour costs. Germany having no legal minimum wage during the sample period is a less workerfriendly economy than its typical trade partner in that dimension.12 Similarly, at four years oftenure, Germany affords its workers less employment protection through advance notice than theaverage trade partner. In both regards, Germany is relatively more business friendly.
To quantify the potential sensitivity of German workplace tasks to foreign labour-market reg-ulations with regards to the minimum wage and advance notice, we group foreign countries intothose with below and those with above median regulations. Werun separate regressions for im-ports from source countries with more worker friendly regulations (higher minimum wage permean wage or longer advance notice than the median foreign country) vs. less worker friendlyforeign economies. This sample split allows us to compare the imported trade-task relationshipacross levels of source-country regulations in two areas oflabour-market legislation, in which Ger-many is less worker friendly than world average and therefore arguably more sensitive. Figure 10shows the results for advance notice requirements at four years of tenure (regression Tables D.25through D.28 in the Appendix); Figure E.1 in the Appendix presents similar results for the mini-mum wage. Perhaps expectedly, given the evidence from Table5, there are no marked differencesof embedded task trade between more and less worker friendlyimport source countries.
6.4 Labour market rigidity among German trade partners
In our final piece of analysis, we turn to recent measures of labour-market rigidity and comparethe rigidity of the German labour market to that of its trade partners, using the World Bank’sclassification of employment laws following Botero et al. (2004). We bring in import flows byyear to compute the weighted mean rigidity index of the source countries of Germany’s imports,and export flows for the weighted rigidity index of Germany’sdestination countries.
Table 6 lists the rigidity indexes by category for Germany and its trade partners. Three maininsights emerge. First, by the World Bank’s classification Germany has considerably more rigid
12Unemployment benefits constitute a varying outside option for workers of different earnings levels and may thushave an arguably differential impact on wage setting that minimum wages cannot exert. However, many countriesappear to trade off severance pay arrangements with unemployment benefits over the sample period, with about one-third of countries introducing unemployment benefits for the first time during the sample period. This feature makesunemployment benefits legislation harder to quantify in itslabour-market impact, and we focus our analysis on theminimum wage and advance notice instead.
29

Figure 10:Activity Content and Performance Requirements Embedded in German Importsby Foreign Employment Protection Levels
Activity Content Embedded in German Importsfrom High Protection Countries from Low Protection Countries
1986
1999
2006
.198
.296
.444
.667
1.000
1.500
Rel
ativ
e F
requ
ency
1 Produce
2 Repair/M
aintain .
4 Transport/S
tore
5 Measu
re/Insp
ect
6 Analyz
e/Rese
arch
7 Purch
ase/S
ell
8 Program C
omputer
9 Practi
ce Law
10 Consu
lt/Inform . .
13 Adve
rtise/P
romote
14 Organize
/Plan
15 Ove
rsee/C
ontrol
Activity
1986 1999 2006
1986
1999
2006
.198
.296
.444
.667
1.000
1.500
Rel
ativ
e F
requ
ency
1 Produce
2 Repair/M
aintain .
4 Transport/S
tore
5 Measu
re/Insp
ect
6 Analyz
e/Rese
arch
7 Purch
ase/S
ell
8 Program C
omputer
9 Practi
ce Law
10 Consu
lt/Inform . .
13 Adve
rtise/P
romote
14 Organize
/Plan
15 Ove
rsee/C
ontrol
Activity
1986 1999 2006
Performance Requirements Embedded in German Importsfrom High Protection Countries from Low Protection Countries
1986
1999
2006
.810
.900
1.000
1.111
1.235
1.372
Rel
ativ
e F
requ
ency
A Deadlin
es
B Improve
tech
niques
C New si
tuations
D Repeat w
ork
E Presc
ribed w
ork
F Losses i
f mist
ake
G Multi
activit
ies
H Conce
ntratio
n
I Minim
um perform
Performance Requirement
1986 1999 2006
1986
1999
2006.810
.900
1.000
1.111
1.235
1.372
Rel
ativ
e F
requ
ency
A Deadlin
es
B Improve
tech
niques
C New si
tuations
D Repeat w
ork
E Presc
ribed w
ork
F Losses i
f mist
ake
G Multi
activit
ies
H Conce
ntratio
n
I Minim
um perform
Performance Requirement
1986 1999 2006
Source: WTF 1979-1993 and recent revisions 1994-2006 (Feenstra et al. 2005, update 2011) for merchandize trade,Deutsche Bundesbank for services trade 1979-2006; BIBB 1979-2006, workers ages 16 through 65; IMF-fRDB labor-market regulations 1980-2005.Notes: Measures of relative task (activity or performance requirement) frequencies from log import valueOLS regres-sions over task-year-source country cells (2,653 observations for activities and 1,485 for performance requirementsover more worker friendly source countries, 6,657 observations for activities and 3,705 for performance requirementsover less worker friendly source countries than Germany), as reported in Tables D.25 and D.27, D.26 and D.28. Sourcecountries with advance notice above (high protection) or below (low protection) world median for workers with fouryears of tenure. Import value of embedded tasks imputed using 7-year lags of German task shares by sector. Servicesactivities 3, 11 and 12 not reported in graphs, performance requirement I missing in 2006, requirement D dropped toavert multi-collinearity. Coefficientsβ from log import value regressions reported asexp{β} to reflect relative importfrequencies. Omitted baseline activity1 Manufacture, Produce Goods, omitted baseline performance requirementEWork procedures prescribed in detailin each survey wave. Log scale on vertical axis.
30

Table 6: LABOR MARKET RIGIDITY AT GERMANY ’ S IMPORT AND EXPORT PARTNERS
Index of Hiring costs Hours changes Firing costs Overall rigidity Firing costs(1) (2) (3) (4) (5)
Germany 44.0 80.0 40.0 55.0 80.0
Imports 1979 32.7 52.7 28.8 38.0 36.8Imports 1986 33.4 52.8 28.5 38.2 35.9Imports 1992 33.2 53.3 29.3 38.5 37.5Imports 1999 31.2 51.7 29.6 37.5 38.1Imports 2006 28.3 51.2 30.0 36.4 39.0
Exports 1979 31.1 52.8 29.3 37.7 37.1Exports 1986 29.9 50.6 28.5 36.3 36.0Exports 1992 33.7 54.6 31.3 39.8 40.9Exports 1999 32.3 53.2 31.5 38.9 40.0Exports 2006 31.3 53.5 32.1 38.9 41.4
Sources: World Bank Doing Business 2004 (Botero et al. 2004); WTF 1979-1993 and recent revisions 1994-2006.Notes: Labor-market rigidity indexes are coded on a scale from 1 to100, where a higher level indicates more labor-market rigidity.
employment laws in 2004 than its trade partners. Second, therigidity composition of Germany’strade partners changes little over time; in other words, given the 2004 rigidity level, there is nomarked change of trade flows related to foreign labour-market conditions over time. Third, Ger-many’s main import and export partners have similar labour-market rigidities. Similar to our earlierevidence from IMF-fRDB data on labour-market regulations, these patterns are consistent with theidea that Germany’s trade flows are largely independent of foreign labour-market institutions.
In a final exercise, we run separate regressions for imports from source countries with morerigid (overall rigidity index above German level) or less rigid labour markets than Germany. Weuse the World Bank’s internationally comparable measure of overall labour-market rigidity follow-ing Botero et al. (2004) and compare each country’s index to that in Germany. Figure 11 shows theresults (regression Tables D.21 through D.24 in the Appendix).13 Not surprisingly given the evi-dence from Table 6, there are no marked differences of embedded task trade between high-rigidityand low-rigidity import source countries.
7 Implications for Policy
Our evidence covers a broad range of trade flows, including merchandize and services, and discernsimports of intermediate inputs from final-use imports as well as exports. We relate the evidenceon trade to the task profile of the German workplace, so as to shed light on the consequences of
13Select regressions result in non-negative definite Hessians when accounting for two-way clustering. In those caseswe only cluster by importing destination country.
31

Figure 11:Activity Content and Performance Requirements Embedded in German Importsby Foreign Labor-market Rigidity
Activity Content Embedded in German Importsfrom More Rigid Countries from Less Rigid Countries
1986
1999
2006
.198
.296
.444
.667
1.000
1.500
Rel
ativ
e F
requ
ency
1 Produce
2 Repair/M
aintain .
4 Transport/S
tore
5 Measu
re/Insp
ect
6 Analyz
e/Rese
arch
7 Purch
ase/S
ell
8 Program C
omputer
9 Practi
ce Law
10 Consu
lt/Inform . .
13 Adve
rtise/P
romote
14 Organize
/Plan
15 Ove
rsee/C
ontrol
Activity
1986 1999 2006
Performance Requirements Embedded in German Importsfrom More Rigid Countries from Less Rigid Countries
1986
1999
2006.810
.900
1.000
1.111
1.235
1.372
Rel
ativ
e F
requ
ency
A Deadlin
es
B Improve
tech
niques
C New si
tuations
D Repeat w
ork
E Presc
ribed w
ork
F Losses i
f mist
ake
G Multi
activit
ies
H Conce
ntratio
n
I Minim
um perform
Performance Requirement
1986 1999 2006
1986
1999
2006
.810
.900
1.000
1.111
1.235
1.372
Rel
ativ
e F
requ
ency
A Deadlin
es
B Improve
tech
niques
C New si
tuations
D Repeat w
ork
E Presc
ribed w
ork
F Losses i
f mist
ake
G Multi
activit
ies
H Conce
ntratio
n
I Minim
um perform
Performance Requirement
1986 1999 2006
Source: WTF 1979-1993 and recent revisions 1994-2006 (Feenstra et al. 2005, update 2011) for merchandize trade,Deutsche Bundesbank for services trade 1979-2006; BIBB 1979-2006, workers ages 16 through 65; World Bank Do-ing Business 2004.Notes: Measures of relative task (activity or performance requirement) frequencies from log import valueOLS regres-sions over task-year-source country cells (2,653 observations for activities and 1,485 for performance requirementsover more rigid source countries, 6,657 observations for activities and 3,705 for performance requirements over lessrigid source countries than Germany), as reported in TablesD.21 and D.23, D.22 and D.24. 37 source countries withmore, 101 source countries with less rigid labor markets than Germany. Import value of embedded tasks imputedusing 7-year lags of German task shares by sector. Services activities 3, 11 and 12 not reported in graphs, performancerequirement I missing in 2006, requirement D dropped to avert multi-collinearity. Coefficientsβ from log importvalue regressions reported asexp{β} to reflect relative import frequencies. Omitted baseline activity 1 Manufacture,Produce Goods, omitted baseline performance requirementE Work procedures prescribed in detailin each surveywave. Log scale on vertical axis.
32

increased globalization for the labour market. Our findingssuggest that German workplaces havebeen exposed to elevated intermediate-input and services trade flows since at least the beginningof our sample period in the late 1970s. At least for Germany, the exposure to intermediate-inputand services trade is therefore no new phenomenon and fears of offshoring may be exaggerated.Our results do not point to any specific market failure, and thus provide no explicit rationale forgovernment intervention. Germany has gone through periodsof high unemployment during thesample period, especially after German unification in the 1990s. However, the fact that unem-ployment rates have fallen again towards the recent end of our sample period cautions against thehypothesis that Germany’s heightened exposure to global markets over the last three decades hashad a one-directional relationship with employment.
We find economically relevant but small marginal responses of workplace activities and jobperformance requirements to trade exposure over three decades. This evidence is consistent withthe interpretation that the German labour market is capableof gradually adjusting to the impliedeconomic change. We find that, over the sample period, jobs require workers to perform additionalactivities cumulatively (providing direct evidence on ever more prevalent multi-tasking) and thatthe German workplace has undergone a marked shift towards more “high-end” tasks, includingactivities such as consulting, organizing and planning. Our evidence on goods and services tradeflows is consistent with the view that those workplace changes are related to trade in tasks. Asglobalization progresses, Germany’s workforce has undergone, and expectedly will continue toexperience, a move towards less production related activities, while deadlines, often changingbusiness constellations and tougher performance standards alter the workplace profile. Of bothemployers and workers, these changes will arguably demand more adaptability to a cumulatingvariety of tasks and closer coordination with work steps performed outside the immediate realm ofone’s own occupation.
In taking an institutional perspective, we explore whetherexisting labour-market institutionsmay relate to an acceleration or slow-down of the workplace changes that we observe. We dis-tinguish between the role of labour-market institutions among Germany’s trading partners and therole of domestic labour-market institutions. As regards the former, there is no clear relationshipbetween the German workplace characteristics and labour-market institutions abroad: the identityof the source country of imports or the destination country of exports does not seem to matter forworkplace adjustments above and beyond the total trade volumes. Put simply, imports of iden-tical goods and services at the same price, but from different source countries, affect domesticworkplaces in no different way. When it comes to domestic labour-market institutions, our resultsindicate that sectors exposed to low regional labour-market tightness experience a faster shift to-wards high-end tasks. It is hard to assess the implications of those institution-related findings underan economic welfare perspective. To the extent that a slowershift towards multi-tasking job pro-files eases pressure on workers, the transition may have beenless demanding in sectors exposed toless tight labour market. However, our analysis does not permit any inference about relative wageeffects or employment effects across sectors.
Our evidence arguably best serves as a guide to expected workplace adjustments and theirrelationship to trade in tasks. An implication for both employers and workers is that schooling andtraining will likely need to emphasize skills that enable the student to excel at coordinating tasks
33

beyond the immediate realm of the individual workplace.
8 Conclusion
Novel data on time-varying German workplace characteristics over three decades show that theactivities of German workers on the job change considerablyover time. Workers perform moreactivities simultaneously and different activities over time, with a shift towards activities that arecommonly considered little offshorable. These changes occur mostly within sectors and occupa-tions, emphasizing the importance of time-varying task measures. During this period, the bulk ofGerman imports is destined for intermediate use and German imports expand mostly in sectors thatare intensive in job performance requirements commonly considered highly offshorable. Foreignlabour-market regulations, such as advance notice requirements and minimum wages, as well asthe rigidity of foreign labour institutions are largely unrelated to the observed changes in Germantrade patterns, while local labour-market conditions in Germany, such as unionization rates andlabour-market tightness, exhibit some covariation consistent with faster change in activity contentof German work in sector with low unionization rates and in sectors exposed to tighter labourmarkets. These patterns of evidence are consistent with theidea that, while foreign labour-marketconditions are not a driving force for Germany’s trade flows,labour-market conditions in Germanycan accelerate or slow down globalization.
34

References
Acemoglu, Daron, “Technical Change, Inequality, and the Labor Market,”Journal of Economic Literature,March 2002,40 (1), 772.
and Jorn-Steffen Pischke, “Why Do Firms Train? Theory and Evidence,”Quarterly Journal of Eco-nomics, February 1998,113(1), 79–119.
Aleksynska, Mariya and Martin Schindler , “Labor Market Regulations in Low-, Middle- and High-Income Countries: A New Panel Database,”IMF Working Paper, July 2011,154.
Autor, David H., Frank Levy, and Richard J. Murnane , “The Skill Content of Recent TechnologicalChange: An Empirical Exploration,”Quarterly Journal of Economics, November 2003,118 (4), 1279–1333.
, Lawrence F. Katz, and Melissa S. Kearney, “The Polarization of the U.S. Labor Market,”AmericanEconomic Review: Papers and Proceedings, May 2006,96 (2), 189–194.
Baldwin, Richard E. and Frederic Robert-Nicoud, “Offshoring: General Equilibrium Effects on Wages,Production and Trade,”NBER Working Paper, March 2007,12991.
Becker, Sascha O., Karolina Ekholm, and Marc-Andreas Muendler, “Offshoring and the Onshore Com-position of Tasks and Skills,”Journal of International Economics, May 2013,90 (1), 91–106.
Blinder, Alan S., “Offshoring: The Next Industrial Revolution?,”Foreign Affairs, March-April 2006,85(2), 113–28.
, “How Many U.S. Jobs Might Be Offshorable?,”World Economics, April-June 2009,10 (2), 41–78.
and Alan B. Krueger, “Alternative Measures of Offshorability: A Survey Approach,”Journal of LaborEconomics, April 2013,31 (2), S97–128.
Boeri, Tito and Mario Macis , “Do Unemployment Benefits Promote or Hinder Job Reallocation?,”Journalof Development Economics, September 2010,93 (1), 109–25.
Botero, Juan C., Simeon Djankov, Rafael La Porta, Florencio Lopez de Silanes, and Andrei Shleifer,“The Regulation of Labor,”Quarterly Journal of Economics, November 2004,119(4), 1339–82.
Cameron, A. Colin, Jonah B. Gelbach, and Douglas L. Miller, “Robust Inference with Multi-way Clus-tering,” Journal of Business and Economic Statistics, April 2011,29 (2), 238–249.
DiNardo, John E. and Jorn-Steffen Pischke, “The Returns to Computer Use Revisited: Have PencilsChanged the Wage Structure Too?,”Quarterly Journal of Economics, February 1997,112(1), 291–303.
Feenstra, Robert C. and Gordon H. Hanson, “The Impact of Outsourcing and High-Technology Capitalon Wages: Estimates for the United States, 1979-1990,”Quarterly Journal of Economics, August 1999,114(3), 907–40.
, Robert E. Lipsey, Haiyan Deng, Alyson C. Ma, and Hengyong Mo, “World Trade Flows: 1962-2000,”NBER Working Paper, January 2005,11040.
35

Gathmann, Christina and Uta Schonberg, “How General Is Human Capital? A Task-Based Approach,”Journal of Labor Economics, January 2010,28 (1), 1–49.
Goos, Maarten, Alan Manning, and Anna Salomons, “Job Polarization in Europe,”American EconomicReview, May 2009,99 (2), 58–63.
Grossman, Gene M. and Esteban Rossi-Hansberg, “Trading Tasks: A Simple Theory of Offshoring,”American Economic Review, December 2008,98 (5), 1978–97.
Jensen, J. Bradford and Lori G. Kletzer, “Tradable Services: Understanding the Scope and Impact ofServices Offshoring,” in Lael Brainard and Susan M. Collins, eds.,Offshoring white-collar work, Vol.2005 ofBrookings Trade Forum, Washington, D.C.: Brookings Institution, 2006, chapter 3, pp. 75–133.
and , “Measuring Tradable Services and the Task Content of OffshorableServices Jobs,” inKatharine G. Abraham, James R. Spletzer, and Michael J. Harper, eds.,Labor in the New Economy,number 71. In ‘Studies in Income and Wealth.’, Chicago and London: University of Chicago Press, 2010,chapter 8, pp. 309–35.
Jones, Ronald W. and Henryk Kierzkowski, “The Role of Services in Production and International Trade:A Theoretical Framework,” in Ronald W. Jones and Anne O. Krueger, eds., The political economy ofinternational trade: Essays in honor of Robert E. Baldwin, Oxford and Cambridge, Mass.: Blackwell,1990, chapter 3, pp. 31–48.
Kohler, Wilhelm , “Offshoring: Why Do Stories Differ?,” in Gabriele Tondl, ed.,The EU and EmergingMarkets, number 12. In ‘European Community Studies Association of Austria Publication Series.’, Vi-enna and New York: Springer, 2009, chapter 2, pp. 17–49.
Lazear, Edward P. and Kathryn L. Shaw, “Personnel Economics: The Economist’s View of HumanResources,”Journal of Economic Perspectives, Fall 2007,21 (4), 91–114.
Leamer, Edward E. and Michael Storper, “The Economic Geography of the Internet Age,”Journal ofInternational Business Studies, 4th Quarter 2001,32 (4), 641–65.
Levy, Frank and Richard J. Murnane , The New Division of Labor, Princeton: Princeton University Press,2004.
Markusen, James R., “Modeling the Offshoring of White-Collar Services: From Comparative Advantageto the New Theories of Trade and Foreign Direct Investment,” in Lael Brainard and Susan M. Collins,eds.,Offshoring white-collar work, Vol. 2005 ofBrookings Trade Forum, Washington, D.C.: BrookingsInstitution, 2006, chapter 1, pp. 1–34.
Mazzolari, Francesca and Giuseppe Ragusa, “Spillovers from High-Skill Consumption to Low-Skill La-bor Markets,”Review of Economics and Statistics, March 2013,95 (1), 74–86.
Ottaviano, Gianmarco I. P., Giovanni Peri, and Greg C. Wright, “Immigration, Offshoring, and Ameri-can Jobs,”American Economic Review, August 2013,103(5), 1925–59.
Spitz-Oener, Alexandra, “Technical Change, Job Tasks, and Rising Educational Demands: Looking Out-side the Wage Structure,”Journal of Labor Economics, April 2006,24 (2), 235–70.
36

OnlineAppendix to
Trade and Tasks:An Exploration over Three Decades in GermanySascha O. Becker,U Warwick, CEPR and CESifoMarc-Andreas Muendler,UC San Diego, NBER and CESifo
A BIBB Survey
We use the German Qualification and Career Survey (Qualifikation und Berufsverlauf) to inferthe time varying workplace characteristics and to obtain detailed worker characteristics. Sinceits inception, the survey was conducted in varying collabourations between federal govermentagencies and has meanwhile been renamed to German work survey (Erwerbstatigenbefragung).The survey has been conducted in five waves—in 1979, 1985-86,1991-92, 1998-99 and 2005-06—by the German Federal Institute for Vocational Education and Training (Bundesinstitut furBerufsbildung BIBB) and collabourating agencies.14 In each wave, the random worker samplerepresents around one tenth of a percent of the German labourforce. We refer to this data sourceas the BIBB work survey, or just BIBB survey for short.
The BIBB survey reports workplace information in multiple ways. First, the BIBB surveyasks workers to state whether or not they perform activitiesfrom a given list. These reportedactivities have been used in earlier research by Spitz-Oener (2006), for instance. Second, the BIBBsurvey asks workers whether they use tools from a given list to carry out their work, and aboutthe main tool used. Reported tool use has been extracted for research by, for instance, DiNardoand Pischke (1997, pencil and computer use) and Becker et al. (2013, in a globalization context)before. Given varying collabourations between agencies and shifting interests over time, surveyedactivities (and tool uses) differ across waves and we carefully create longitudinally consistent timeseries. Third, the BIBB survey asks about job performance requirements and skill requirements.To our knowledge, those are largely unexplored workplace characteristics from the BIBB surveyand we build variables based on job performance requirements.
In this paper, we restrict our attention to longitudinally consistent definitions of activity content,which we prepare for all five waves in a time consistent way, and job performance requirements,which we prepare for the first time.
A.1 Longitudinally consistent Activity definitions
BIBB reports a worker’s workplace activity (Tatigkeit) on the job in addition to common occu-pation codes. Table A.1 presents our longitudinally consistent definition of activities. The BIBB
14Collaborating agencies include the Institute for Employment Research (Institut fur Arbeitsmarkt- und Berufsfor-schung) at the Federal Employment Agency (Bundesagentur fur Arbeit) in Nuremberg from 1979 through 1999 andthe Federal Institute for Occupational Safety and Health (Bundesanstalt fur Arbeitsschutz und Arbeitsmedizin BAuA)in Dortmund in 2005-06.
37

Table A.1: LONGITUDINALLY CONSISTENTACTIVITY DEFINITIONS
Activity 1979 1985-86 1991-92 1998-99 2005-061. Manufacture, Produce Goods2. Repair, Maintain3. Entertain, Accommodate, Prepare Foods4. Transport, Store, Dispatch5. Measure, Inspect, Control Quality entries6. Gather Information, Develop, Research, Construct available7. Purchase, Procure, Sell upon request8. Program a Computer9. Apply Legal Knowledge10. Consult and Inform11. Train, Teach, Instruct, Educate12. Nurse, Look After, Cure13. Advertise, Promote, Conduct Marketing and PR14. Organize, Plan, Prepare (others’ work)15. Oversee, Control Machinery and Techn. Processes
Notes: Variable names as in BIBB surveys. Entries show values thata variable needs to take so that it is marked as being performed.
38

survey recognizes 51 distinct activities in the 1979 wave, but only 18 in 1985-86 and 1991-92,and 16 in 1998-99 and 2005-06. Not only the number of activities but also the activity definitionschange over time. We define 15 longitudinally consistent activities, as shown in Table A.1. Thecolumns report the variables in the BIBB data that characterize an activity and the values a variableneeds to take so that our longitudinal concordance marks an activity as performed by a worker.
In some waves (1979, 1991-92), the worker is asked the binaryquestion whether he or sheperforms an activity on the job. In other waves (1985-86, 1998-99 and 2005-06), the workeris asked to classify into three categories whether he or she performs a given activity frequently,infrequently or not at all. For longitudinal consistency, we reduce the three-category classificationin the latter waves into a time-invariant binary classification as to whether an activity is performedat all or not. Our longitudinally consistent activity definitions ensure that there are no missingactivities in any survey wave.
In defining our 15 longitudinally consistent activities, asshown in Table A.1, we made thefollowing adjustments to the mapping for three waves. Without these adjustments, our 15 lon-gitudinally consistent activities would have to be aggregated into 11 categories. To improve onmappings for the three slightly cruder waves of the BIBB survey, we use the following informa-tion from earlier waves that permits a strict many-to-one mapping: we apply the observed activityshares in earlier more detailed waves by single-digitK ldB-88 occupation (Subsection A.3), gender,and industry (Subsection A.4) to randomly impute by worker the most likely detailed activity fora small set of activities in the waves 1985-86, 1991-92 and 1998-99.
Concretely, in wave 1985-86 a strict mapping of v28 (apply and interpret laws and regulations,certify) to 9 only and v29 (educate, instruct, train, guide vocationally) to 11 only would result in acompletely missing activity 10 for the wave; and a strict mapping of v23 (buy, sell, intermediate,attend customers, negotiate, promote) to 7 only would result in missing activity 13. Instead ofaggregating activities 9, 10 and 11 into a single activity and activities 7 and 13 into another singleactivity, we use the 1979 wave that permits a strict many-to-one mapping and apply the share ofactivity 10 in 9 and 10 for v28 and the share of 10 in 10 and 11 forv29 to map to 10, and the 1979share of activity 13 in 7 and 13 to map v23 to 13. Similarly, in wave 1991-92, a strict mappingof v59 (apply and interpret laws and regulations, certify) to 9 only and v60 (educate, instruct,train, guide vocationally) to 11 only would result in a completely missing activity 10 for the wave;and a strict mapping of v54 (buy, sell, intermediate, attend customers, promote) to 7 only wouldresult in missing activity 13. Instead of aggregating activities 9, 10 and 11 into a single activityand activities 7 and 13 into another single activity, we use the 1979 wave that permits a strictmany-to-one mapping and apply the share of activity 10 in 9 and 10 for v59 and the share of 10 in10 and 11 for v60 to map to 10, and the 1979 share of activity 13 in 7 and 13 to map v54 to 13.Finally, in wave 1998-99, a strict mapping of v201 (support, serve, take care of persons) to 12 onlywould result in a completely missing activity 3 for the wave.Instead of aggregating activities 3 and12 into a single activity, we use the 1991-92 wave that offersthe most recent strict many-to-onemapping and apply the share of activity 3 in 3 and 12 to map v201to 3.
We only retain activities that match up in every single wave.As a consequence, some activitiesthat are reported in richer waves cannot be related to any of our 15 longitudinally consistent ac-tivities. In the 1979 wave, numerous activities and groups of activities remain unmatched:Collect
39

and dispose of garbage(v200),Construct and improve buildings and equipment, install, assemble(v149-v153),Keep stock and inventory accounts(v178),Negotiate and represent interests(v213),Pack, load, dispatch, deliver(v160, v162, v164),Cultivate and harvest plants, breed and farmanimals(v130-v135),Publish, entertain, perform, create artistically(v209-211),Clean, iron andpress, dry-clean(v158-v159),Mine, quarry, convey and produce primary products(v136-v137),Type, handle correspondence and forms(v188-v192),Protect, safeguard and regulate (buildings,traffic, work safety)(v198-v199),Arrange and sort, file, mark, archive(v161, v163, v182),Make,bake, distill, prepare(v142). In the 1985-86 wave, the following six activities remain unmatched:Cultivate, breed, farm; mine, quarry, convey(v15), Construct, improve, install, assemble(v17),Iron and press, dry-clean; collect and dispose of garbage(v19),Handle correspondence and forms(v24), Safeguard and regulate (buildings, work safety), protect(v27), Publish, entertain, perform(v31). In the 1991-92 wave, the following ten activities remain unmatched:Cultivate and harvestplants, breed and farm animals(v43),Mine, quarry, convey and produce primary products(v44),Construct and improve buildings and equipment, install, assemble(v46), Clean, iron and press,dry-clean(v48), Pack, load, dispatch, deliver(v50), Arrange and sort, file, mark, archive(v51),Type, handle correspondence and forms(v55), Protect, safeguard and regulate (buildings, traffic,work safety)(v58), Collect and dispose of garbage(v49), Publish, entertain, perform, create ar-tistically (v62). In the 1998-99 wave, the following single activity remains unmatched:Conductnegotiations(v198). In the 2005-06 wave, the following three activitiesremain unmatched:Clean,dispose of garbage, recycle(F319A), Secure, protect, safeguard, monitor, regulate traffic(F317),Work with computers(F318).
A.2 Longitudinally consistent Job Performance Requirement definitions
BIBB asks the worker to report the intensity of requirements toperform a job (Arbeitsanforde-rungen). Table A.2 presents our longitudinally consistent definition of these job performance re-quirements. The columns report the variables in the BIBB data that characterize a performancerequirement and the values a variable needs to take so that our longitudinal concordance marks aperformance requirement as applicable to a worker at given intensity.
The BIBB survey recognizes 17 such performance requirements in the 1979 wave, 13 in 1985-86, 9 in 1991-92, and 14 each in 1998-99 and 2005-06. Out of those variables, we create ninelongitudinally consistent job performance requirement definitions so that, for none of the perfor-mance requirements, information is missing for more than one survey year.
In the first four waves from 1979 through 1999, the surveyed worker ranks the frequencywith which these performance requirements are applicable on a scale from 1 through 5 (5 “al-most never”, 4 “seldom”, 3 “occasionally”, 2 “frequently”,1 “almost always”). In the final wave2005-06, the worker is given a scale from 1 through 4 (4 “never”, 3 “seldom”, 2 “occasionally”,1 “frequently”). We map these intensity measures into a new scale of 1 through 4 (1 “never oralmost never”, 2 “seldom”, 3 “occasionally”, 4 “frequentlyor almost always”), inverting the rankordering to be increasing with the frequency of the requirement and mapping the two most fre-quent categories of the four early waves (“frequently” and “almost always”) into a single category(“frequently or almost always”).
40

Table A.2: LONGITUDINALLY CONSISTENTJOB REQUIREMENT DEFINITIONS BY INTENSITY
Task and Intensity (1-4) 1979 1985-86 1991-92 1998-99 2005-06A. Deadlines/pressure to perform 1A. Deadlines/pressure to perform 2A. Deadlines/pressure to perform 3A. Deadlines/pressure to perform 4B. Improve/adopt new techniques 1 entriesB. Improve/adopt new techniques 2 availableB. Improve/adopt new techniques 3 upon requestB. Improve/adopt new techniques 4C. New situations/activities 1C. New situations/activities 2C. New situations/activities 3C. New situations/activities 4G. Minimum performance/time/quantity given to execute activity 1a
41

D. Repeated work steps 1D. Repeated work steps 2D. Repeated work steps 3D. Repeated work steps 4E. Work procedures prescribed in detail 1E. Work procedures prescribed in detail 2E. Work procedures prescribed in detail 3E. Work procedures prescribed in detail 4F. Financial losses by small mistakes 1a
F. Financial losses by small mistakes 2a entriesF. Financial losses by small mistakes 3a availableF. Financial losses by small mistakes 4a upon requestG. Minimum performance/time/quantity given to execute activity 1a
G. Minimum performance/time/quantity given to execute activity 2a
G. Minimum performance/time/quantity given to execute activity 3a
G. Minimum performance/time/quantity given to execute activity 4a
H. Versatility/multiple activities at same time 1a
H. Versatility/multiple activities at same time 2a
H. Versatility/multiple activities at same time 3a
H. Versatility/multiple activities at same time 4a
I. Concentration on activity 1b
I. Concentration on activity 2b
I. Concentration on activity 3b
I. Concentration on activity 4b
aMissing in 1992.bMissing in 200F.
Notes: Variable names as in BIBB surveys. Intensity ranking: 1 “never or almost never”, 2 “seldom”, 3 “occasionally”, 4 “frequently or almost always”.Entries show values that a variable needs to take so that it ismarked as being performed with a given intensity.
42

Table A.3: LONGITUDINALLY CONSISTENTOCCUPATION DEFINITIONS
Occupation classificationK ldB-88 1979 1985-86 1991-92 1998-99 2005-06
Occupation units, 3-digit level(369) v5(319)
Occupation classes, 4-digit level(2,287) v16 v9 F100 BA(1,329) (1,117) (983)
Individual K ldB-88 occupations, 6-digit level v67(2,982)
Notes: Occupation codes according toK ldB-88 (Klassifizierung der Berufe 1988), maintained by the Federal Employ-ment Agency, Nuremberg. Entries in brackets show the numberof unique reported occupations at a given classificationlevel.
A.3 Longitudinally consistent Occupation definitions
The Federal Employment Agency (Bundesagentur fur Arbeit) in Nuremberg and its research outfitInstitute for Employment Research (Institut fur Arbeitsmarkt- und Berufsforschung) maintain thedetailed Classification of Occupations calledK ldB-88 (Klassifizierung der Berufe 1988) for inter-nal reporting and research. The BIBB data from 1979 through 2006 consistently use theK ldB-88classification in every wave at the 3-digit level so that no longitudinal treatment is needed at thatlevel.
The K ldB-88 classification recognizes 6occupation areas(Berufsbereiche) at the single-digitlevel, 33occupation sections(Berufsabschnitte) at an intermediate level, 88occupation groups(Berufsgruppen) at the 2-digit level, and 369occupation units(Berufsordnungen) at the 3-digitlevel. At the 3-digit occupation-unit level, occupation classifications are available in all BIBBwaves from 1979 through 2006. TheK ldB-88 specifies 2,287occupation classes(Berufsklassen)at the 4-digit level, and all but the one wave 1985/86 adopt atleast the 4-digit occupation-classlevel.15 Table A.3 summarizes the available occupation informationin the public-use version ofthe BIBB data.
For an understanding of occupation frequencies and their evolution, we tabulate the distribu-tion of the sixoccupation areas(Berufsbereiche) at the single-digit level inK ldB-88. Table A.4shows that the importance of technical and services professionals grows over time whereas that ofother occupation areas (most importantly manufacturing workers) declines over time. This pro-vides evidence of a shift of the occupation distribution towards more white-collar occupations.The high frequency of services occupations throughout all periods also documents an importantclassification convention underK ldB-88.
We reclassify occupation information for every wave toK ldB-88occupation unitsat the 3-digitlevel. In wave 1979 there are are 19occupation unitsat the 3-digit level with no matching infor-mation in theK ldB-88 classification (affecting 195 out of 29,737 observations); in wave 1985/86
15There are numerous individual occupations at the 7-digit level recognized by the Federal Employment Agency, butnot used in BIBB. The public-use version of the 1979 BIBB waverecords 2,982K ldB-88 occupations at the six-digitlevel.
43

Table A.4: OCCUPATION AREAS
1979 1986 1992 1999 2006(1) (2) (3) (4) (5)
1 Farmers, Fishermen .028 .033 .027 .021 .0182 Miners, Quarriers .004 .003 .003 .002 .00083 Manufacturing Occupations .294 .296 .295 .241 .1894 Technical Occupations .069 .062 .075 .067 .0795 Services Occupations .564 .600 .592 .659 .7096 Other Workers .005 .002 .007 .009 .005missing .036 .005 .00003 0 .0003
Source: BIBB 1979-2006.Notes: 144,718 worker observations.Occupation areasaccording toK ldB-88 (Berufsbereiche der Klassifizierung derBerufe 1988).
there is oneoccupation unitat the 3-digit level with no matching information inK ldB-88 (af-fecting 160 out of 26,361 observations); in wave 1991/92 there are fouroccupation unitsat the3-digit level with no matching information inK ldB-88 (affecting four out 34,277 observations).Given the small fraction of affected observations, we keep those unmatched occupation units aslongitudinally undetermined, special occupations.
Conversions ofK ldB-88 to other official German occupation classifications are problematic,however. TheK ldB-88 classification in the BIBB data deviates from the official Federal StatisticalOffice’s Classification of Occupations in 1975 and 1992 (called K ldB-75 andK ldB-92). To ourknowledge, there is no converter fromK ldB-88 to eitherK ldB-75 orK ldB-92 and therefore also noofficial converter to the International Standard Classification of OccupationsISCO-68 or ISCO-88(or the intra-European versionISCO-88(COM)). Although the most recentK ldB-88 classificationby the Federal Employment Agency and the most recentK ldB-92 classification by the FederalStatistical Office are both based on a common classification from 1970 (K ldB-70 reflecting theoccupational stricture of the 1950 and 1960s), cross-walksare ambiguous. Conversions betweenK ldB-88 andK ldB-92 are imprecise at any level, as Alfons Geis (GESIS Mannheim) reports.Using the 4,910 dictionary entries that characterize unambiguous occupation terms, 97 percent ofoccupations coincide betweenK ldB-88 andK ldB-92 at the single-digit level and 88 percent at the2-digit level, but only 65 percent at the 3-digit level and merely 38 percent at the 4-digit level.
An attempted conversion ofK ldB-88 to the International Standard Classification of Occupa-tions ISCO-88 suffers frequent ambiguities. In the 2005-06 BIBB survey wave, occupations forall 20,000 surveyed workers are coded both under theK ldB-88 system at the 4-digit level (occu-pation classes) and under theISCO-88 system at the four-digit level.16 This allows us to assessthe conversion quality fromK ldB-88 4-digit leveloccupation classesto ISCO-88 at any level. TheISCO-88 classification recognizes 10major groupsat the single-digit level, 28sub-major groupsat the 2-digit level, 118minor groupsat the 3-digit level, and 390unit groupsat the 4-digit level.
16They are also coded underK ldB-88.
44

Table A.5: IMPLIED CONCORDANCES FROMKLDB-88 TO ISCO-88IN 2005-06 WAVE
DuplicateK ldB-88 ISCO-88occupation classes major groups sub-major groups minor groups unitgroups(4-digit level) (4-digit) (3-digit) (2-digit) (1-digit)
Unique 783 818 828 850Single duplicates 141 119 122 1112 duplicates 41 32 25 193 duplicates 7 5 4 34 duplicates 4 3 35 duplicates 2 2 16 duplicates 2 37 duplicates 1 18+ duplicates 2Total 983 983 983 983
Notes: Occupation codes according toK ldB-88 (Klassifizierung der Berufe 1988), maintained by the Federal Em-ployment Agency, Nuremberg. Attempted mappings from up to 2,287 K ldB-88 occupation classes(4-digit level)to ISCO-88 at all levels (single-digitmajor groups, 2-digit sub-major groups, 3-digit minor groupsand 4-digitunitgroups), using occupation records under both systems in the BIBB Survey wave 2005-06 (20,000 individual workers).Of the 2,287 existingK ldB-88occupation classes, the 20,000 sample workers fill 983 uniqueoccupation classes.
Whereas the officialK ldB-92 used by the German statistical office is widely considered to permita fairly precise mapping from theK ldB 4-digit level to theISCO-88 3-digit level, considerableproblems arise for theK ldB-88 used in the BIBB survey (and at the German Federal EmploymentAgency more generally). Table A.5 reports the ambiguities.There are 2,287occupation classesattheK ldB-88 4-digit level, but the 20,000 workers in the 2005-06 wavefill only 983 of theseoccu-pation classes. Of these 983occupation classes, the implied mapping fromK ldB-88 to ISCO-88major groupsin the 2005-06 wave touches 310occupation classesmore than once so thatK ldB-88cannot be uniquely mapped toISCO-88major groups. While the ambiguities decrease, they do notgo away even for an attempted mapping toISCO-88 unit groupsat the single-digit level. For anattempting conversion to this crudestISCO-88 level, only 850K ldB-88 occupation classessatisfya one-to-many mapping, whereas 133K ldB-88 occupation classescannot be assigned unambigu-ously.
A.4 Longitudinally consistent Sector definitions
We define a set of longitudinally consistent sectors in BIBB. These sectors are also defined in sucha way as to concord trade and other outside data uniquely (in amany-to-one mapping) to a singleset of longitudinally consistent sector definitions.
BIBB classifies an employer’s sector at different levels of aggregation over time. Table A.6presents our longitudinally consistent definition of sectors. In the first four waves 1979, 1985-86,1991-92 and 1998-99, BIBB used a sector classification of its own, loosely related to common Ger-
45

Table A.6: LONGITUDINALLY CONSISTENTSECTORDEFINITIONS
Aggregate Sector 1979 1985-86 1991-92 1998-99 2005-06
1. Agriculture and Livestock Production2. Energy Supply, Water, Gas and Electricity3. Mining4. Manufacture of Chemicals, Rubber and Plastic Products5. Manufacture of Non-metallic Mineral Products6. Iron and Steel Industries, Manufacture of Basic Metal Products7. Manufacture of Fabricated Metal Products8. Manufacture of Machinery and Equipment9. Manufacture and Repair of Road Transport Equipment entries
10. Manufacture and Repair of Aircraft and Ships available
11. Manufacture of Computing and Office Equipment upon request
12. Manufacture of Electrical Equipment and Apparatus13. Manufacture of Mechanical and Optical Equipment, Watches14. Manufacture of Miscellaneous Productsa
15. Manufacture of Wood Products and Furniture16. Manufacture of Paper and Paper Products17. Printing and Reproduction18. Manufacture of Leather and Leather Products, Shoes19. Manufacture of Textiles and Apparel20. Manufacture of Food, Beverages, Tobacco33. Other Private Services 72-73, 29-30, 29-30, 2, 29-30, 37, 70-73,
76-77, 61 61-62 63-64, 90, 92-93,81-86, 90 66-67 95, 98
aIncluding Manufacture of Miscellaneous Metal Products, Music Instruments, Toys, Sports Equipment, Jewellery.
46

6. Iron and Steel Industries, Manufacture of Basic Metal Products 17-20 13 13 13 2721. Construction22. Other Manufacturing, Craft or Trade24. Mail and Telecommunications Services25. Transportation and Logistics26. Banking and Insurance27. Hotels, Restaurants entries
28. Nursing Homes, Hospitals, Health Professionals available
31. Education upon request
32. Offices of Self-employed Professionals33. Other Private Services34. Civil, Economic and Religious Assoc., Political Parties35. Public Sector36. Wholesale Trade38. Retail Trade39. Not elsewhere classified, not applicable or missing
Notes: Sector codes as in BIBB surveys, variables v73 (1979), v8 (1985-86), v20 (1991-92), v134 (1998-99),F513NACE (2005-06).
47

man or European classification systems. With the last wave in2005-06, the BIBB survey adopteda sector classification closely resemblingNACE 1.1 for the European Communities (Nomenclaturegenerale des Activiteseconomiques dans les Communautes EuropeennessRevision 1.1 which isequivalent to the GermanKlassifikation der WirtschaftszweigeWZ 2003 at the 2-digit level).
The BIBB survey recognizes 100 distinct industries in the 1979wave, but only 42 in 1985-86, 43 in 1991-92, 51 in 1998-99 and 65 in 2005-06. Not only thenumber of industries but alsothe industry classifications change over time. We define 39 longitudinally consistent industries(including one code for not elsewhere classified industries, not applicable classifications or missinginformation), as shown in Table A.6.
In defining our 39 longitudinally consistent industries forthe full 1979-2006 period, as shownin Table A.6, we made adjustments to the mapping for certain services sectors so as to accom-modate the 2005-06 wave, which is more aggregate in four specific services sectors. Contraryto the BIBB sector classifications for 1979 through 1999, theNACE 1.1 classification in 2005-06does not break outCommercial Agentsas separate fromWholesale Trade, does not break outRail-way Transportationas separate fromTransportation and Logistics, does not break outLaundryand Dry Cleaningas separate fromOther Private Servicesand does not break outHairdressingand Cosmetician Servicesas separate fromOther Private Services. Since the more detailed BIBB1979-1999 sectors are services sectors with arguably smalltraded components across countries,we choose to fold them into the more aggregateNACE 1.1 classification for our 39 longitudinallyconsistent industries in Table A.6.
There are other time varying industry classifications, however, which require more elabouratetreatment. Without these elabourate adjustments, our longitudinally consistent industries wouldhave to be aggregated into 36 categories, three of which would be unreasonably diverse. To avoidunreasonably diverse industry groupings, we use occupational information at the 2-digit and 3-digit K ldB-88 level (Subsection A.3) to switch select subgroups of workers in specific waves fromthree aggregate industries to more finely defined industries.
Concretely, in wave 1985-86Hotels, restaurants, cafeterias, and nursing homes(55) are joinedin a single category (nursery homes in 55 are for the elderly or sick; nursery schools go in theeducation sector). Moreover, both in wave 1985-86 and in wave 1991-92,Offices of self-employeddoctors, lawyers, accountants and other professionals(57) are joined in a single category. Ifthese choices of aggregation were carried through to all waves in a longitudinally consistent way,a single and highly diverse pseudo-sector “Hotels, Restaurants, Nursing Homes, Hospitals, andOffices of Self-employed Professionals” would have to be formed. Instead, we use occupationalinformation in 1985-86 and 1991-92 to select health professionals withK ldB-88 2-digit codes 84,85 and 86 from sectorsHotels, restaurants, cafeterias, and nursing homes(55 in wave 1985-86)andOffices of self-employed doctors, lawyers, accountants and other professionals(57 in waves1985-86 and 1991-92) and map them to our longitudinally consistent aggregate sector 28 (NursingHomes, Hospitals, Health Professionals).
In wave 2005-06, theNACE sector classification results in reassignments of individual eco-nomic activities to different industries than in the prior BIBB surveys between 1985 and 1999.Whereas BIBB assigns theManufacture of wooden furniture(23 in waves 1985-86, 1991-92 and1998-99, 40 in wave 1979) to the generalManufacture of wood products, NACE lumps furniture
48
of any material to a diverse residual sectorManufacture of furniture; manufacturing n.e.c., whichalso includes theManufacture of miscellaneous metal products, music instruments, toys, sportsequipment, and jewellery. To reduce heterogeneity and to make the 2005-06 data more closelycomparable to earlier waves, we use occupational information in 2005-06 to select furniture mak-ers withK ldB-88 3-digit code 492 (Upholsterers, mattress makers) or K ldB-88 4-digit codes 5011or 5013 (Carpentersmaking mobile or built-in furniture) from the diverse residual sectorMan-ufacture of furniture; manufacturing n.e.c.(36 in 2005-06) and map them to our longitudinallyconsistent aggregate sector 15 (Manufacture of Wood Products and Furniture). Similarly, whereasBIBB assigns theRepair of road transport equipment(16 in waves 1985-86, 1991-92 and 1998-99,30 in wave 1979) to theManufacture and repair of road transport equipment, NACE assigns the re-pair of road transport equipment to the retail sectorSale, maintenance and repair of motor vehiclesand motorcycles, which also includes theretail sale of automotive fuel. For comparability to earlierwaves, we use occupational information in 2005-06 to selectvehicle repair workers withK ldB-883-digit codes 281 (Motor vehicle repairers), 282 (Agricultural machinery repairers) or 936 (Vehi-cle cleaners, servicers) from the retail sectorSale, maintenance and repair of motor vehicles andmotorcycles, retail sale of automotive fuel(50 in 2005-06) and map them to our longitudinallyconsistent aggregate sector 9 (Manufacture and Repair of Road Transport Equipment).
These reassignments for specific occupations help us avert diverse industry groupings. A down-side is, however, that occupations outside the core occupations of an industry—administrative staff,security personnel or cleaners in wooden furniture manufacturing say—will not be reassigned tothe specific industry in the respective years but remain withthe more crudely assigned industry—manufacturing not elsewhere classified in the wooden furniture example.
49
B Trade Data
B.1 WTF Trade Flows
We obtain trade flow data to and from Germany for the years 1979, 1985-86, 1991-92 from theWorld Trade Flows 1962-2000 database by Feenstra et al. (2005) and for the years 1998-99 and2005-06 from their recent revision files (2011). When applicable, we aggregate the individualcountry information from the recent files (for 1998-99 and 2005-06) to the same aggregate countrygroups as defined by (Feenstra et al. 2005) in the early years (1979, 1985-86 and 1991-92). Wetransform the US$ data to Euro and deflate them with the GermanCPI to the base year 1998.
We map theSITC Rev. 2 sector information to a common sector definition acrossall waves ofthe BIBB data. Our consistent sector definition across all datasources is based on an aggregationof NACE 1.1 for the European Communities, which is equivalent to the GermanKlassifikationder WirtschaftszweigeWZ 2003 at the 2-digit level (see Section A.4). To create a concordancefrom SITC Rev. 2 to the 39 longitudinally consistent industries, as shown in Table A.6, we rely onexisting mappings fromSITC Rev. 2 toISIC Rev. 3.1 and fromISIC Rev. 3.1 toWZ 2003. The WTFdata contain aggregates that partly differ from the strictSITC sector definitions using higher-levelaggregates. Whenever WTF aggregates would happen to enter more than one of our longitudinallyconsistent industries we use the mode ofSITC 4-digit line items behind the aggregate to create aunique many-to-one mapping. Our final concordancesitc2aggsec06-completedis available uponrequest.
In the German system of statistical agencies, the German central bankDeutsche Bundesbank(BuBa) collects information on services trade as part of its legal mandate to compute the quar-terly balance of payments. The statistical office at BuBa responsible forDienstleistungsverkehrkindly prepared its historic records for us so that a possibly large group of individual source anddestination countries as well as services subsectors can beidentified. The services trade statisticsspan the years 1979 to 1987, 1988 to 1992, 1993 to 1997, 1998 to2002 and 2003 to 2007 un-der varying statistical conventions that were made time consistent at Deutsche Bundesbank. Ourservices trade data for imports and exports allow us to discern the following eleven countries andregions: the fifteen EU members in 2003, Other Europe, China (mainland), India, Japan, OtherAsia, North America, Central/South America, Oceania/Antarctica, Middle East/North Africa, andSubsaharan Africa. Our time consistent data preparation provides information at the level of thefollowing 19 services subsectors: Travel, Transportation, Merchanting, Insurance services (cif),Financial services (cif), Patents and licenses, Research and development, Engineering and othertechnical services, Computer services, Construction and assembly work or repairs by German en-terprises abroad, Construction and assembly work or repairsby foreign enterprises in Germany,Overhead expenses, Business services, Advertising and trade fair expenses, Communications ser-vices, Film industry, Services of self-employed individuals, Government services, Miscellaneousservices (n.e.c.). Combining the services flow with information from the input-output tables forimports allows to break services imports into intermediateinput uses and final uses, similar to mer-chandize trade. Given the more aggregate country and regional coverage, we do not use servicestrade data for exercises that require country-level evidence in this paper.
50

When it comes to merchandize trade, which we observe at the individual country level, Ger-many’s top-ten import-source and export-destination countries are extremely stable over time andhighly similar between each other. On Germany’s import side, nine out of ten of Germany’stop ten source countries are the same in every single sample year between 1979 and 2006: TheNetherlands, France, Belgium-Luxembourg, the United States, Italy, the United Kingdom, Aus-tria, Switzerland and Japan (in their order of importance in2006). The one new top-ten importercountry for Germany in 2006 is China, replacing Spain from 1999. The top-ten import sourcecountries account for 65.0 percent of Germany’s total imports in 1979 and for 60.2 percent in 2006(the top source country, the Netherlands, alone accounts for 9.4 percent of Germany’s importsin 2006). On Germany’s export side, eight out of ten of Germany’s top ten destinations are thesame in every single sample year between 1979 and 2006: France, the United States, the UnitedKingdom, Italy, Belgium-Luxembourg, the Netherlands, Austria and Switzerland (in their order ofimportance in 2006). Among the few rotating countries are China (the tenth-most important exportdestination in 2006), Japan, Poland, Spain (sine 1999) and Sweden (until 1986). The top-ten ex-port destinations account for 66.4 percent of Germany’s total exports in 1979 and for 61.5 percentin 2006 (top destination France alone accounts for 9.5 percent of Germany’s exports in 2006).
B.2 Imported Intermediate Inputs
To infer the use of imported intermediate inputs by German sector, we collect the import matricesfrom input-output tables in 1978 (there is no input-output table for 1979), 1986, 1992, 1999 and2006 by the German Statistical Officedestatis. We deflate all import values with the German CPIto the base year 1998.
The import matrices in 1992, 1999 and 2006 (Tabelle 1.2 Importmatrix zu cif-Preisenfrom2010) are reported in Euro and based on the GermanKlassifikation der WirtschaftszweigeWZ
2003 at the 2-digit level values, which we map to our 39 longitudinally consistent industries(Appendix A.4). The import matrices in 1978 and 1986 (Tabelle 1.3 Einfuhr von Waren undDienstleistungen zu Ab-Zoll Preisenfrom 2009) are based on sector definitions related toNACE
1.1 and Deutsche Mark values, which we map to our 39 longitudinally consistent industries (Ap-pendix A.4) and Euro. The mapping is incomplete only for our longitudinally consistent sector33Other Private Services, which for 1978 and 1986 includes a fraction of32 Offices of Self-employedProfessionals. We use the fraction of 32 in the sum of 32 and 33 for the years 1992, 1999 and 2006to impute the likely total of32 Offices of Self-employed Professionalsand reduce33 Other PrivateServicesaccordingly in the the early years 1978 and 1986.
Figure B.1 shows a mechanical break-down by country group forthe earlier evidence on im-ports in the right-hand chart of Figure 1, which split Germanimports into intermediate inputsand final goods. The input-output tables on German imports from the German Statistical Officedestatisdo not discern imports by source country, and neither the WTF data on merchandize tradenor the BuBa data on services trade distinguish imports by the use for intermediate inputs or finalconsumption. The sample split of imports into those from high-income regions (the fifteen EUmembers in 2003, Japan, North America and Oceania/Antarctica) and those from the remaininglow-income regions therefore applies only to total import flows to Germany, on which we super-
51

Figure B.1:Composition of German Imports, 1979-2006
From High-income Regions From Low-income Regions
100
200
400
800
Impo
rts
(bill
ion
EU
R in
199
8)
1979 1986 1992 1999 2006Calendar Year
Total Imports Imported Inputs
100
200
400
800
Impo
rts
(bill
ion
EU
R in
199
8)
1979 1986 1992 1999 2006Calendar Year
Total Imports Imported Inputs
Source: WTF 1979-1993 and recent revisions 1994-2006 (Feenstra et al. 2005, update 2011) for merchandize trade,Deutsche Bundesbank for services trade 1979-2006;Destatisimport matrices, releases 2009 (1978 and 1986) and2010 (1992, 1999, 2006).Notes: High-income regions are the 15 EU member countries in 2003,North America, Japan and Oceania. Convertedto Euro, deflated with German CPI (end of year 1998 as base). Log scale on vertical axes.
impose the observed share of intermediate input imports in total imports across all source countries.As a comparison between the left-hand side and right-hand side charts of Figure B.1 documents,the relative proportion of total imports between high-income and low-income countries remainsstable throughout the sample period.
52

Table C.1: OCCUPATION CONCORDANCEISCO-68AND ISCO-88
Occupation ISCO-68 ISCO-881. Legislators, senior officials and managers 2 12. Professionals, technicians and assoc. professionals 0/1 2, 3, 2¬33. Clerical workers 3 44. Service workers and sales workers 4, 5, 4¬5 5, 5,0,5. Agricultural and fishery workers 6 66. Craft workers, production workers, laborers 7/8/9 7, 8, 9, 7¬8, 7¬9, 8,9
Note: Individual and combinedISCO occupation codes as in ILO Labour Statistics Database.
C ILO Labour Statistics
We obtain the shares of occupations by country from the Labour Statistics Database by the Inter-national Labour Organization, Geneva, Table 2C (Total employment by occupation) for 1975-2007(extracted on 25/02/2009). At present, we retain only the information on the total of men andwomen. Between 1975 and 2007, some countries report occupations according toISCO-68 (majorgroup), others according toISCO-88 (major group). We map the reported major groups into asingle concordance with six occupation groups of our own as documented in Table C.1.
We remove the five countries that report incompatible occupational categories based on na-tional classification systems (Brunei Darussalam, Guam, Jamaica, Macau China, Niue); these areminor trade partners of Germany. Some countries report moreaggregate occupation groups thanthe ISCO major groups, but many aggregates coincide with our mapping in Table C.1. Thereare some cases, however, where countries report information in incompatible ways. In particular,managers are not separable from professionals in several reports: Barbados (2001), DominicanRepublic (1991-96), Syrian Arab Republic (2001) and Jamaica (1998-2006). We drop those coun-tries. Cuba (1995-2007) and the United Kingdom (1991-2007) report skilled agricultural workersnot separate from unskilled labourers (and craft and production workers). For the United King-dom is a large trade partner of Germany, we use information onemployment by industry (fromthe Labour Statistics Database by the International LabourOrganization, Geneva, Table 2E (Totalemployment by industry) for 1975-2007; extracted on 25/02/2009) to infer Cuba’s andthe UK’semployment share of agriculture by year and split the aggregate occupation group into its likelymajor-group components. For Cuba, which reports agricultural workers and craft and productionworkers jointly, the share of agricultural jobs in the aggregate occupation group is broken out asthe share of agriculture and fishing vis-a-vis mining, manufacturing, and construction in a givenyear. For the United Kingdom in contrast, which reports agricultural workers and unskilled labour-ers jointly, employment by industry is not available for theyears 1991-1995 and 2006-07 so thatwe choose instead to assign the joint group to agriculture work under the assumption that Britishlabourers are mostly employed in agriculture and that they perform relatively skilled tasks.
The Labour Statistics Database draws on various member-country sources for occupationalinformation. If a country reports information from more than one source in a given year, weretain only information from a single source and disregard lower-ranking sources according to the
53

following hierarchy (first being most relevant for precise occupational records): 1. labour-relatedestablishment census; 2. labour-related establishment survey; 3. labour force survey; 4. populationcensus; 5. household survey; 6. insurance records; 7. official estimates. Similarly, some countriesreport occupations under bothISCO-88 andISCO-68 in a given year. In those cases, we retainISCO-88 information.
D Supporting Tables
The following supporting tables report the point estimatesand their standard errors. We presentthe point estimates in Figure 2 (Tables D.1 and D.2), Figure 3(Tables D.3 and D.4), Figure 4(Tables D.5 and D.6), Figure 5 (Tables D.7 and D.8), Figure 6 (Tables D.9, D.10, D.11 and D.12),Figure 8 (Tables D.13 and D.14, as well as Tables D.15 and D.16), Figure 9 (Tables D.17 and D.18,as well as Tables D.19 and D.20) and Figure 11 (Tables D.21 through D.24).
54

Table D.1: ACTIVITY CONTENT OFGERMAN WORK
Log Employment 1979 1986 1992 1999 2006(1) (2) (3) (4) (5)
2 Repair/Maintain .86 1.25 1.23 1.24 1.19(.02) (.05) (.05) (.03) (.05)
3 Entertain/Accommodate .69 .97 1.03 1.37 1.08(.04) (.08) (.06) (.11) (.10)
4 Transport/Store .84 1.14 1.18 1.30 1.25(.05) (.08) (.05) (.05) (.06)
5 Measure/Inspect .91 1.02 1.04 1.32 1.34(.05) (.09) (.07) (.05) (.06)
6 Analyze/Research .99 1.21 1.27 1.39 1.46(.08) (.09) (.08) (.11) (.09)
7 Purchase/Sell .90 1.23 1.21 1.32 1.26(.09) (.11) (.10) (.08) (.08)
8 Program Computer .62 .97 1.19 .77 .89(.04) (.08) (.09) (.04) (.05)
9 Practice Law .74 .93 .91 1.12 1.42(.10) (.10) (.08) (.10) (.11)
10 Consult/Inform .71 1.18 1.17 1.56 1.50(.08) (.14) (.12) (.10) (.09)
11 Train/Educate .85 1.13 1.09 1.29 1.33(.10) (.12) (.11) (.10) (.10)
12 Nurse/Cure 1.00 1.23 1.41 1.23 1.11(.10) (.13) (.15) (.11) (.10)
13 Advertise/Promote .70 .95 .94 1.24 1.30(.05) (.07) (.07) (.10) (.10)
14 Organize/Plan .88 1.24 1.39 1.45 1.37(.06) (.10) (.11) (.09) (.08)
15 Oversee/Control .77 1.20 1.24 1.16 1.16(.02) (.04) (.05) (.04) (.04)
Observations 168,466R2 (overall) .05Employment in omitted activity 2.77 1.75 1.69 2.26 2.04
Source: BIBB 1979-2006, workers ages 16 through 65.Notes: 168,466 activity-year-gender-age-sector-occupation observations. Controlling for fixed effects of 2 genders, 50age groups, and 5 survey waves; omitted activity1 Manufacture, Produce Goodsin each survey wave. Coefficientsreported as exponential functions of coefficients from single log employmentOLS regression (standard errors computedwith the Delta method) to measure the ratios of workers in an activity relative to activity1 in each survey wave.Clustered standard errors in parentheses (two-way clustered at activity and sector level).
55

Table D.2: ACTIVITY CONTENT OFGERMAN WORK WITHIN SECTOR AND OCCUPATION
Log Employment 1979 1986 1992 1999 2006(1) (2) (3) (4) (5)
2 Repair/Maintain .80 1.20 1.19 1.19 1.16(.03) (.06) (.06) (.02) (.04)
3 Entertain/Accommodate .56 .80 .83 1.15 .93(.06) (.11) (.08) (.07) (.07)
4 Transport/Store .73 1.04 1.04 1.22 1.21(.03) (.05) (.04) (.04) (.05)
5 Measure/Inspect .83 .93 .97 1.31 1.35(.02) (.04) (.04) (.04) (.06)
6 Analyze/Research .90 1.12 1.20 1.34 1.46(.04) (.05) (.06) (.08) (.09)
7 Purchase/Sell .79 1.08 1.08 1.23 1.20(.06) (.07) (.06) (.07) (.06)
8 Program Computer .48 .81 1.08 .70 .80(.03) (.05) (.06) (.03) (.03)
9 Practice Law .53 .73 .75 .96 1.37(.06) (.06) (.05) (.06) (.10)
10 Consult/Inform .53 .94 .97 1.54 1.51(.04) (.08) (.08) (.08) (.09)
11 Train/Educate .64 .91 .91 1.21 1.28(.06) (.08) (.08) (.07) (.08)
12 Nurse/Cure .66 .90 1.03 1.11 .98(.07) (.11) (.13) (.08) (.08)
13 Advertise/Promote .53 .71 .71 1.10 1.21(.03) (.05) (.05) (.08) (.08)
14 Organize/Plan .77 1.12 1.30 1.41 1.35(.02) (.05) (.07) (.07) (.07)
15 Oversee/Control .72 1.17 1.24 1.14 1.14(.03) (.05) (.07) (.03) (.04)
Observations 168,466R2 (overall) .24Employment in omitted activity 2.77 1.75 1.69 2.26 2.04
Source: BIBB 1979-2006, workers ages 16 through 65.Notes: 168,466 activity-year-gender-age-sector-occupation observations. Controlling for fixed effects of 2 genders,50 age groups, 5 survey waves, 6 occupation areas and 35 sectors; omitted activity1 Manufacture, Produce Goodsin each survey wave. Coefficients reported as exponential functions of coefficients from single log employmentOLS
regression (standard errors computed with the Delta method) to measure the ratios of workers in an activity relativeto activity 1 in each survey wave. Clustered standard errors in parentheses (two-way clustered at activity and sectorlevel).
56
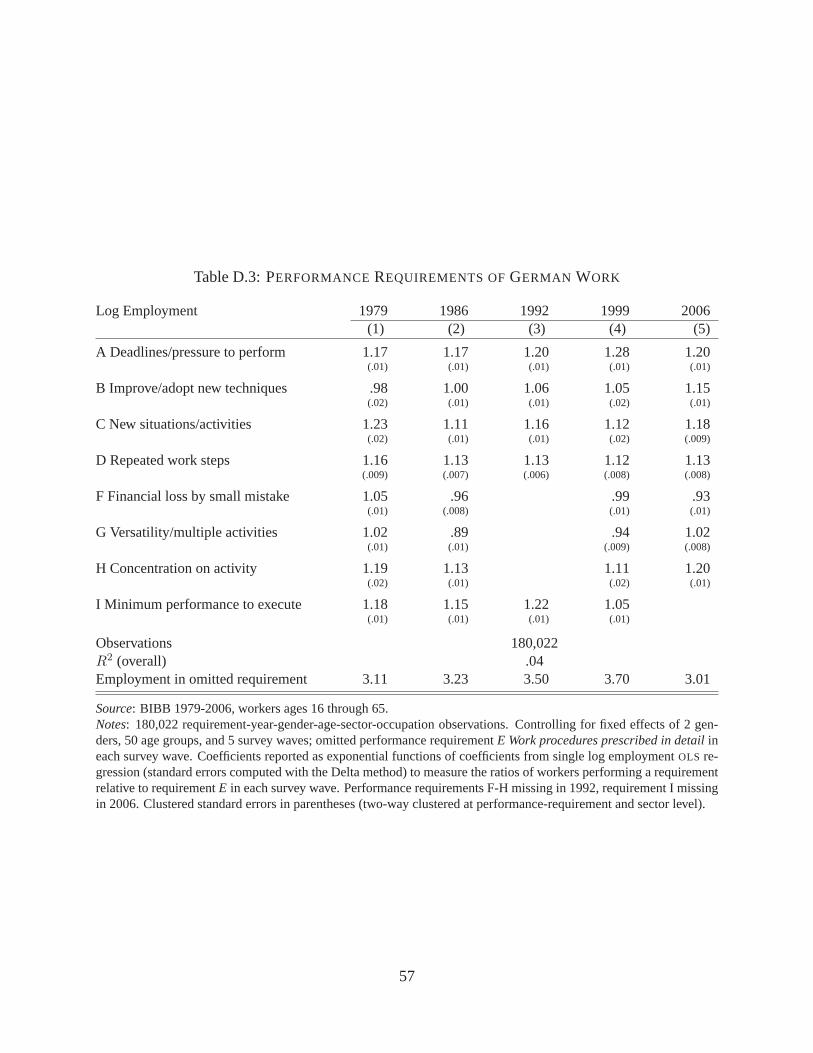
Table D.3: PERFORMANCEREQUIREMENTS OFGERMAN WORK
Log Employment 1979 1986 1992 1999 2006(1) (2) (3) (4) (5)
A Deadlines/pressure to perform 1.17 1.17 1.20 1.28 1.20(.01) (.01) (.01) (.01) (.01)
B Improve/adopt new techniques .98 1.00 1.06 1.05 1.15(.02) (.01) (.01) (.02) (.01)
C New situations/activities 1.23 1.11 1.16 1.12 1.18(.02) (.01) (.01) (.02) (.009)
D Repeated work steps 1.16 1.13 1.13 1.12 1.13(.009) (.007) (.006) (.008) (.008)
F Financial loss by small mistake 1.05 .96 .99 .93(.01) (.008) (.01) (.01)
G Versatility/multiple activities 1.02 .89 .94 1.02(.01) (.01) (.009) (.008)
H Concentration on activity 1.19 1.13 1.11 1.20(.02) (.01) (.02) (.01)
I Minimum performance to execute 1.18 1.15 1.22 1.05(.01) (.01) (.01) (.01)
Observations 180,022R2 (overall) .04Employment in omitted requirement 3.11 3.23 3.50 3.70 3.01
Source: BIBB 1979-2006, workers ages 16 through 65.Notes: 180,022 requirement-year-gender-age-sector-occupation observations. Controlling for fixed effects of 2 gen-ders, 50 age groups, and 5 survey waves; omitted performancerequirementE Work procedures prescribed in detailineach survey wave. Coefficients reported as exponential functions of coefficients from single log employmentOLS re-gression (standard errors computed with the Delta method) to measure the ratios of workers performing a requirementrelative to requirementE in each survey wave. Performance requirements F-H missing in 1992, requirement I missingin 2006. Clustered standard errors in parentheses (two-wayclustered at performance-requirement and sector level).
57

Table D.4: PERFORMANCE REQUIREMENTS OFGERMAN WORK WITHIN SECTOR AND OC-CUPATION
Log Employment 1979 1986 1992 1999 2006(1) (2) (3) (4) (5)
A Deadlines/pressure to perform 1.21 1.21 1.27 1.37 1.27(.02) (.02) (.02) (.03) (.02)
B Improve/adopt new techniques .99 1.02 1.09 1.09 1.20(.02) (.02) (.03) (.04) (.02)
C New situations/activities 1.28 1.14 1.22 1.17 1.24(.03) (.02) (.03) (.03) (.02)
D Repeated work steps 1.19 1.15 1.17 1.16 1.16(.02) (.02) (.01) (.02) (.009)
F Financial loss by small mistake 1.08 .97 1.01 .93(.02) (.02) (.02) (.02)
G Versatility/multiple activities 1.03 .89 .94 1.04(.01) (.02) (.01) (.02)
H Concentration on activity 1.24 1.16 1.16 1.26(.02) (.02) (.03) (.02)
I Minimum performance to execute 1.24 1.20 1.29 1.08(.02) (.02) (.03) (.02)
Observations 180,022R2 (overall) .28Employment in omitted requirement 3.11 3.23 3.50 3.70 3.01
Source: BIBB 1979-2006, workers ages 16 through 65.Notes: 180,022 requirement-year-gender-age-sector-occupation observations. Controlling for fixed effects of 2 gen-ders, 50 age groups, 5 survey waves, 6 occupation areas and 35sectors; omitted performance requirementE Workprocedures prescribed in detailin each survey wave. Coefficients reported as exponential functions of coefficientsfrom single log employmentOLS regression (standard errors computed with the Delta method) to measure the ratiosof workers performing a requirement relative to requirement E in each survey wave. Performance requirements F-H missing in 1992, requirement I missing in 2006. Clustered standard errors in parentheses (two-way clustered atperformance-requirement and sector level).
58
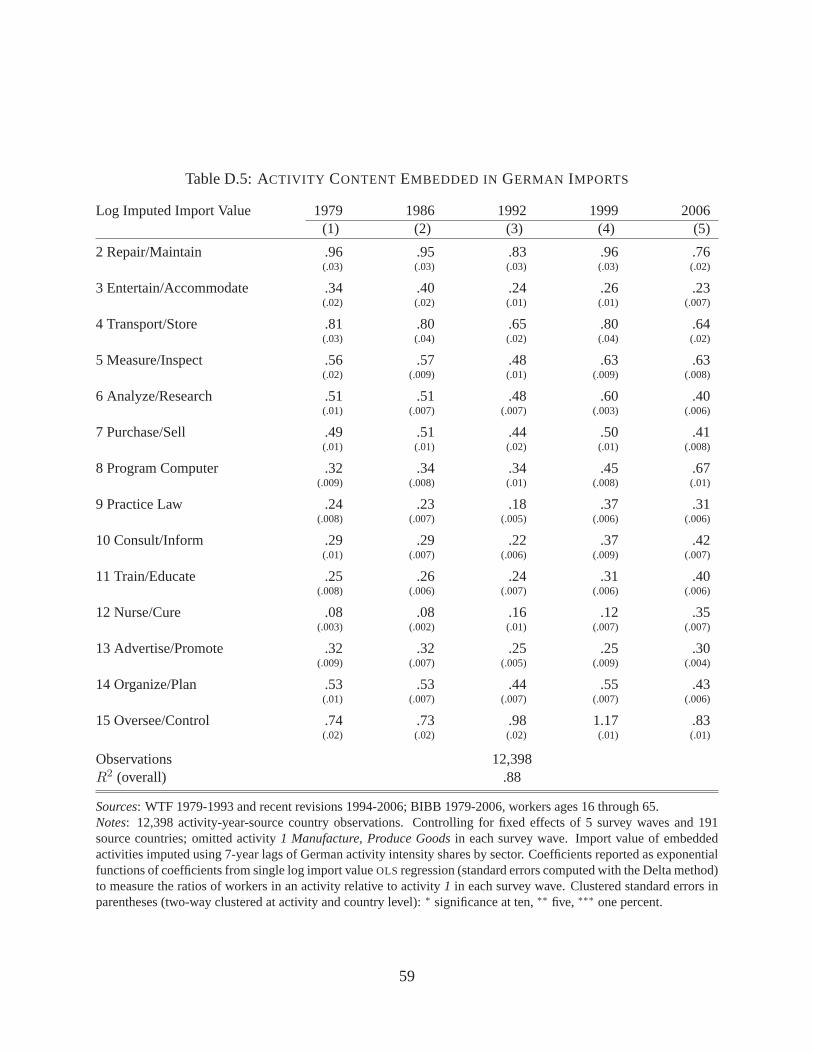
Table D.5: ACTIVITY CONTENT EMBEDDED IN GERMAN IMPORTS
Log Imputed Import Value 1979 1986 1992 1999 2006(1) (2) (3) (4) (5)
2 Repair/Maintain .96 .95 .83 .96 .76(.03) (.03) (.03) (.03) (.02)
3 Entertain/Accommodate .34 .40 .24 .26 .23(.02) (.02) (.01) (.01) (.007)
4 Transport/Store .81 .80 .65 .80 .64(.03) (.04) (.02) (.04) (.02)
5 Measure/Inspect .56 .57 .48 .63 .63(.02) (.009) (.01) (.009) (.008)
6 Analyze/Research .51 .51 .48 .60 .40(.01) (.007) (.007) (.003) (.006)
7 Purchase/Sell .49 .51 .44 .50 .41(.01) (.01) (.02) (.01) (.008)
8 Program Computer .32 .34 .34 .45 .67(.009) (.008) (.01) (.008) (.01)
9 Practice Law .24 .23 .18 .37 .31(.008) (.007) (.005) (.006) (.006)
10 Consult/Inform .29 .29 .22 .37 .42(.01) (.007) (.006) (.009) (.007)
11 Train/Educate .25 .26 .24 .31 .40(.008) (.006) (.007) (.006) (.006)
12 Nurse/Cure .08 .08 .16 .12 .35(.003) (.002) (.01) (.007) (.007)
13 Advertise/Promote .32 .32 .25 .25 .30(.009) (.007) (.005) (.009) (.004)
14 Organize/Plan .53 .53 .44 .55 .43(.01) (.007) (.007) (.007) (.006)
15 Oversee/Control .74 .73 .98 1.17 .83(.02) (.02) (.02) (.01) (.01)
Observations 12,398R2 (overall) .88
Sources: WTF 1979-1993 and recent revisions 1994-2006; BIBB 1979-2006, workers ages 16 through 65.Notes: 12,398 activity-year-source country observations. Controlling for fixed effects of 5 survey waves and 191source countries; omitted activity1 Manufacture, Produce Goodsin each survey wave. Import value of embeddedactivities imputed using 7-year lags of German activity intensity shares by sector. Coefficients reported as exponentialfunctions of coefficients from single log import valueOLS regression (standard errors computed with the Delta method)to measure the ratios of workers in an activity relative to activity 1 in each survey wave. Clustered standard errors inparentheses (two-way clustered at activity and country level): ∗ significance at ten,∗∗ five, ∗∗∗ one percent.
59

Table D.6: PERFORMANCEREQUIREMENTSEMBEDDED IN GERMAN IMPORTS
Log Imputed Import Value 1979 1986 1992 1999 2006(1) (2) (3) (4) (5)
A Deadlines/pressure to perform 1.18 1.19 1.03 .87 .85(.03) (.02) (.03) (.01) (.01)
B Improve/adopt new techniques .98 .99 .90 .86 .85(.03) (.01) (.03) (.008) (.01)
C New situations/activities 1.12 1.11 1.03 1.01 .97(.03) (.01) (.03) (.008) (.01)
D Repeated work steps
F Financial loss by small mistake 1.13 1.14 1.00 1.06(.03) (.01) (1.49e-09) (.01)
G Versatility/multiple activities 1.09 1.09 1.00 1.14(.03) (.01) (5.89e-09) (.01)
H Concentration on activity 1.04 1.05 1.00 .87(.03) (.01) (1.10e-09) (.01)
I Minimum performance to execute 1.04 1.05 .94 .88(.03) (.01) (.03) (.007)
Observations 6,918R2 (overall) .89
Sources: WTF 1979-1993 and recent revisions 1994-2006; BIBB 1979-2006, workers ages 16 through 65.Notes: 6,918 performance requirement-year-source country observations. Controlling for fixed effects of 5 surveywaves and 191 source countries; omitted performance requirementE Work procedures prescribed in detailin eachsurvey wave. Import value of embedded performance requirements imputed using 7-year lags of German performancerequirements shares by sector. Coefficients reported as exponential functions of coefficients from single log importvalueOLS regression (standard errors computed with the Delta method) to measure the ratios of workers performing arequirement relative to requirementE in each survey wave. Performance requirements F-H missing in 1992, require-ment I missing in 2006, requirement D dropped to avert multi-collinearity. Clustered standard errors in parentheses(two-way clustered at performance-requirement and country level): ∗ significance at ten,∗∗ five, ∗∗∗ one percent.
60

Table D.7: ACTIVITY CONTENT EMBEDDED IN GERMAN EXPORTS
Log Imputed Export Value 1979 1986 1992 1999 2006(1) (2) (3) (4) (5)
2 Repair/Maintain .83 1.05 1.20 .78 .70(.01) (.01) (.02) (.007) (.006)
3 Entertain/Accommodate .20 .18 .22 .33 .28(.002) (.002) (.002) (.003) (.002)
4 Transport/Store .49 .56 .71 .62 .55(.006) (.005) (.008) (.004) (.004)
5 Measure/Inspect .66 .88 .94 .70 .64(.01) (.009) (.01) (.005) (.005)
6 Analyze/Research .52 .60 .78 .49 .57(.007) (.004) (.007) (.003) (.004)
7 Purchase/Sell .38 .40 .46 .44 .47(.005) (.004) (.003) (.003) (.003)
8 Program Computer .55 .74 .82 1.11 .89(.009) (.009) (.01) (.01) (.008)
9 Practice Law .19 .27 .41 .37 .42(.002) (.001) (.003) (.002) (.003)
10 Consult/Inform .29 .31 .44 .47 .52(.004) (.003) (.005) (.003) (.004)
11 Train/Educate .23 .29 .34 .49 .54(.002) (.002) (.002) (.003) (.004)
12 Nurse/Cure .06 .07 .08 .32 .25(.0007) (.0008) (.0009) (.003) (.002)
13 Advertise/Promote .41 .43 .49 .37 .38(.005) (.003) (.004) (.003) (.002)
14 Organize/Plan .57 .57 .67 .49 .54(.008) (.004) (.006) (.003) (.004)
15 Oversee/Control .91 1.12 1.37 .87 .77(.02) (.008) (.01) (.007) (.005)
Observations 12,629R2 (overall) .93
Sources: WTF 1979-1993 and recent revisions 1994-2006; BIBB 1979-2006, workers ages 16 through 65.Notes: 12,629 activity-year-destination country observations. Controlling for fixed effects of 5 survey waves and 192destination countries; omitted activity1 Manufacture, Produce Goodsin each survey wave. Export value of embeddedactivities imputed using current German activity intensity shares by sector. Coefficients reported as exponential func-tions of coefficients from single log export valueOLS regression (standard errors computed with the Delta method)to measure the ratios of workers in an activity relative to activity 1 in each survey wave. Clustered standard errors inparentheses (two-way clustered at activity and country level): ∗ significance at ten,∗∗ five, ∗∗∗ one percent.
61
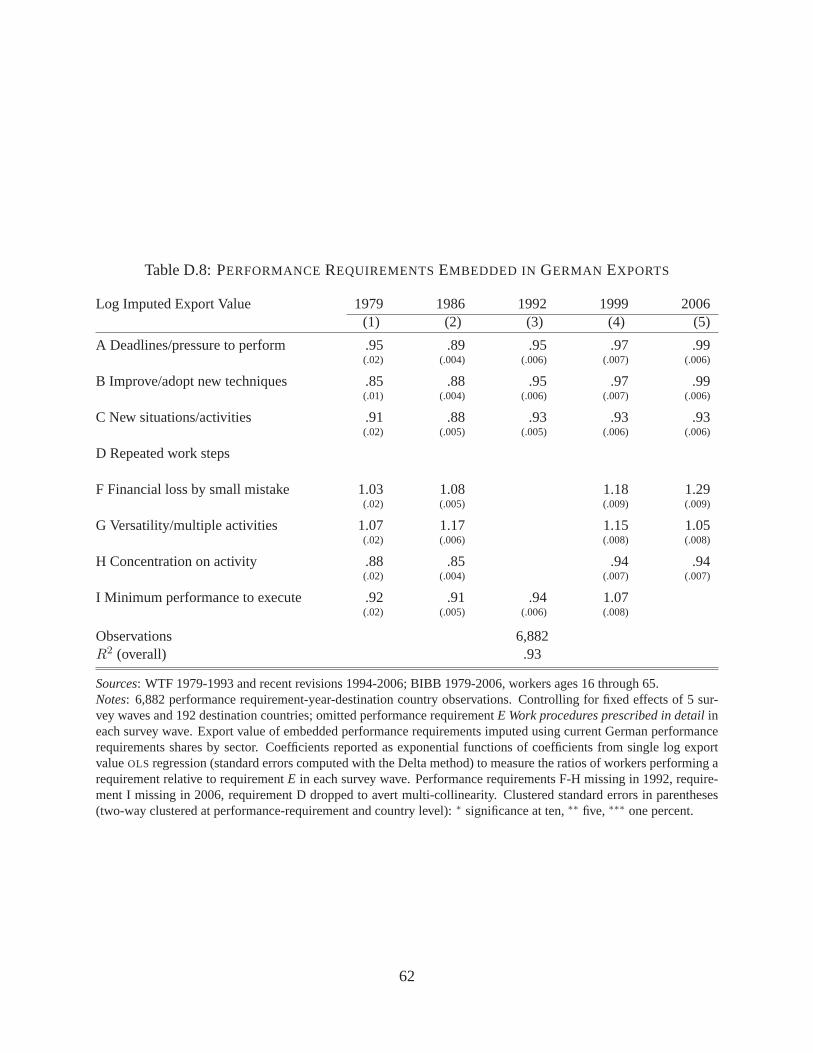
Table D.8: PERFORMANCEREQUIREMENTSEMBEDDED IN GERMAN EXPORTS
Log Imputed Export Value 1979 1986 1992 1999 2006(1) (2) (3) (4) (5)
A Deadlines/pressure to perform .95 .89 .95 .97 .99(.02) (.004) (.006) (.007) (.006)
B Improve/adopt new techniques .85 .88 .95 .97 .99(.01) (.004) (.006) (.007) (.006)
C New situations/activities .91 .88 .93 .93 .93(.02) (.005) (.005) (.006) (.006)
D Repeated work steps
F Financial loss by small mistake 1.03 1.08 1.18 1.29(.02) (.005) (.009) (.009)
G Versatility/multiple activities 1.07 1.17 1.15 1.05(.02) (.006) (.008) (.008)
H Concentration on activity .88 .85 .94 .94(.02) (.004) (.007) (.007)
I Minimum performance to execute .92 .91 .94 1.07(.02) (.005) (.006) (.008)
Observations 6,882R2 (overall) .93
Sources: WTF 1979-1993 and recent revisions 1994-2006; BIBB 1979-2006, workers ages 16 through 65.Notes: 6,882 performance requirement-year-destination country observations. Controlling for fixed effects of 5 sur-vey waves and 192 destination countries; omitted performance requirementE Work procedures prescribed in detailineach survey wave. Export value of embedded performance requirements imputed using current German performancerequirements shares by sector. Coefficients reported as exponential functions of coefficients from single log exportvalueOLS regression (standard errors computed with the Delta method) to measure the ratios of workers performing arequirement relative to requirementE in each survey wave. Performance requirements F-H missing in 1992, require-ment I missing in 2006, requirement D dropped to avert multi-collinearity. Clustered standard errors in parentheses(two-way clustered at performance-requirement and country level): ∗ significance at ten,∗∗ five, ∗∗∗ one percent.
62

Table D.9: EFFECTS OFTRADE ON ACTIVITY CONTENT AT GERMAN WORK
Imported Inputs Product Imports Product Exports(1) (2) (3)
1 Produce 1.00 .91 1.10(.009) (.05) (.06)
2 Repair/Maintain 1.01 .87 1.14(.01) (.04) (.05)
3 Entertain/Accommodate 1.02 1.15 .85(.01) (.10) (.07)
4 Transport/Store 1.02 .90 1.08(.01) (.03) (.04)
5 Measure/Inspect 1.02 .81 1.20(.01) (.03) (.04)
6 Analyze/Research 1.04 .80 1.21(.009) (.05) (.07)
7 Purchase/Sell 1.04 .95 1.00(.02) (.05) (.05)
8 Program Computer 1.02 .81 1.22(.004) (.04) (.06)
9 Practice Law 1.03 .73 1.33(.02) (.06) (.12)
10 Consult/Inform 1.02 .74 1.32(.01) (.06) (.11)
11 Train/Educate 1.01 .81 1.19(.02) (.05) (.07)
12 Nurse/Cure 1.04 .94 1.01(.02) (.05) (.05)
13 Advertise/Promote 1.02 .88 1.10(.01) (.06) (.08)
14 Organize/Plan 1.03 .80 1.20(.01) (.05) (.07)
15 Oversee/Control 1.01 .88 1.13(.01) (.03) (.04)
Observations 164,851R2 (overall) .12
Source: WTF 1979-1993 and recent revisions 1994-2006 for merchandize trade, Deutsche Bundesbank for servicestrade 1979-2006; BIBB 1979-2006, workers ages 16 through 65.Notes: 168,466 activity-year-gender-age-sector-occupation observations. Controlling for fixed effects of 2 genders, 50age groups, and 5 survey waves; omitted activity1 Manufacture, Produce Goodsin each survey wave. Coefficientsreported as exponential functions of coefficients from single log employmentOLS regression (standard errors computedwith the Delta method) to measure the ratios of workers in an activity relative to activity1 in each survey wave.Clustered standard errors in parentheses (two-way clustered at activity and sector level).
63

Table D.10: EFFECTS OFTRADE ON ACTIVITY CONTENT AT GERMAN WORK WITHIN SEC-TOR AND OCCUPATION
Imported Inputs Product Imports Product Exports(1) (2) (3)
1 Produce .99 1.01 .98(.01) (.13) (.14)
2 Repair/Maintain 1.00 .98 1.00(.01) (.12) (.12)
3 Entertain/Accommodate 1.02 1.31 .72(.01) (.13) (.07)
4 Transport/Store 1.02 1.01 .94(.01) (.11) (.09)
5 Measure/Inspect 1.02 .91 1.04(.01) (.08) (.09)
6 Analyze/Research 1.03 .88 1.06(.01) (.08) (.07)
7 Purchase/Sell 1.04 1.07 .87(.02) (.10) (.08)
8 Program Computer 1.01 .91 1.05(.01) (.07) (.07)
9 Practice Law 1.02 .82 1.15(.01) (.09) (.10)
10 Consult/Inform 1.02 .82 1.15(.01) (.08) (.09)
11 Train/Educate 1.01 .91 1.03(.01) (.08) (.07)
12 Nurse/Cure 1.03 1.06 .87(.02) (.09) (.07)
13 Advertise/Promote 1.02 .98 .95(.02) (.09) (.08)
14 Organize/Plan 1.03 .90 1.05(.01) (.08) (.07)
15 Oversee/Control 1.01 .99 .98(.01) (.12) (.11)
Observations 164,851R2 (overall) .27
Source: WTF 1979-1993 and recent revisions 1994-2006 for merchandize trade, Deutsche Bundesbank for servicestrade 1979-2006; BIBB 1979-2006, workers ages 16 through 65.Notes: 168,466 activity-year-gender-age-sector-occupation observations. Controlling for fixed effects of 2 genders,50 age groups, 5 survey waves, 6 occupation areas and 35 sectors; omitted activity1 Manufacture, Produce Goodsin each survey wave. Coefficients reported as exponential functions of coefficients from single log employmentOLS
regression (standard errors computed with the Delta method) to measure the ratios of workers in an activity relativeto activity 1 in each survey wave. Clustered standard errors in parentheses (two-way clustered at activity and sectorlevel).
64

Table D.11: EFFECTS OFTRADE ON PERFORMANCEREQUIREMENTS ATGERMAN WORK
Imported Inputs Product Imports Product Exports(1) (2) (3)
A Deadlines/pressure to perform 1.03 .79 1.23(.007) (.03) (.05)
B Improve/adopt new techniques 1.03 .81 1.20(.007) (.04) (.05)
C New situations/activities 1.03 .78 1.25(.007) (.03) (.05)
D Repeated worksteps 1.03 .83 1.16(.008) (.04) (.05)
E Work procedures prescribed 1.03 .81 1.20(.008) (.03) (.04)
F Financial loss by small mistake 1.03 .82 1.19(.01) (.03) (.05)
G Versatility/multiple activities 1.02 .84 1.17(.008) (.02) (.03)
H Concentration on activity 1.03 .81 1.20(.008) (.04) (.06)
I Minimum performance to execute 1.03 .80 1.22(.007) (.03) (.05)
Observations 176,040R2 (overall) .10
Source: WTF 1979-1993 and recent revisions 1994-2006 for merchandize trade, Deutsche Bundesbank for servicestrade 1979-2006; BIBB 1979-2006, workers ages 16 through 65.Notes: 180,022 requirement-year-gender-age-sector-occupation observations. Controlling for fixed effects of 2 gen-ders, 50 age groups, and 5 survey waves; omitted performancerequirementE Work procedures prescribed in detailineach survey wave. Coefficients reported as exponential functions of coefficients from single log employmentOLS re-gression (standard errors computed with the Delta method) to measure the ratios of workers performing a requirementrelative to requirementE in each survey wave. Performance requirements F-H missing in 1992, requirement I missingin 2006. Clustered standard errors in parentheses (two-wayclustered at performance-requirement and sector level).
65

Table D.12: EFFECTS OFTRADE ON PERFORMANCE REQUIREMENTS AT GERMAN WORK
WITHIN SECTOR AND OCCUPATION
Imported Inputs Product Imports Product Exports(1) (2) (3)
A Deadlines/pressure to perform 1.02 .94 1.06(.006) (.07) (.07)
B Improve/adopt new techniques 1.02 .96 1.03(.007) (.08) (.08)
C New situations/activities 1.02 .93 1.07(.006) (.07) (.07)
D Repeated worksteps 1.02 .99 1.00(.006) (.08) (.07)
E Work procedures prescribed 1.02 .98 1.02(.006) (.07) (.07)
F Financial loss by small mistake 1.01 .97 1.03(.01) (.08) (.08)
G Versatility/multiple activities 1.01 1.00 1.00(.006) (.08) (.08)
H Concentration on activity 1.02 .95 1.04(.007) (.08) (.07)
I Minimum performance to execute 1.01 .95 1.05(.006) (.07) (.07)
Observations 176,040R2 (overall) .29
Source: WTF 1979-1993 and recent revisions 1994-2006 for merchandize trade, Deutsche Bundesbank for servicestrade 1979-2006; BIBB 1979-2006, workers ages 16 through 65.Notes: 180,022 requirement-year-gender-age-sector-occupation observations. Controlling for fixed effects of 2 gen-ders, 50 age groups, 5 survey waves, 6 occupation areas and 35sectors; omitted performance requirementE Workprocedures prescribed in detailin each survey wave. Coefficients reported as exponential functions of coefficientsfrom single log employmentOLS regression (standard errors computed with the Delta method). Performance re-quirements F-H missing in 1992, requirement I missing in 2006. Clustered standard errors in parentheses (two-wayclustered at performance-requirement and sector level).
66

Table D.13: ACTIVITY CONTENT OF GERMAN WORK WITHIN SECTOR AND OCCUPATION:HIGH UNIONIZATION
Log Employment 1979 1986 1992 1999 2006(1) (2) (3) (4) (5)
2 Repair/Maintain .76 1.23 1.23 1.12 1.11(.03) (.08) (.08) (.02) (.04)
3 Entertain/Accommodate .41 .57 .62 .95 .74(.06) (.08) (.09) (.07) (.03)
4 Transport/Store .67 .97 1.00 1.10 1.13(.05) (.05) (.07) (.03) (.05)
5 Measure/Inspect .75 .90 .95 1.18 1.26(.03) (.06) (.06) (.05) (.06)
6 Analyze/Research .80 1.00 1.12 1.11 1.37(.05) (.05) (.07) (.09) (.09)
7 Purchase/Sell .58 .87 .90 .92 1.02(.03) (.05) (.06) (.04) (.02)
8 Program Computer .45 .83 1.06 .69 .84(.04) (.06) (.08) (.03) (.03)
9 Practice Law .61 .82 .81 .83 1.22(.09) (.08) (.07) (.11) (.10)
10 Consult/Inform .54 .97 .99 1.26 1.38(.05) (.14) (.12) (.09) (.09)
11 Train/Educate .51 .72 .74 1.01 1.19(.03) (.04) (.02) (.08) (.08)
12 Nurse/Cure .46 .59 .59 .88 .80(.04) (.07) (.07) (.07) (.04)
13 Advertise/Promote .45 .60 .63 .85 1.02(.03) (.05) (.06) (.06) (.07)
14 Organize/Plan .68 1.00 1.20 1.16 1.24(.03) (.06) (.09) (.08) (.07)
15 Oversee/Control .68 1.19 1.34 1.11 1.11(.03) (.05) (.08) (.02) (.03)
Observations 76,676R2 (overall) .26
Source: BIBB 1979-2006, workers ages 16 through 65; GSOEP select years with unionization.Notes: 76,676 activity-year-gender-age-sector-occupation observations with high unionization. Controlling for fixedeffects of 2 genders, 50 age groups, 5 survey waves, 6 occupation areas and 35 sectors; omitted activity1 Manufacture,Produce Goodsin each survey wave. Coefficients reported as exponential functions of coefficients from single logemploymentOLS regression (standard errors computed with the Delta method) to measure the ratios of workers inan activity relative to activity1 in each survey wave. Clustered standard errors in parentheses (two-way clustered atactivity and sector level).
67

Table D.14: ACTIVITY CONTENT OF GERMAN WORK WITHIN SECTOR AND OCCUPATION:LOW UNIONIZATION
Log Employment 1979 1986 1992 1999 2006(1) (2) (3) (4) (5)
2 Repair/Maintain .84 1.15 1.13 1.25 1.23(.05) (.11) (.10) (.05) (.08)
3 Entertain/Accommodate .76 .94 .96 1.32 1.06(.13) (.15) (.10) (.12) (.10)
4 Transport/Store .84 1.15 1.09 1.31 1.33(.06) (.11) (.10) (.09) (.10)
5 Measure/Inspect .97 .95 .99 1.45 1.50(.06) (.07) (.07) (.11) (.12)
6 Analyze/Research 1.11 1.30 1.35 1.59 1.64(.08) (.09) (.10) (.17) (.17)
7 Purchase/Sell 1.14 1.33 1.32 1.49 1.40(.15) (.13) (.12) (.11) (.10)
8 Program Computer .56 .81 1.13 .73 .75(.03) (.05) (.08) (.04) (.05)
9 Practice Law .51 .62 .69 1.05 1.58(.03) (.04) (.04) (.08) (.18)
10 Consult/Inform .56 .95 .97 1.86 1.72(.02) (.07) (.08) (.18) (.17)
11 Train/Educate .83 1.07 1.09 1.43 1.40(.14) (.13) (.15) (.14) (.14)
12 Nurse/Cure .91 1.05 1.25 1.30 1.10(.13) (.13) (.17) (.17) (.14)
13 Advertise/Promote .68 .82 .80 1.25 1.41(.04) (.04) (.06) (.12) (.13)
14 Organize/Plan .94 1.30 1.47 1.67 1.52(.05) (.08) (.11) (.16) (.14)
15 Oversee/Control .76 1.13 1.13 1.19 1.19(.05) (.09) (.09) (.08) (.07)
Observations 84,480R2 (overall) .28
Source: BIBB 1979-2006, workers ages 16 through 65; GSOEP select years with unionization.Notes: 84,480 activity-year-gender-age-sector-occupation observations with low unionization. Controlling for fixedeffects of 2 genders, 50 age groups, 5 survey waves, 6 occupation areas and 35 sectors; omitted activity1 Manufacture,Produce Goodsin each survey wave. Coefficients reported as exponential functions of coefficients from single logemploymentOLS regression (standard errors computed with the Delta method) to measure the ratios of workers inan activity relative to activity1 in each survey wave. Clustered standard errors in parentheses (two-way clustered atactivity and sector level).
68

Table D.15: PERFORMANCEREQUIREMENTS OFGERMAN WORK WITHIN SECTOR AND OC-CUPATION: HIGH UNIONIZATION
Log Employment 1979 1986 1992 1999 2006(1) (2) (3) (4) (5)
A Deadlines/pressure to perform 1.19 1.13 1.25 1.31 1.24(.03) (.02) (.04) (.04) (.03)
B Improve/adopt new techniques .91 .93 1.03 1.01 1.16(.03) (.02) (.04) (.04) (.03)
C New situations/activities 1.21 1.08 1.20 1.11 1.23(.04) (.02) (.04) (.04) (.03)
D Repeated work steps 1.15 1.07 1.12 1.11 1.13(.01) (.01) (.02) (.01) (.02)
F Financial loss by small mistake 1.05 .95 1.01 .96(.01) (.02) (.03) (.03)
G Versatility/multiple activities 1.02 .88 .94 1.02(.02) (.03) (.02) (.02)
H Concentration on activity 1.16 1.07 1.10 1.22(.03) (.02) (.03) (.03)
I Minimum performance to execute 1.21 1.13 1.25 1.05(.02) (.02) (.04) (.03)
Observations 89,092R2 (overall) .32
Source: BIBB 1979-2006, workers ages 16 through 65; GSOEP select years with unionization.Notes: 89,092 requirement-year-gender-age-sector-occupation observations with high unionization. Controlling forfixed effects of 2 genders, 50 age groups, 5 survey waves, 6 occupation areas and 35 sectors; omitted performancerequirementE Work procedures prescribed in detailin each survey wave. Coefficients reported as exponential func-tions of coefficients from single log employmentOLS regression (standard errors computed with the Delta method) tomeasure the ratios of workers performing a requirement relative to requirementE in each survey wave. Performancerequirements F-H missing in 1992, requirement I missing in 2006. Clustered standard errors in parentheses (two-wayclustered at performance-requirement and sector level).
69

Table D.16: PERFORMANCEREQUIREMENTS OFGERMAN WORK WITHIN SECTOR AND OC-CUPATION: LOW UNIONIZATION
Log Employment 1979 1986 1992 1999 2006(1) (2) (3) (4) (5)
A Deadlines/pressure to perform 1.30 1.35 1.32 1.42 1.33(.03) (.04) (.04) (.05) (.06)
B Improve/adopt new techniques 1.12 1.11 1.17 1.09 1.26(.04) (.04) (.05) (.05) (.06)
C New situations/activities 1.42 1.24 1.27 1.18 1.29(.06) (.06) (.05) (.05) (.06)
D Repeated work steps 1.30 1.26 1.23 1.18 1.20(.04) (.03) (.02) (.02) (.03)
F Financial loss by small mistake 1.13 .99 .96 .89(.04) (.03) (.03) (.03)
G Versatility/multiple activities 1.07 .89 .91 1.06(.02) (.02) (.02) (.03)
H Concentration on activity 1.39 1.30 1.19 1.33(.05) (.05) (.04) (.06)
I Minimum performance to execute 1.33 1.32 1.35 1.07(.05) (.04) (.05) (.03)
Observations 83,667R2 (overall) .33
Source: BIBB 1979-2006, workers ages 16 through 65; GSOEP select years with unionization.Notes: 83,667 requirement-year-gender-age-sector-occupation observations with low unionization. Controlling forfixed effects of 2 genders, 50 age groups, 5 survey waves, 6 occupation areas and 35 sectors; omitted performancerequirementE Work procedures prescribed in detailin each survey wave. Coefficients reported as exponential func-tions of coefficients from single log employmentOLS regression (standard errors computed with the Delta method) tomeasure the ratios of workers performing a requirement relative to requirementE in each survey wave. Performancerequirements F-H missing in 1992, requirement I missing in 2006. Clustered standard errors in parentheses (two-wayclustered at performance-requirement and sector level).
70

Table D.17: ACTIVITY CONTENT OF GERMAN WORK WITHIN SECTOR AND OCCUPATION:HIGH LABOR MARKET TIGHTNESS
1979 1986 1992 1999 2006(1) (2) (3) (4) (5)
2 Repair/Maintain .75 1.19 1.17 1.09 1.06(.02) (.12) (.10) (.03) (.03)
3 Entertain/Accommodate .50 .64 .69 .95 .79(.04) (.05) (.05) (.07) (.05)
4 Transport/Store .68 .99 1.00 1.08 1.06(.05) (.07) (.08) (.05) (.02)
5 Measure/Inspect .73 .77 .84 1.14 1.16(.03) (.05) (.06) (.04) (.03)
6 Analyze/Research .80 1.01 1.11 1.04 1.21(.04) (.08) (.10) (.07) (.05)
7 Purchase/Sell .69 .96 1.00 1.01 1.03(.06) (.08) (.05) (.07) (.03)
8 Program Computer .53 .81 1.01 .70 .78(.04) (.06) (.08) (.04) (.03)
9 Practice Law .46 .67 .72 .74 1.08(.03) (.06) (.04) (.03) (.04)
10 Consult/Inform .45 .76 .80 1.21 1.24(.03) (.05) (.04) (.07) (.05)
11 Train/Educate .47 .66 .72 .96 1.04(.03) (.04) (.02) (.04) (.04)
12 Nurse/Cure .52 .71 .70 .80 .76(.05) (.05) (.05) (.04) (.04)
13 Advertise/Promote .52 .67 .68 .86 .95(.04) (.03) (.02) (.07) (.04)
14 Organize/Plan .69 .93 1.10 1.12 1.11(.03) (.06) (.09) (.08) (.03)
15 Oversee/Control .66 1.12 1.23 1.05 1.05(.02) (.08) (.08) (.03) (.03)
Observations 68,941R2 (overall) .24
Source: BIBB 1979-2006, workers ages 16 through 65; IAB select years with labor market tightness.Notes: 68,941 activity-year-gender-age-sector-occupation observations with high unionization. Controlling for fixedeffects of 2 genders, 50 age groups, 5 survey waves, 6 occupation areas and 34 sectors; omitted activity1 Manufacture,Produce Goodsin each survey wave. Coefficients reported as exponential functions of coefficients from single logemploymentOLS regression (standard errors computed with the Delta method) to measure the ratios of workers inan activity relative to activity1 in each survey wave. Clustered standard errors in parentheses (two-way clustered atactivity and sector level).
71

Table D.18: ACTIVITY CONTENT OF GERMAN WORK WITHIN SECTOR AND OCCUPATION:LOW LABOR MARKET TIGHTNESS
1979 1986 1992 1999 2006(1) (2) (3) (4) (5)
2 Repair/Maintain .86 1.24 1.23 1.28 1.26(.04) (.09) (.11) (.04) (.08)
3 Entertain/Accommodate .69 .95 .96 1.30 1.04(.12) (.18) (.12) (.10) (.11)
4 Transport/Store .81 1.14 1.12 1.37 1.36(.05) (.11) (.09) (.06) (.11)
5 Measure/Inspect 1.02 1.11 1.12 1.50 1.54(.05) (.08) (.08) (.08) (.12)
6 Analyze/Research 1.15 1.31 1.36 1.67 1.71(.11) (.10) (.11) (.15) (.17)
7 Purchase/Sell .98 1.31 1.23 1.46 1.36(.14) (.14) (.13) (.10) (.12)
8 Program Computer .51 .90 1.22 .70 .81(.03) (.06) (.10) (.04) (.05)
9 Practice Law .65 .82 .80 1.12 1.63(.10) (.09) (.08) (.10) (.19)
10 Consult/Inform .64 1.15 1.17 1.92 1.77(.07) (.15) (.13) (.16) (.18)
11 Train/Educate .82 1.14 1.08 1.43 1.49(.11) (.14) (.14) (.13) (.15)
12 Nurse/Cure .79 1.03 1.13 1.38 1.09(.10) (.15) (.18) (.13) (.13)
13 Advertise/Promote .58 .78 .75 1.33 1.42(.04) (.07) (.08) (.11) (.14)
14 Organize/Plan .94 1.40 1.58 1.74 1.57(.05) (.10) (.14) (.13) (.14)
15 Oversee/Control .81 1.23 1.26 1.22 1.22(.05) (.08) (.11) (.06) (.07)
Observations 95,910R2 (overall) .31
Source: BIBB 1979-2006, workers ages 16 through 65; IAB select years with labor market tightness.Notes: 95,910 activity-year-gender-age-sector-occupation observations with high unionization. Controlling for fixedeffects of 2 genders, 50 age groups, 5 survey waves, 6 occupation areas and 34 sectors; omitted activity1 Manufacture,Produce Goodsin each survey wave. Coefficients reported as exponential functions of coefficients from single logemploymentOLS regression (standard errors computed with the Delta method) to measure the ratios of workers inan activity relative to activity1 in each survey wave. Clustered standard errors in parentheses (two-way clustered atactivity and sector level).
72

Table D.19: PERFORMANCEREQUIREMENTS OFGERMAN WORK WITHIN SECTOR AND OC-CUPATION: HIGH LABOR MARKET TIGHTNESS
1979 1986 1992 1999 2006(1) (2) (3) (4) (5)
A Deadlines/pressure to perform 1.22 1.17 1.24 1.32 1.23(.03) (.03) (.04) (.04) (.03)
B Improve/adopt new techniques .98 .97 1.06 1.02 1.15(.04) (.03) (.05) (.03) (.03)
C New situations/activities 1.24 1.08 1.18 1.11 1.21(.04) (.03) (.05) (.04) (.03)
D Repeated worksteps 1.18 1.12 1.16 1.14 1.15(.02) (.03) (.02) (.01) (.01)
F Financial loss by small mistake 1.07 .98 1.02 .97(.02) (.02) (.03) (.02)
G Versatility/multiple activities 1.03 .93 .98 1.03(.01) (.01) (.009) (.01)
H Concentration on activity 1.19 1.08 1.09 1.22(.04) (.03) (.03) (.02)
I Minimum performance to execute 1.21 1.14 1.24 1.04(.02) (.02) (.04) (.03)
Observations 80,051R2 (overall) .31
Source: BIBB 1979-2006, workers ages 16 through 65; IAB select years with labor market tightness.Notes: 80,051 requirement-year-gender-age-sector-occupation observations with high labor market tightness. Con-trolling for fixed effects of 2 genders, 50 age groups, 5 survey waves, 6 occupation areas and 34 sectors; omittedperformance requirementE Work procedures prescribed in detailin each survey wave. Coefficients reported as ex-ponential functions of coefficients from single log employment OLS regression (standard errors computed with theDelta method) to measure the ratios of workers performing a requirement relative to requirementE in each surveywave. Performance requirements F-H missing in 1992, requirement I missing in 2006. Clustered standard errors inparentheses (two-way clustered at performance-requirement and sector level).
73

Table D.20: PERFORMANCEREQUIREMENTS OFGERMAN WORK WITHIN SECTOR AND OC-CUPATION:
1979 1986 1992 1999 2006(1) (2) (3) (4) (5)
A Deadlines/pressure to perform 1.24 1.27 1.34 1.47 1.34(.03) (.04) (.03) (.06) (.05)
B Improve/adopt new techniques 1.02 1.07 1.14 1.15 1.26(.04) (.04) (.04) (.07) (.05)
C New situations/activities 1.38 1.21 1.29 1.24 1.30(.06) (.05) (.04) (.06) (.05)
D Repeated worksteps 1.23 1.19 1.20 1.20 1.20(.04) (.03) (.02) (.03) (.02)
F Financial loss by small mistake 1.09 .96 1.00 .89(.03) (.03) (.05) (.04)
G Versatility/multiple activities 1.03 .84 .90 1.05(.02) (.03) (.03) (.03)
H Concentration on activity 1.33 1.25 1.24 1.33(.05) (.04) (.05) (.05)
I Minimum performance to execute 1.32 1.28 1.37 1.10(.04) (.04) (.04) (.04)
Observations 95,989R2 (overall) .38
Source: BIBB 1979-2006, workers ages 16 through 65; IAB select years with labor market tightness.Notes: 95,989 requirement-year-gender-age-sector-occupation observations with low unionization. Controlling forfixed effects of 2 genders, 50 age groups, 5 survey waves, 6 occupation areas and 34 sectors; omitted performancerequirementE Work procedures prescribed in detailin each survey wave. Coefficients reported as exponential func-tions of coefficients from single log employmentOLS regression (standard errors computed with the Delta method) tomeasure the ratios of workers performing a requirement relative to requirementE in each survey wave. Performancerequirements F-H missing in 1992, requirement I missing in 2006. Clustered standard errors in parentheses (two-wayclustered at performance-requirement and sector level).
74
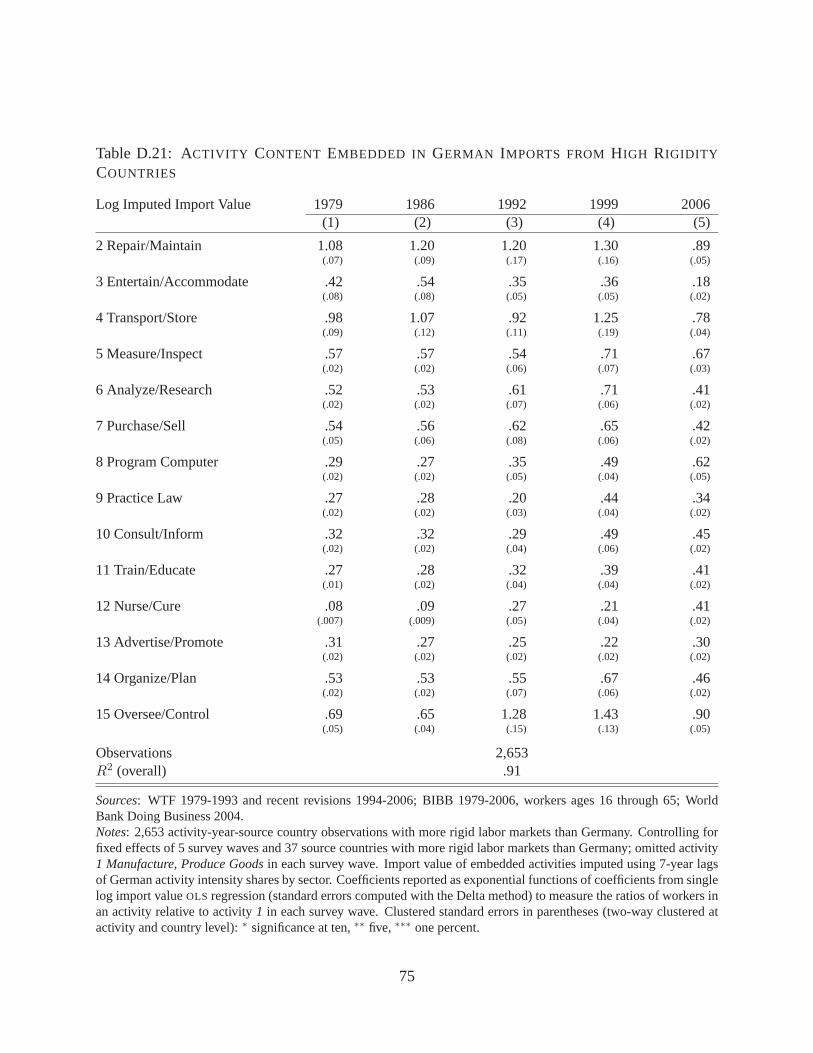
Table D.21: ACTIVITY CONTENT EMBEDDED IN GERMAN IMPORTS FROMHIGH RIGIDITY
COUNTRIES
Log Imputed Import Value 1979 1986 1992 1999 2006(1) (2) (3) (4) (5)
2 Repair/Maintain 1.08 1.20 1.20 1.30 .89(.07) (.09) (.17) (.16) (.05)
3 Entertain/Accommodate .42 .54 .35 .36 .18(.08) (.08) (.05) (.05) (.02)
4 Transport/Store .98 1.07 .92 1.25 .78(.09) (.12) (.11) (.19) (.04)
5 Measure/Inspect .57 .57 .54 .71 .67(.02) (.02) (.06) (.07) (.03)
6 Analyze/Research .52 .53 .61 .71 .41(.02) (.02) (.07) (.06) (.02)
7 Purchase/Sell .54 .56 .62 .65 .42(.05) (.06) (.08) (.06) (.02)
8 Program Computer .29 .27 .35 .49 .62(.02) (.02) (.05) (.04) (.05)
9 Practice Law .27 .28 .20 .44 .34(.02) (.02) (.03) (.04) (.02)
10 Consult/Inform .32 .32 .29 .49 .45(.02) (.02) (.04) (.06) (.02)
11 Train/Educate .27 .28 .32 .39 .41(.01) (.02) (.04) (.04) (.02)
12 Nurse/Cure .08 .09 .27 .21 .41(.007) (.009) (.05) (.04) (.02)
13 Advertise/Promote .31 .27 .25 .22 .30(.02) (.02) (.02) (.02) (.02)
14 Organize/Plan .53 .53 .55 .67 .46(.02) (.02) (.07) (.06) (.02)
15 Oversee/Control .69 .65 1.28 1.43 .90(.05) (.04) (.15) (.13) (.05)
Observations 2,653R2 (overall) .91
Sources: WTF 1979-1993 and recent revisions 1994-2006; BIBB 1979-2006, workers ages 16 through 65; WorldBank Doing Business 2004.Notes: 2,653 activity-year-source country observations with more rigid labor markets than Germany. Controlling forfixed effects of 5 survey waves and 37 source countries with more rigid labor markets than Germany; omitted activity1 Manufacture, Produce Goodsin each survey wave. Import value of embedded activities imputed using 7-year lagsof German activity intensity shares by sector. Coefficientsreported as exponential functions of coefficients from singlelog import valueOLS regression (standard errors computed with the Delta method) to measure the ratios of workers inan activity relative to activity1 in each survey wave. Clustered standard errors in parentheses (two-way clustered atactivity and country level):∗ significance at ten,∗∗ five, ∗∗∗ one percent.
75
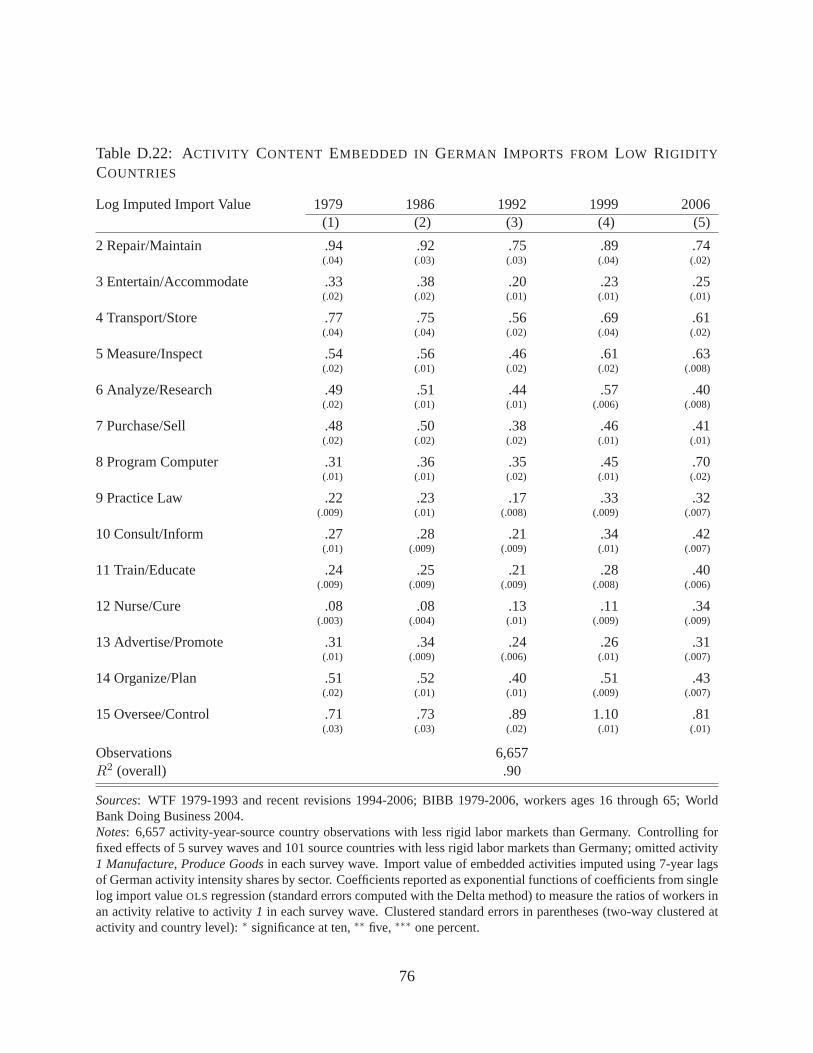
Table D.22: ACTIVITY CONTENT EMBEDDED IN GERMAN IMPORTS FROMLOW RIGIDITY
COUNTRIES
Log Imputed Import Value 1979 1986 1992 1999 2006(1) (2) (3) (4) (5)
2 Repair/Maintain .94 .92 .75 .89 .74(.04) (.03) (.03) (.04) (.02)
3 Entertain/Accommodate .33 .38 .20 .23 .25(.02) (.02) (.01) (.01) (.01)
4 Transport/Store .77 .75 .56 .69 .61(.04) (.04) (.02) (.04) (.02)
5 Measure/Inspect .54 .56 .46 .61 .63(.02) (.01) (.02) (.02) (.008)
6 Analyze/Research .49 .51 .44 .57 .40(.02) (.01) (.01) (.006) (.008)
7 Purchase/Sell .48 .50 .38 .46 .41(.02) (.02) (.02) (.01) (.01)
8 Program Computer .31 .36 .35 .45 .70(.01) (.01) (.02) (.01) (.02)
9 Practice Law .22 .23 .17 .33 .32(.009) (.01) (.008) (.009) (.007)
10 Consult/Inform .27 .28 .21 .34 .42(.01) (.009) (.009) (.01) (.007)
11 Train/Educate .24 .25 .21 .28 .40(.009) (.009) (.009) (.008) (.006)
12 Nurse/Cure .08 .08 .13 .11 .34(.003) (.004) (.01) (.009) (.009)
13 Advertise/Promote .31 .34 .24 .26 .31(.01) (.009) (.006) (.01) (.007)
14 Organize/Plan .51 .52 .40 .51 .43(.02) (.01) (.01) (.009) (.007)
15 Oversee/Control .71 .73 .89 1.10 .81(.03) (.03) (.02) (.01) (.01)
Observations 6,657R2 (overall) .90
Sources: WTF 1979-1993 and recent revisions 1994-2006; BIBB 1979-2006, workers ages 16 through 65; WorldBank Doing Business 2004.Notes: 6,657 activity-year-source country observations with less rigid labor markets than Germany. Controlling forfixed effects of 5 survey waves and 101 source countries with less rigid labor markets than Germany; omitted activity1 Manufacture, Produce Goodsin each survey wave. Import value of embedded activities imputed using 7-year lagsof German activity intensity shares by sector. Coefficientsreported as exponential functions of coefficients from singlelog import valueOLS regression (standard errors computed with the Delta method) to measure the ratios of workers inan activity relative to activity1 in each survey wave. Clustered standard errors in parentheses (two-way clustered atactivity and country level):∗ significance at ten,∗∗ five, ∗∗∗ one percent.
76

Table D.23: PERFORMANCE REQUIREMENTSEMBEDDED IN GERMAN IMPORTS FROMHIGH
RIGIDITY COUNTRIES
Log Imputed Import Value 1979 1986 1992 1999 2006(1) (2) (3) (4) (5)
A Deadlines/pressure to perform 1.33 1.42 1.14 .88 .83(.07) (.07) (.07) (.03) (.03)
B Improve/adopt new techniques 1.07 1.13 .95 .87 .85(.05) (.04) (.04) (.02) (.02)
C New situations/activities 1.19 1.24 1.07 1.05 .98(.05) (.03) (.05) (.02) (.02)
D Repeated work steps
F Financial loss by small mistake 1.21 1.26 1.00 1.05(.05) (.04) (3.60e-09) (.02)
G Versatility/multiple activities 1.11 1.12 1.00 1.15(.04) (.03) (2.39e-09) (.02)
H Concentration on activity 1.15 1.21 1.00 .87(.06) (.05) (1.76e-09) (.01)
I Minimum performance to execute 1.11 1.16 .97 .88(.05) (.03) (.04) (.02)
Observations 1,485R2 (overall) .92
Sources: WTF 1979-1993 and recent revisions 1994-2006; BIBB 1979-2006, workers ages 16 through 65; WorldBank Doing Business 2004.Notes: 1,485 performance requirement-year-source country observations with more rigid labor markets than Germany.Controlling for fixed effects of 5 survey waves and 37 source countries with more rigid labor markets than Germany;omitted performance requirementE Work procedures prescribed in detailin each survey wave. Import value of em-bedded performance requirements imputed using 7-year lagsof German performance requirements shares by sector.Coefficients reported as exponential functions of coefficients from single log import valueOLS regression (standarderrors computed with the Delta method) to measure the ratiosof workers performing a requirement relative to re-quirementE in each survey wave. Performance requirements F-H missing in 1992, requirement I missing in 2006,requirement D dropped to avert multi-collinearity. Clustered standard errors in parentheses (two-way clustered atperformance-requirement and country level):∗ significance at ten,∗∗ five, ∗∗∗ one percent.
77

Table D.24: PERFORMANCE REQUIREMENTS EMBEDDED IN GERMAN IMPORTS FROMLOW
RIGIDITY COUNTRIES
Log Imputed Import Value 1979 1986 1992 1999 2006(1) (2) (3) (4) (5)
A Deadlines/pressure to perform 1.18 1.16 .98 .87 .86(.04) (.02) (.03) (.02) (.01)
B Improve/adopt new techniques .98 .97 .88 .86 .86(.03) (.02) (.03) (.01) (.01)
C New situations/activities 1.11 1.09 1.00 .98 .96(.04) (.02) (.03) (.01) (.01)
D Repeated work steps
F Financial loss by small mistake 1.13 1.12 1.00 1.07(.04) (.02) (4.21e-09) (.02)
G Versatility/multiple activities 1.09 1.08 1.00 1.13(.04) (.01) (3.41e-09) (.02)
H Concentration on activity 1.04 1.02 1.00 .87(.04) (.02) (2.40e-09) (.01)
I Minimum performance to execute 1.04 1.03 .93 .87(.03) (.01) (.02) (.01)
Observations 3,705R2 (overall) .91
Sources: WTF 1979-1993 and recent revisions 1994-2006; BIBB 1979-2006, workers ages 16 through 65; WorldBank Doing Business 2004.Notes: 3,705 performance requirement-year-source country observations with less rigid labor markets than Germany.Controlling for fixed effects of 5 survey waves and 101 sourcecountries with less rigid labor markets than Germany;omitted performance requirementE Work procedures prescribed in detailin each survey wave. Import value of em-bedded performance requirements imputed using 7-year lagsof German performance requirements shares by sector.Coefficients reported as exponential functions of coefficients from single log import valueOLS regression (standarderrors computed with the Delta method) to measure the ratiosof workers performing a requirement relative to re-quirementE in each survey wave. Performance requirements F-H missing in 1992, requirement I missing in 2006,requirement D dropped to avert multi-collinearity. Clustered standard errors in parentheses (two-way clustered atperformance-requirement and country level):∗ significance at ten,∗∗ five, ∗∗∗ one percent.
78

Table D.25: ACTIVITY CONTENT EMBEDDED IN GERMAN IMPORTS FROMCOUNTRIES WITH
HIGH EMPLOYMENT PROTECTION
Log Imputed Import Value 1979 1986 1992 1999 2006(1) (2) (3) (4) (5)
2 Repair/Maintain .85 .89 .82 .98 .78(.04) (.04) (.04) (.04) (.02)
3 Entertain/Accommodate .37 .35 .22 .24 .26(.03) (.03) (.02) (.02) (.01)
4 Transport/Store .70 .71 .59 .79 .65(.05) (.06) (.03) (.06) (.02)
5 Measure/Inspect .52 .54 .49 .66 .65(.01) (.01) (.02) (.02) (.007)
6 Analyze/Research .47 .49 .46 .61 .43(.01) (.01) (.02) (.009) (.008)
7 Purchase/Sell .49 .48 .42 .50 .44(.02) (.03) (.03) (.02) (.01)
8 Program Computer .33 .35 .35 .49 .75(.02) (.02) (.02) (.01) (.03)
9 Practice Law .20 .20 .16 .37 .34(.01) (.01) (.008) (.01) (.008)
10 Consult/Inform .25 .26 .21 .37 .44(.008) (.009) (.009) (.01) (.007)
11 Train/Educate .23 .23 .23 .31 .42(.01) (.01) (.01) (.01) (.008)
12 Nurse/Cure .07 .07 .14 .12 .36(.004) (.004) (.02) (.01) (.01)
13 Advertise/Promote .33 .33 .25 .27 .34(.01) (.01) (.005) (.01) (.009)
14 Organize/Plan .48 .50 .41 .55 .46(.009) (.008) (.01) (.01) (.007)
15 Oversee/Control .68 .70 .93 1.16 .83(.03) (.03) (.03) (.02) (.01)
Observations 4,200R2 (overall) .95
Sources: WTF 1979-1993 and recent revisions 1994-2006; BIBB 1979-2006, workers ages 16 through 65; IMF-fRDBlabor-market regulations 1980-2005.Notes: 4,200 activity-year-source country observations with more rigid labor markets than Germany. Controlling forfixed effects of 5 survey waves and 37 source countries with more rigid labor markets than Germany; omitted activity1 Manufacture, Produce Goodsin each survey wave. Import value of embedded activities imputed using 7-year lagsof German activity intensity shares by sector. Coefficientsreported as exponential functions of coefficients from singlelog import valueOLS regression (standard errors computed with the Delta method) to measure the ratios of workers inan activity relative to activity1 in each survey wave. Clustered standard errors in parentheses (two-way clustered atactivity and country level):∗ significance at ten,∗∗ five, ∗∗∗ one percent.
79

Table D.26: ACTIVITY CONTENT EMBEDDED IN GERMAN IMPORTS FROMCOUNTRIES WITH
LOW EMPLOYMENT PROTECTION
Log Imputed Import Value 1979 1986 1992 1999 2006(1) (2) (3) (4) (5)
2 Repair/Maintain .92 .93 .74 .84 .80(.07) (.06) (.04) (.09) (.04)
3 Entertain/Accommodate .34 .41 .20 .23 .26(.04) (.04) (.01) (.02) (.02)
4 Transport/Store .76 .78 .57 .68 .68(.07) (.07) (.02) (.08) (.05)
5 Measure/Inspect .55 .57 .45 .59 .65(.03) (.03) (.03) (.04) (.02)
6 Analyze/Research .49 .51 .42 .54 .41(.03) (.02) (.01) (.01) (.02)
7 Purchase/Sell .49 .52 .37 .46 .41(.03) (.03) (.02) (.02) (.02)
8 Program Computer .33 .36 .33 .42 .63(.02) (.03) (.03) (.03) (.04)
9 Practice Law .23 .24 .17 .33 .32(.02) (.02) (.01) (.01) (.02)
10 Consult/Inform .29 .30 .20 .33 .43(.02) (.02) (.01) (.02) (.02)
11 Train/Educate .24 .26 .21 .28 .40(.02) (.02) (.01) (.01) (.02)
12 Nurse/Cure .08 .09 .13 .11 .36(.004) (.008) (.01) (.01) (.02)
13 Advertise/Promote .34 .36 .24 .24 .30(.02) (.02) (.01) (.03) (.02)
14 Organize/Plan .53 .54 .39 .49 .44(.03) (.02) (.01) (.02) (.02)
15 Oversee/Control .74 .74 .89 1.07 .85(.05) (.05) (.03) (.03) (.03)
Observations 2,085R2 (overall) .91
Sources: WTF 1979-1993 and recent revisions 1994-2006; BIBB 1979-2006, workers ages 16 through 65; IMF-fRDBlabor-market regulations 1980-2005.Notes: 2,085 activity-year-source country observations with less rigid labor markets than Germany. Controlling forfixed effects of 5 survey waves and 101 source countries with less rigid labor markets than Germany; omitted activity1 Manufacture, Produce Goodsin each survey wave. Import value of embedded activities imputed using 7-year lagsof German activity intensity shares by sector. Coefficientsreported as exponential functions of coefficients from singlelog import valueOLS regression (standard errors computed with the Delta method) to measure the ratios of workers inan activity relative to activity1 in each survey wave. Clustered standard errors in parentheses (two-way clustered atactivity and country level):∗ significance at ten,∗∗ five, ∗∗∗ one percent.
80

Table D.27: PERFORMANCEREQUIREMENTSEMBEDDED IN GERMAN IMPORTS FROMCOUN-TRIES WITH HIGH EMPLOYMENT PROTECTION
Log Imputed Import Value 1979 1986 1992 1999 2006(1) (2) (3) (4) (5)
A Deadlines/pressure to perform 1.15 1.14 1.02 .90 .88(.05) (.04) (.05) (.01) (.02)
B Improve/adopt new techniques .94 .94 .90 .88 .89(.04) (.03) (.04) (.01) (.01)
C New situations/activities 1.09 1.08 1.00 .99 .96(.04) (.02) (.05) (.01) (.01)
D Repeated worksteps
F Financial loss by small mistake 1.10 1.10 1.00 1.08(.04) (.03) (1.39e-09) (.01)
G Versatility/multiple activities 1.08 1.08 1.00 1.12(.02) (.02) (1.73e-09) (.008)
H Concentration on activity 1.00 1.00 1.00 .89(.04) (.03) (5.72e-10) (.01)
I Minimum performance to execute 1.02 1.02 .93 .89(.03) (.02) (.04) (.007)
Observations 2,325R2 (overall) .96
Sources: WTF 1979-1993 and recent revisions 1994-2006; BIBB 1979-2006, workers ages 16 through 65; IMF-fRDBlabor-market regulations 1980-2005.Notes: 2,325 performance requirement-year-source country observations with more rigid labor markets than Germany.Controlling for fixed effects of 5 survey waves and 37 source countries with more rigid labor markets than Germany;omitted performance requirementE Work procedures prescribed in detailin each survey wave. Import value of em-bedded performance requirements imputed using 7-year lagsof German performance requirements shares by sector.Coefficients reported as exponential functions of coefficients from single log import valueOLS regression (standarderrors computed with the Delta method) to measure the ratiosof workers performing a requirement relative to re-quirementE in each survey wave. Performance requirements F-H missing in 1992, requirement I missing in 2006,requirement D dropped to avert multi-collinearity. Clustered standard errors in parentheses (two-way clustered atperformance-requirement and country level):∗ significance at ten,∗∗ five, ∗∗∗ one percent.
81
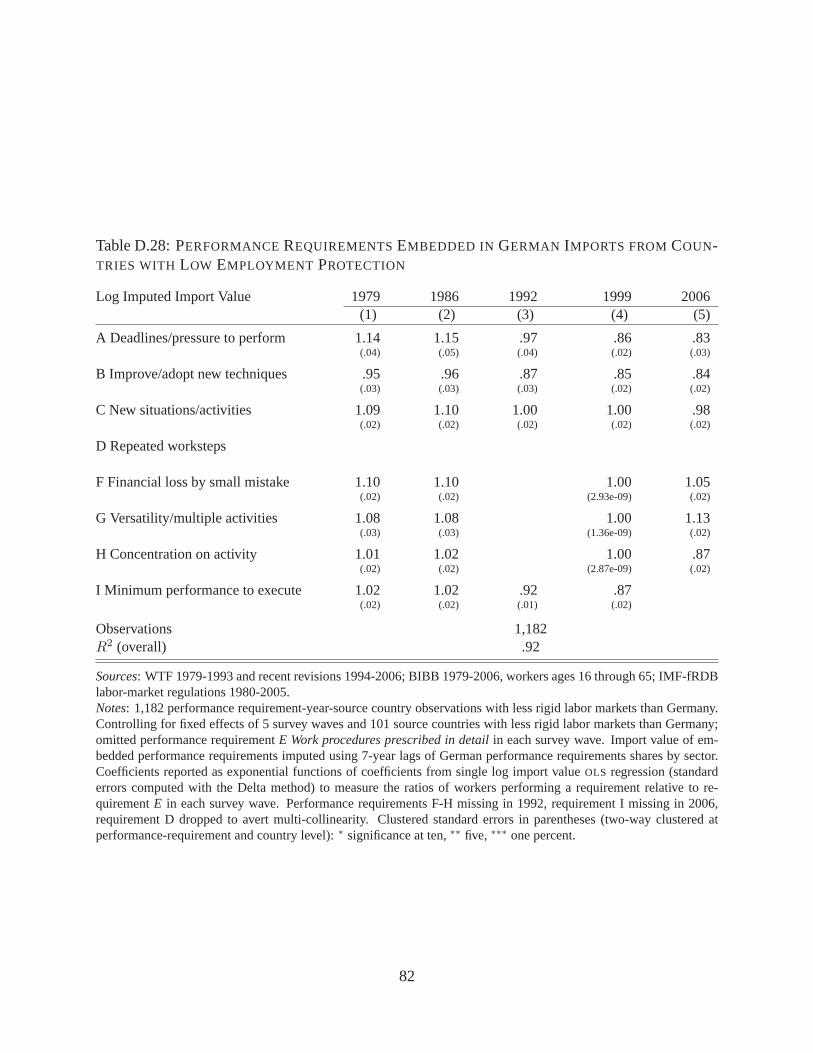
Table D.28: PERFORMANCEREQUIREMENTSEMBEDDED IN GERMAN IMPORTS FROMCOUN-TRIES WITH LOW EMPLOYMENT PROTECTION
Log Imputed Import Value 1979 1986 1992 1999 2006(1) (2) (3) (4) (5)
A Deadlines/pressure to perform 1.14 1.15 .97 .86 .83(.04) (.05) (.04) (.02) (.03)
B Improve/adopt new techniques .95 .96 .87 .85 .84(.03) (.03) (.03) (.02) (.02)
C New situations/activities 1.09 1.10 1.00 1.00 .98(.02) (.02) (.02) (.02) (.02)
D Repeated worksteps
F Financial loss by small mistake 1.10 1.10 1.00 1.05(.02) (.02) (2.93e-09) (.02)
G Versatility/multiple activities 1.08 1.08 1.00 1.13(.03) (.03) (1.36e-09) (.02)
H Concentration on activity 1.01 1.02 1.00 .87(.02) (.02) (2.87e-09) (.02)
I Minimum performance to execute 1.02 1.02 .92 .87(.02) (.02) (.01) (.02)
Observations 1,182R2 (overall) .92
Sources: WTF 1979-1993 and recent revisions 1994-2006; BIBB 1979-2006, workers ages 16 through 65; IMF-fRDBlabor-market regulations 1980-2005.Notes: 1,182 performance requirement-year-source country observations with less rigid labor markets than Germany.Controlling for fixed effects of 5 survey waves and 101 sourcecountries with less rigid labor markets than Germany;omitted performance requirementE Work procedures prescribed in detailin each survey wave. Import value of em-bedded performance requirements imputed using 7-year lagsof German performance requirements shares by sector.Coefficients reported as exponential functions of coefficients from single log import valueOLS regression (standarderrors computed with the Delta method) to measure the ratiosof workers performing a requirement relative to re-quirementE in each survey wave. Performance requirements F-H missing in 1992, requirement I missing in 2006,requirement D dropped to avert multi-collinearity. Clustered standard errors in parentheses (two-way clustered atperformance-requirement and country level):∗ significance at ten,∗∗ five, ∗∗∗ one percent.
82
E Robustness
E.1 Controlling for computer use, education and migration status
To analyze the robustness of our descriptive task frequencycomputations in Figures 2 and Figure 3(Table D.2 and D.4 for the respective right-hand panels), Wefollow the literature and add measurescapturing computerization, education and migration status to our regressions.
we condition on additional information at the individual worker level: computer use, education,and migration status. For computer use, we consistently extract from all BIBB survey waves anindicator variable that relates to a worker’s use of a computer, workstation, or CAD equipmentat the workplace. Similarly, we extract from the BIBB survey information on the worker’s yearsof schooling. Finally, we use information on the worker’s migration status from BIBB in 2006in a single cross section (migration status is not consistently measured or sampled across years).For comparability to our main specifications in equations (1) and (2), we aggregate the individualinformation to the same cells by sector, occupation, surveyyear, gender, age and task, and thenre-estimate the linear regression model augmented with those control variables one at a time.
To probe the robustness of our findings to technical change, Tables E.1 and E.2 report theresults when we include computer use in the specification. Asa comparison to Tables D.2 and D.4shows, coefficient estimates are hardly changed (alterations of the coefficients by .01 when atall). We also included a worker’s computing skills, insteadof computer use at the workplace,from the BIBB data and again found results not meaningfully altered. Tables E.3 and E.4 reportresults conditional on years of schooling. Again, a comparison to Tables D.2 and D.4 shows noeconomically important changes. Finally, inclusion of migration status does not notably changeresults for the year with observed migration status (to avert repetitiveness we make the resultsavailable upon request). A common reason for the absence of relevant effects appears to be thatmost of the variation in task frequencies is explained by year, age, gender, sector, and occupationfixed effects, so that the additional robustness measure addlittle explanatory power.
E.2 Task content of imports by foreign minimum wage levels
As a further robustness exercise to our investigation of labour-market characteristics abroad, thisappendix presents evidence on the task content of German imports by the minimum wage levelin the import source countries, replicating similar evidence on employment protection through ad-vance notice in Figure 10 in the text. Figure E.1 plots the relative task content estimated with sep-arate regressions for imports from source countries with more worker friendly regulations (higherrelative minimum wage than median) vs. less worker friendlyforeign economies. Non-productionactivities are relatively more frequently embedded in import flows from countries with low mini-mum wages, but the overall patterns are otherwise strikingly unaltered between the two groups oflow- and high-minimum-wage countries.
83

Figure E.1:Activity Content and Performance Requirements Embedded in German Importsby Foreign Minimum Wage Levels
Activity Content Embedded in German Importsfrom High Minimum Wage Countries from Low Minimum Wage Countries
1986
1999
2006
.198
.296
.444
.667
1.000
1.500
Rel
ativ
e F
requ
ency
1 Produce
2 Repair/M
aintain .
4 Transport/S
tore
5 Measu
re/Insp
ect
6 Analyz
e/Rese
arch
7 Purch
ase/S
ell
8 Program C
omputer
9 Practi
ce Law
10 Consu
lt/Inform . .
13 Adve
rtise/P
romote
14 Organize
/Plan
15 Ove
rsee/C
ontrol
Activity
1986 1999 2006
Performance Requirements Embedded in German Importsfrom High Minimum Wage Countries from Low Minimum Wage Countries
1986
1999
2006
.810
.900
1.000
1.111
1.235
1.372
Rel
ativ
e F
requ
ency
A Deadlin
es
B Improve
tech
niques
C New si
tuations
D Repeat w
ork
E Presc
ribed w
ork
F Losses i
f mist
ake
G Multi
activit
ies
H Conce
ntratio
n
I Minim
um perform
Performance Requirement
1986 1999 2006
19861999
2006
.810
.900
1.000
1.111
1.235
1.372
Rel
ativ
e F
requ
ency
A Deadlin
es
B Improve
tech
niques
C New si
tuations
D Repeat w
ork
E Presc
ribed w
ork
F Losses i
f mist
ake
G Multi
activit
ies
H Conce
ntratio
n
I Minim
um perform
Performance Requirement
1986 1999 2006
Source: WTF 1979-1993 and recent revisions 1994-2006; BIBB 1979-2006, workers ages 16 through 65; IMF-fRDBlabor-market regulations 1980-2005.Notes: Measures of relative task (activity or performance requirement) frequencies from log import valueOLS regres-sions over task-year-source country cells (2,653 observations for activities and 1,485 for performance requirementsover more worker friendly source countries, 6,657 observations for activities and 3,705 for performance requirementsover less worker friendly source countries than Germany). Source countries with ratio of minimum wage to mean wageabove or below world median. Import value of embedded tasks imputed using 7-year lags of German task shares bysector. Services activities 3, 11 and 12 not reported in graphs, performance requirement I missing in 2006, requirementD dropped to avert multi-collinearity. Coefficientsβ from log import value regressions reported asexp{β} to reflectrelative import frequencies. Omitted baseline activity1 Manufacture, Produce Goods, omitted baseline performancerequirementE Work procedures prescribed in detailin each survey wave. Log scale on vertical axis.
84

Table E.1: ACTIVITY CONTENT OF GERMAN WORK WITHIN SECTOR AND OCCUPATION,CONDITIONAL ON COMPUTERUSE
Log Employment 1979 1986 1992 1999 2006(1) (2) (3) (4) (5)
2 Repair/Maintain .79 1.20 1.19 1.20 1.16(.03) (.06) (.06) (.03) (.04)
3 Entertain/Accommodate .56 .80 .83 1.16 .93(.07) (.11) (.08) (.07) (.07)
4 Transport/Store .72 1.05 1.04 1.23 1.20(.03) (.05) (.05) (.04) (.05)
5 Measure/Inspect .83 .94 .98 1.32 1.34(.02) (.04) (.04) (.04) (.06)
6 Analyze/Research .90 1.14 1.22 1.35 1.44(.04) (.05) (.06) (.09) (.09)
7 Purchase/Sell .79 1.10 1.10 1.24 1.18(.06) (.08) (.07) (.07) (.06)
8 Program Computer .47 .84 1.11 .71 .81(.03) (.05) (.06) (.03) (.03)
9 Practice Law .52 .73 .74 .96 1.35(.06) (.06) (.05) (.07) (.10)
10 Consult/Inform .52 .96 .99 1.55 1.48(.04) (.08) (.08) (.09) (.09)
11 Train/Educate .63 .92 .92 1.22 1.27(.06) (.08) (.08) (.07) (.08)
12 Nurse/Cure .64 .90 1.00 1.11 .97(.07) (.11) (.13) (.08) (.08)
13 Advertise/Promote .52 .72 .72 1.12 1.19(.03) (.05) (.05) (.08) (.08)
14 Organize/Plan .77 1.15 1.32 1.43 1.33(.02) (.06) (.07) (.08) (.07)
15 Oversee/Control .72 1.17 1.25 1.15 1.14(.03) (.05) (.07) (.04) (.04)
Observations 164,851R2 (overall) .25
Source: BIBB 1979-2006, workers ages 16 through 65.Notes: 168,466 activity-year-gender-age-sector-occupation observations. Controlling for computer use (frequency ofworkers’ uses of computer, workstation, or CAD equipment atthe workplace), fixed effects of 2 genders, 50 agegroups, 5 survey waves, 6 occupation areas and 35 sectors; omitted activity1 Manufacture, Produce Goodsin eachsurvey wave. Coefficients reported as exponential functions of coefficients from single log employmentOLS regression(standard errors computed with the Delta method) to measurethe ratios of workers in an activity relative to activity1in each survey wave. Clustered standard errors in parentheses (two-way clustered at activity and sector level).
85

Table E.2: PERFORMANCEREQUIREMENTS OFGERMAN WORK WITHIN SECTOR AND OCCU-PATION, CONDITIONAL ON COMPUTERUSE
Log Employment 1979 1986 1992 1999 2006(1) (2) (3) (4) (5)
A Deadlines/pressure to perform 1.22 1.22 1.28 1.38 1.26(.02) (.02) (.02) (.04) (.02)
B Improve/adopt new techniques .99 1.02 1.09 1.10 1.19(.02) (.02) (.03) (.04) (.03)
C New situations/activities 1.28 1.15 1.23 1.18 1.24(.03) (.02) (.03) (.04) (.03)
D Repeated worksteps 1.20 1.15 1.17 1.16 1.15(.02) (.02) (.01) (.02) (.01)
F Financial loss by small mistake 1.08 .98 1.02 .92(.02) (.02) (.02) (.02)
G Versatility/multiple activities 1.03 .89 .94 1.03(.01) (.02) (.01) (.02)
H Concentration on activity 1.24 1.16 1.17 1.26(.03) (.02) (.03) (.02)
I Minimum performance to execute 1.25 1.20 1.30 1.09(.02) (.02) (.03) (.03)
Observations 176,040R2 (overall) .29
Source: BIBB 1979-2006, workers ages 16 through 65.Notes: 180,022 requirement-year-gender-age-sector-occupation observations. Controlling for computer use (fre-quency of workers’ uses of computer, workstation, or CAD equipment at the workplace), fixed effects of 2 genders, 50age groups, 5 survey waves, 6 occupation areas and 35 sectors; omitted performance requirementE Work proceduresprescribed in detailin each survey wave. Coefficients reported as exponential functions of coefficients from singlelog employmentOLS regression (standard errors computed with the Delta method) to measure the ratios of workersperforming a requirement relative to requirementE in each survey wave. Performance requirements F-H missing in1992, requirement I missing in 2006. Clustered standard errors in parentheses (two-way clustered at performance-requirement and sector level).
86

Table E.3: ACTIVITY CONTENT OF GERMAN WORK WITHIN SECTOR AND OCCUPATION,CONTROLLING FORYEARS OFSCHOOLING
Log Employment 1979 1986 1992 1999 2006(1) (2) (3) (4) (5)
2 Repair/Maintain .80 1.20 1.18 1.19 1.16(.03) (.06) (.06) (.03) (.04)
3 Entertain/Accommodate .55 .80 .82 1.16 .93(.06) (.11) (.08) (.07) (.07)
4 Transport/Store .73 1.05 1.04 1.23 1.20(.03) (.05) (.04) (.04) (.05)
5 Measure/Inspect .83 .93 .96 1.32 1.34(.02) (.04) (.04) (.04) (.06)
6 Analyze/Research .91 1.12 1.20 1.34 1.44(.04) (.05) (.06) (.08) (.09)
7 Purchase/Sell .80 1.09 1.08 1.23 1.18(.06) (.08) (.06) (.07) (.06)
8 Program Computer .47 .82 1.08 .70 .80(.03) (.05) (.06) (.03) (.03)
9 Practice Law .53 .72 .73 .95 1.34(.06) (.06) (.05) (.06) (.10)
10 Consult/Inform .53 .94 .98 1.54 1.48(.04) (.08) (.08) (.09) (.09)
11 Train/Educate .64 .91 .91 1.21 1.26(.07) (.08) (.08) (.07) (.08)
12 Nurse/Cure .65 .89 1.00 1.11 .97(.07) (.11) (.13) (.08) (.08)
13 Advertise/Promote .52 .71 .71 1.11 1.18(.03) (.05) (.05) (.08) (.08)
14 Organize/Plan .78 1.13 1.30 1.42 1.32(.02) (.05) (.07) (.08) (.07)
15 Oversee/Control .72 1.17 1.24 1.14 1.13(.03) (.05) (.07) (.04) (.04)
Observations 164,828R2 (overall) .25
Source: BIBB 1979-2006, workers ages 16 through 65.Notes: 168,466 activity-year-gender-age-sector-occupation observations. Controlling for years of schooling, fixedeffects of 2 genders, 50 age groups, 5 survey waves, 6 occupation areas and 35 sectors; omitted activity1 Manufacture,Produce Goodsin each survey wave. Coefficients reported as exponential functions of coefficients from single logemploymentOLS regression (standard errors computed with the Delta method) to measure the ratios of workers inan activity relative to activity1 in each survey wave. Clustered standard errors in parentheses (two-way clustered atactivity and sector level).
87

Table E.4: PERFORMANCEREQUIREMENTS OFGERMAN WORK WITHIN SECTOR AND OCCU-PATION, CONTROLLING FORYEARS OFSCHOOLING
Log Employment 1979 1986 1992 1999 2006(1) (2) (3) (4) (5)
A Deadlines/pressure to perform 1.22 1.21 1.27 1.37 1.26(.02) (.02) (.02) (.04) (.02)
B Improve/adopt new techniques .99 1.01 1.08 1.08 1.19(.02) (.02) (.03) (.04) (.03)
C New situations/activities 1.29 1.14 1.22 1.17 1.23(.03) (.02) (.03) (.03) (.02)
D Repeated worksteps 1.20 1.14 1.17 1.16 1.15(.02) (.02) (.01) (.02) (.009)
F Financial loss by small mistake 1.08 .97 1.01 .92(.02) (.02) (.03) (.02)
G Versatility/multiple activities 1.03 .89 .93 1.03(.01) (.02) (.01) (.02)
H Concentration on activity 1.24 1.15 1.16 1.25(.02) (.02) (.03) (.02)
I Minimum performance to execute 1.25 1.19 1.29 1.08(.02) (.02) (.03) (.02)
Observations 175,994R2 (overall) .29
Source: BIBB 1979-2006, workers ages 16 through 65.Notes: 180,022 requirement-year-gender-age-sector-occupation observations. Controlling for fixed effects of 2 gen-ders, 50 age groups, 5 survey waves, 6 occupation areas and 35sectors; omitted performance requirementE Workprocedures prescribed in detailin each survey wave. Coefficients reported as exponential functions of coefficientsfrom single log employmentOLS regression (standard errors computed with the Delta method) to measure the ratiosof workers performing a requirement relative to requirement E in each survey wave. Performance requirements F-H missing in 1992, requirement I missing in 2006. Clustered standard errors in parentheses (two-way clustered atperformance-requirement and sector level).
88