wissenschaftliche grafiken und berechnungen mit python · leistungsstarke n-dimensionale arrays...
TRANSCRIPT
Wissenschaftliche Grafiken und Berechnungen mit Python
Dietmar Thaler, 8911 Admont [email protected]
Version 24.04.2015
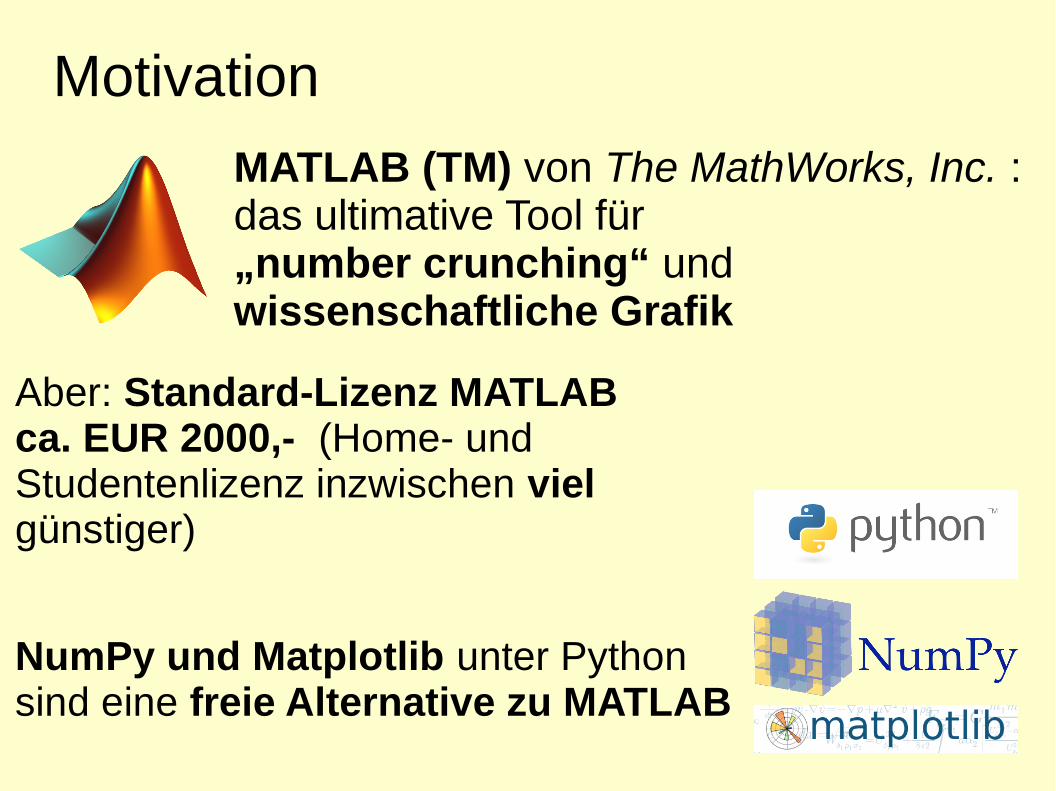
Motivation
Aber: Standard-Lizenz MATLAB ca. EUR 2000,- (Home- und Studentenlizenz inzwischen viel günstiger)
NumPy und Matplotlib unter Python sind eine freie Alternative zu MATLAB
MATLAB (TM) von The MathWorks, Inc. : das ultimative Tool für „number crunching“ und wissenschaftliche Grafik
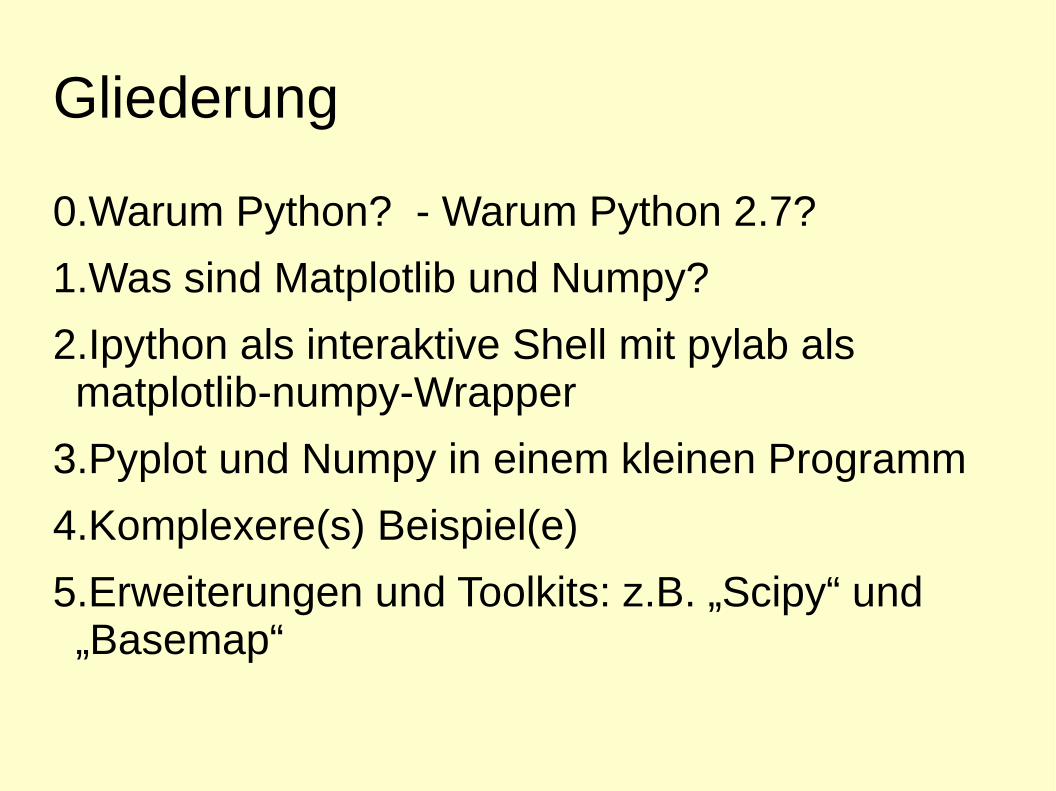
Gliederung
0.Warum Python? - Warum Python 2.7?
1.Was sind Matplotlib und Numpy?
2.Ipython als interaktive Shell mit pylab als matplotlib-numpy-Wrapper
3.Pyplot und Numpy in einem kleinen Programm
4.Komplexere(s) Beispiel(e)
5.Erweiterungen und Toolkits: z.B. „Scipy“ und „Basemap“
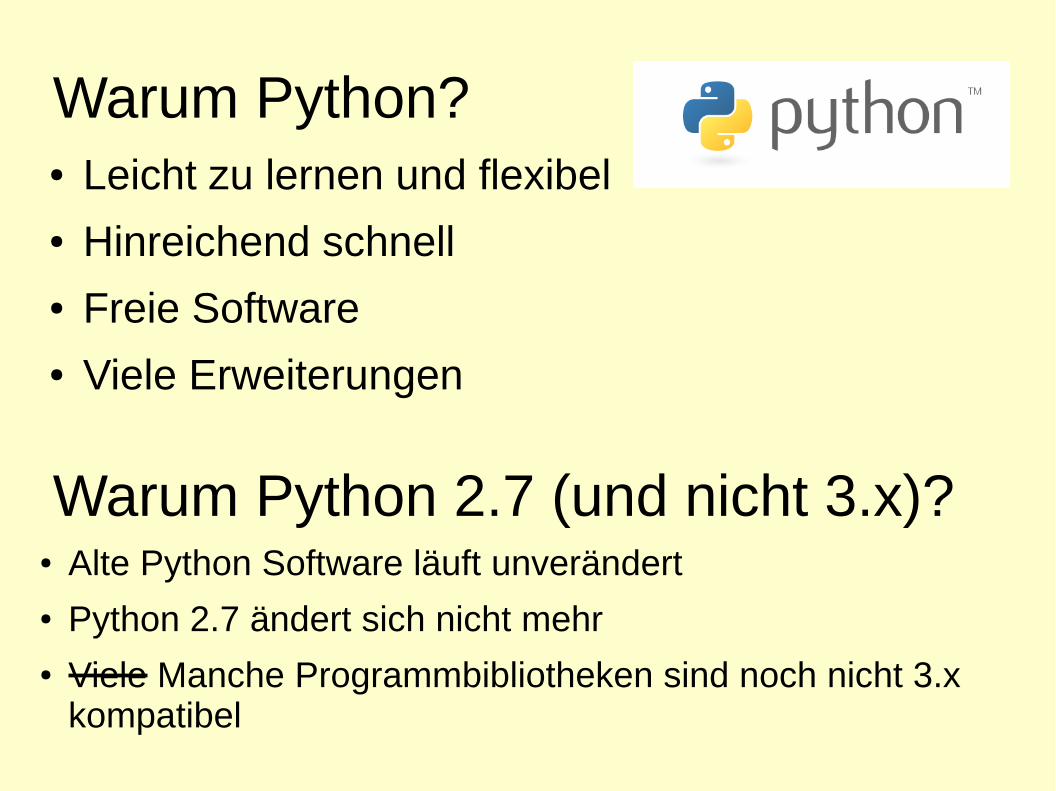
Warum Python?● Leicht zu lernen und flexibel● Hinreichend schnell● Freie Software● Viele Erweiterungen
Warum Python 2.7 (und nicht 3.x)?● Alte Python Software läuft unverändert● Python 2.7 ändert sich nicht mehr● Viele Manche Programmbibliotheken sind noch nicht 3.x
kompatibel
NumPy ist eine grundlegendes Programmbibliothek für wissenschaftliches Rechnen unter Python.
● Leistungsstarke N-dimensionale Arrays (Felder, Matrizen)
● dazu vielseitige Funktionen zur Manipulation von Arrays
● Nützliche Funktionen: Lineare Algebra, Fourier Transformation, Zufallszahlen, … (neben den Erweiterungen der Standard-Mathematik-Bibliothek auf Arrays)
NumPys Flexibilität erlaubt die schlüssige Integration in weiterführende Bibliotheken, z.B. in Matplotlib sowie die Integration von C/C++ und Fortran.
BSD Lizenz ( http://www.numpy.org/license.html#license )
http://www.numpy.org/
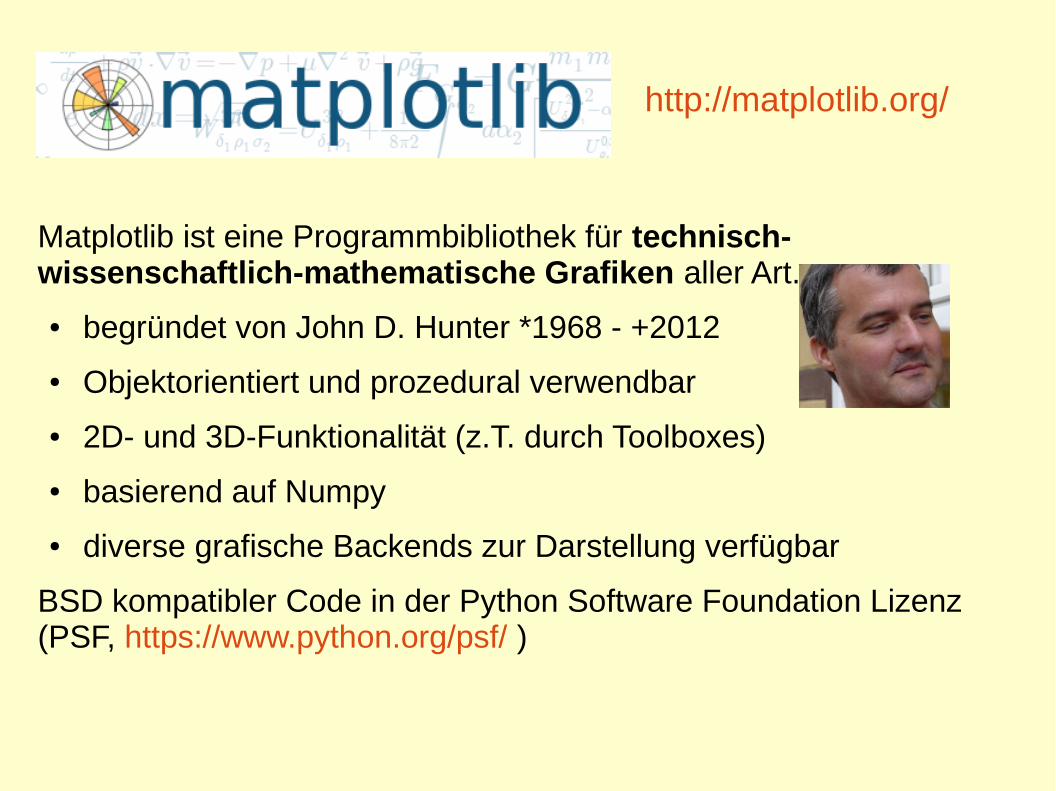
Matplotlib ist eine Programmbibliothek für technisch-wissenschaftlich-mathematische Grafiken aller Art.
● begründet von John D. Hunter *1968 - +2012
● Objektorientiert und prozedural verwendbar
● 2D- und 3D-Funktionalität (z.T. durch Toolboxes)
● basierend auf Numpy
● diverse grafische Backends zur Darstellung verfügbar
BSD kompatibler Code in der Python Software Foundation Lizenz (PSF, https://www.python.org/psf/ )
http://matplotlib.org/
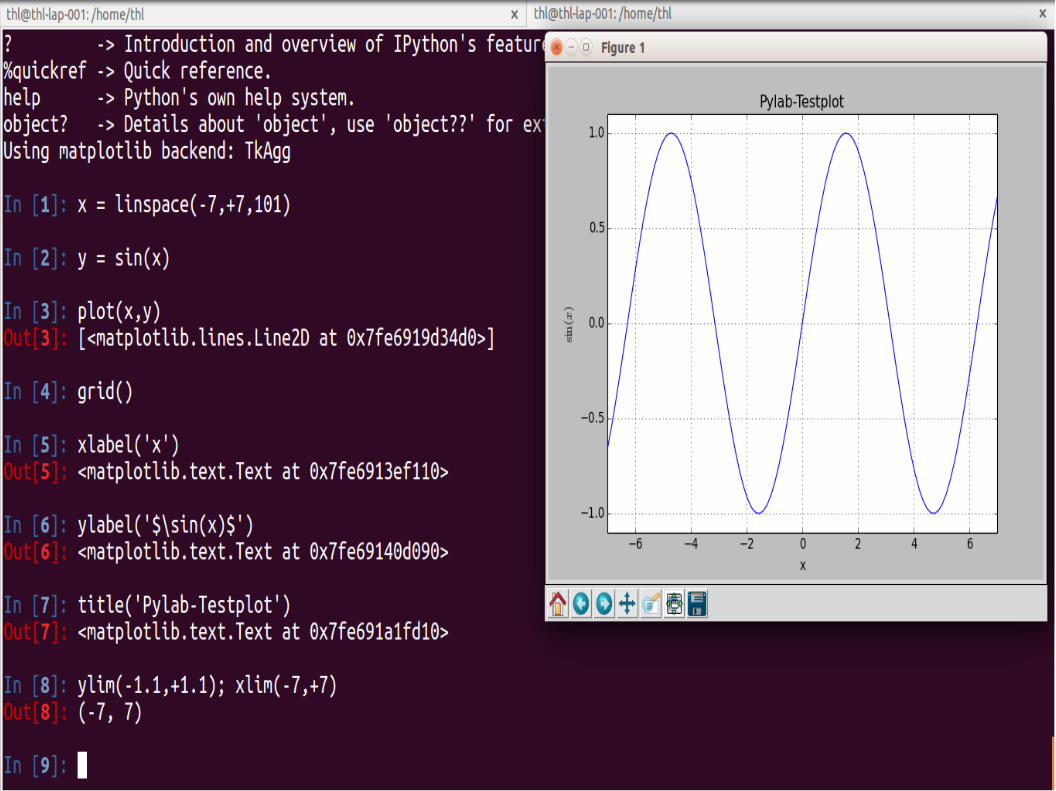
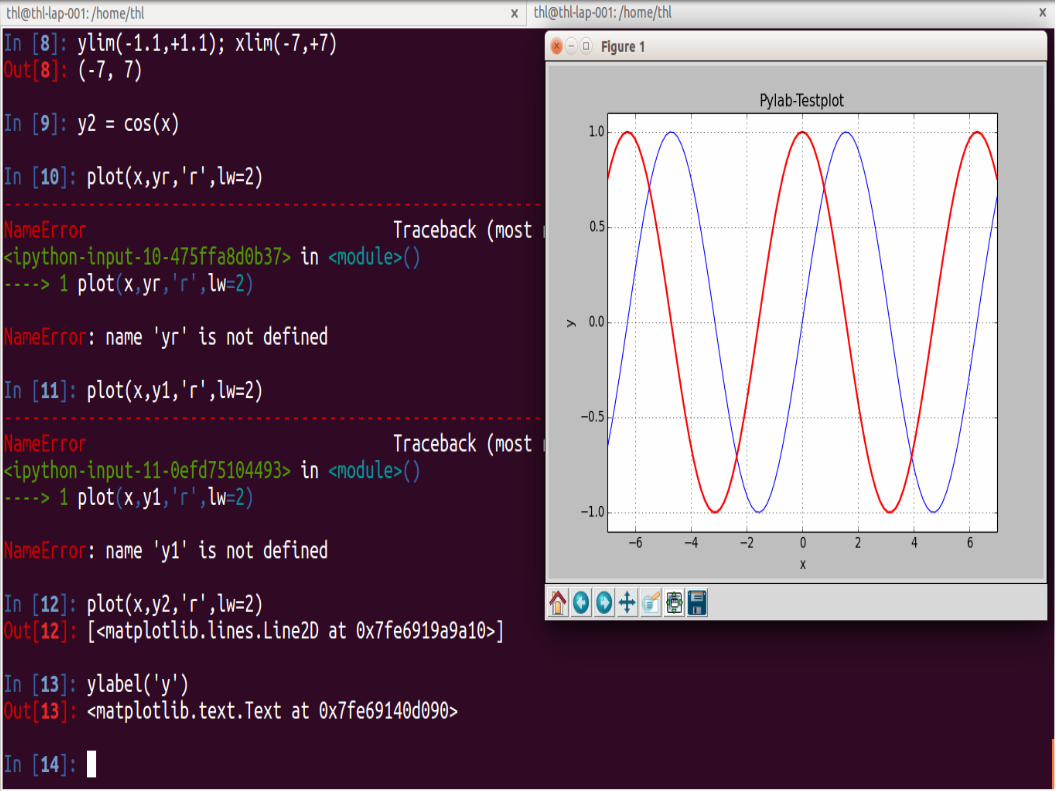
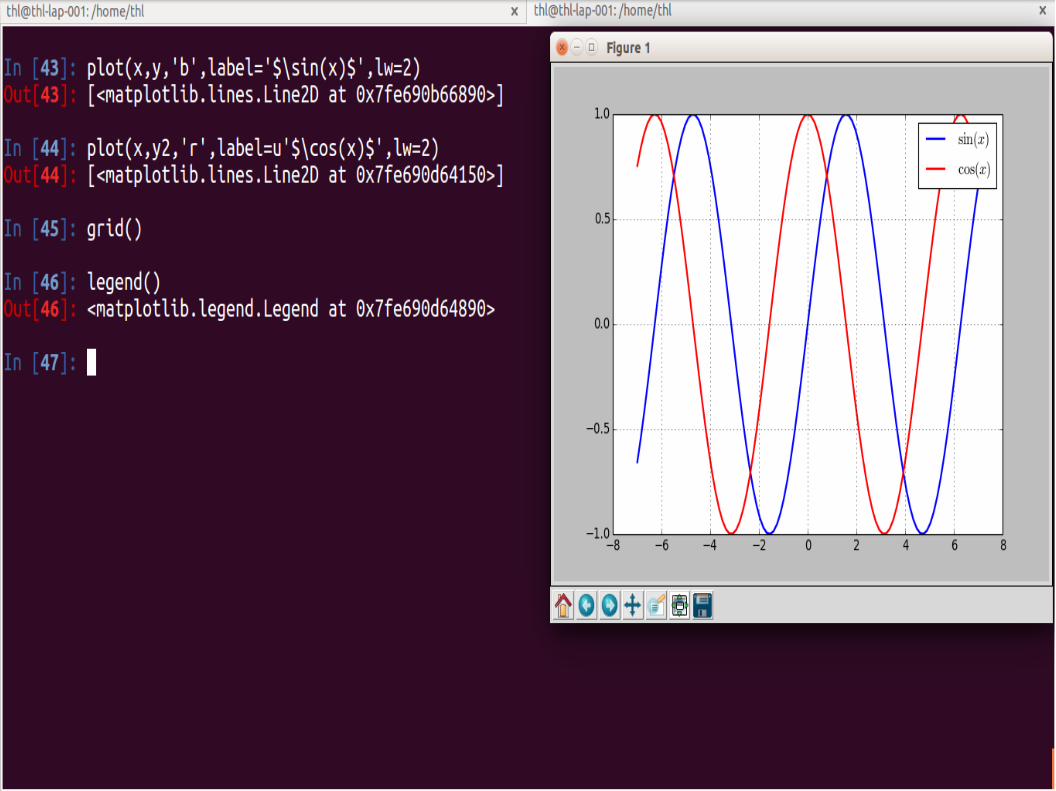
● Interaktiver Modus (Pylab-Modus):
– Analog zu Matlab
– Vorzugsweise in Ipython
– Ungünstiger in der Programmierung (Verwischung der Matplotlib- und Numpy-Funktionalität)
● Prozeduraler Modus
– matplotlib.pyplot und numpy
– Funktionalität in etwa wie im Pylab-Modus
– saubere Programmierbarkeit (getrennter name space)
● Objektorientierter Modus:
– Volle Kontrolle, komplex und daher oft unübersichtlich, (leider) gelegentlich notwendig
3 Modi von
mit pylab(interaktiver Matplotlib- und NumPy-Wrapper)
● IPython ist eine komfortable Python-Shell ● Installation (unter Ubuntu 14.4):
>sudo apt-get install python-matplotlib ipython
NumPy und anderes wird über Abhängigkeiten mit installiert
● In der Konsole im interaktiven pylab-Modus starten:
>ipython --pylab
http://ipython.org
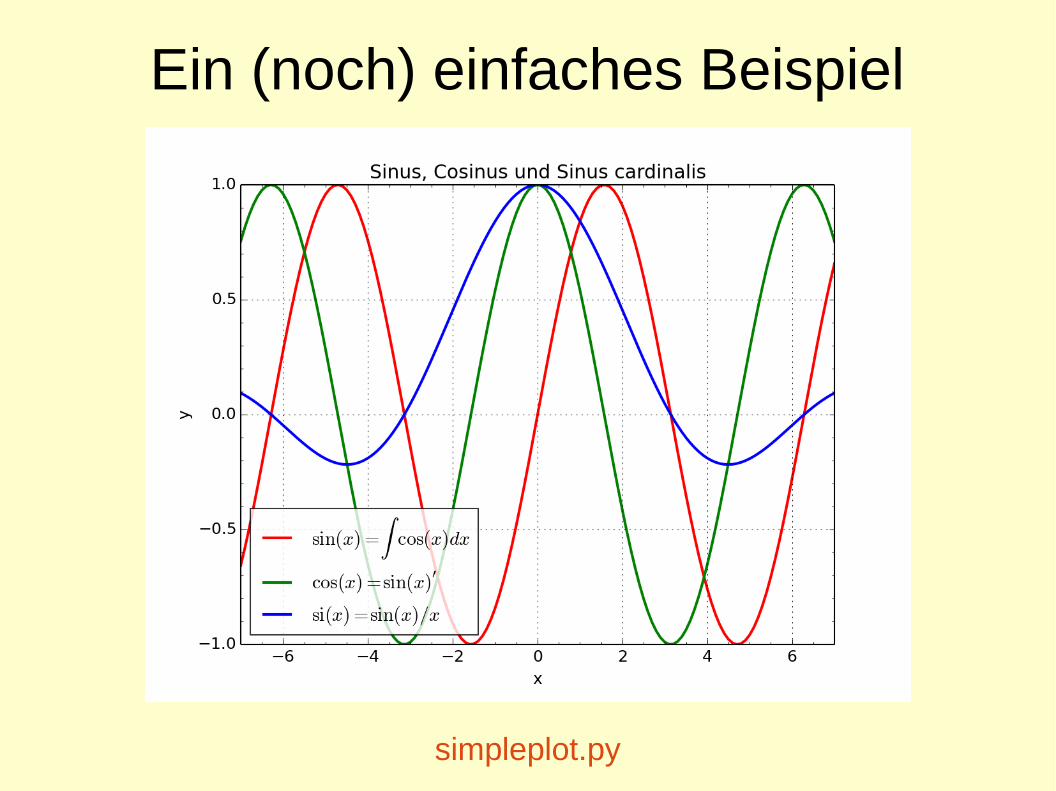
Ein (noch) einfaches Beispiel
simpleplot.py
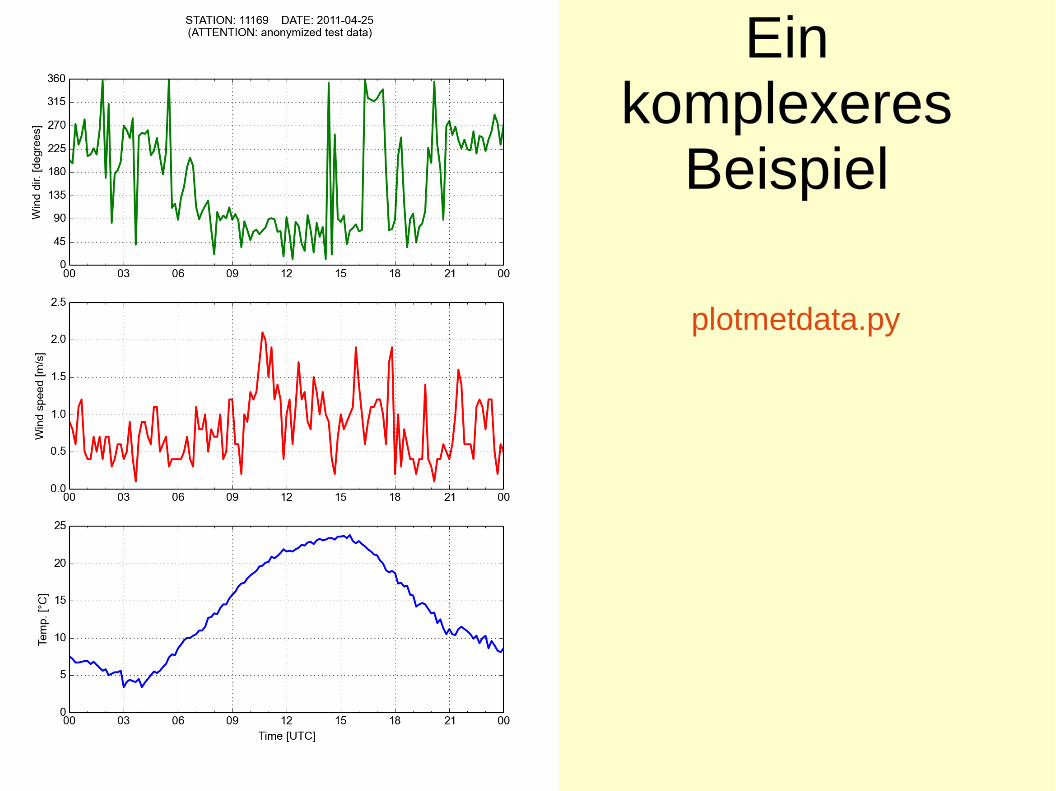
Ein komplexeres
Beispiel
plotmetdata.py
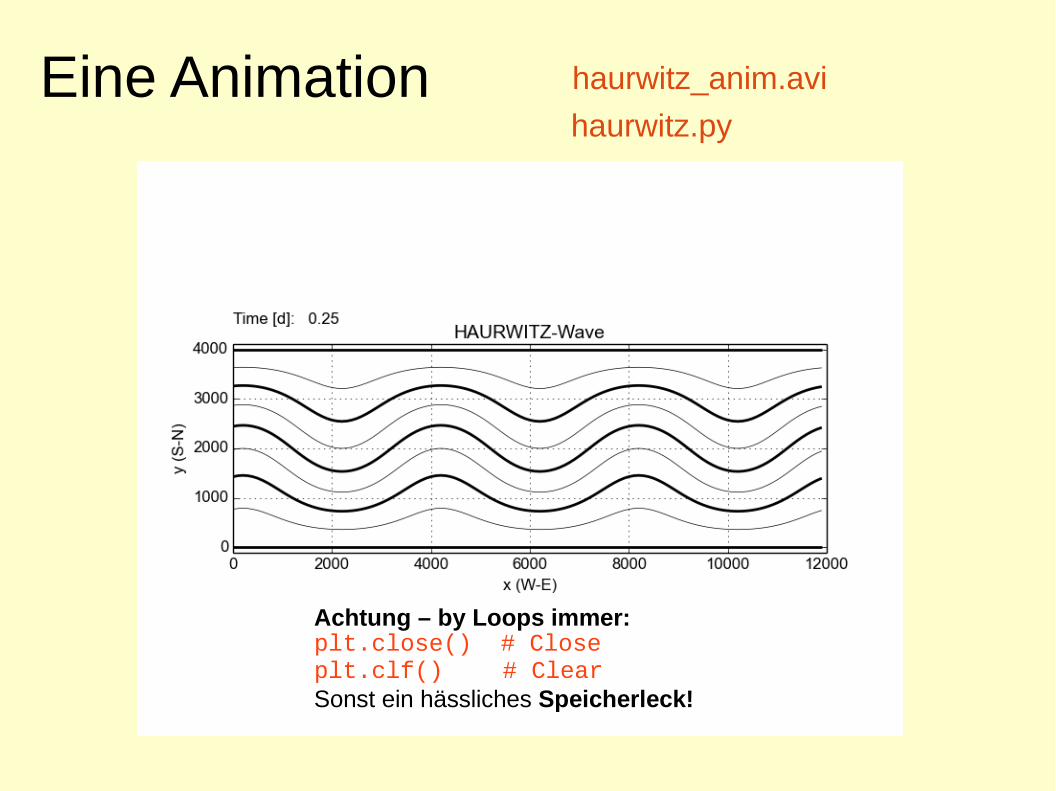
Eine Animation
Achtung – by Loops immer: plt.close() # Close plt.clf() # ClearSonst ein hässliches Speicherleck!
haurwitz_anim.avi
haurwitz.py
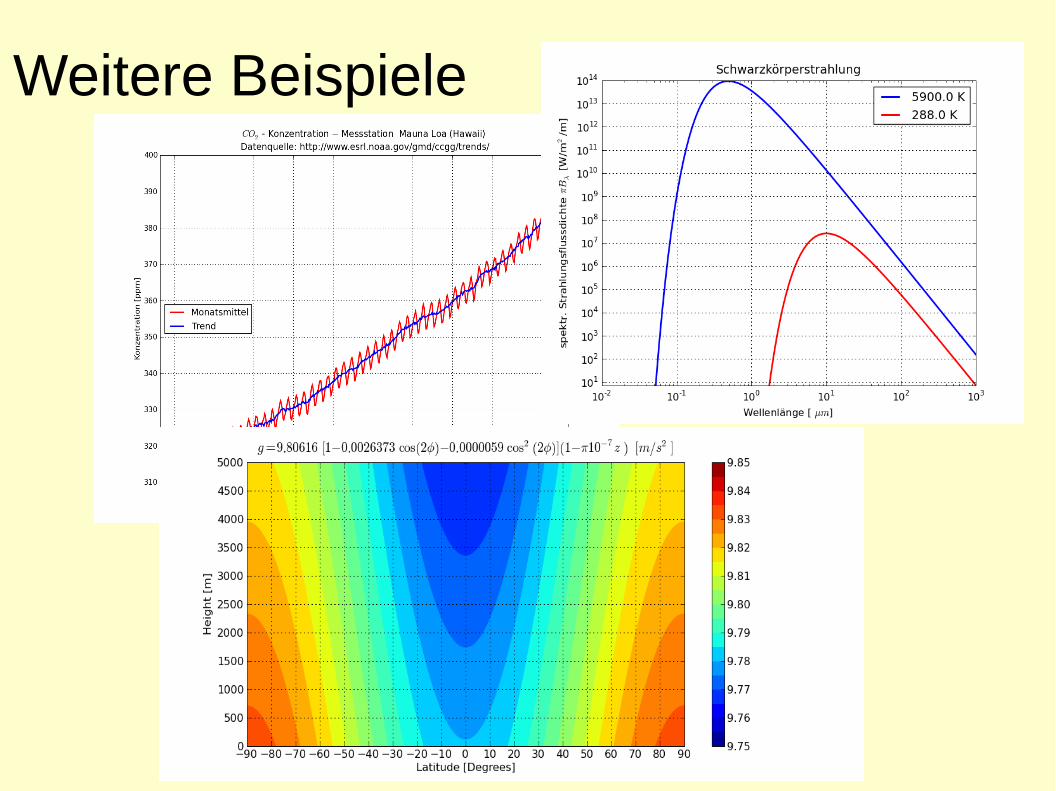
Weitere Beispiele
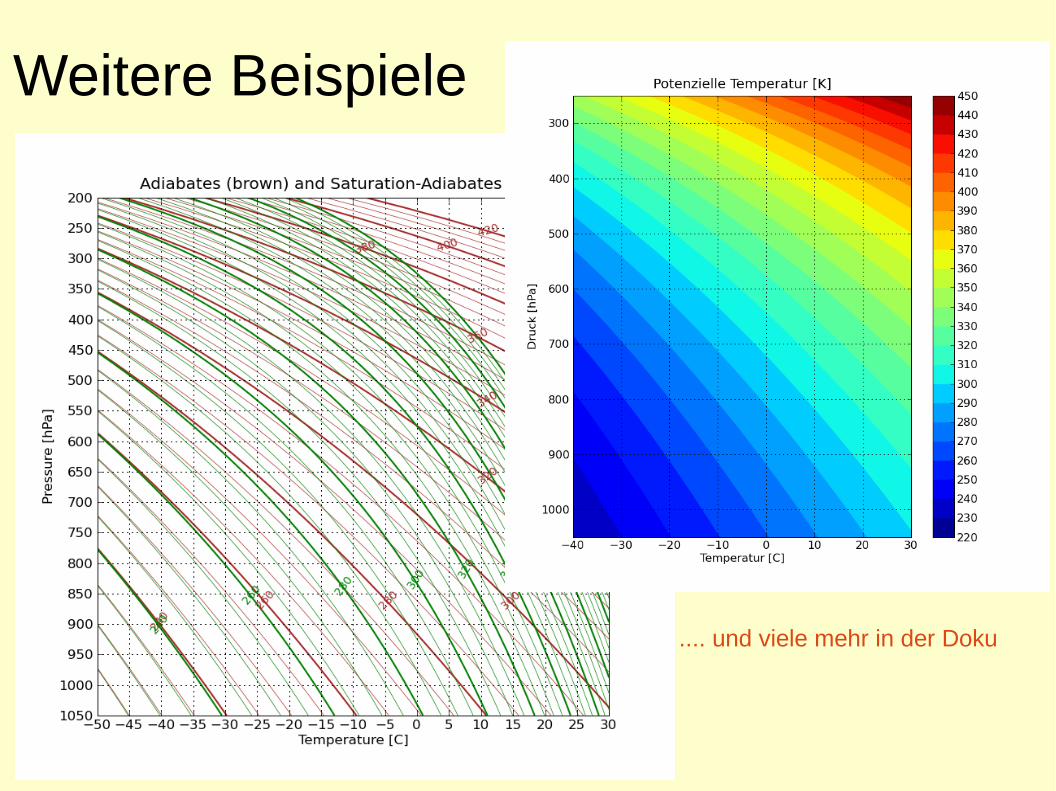
Weitere Beispiele
.... und viele mehr in der Doku
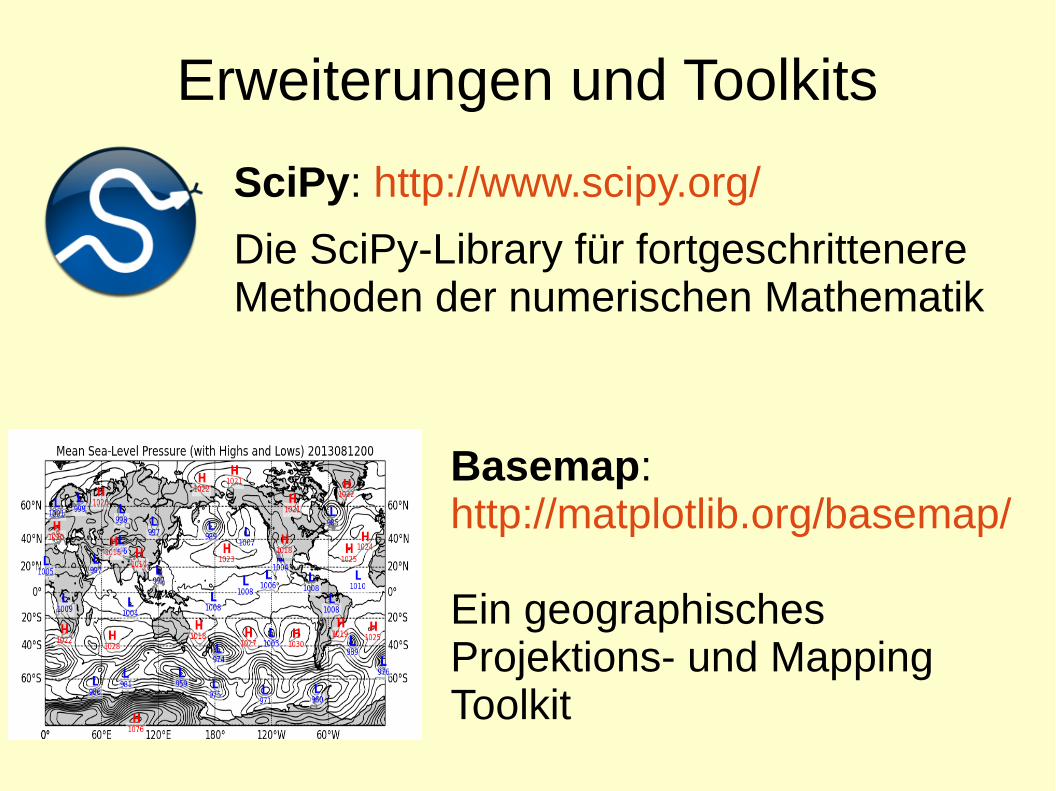
Erweiterungen und Toolkits
SciPy: http://www.scipy.org/
Die SciPy-Library für fortgeschrittenere Methoden der numerischen Mathematik
Basemap: http://matplotlib.org/basemap/
Ein geographisches Projektions- und Mapping Toolkit
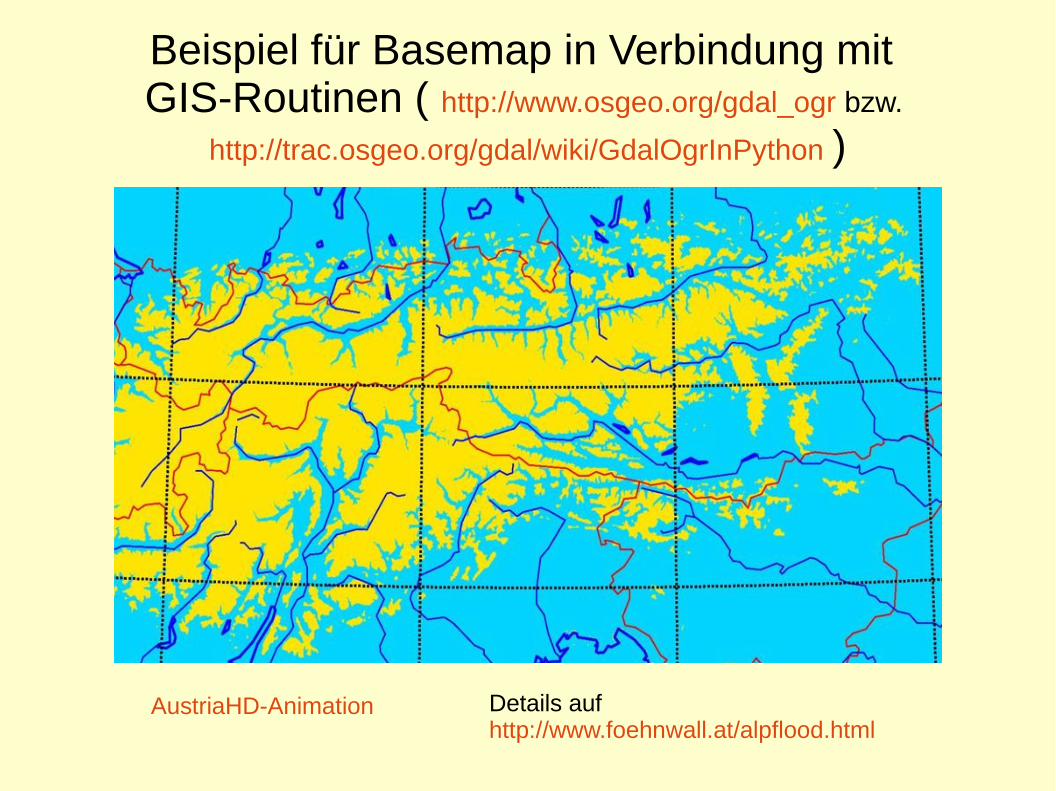
Beispiel für Basemap in Verbindung mit GIS-Routinen ( http://www.osgeo.org/gdal_ogr bzw.
http://trac.osgeo.org/gdal/wiki/GdalOgrInPython )
AustriaHD-Animation Details auf http://www.foehnwall.at/alpflood.html
Tutorials und Hilfen
Tentative NumPy Tutorial: http://wiki.scipy.org/Tentative_NumPy_Tutorial
NumPy for Matlab Users: http://wiki.scipy.org/NumPy_for_Matlab_Users
NumPy Manual: http://docs.scipy.org/doc/numpy/
Matplotlib Docs: http://matplotlib.org/contents.html
Matplotlib-users – Discussion for matplotlib users (Forum)https://lists.sourceforge.net/lists/listinfo/matplotlib-users
Matplotlib und pylab – Anfängertutorial (analog zu hier)http://www.pro-linux.de/artikel/2/168/matplotlib-und-pylab.html
Matplotlib in Depth:http://www.astro.washington.edu/users/vanderplas/Astr599/notebooks/12_AdvancedMatplotlib