bitte decken sie die schraffierte fläche mit einem bild ab ...conference presentation january 2018...
TRANSCRIPT
Bitte decken Sie die schraffierte Fläche mit einem Bild ab.
Please cover the shaded area with a picture.
(24,4 x 11,0 cm)
Driving the Future of Mobility
Strategy Presentation
Conference Presentation January 2018
EDMR – Equity and Debt Markets Relations 2
AGENDA
Automotive Trends2 4
Key Enabler: Digitalization3 6
Electrification4 10
Automated Driving5 13
Holistic Connectivity6 18
7 Tires: No Disruption but Evolution 21
8 ContiTech – Smart Solutions beyond Rubber 24
9 Continental Strategy – Outlook 2020 and Beyond 26
Corporation Highlights 20171
10 Continental Outlook 2018 27
3
11 Back-up 32
Conference Presentation January 2018
EDMR – Equity and Debt Markets Relations
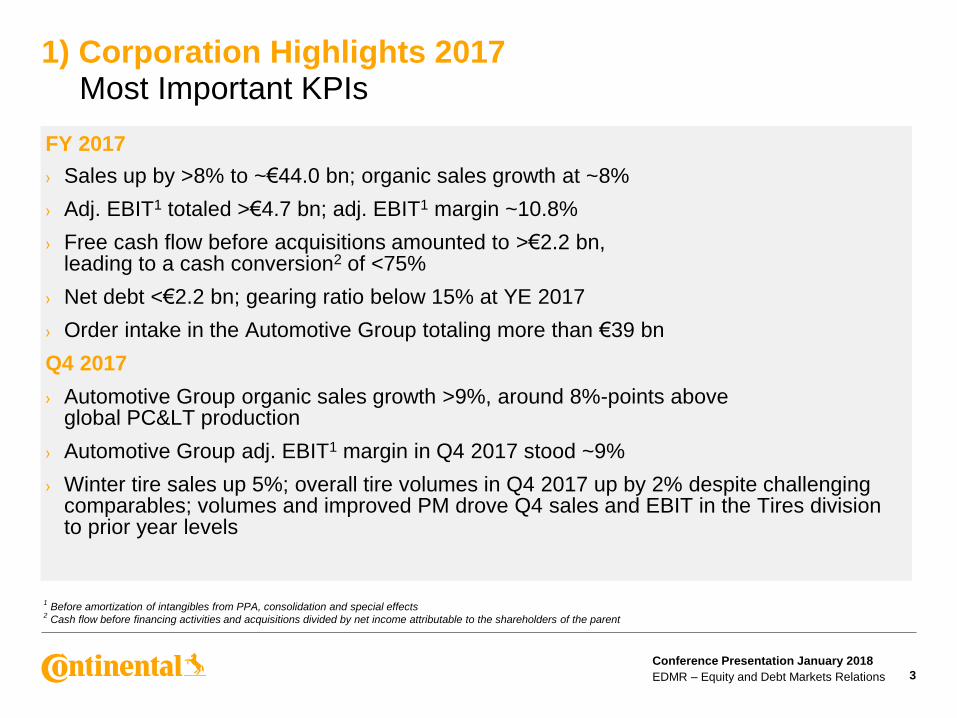
1) Corporation Highlights 2017Most Important KPIs
3
FY 2017
› Sales up by >8% to ~€44.0 bn; organic sales growth at ~8%
› Adj. EBIT1 totaled >€4.7 bn; adj. EBIT1 margin ~10.8%
› Free cash flow before acquisitions amounted to >€2.2 bn, leading to a cash conversion2 of <75%
› Net debt <€2.2 bn; gearing ratio below 15% at YE 2017
› Order intake in the Automotive Group totaling more than €39 bn
Q4 2017
› Automotive Group organic sales growth >9%, around 8%-points above global PC< production
› Automotive Group adj. EBIT1 margin in Q4 2017 stood ~9%
› Winter tire sales up 5%; overall tire volumes in Q4 2017 up by 2% despite challenging comparables; volumes and improved PM drove Q4 sales and EBIT in the Tires division to prior year levels
1Before amortization of intangibles from PPA, consolidation and special effects
2Cash flow before financing activities and acquisitions divided by net income attributable to the shareholders of the parent
Conference Presentation January 2018
EDMR – Equity and Debt Markets Relations 4
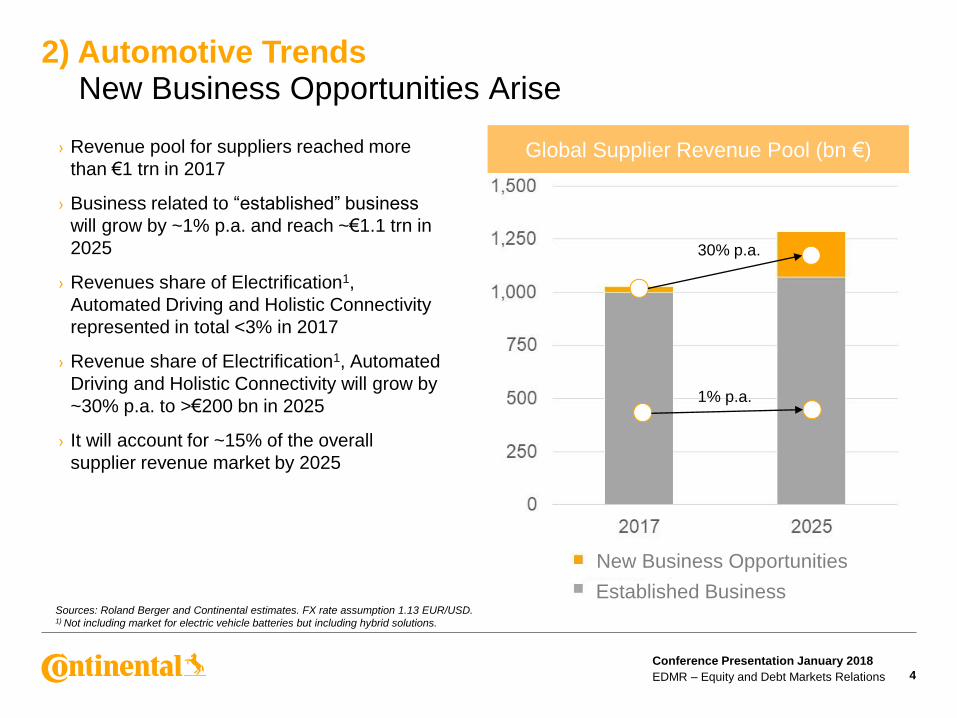
› Revenue pool for suppliers reached more
than €1 trn in 2017
› Business related to “established” business
will grow by ~1% p.a. and reach ~€1.1 trn in
2025
› Revenues share of Electrification1,
Automated Driving and Holistic Connectivity
represented in total <3% in 2017
› Revenue share of Electrification1, Automated
Driving and Holistic Connectivity will grow by
~30% p.a. to >€200 bn in 2025
› It will account for ~15% of the overall
supplier revenue market by 2025
Sources: Roland Berger and Continental estimates. FX rate assumption 1.13 EUR/USD.1) Not including market for electric vehicle batteries but including hybrid solutions.
2) Automotive TrendsNew Business Opportunities Arise
Global Supplier Revenue Pool (bn €)
1% p.a.
30% p.a.
Established Business
New Business Opportunities
Conference Presentation January 2018
EDMR – Equity and Debt Markets Relations 5
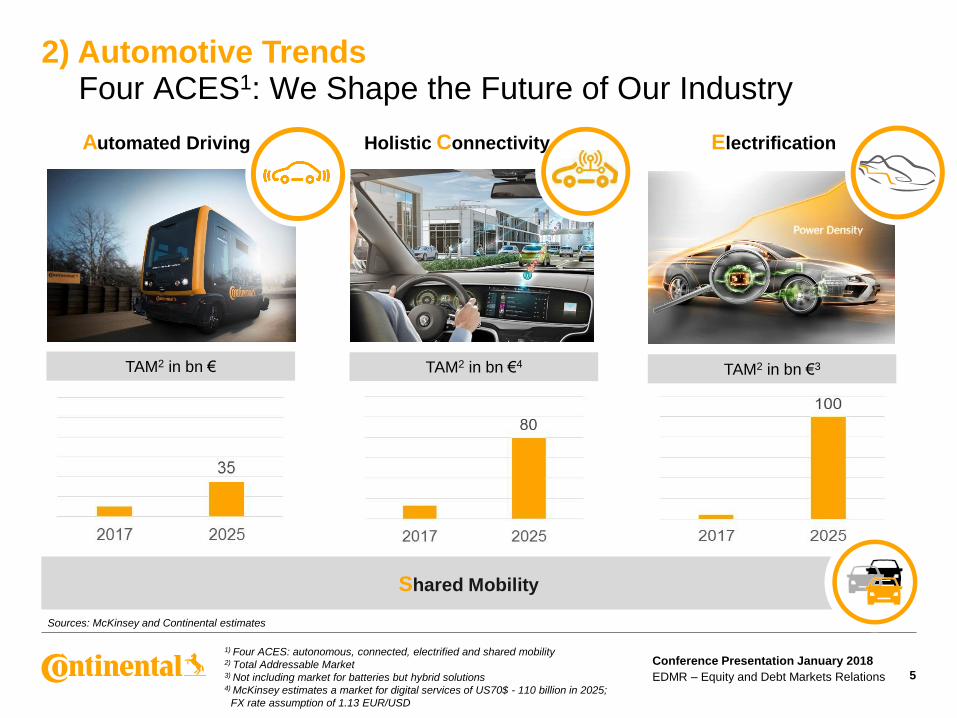
2) Automotive TrendsFour ACES1: We Shape the Future of Our Industry
ElectrificationAutomated Driving Holistic Connectivity
TAM2 in bn €3TAM2 in bn € TAM2 in bn €4
1) Four ACES: autonomous, connected, electrified and shared mobility2) Total Addressable Market 3) Not including market for batteries but hybrid solutions4) McKinsey estimates a market for digital services of US70$ - 110 billion in 2025;
FX rate assumption of 1.13 EUR/USD
Shared Mobility
Sources: McKinsey and Continental estimates
Conference Presentation January 2018
EDMR – Equity and Debt Markets Relations 6
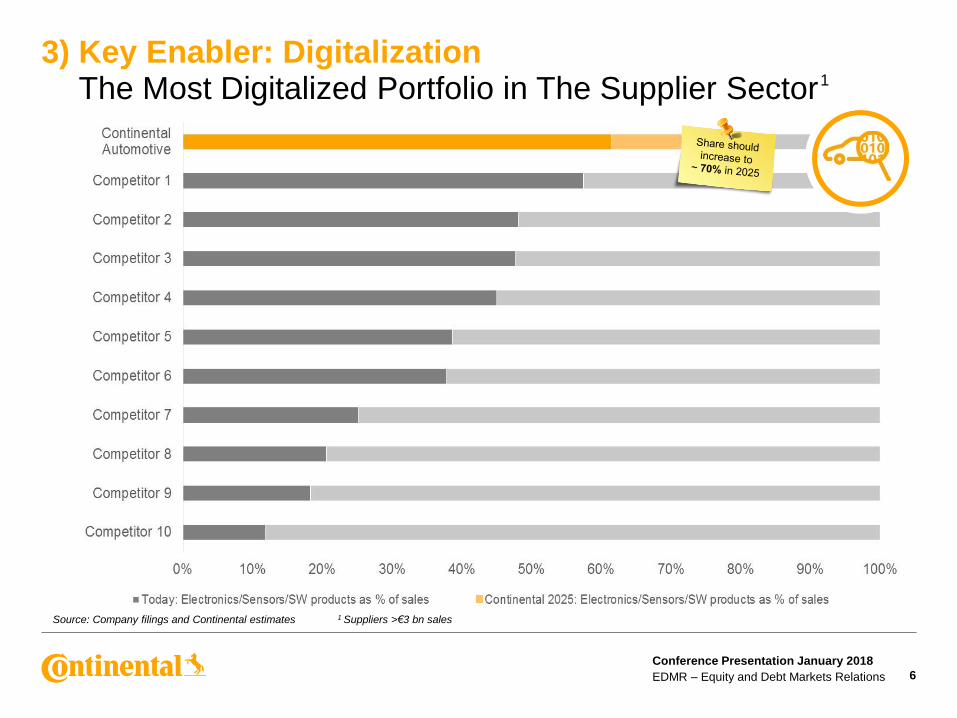
Source: Company filings and Continental estimates
3) Key Enabler: DigitalizationThe Most Digitalized Portfolio in The Supplier Sector 1
1 Suppliers >€3 bn sales
Conference Presentation January 2018
EDMR – Equity and Debt Markets Relations 7
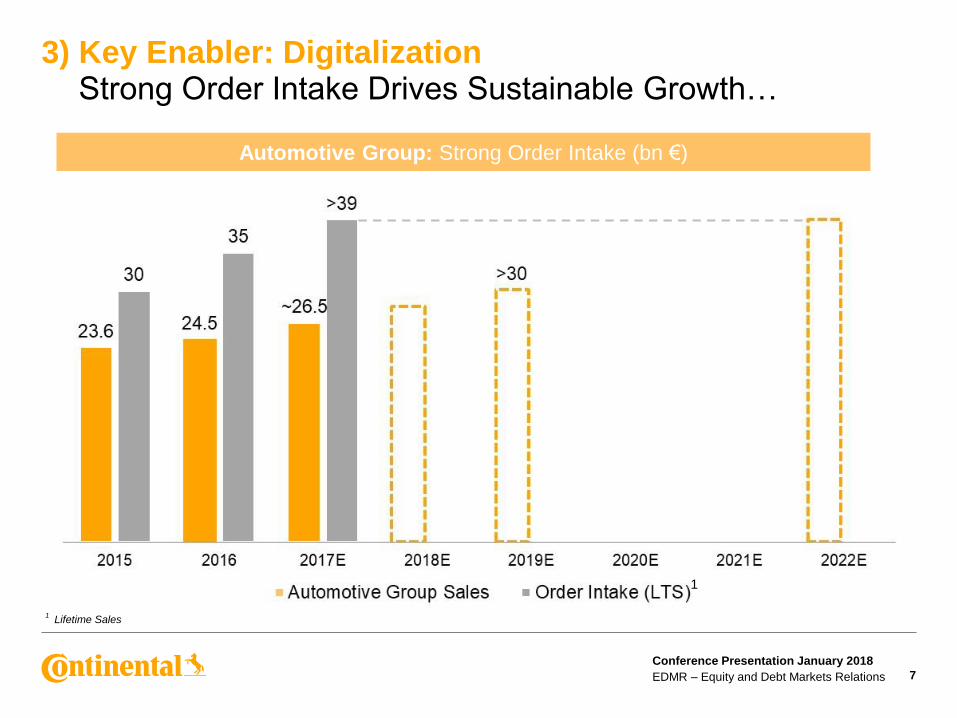
3) Key Enabler: DigitalizationStrong Order Intake Drives Sustainable Growth…
1Lifetime Sales
1
Automotive Group: Strong Order Intake (bn €)
Conference Presentation January 2018
EDMR – Equity and Debt Markets Relations
Automotive Group Capex (mn €)
8
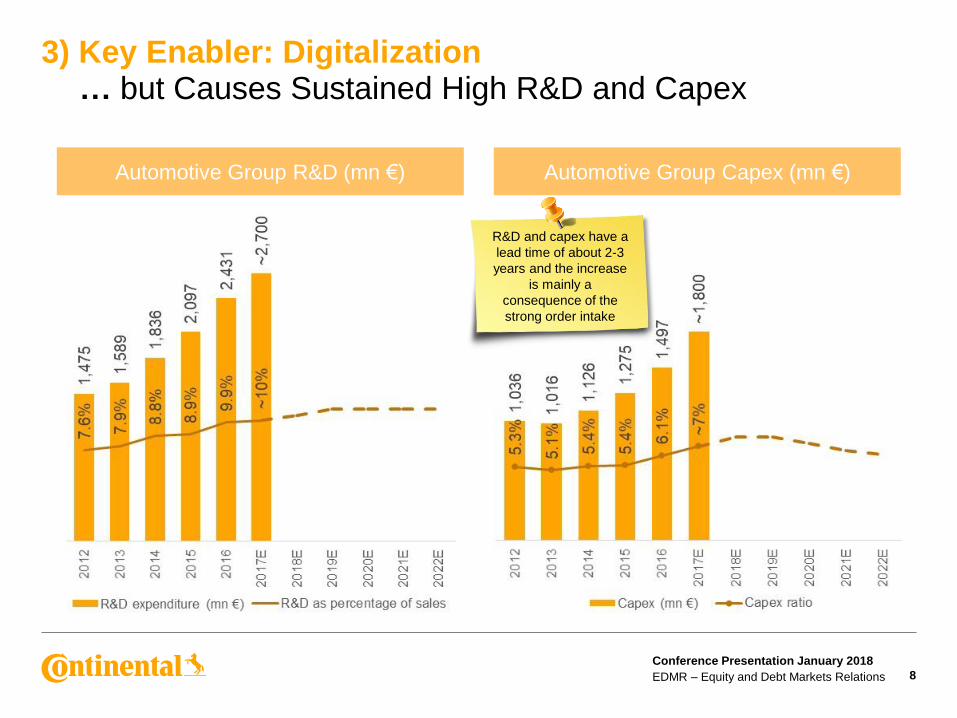
3) Key Enabler: Digitalization … but Causes Sustained High R&D and Capex
Automotive Group R&D (mn €)
R&D and capex have a
lead time of about 2-3
years and the increase
is mainly a
consequence of the
strong order intake
Conference Presentation January 2018
EDMR – Equity and Debt Markets Relations 9
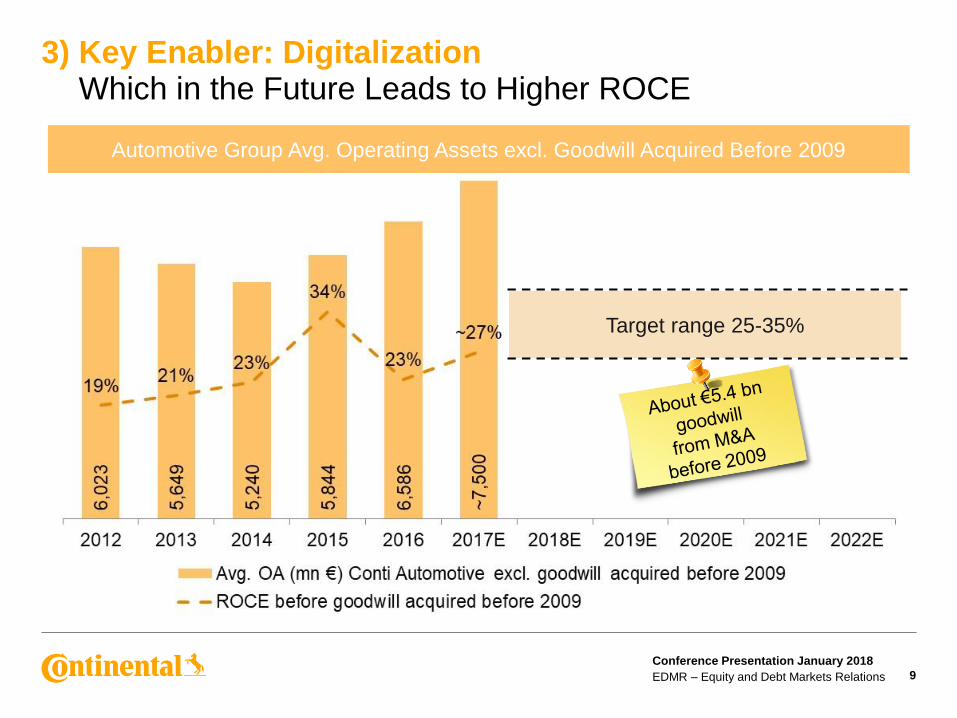
3) Key Enabler: DigitalizationWhich in the Future Leads to Higher ROCE
Automotive Group Avg. Operating Assets excl. Goodwill Acquired Before 2009
Target range 25-35%
Conference Presentation January 2018
EDMR – Equity and Debt Markets Relations 10
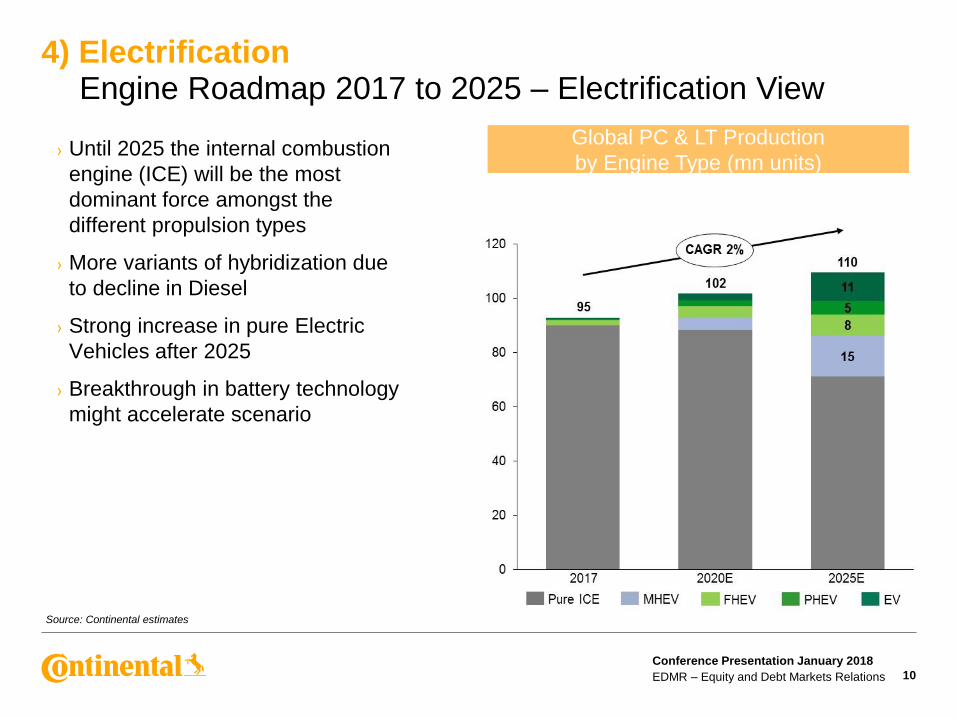
4) ElectrificationEngine Roadmap 2017 to 2025 – Electrification View
Source: Continental estimates
› Until 2025 the internal combustion
engine (ICE) will be the most
dominant force amongst the
different propulsion types
› More variants of hybridization due
to decline in Diesel
› Strong increase in pure Electric
Vehicles after 2025
› Breakthrough in battery technology
might accelerate scenario
Global PC & LT Production
by Engine Type (mn units)
Conference Presentation January 2018
EDMR – Equity and Debt Markets Relations 11
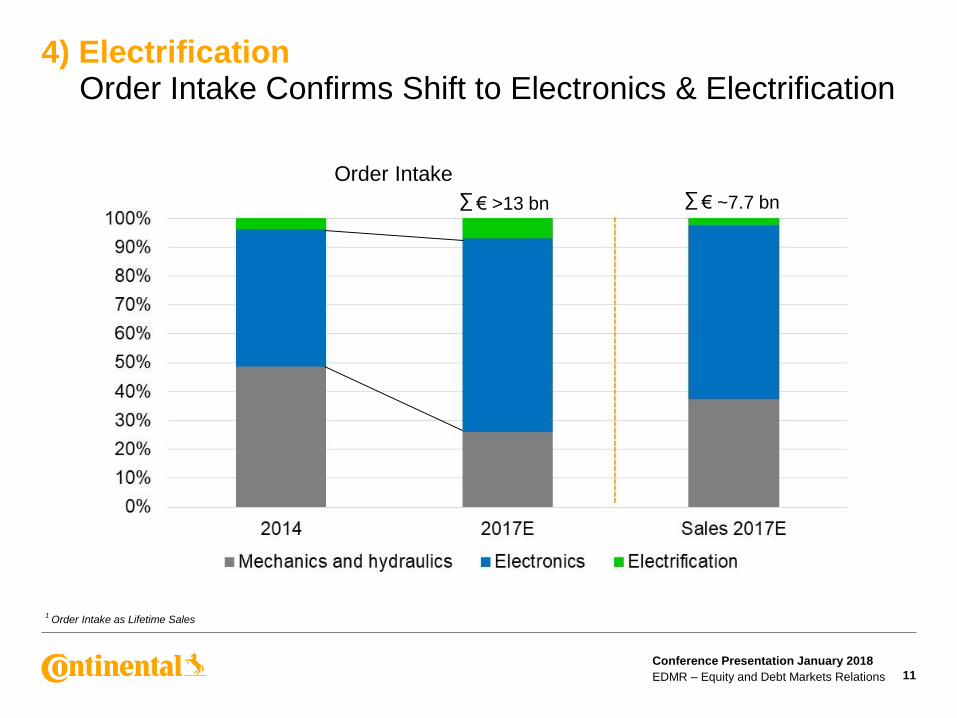
4) ElectrificationOrder Intake Confirms Shift to Electronics & Electrification
1Order Intake as Lifetime Sales
Order Intake
€ >13 bn∑ € ~7.7 bn∑
Conference Presentation January 2018
EDMR – Equity and Debt Markets Relations 12
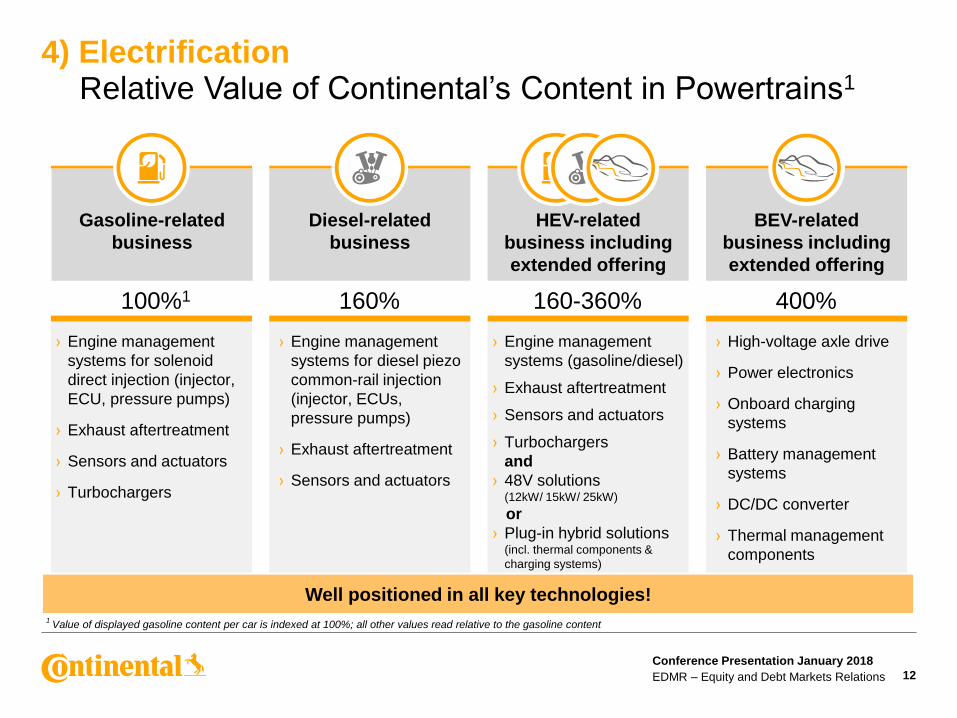
4) ElectrificationRelative Value of Continental’s Content in Powertrains1
HEV-related
business including
extended offering
Gasoline-related
business
Diesel-related
business
› Engine management
systems for diesel piezo
common-rail injection
(injector, ECUs,
pressure pumps)
› Exhaust aftertreatment
› Sensors and actuators
› Engine management
systems for solenoid
direct injection (injector,
ECU, pressure pumps)
› Exhaust aftertreatment
› Sensors and actuators
› Turbochargers
› Engine management
systems (gasoline/diesel)
› Exhaust aftertreatment
› Sensors and actuators
› Turbochargers
and
› 48V solutions (12kW/ 15kW/ 25kW)
or
› Plug-in hybrid solutions (incl. thermal components &
charging systems)
BEV-related
business including
extended offering
› High-voltage axle drive
› Power electronics
› Onboard charging
systems
› Battery management
systems
› DC/DC converter
› Thermal management
components
100%1 160% 160-360% 400%
1Value of displayed gasoline content per car is indexed at 100%; all other values read relative to the gasoline content
Well positioned in all key technologies!
Conference Presentation January 2018
EDMR – Equity and Debt Markets Relations 13
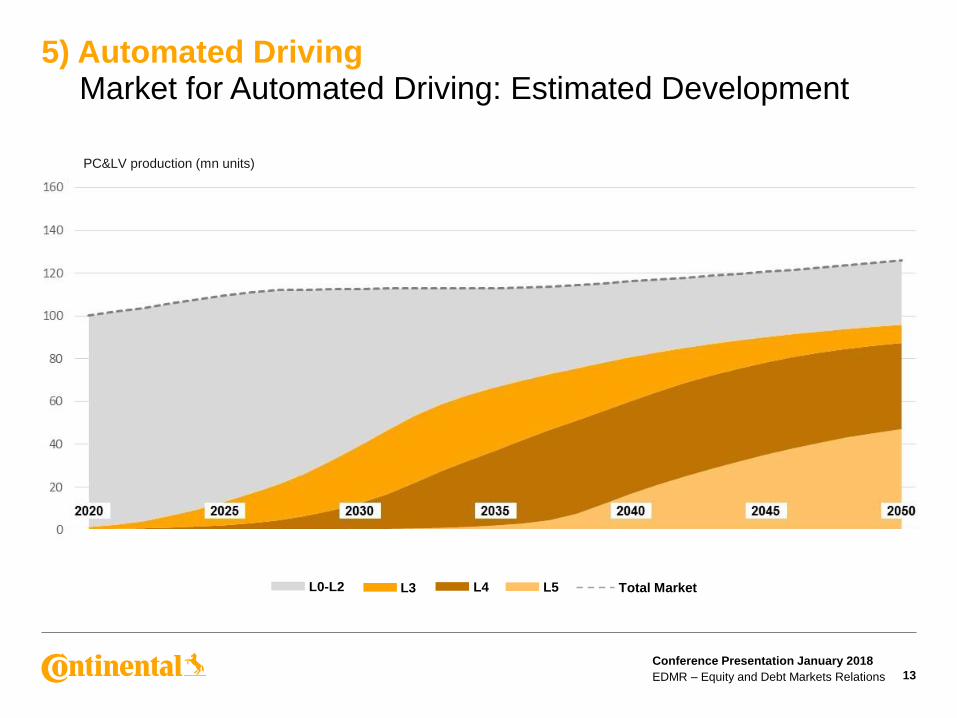
5) Automated DrivingMarket for Automated Driving: Estimated Development
L5L4L3L0-L2 Total Market
PC&LV production (mn units)
Conference Presentation January 2018
EDMR – Equity and Debt Markets Relations 14
1Source: Continental estimates
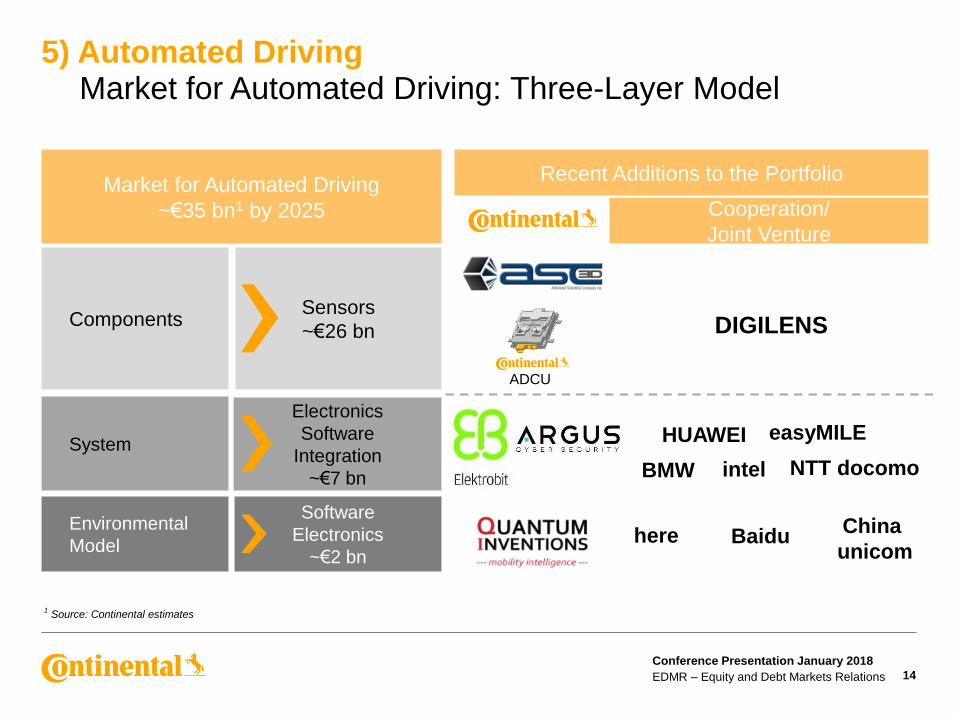
5) Automated DrivingMarket for Automated Driving: Three-Layer Model
System
Electronics
Software
Integration
~€7 bn
Environmental
Model
Software
Electronics
~€2 bn
Market for Automated Driving
~€35 bn1 by 2025
ComponentsSensors
~€26 bn
Cooperation/
Joint Venture
ADCU
Recent Additions to the Portfolio
DIGILENS
HUAWEI easyMILE
BMW intel NTT docomo
here BaiduChina
unicom
Conference Presentation January 2018
EDMR – Equity and Debt Markets Relations 15
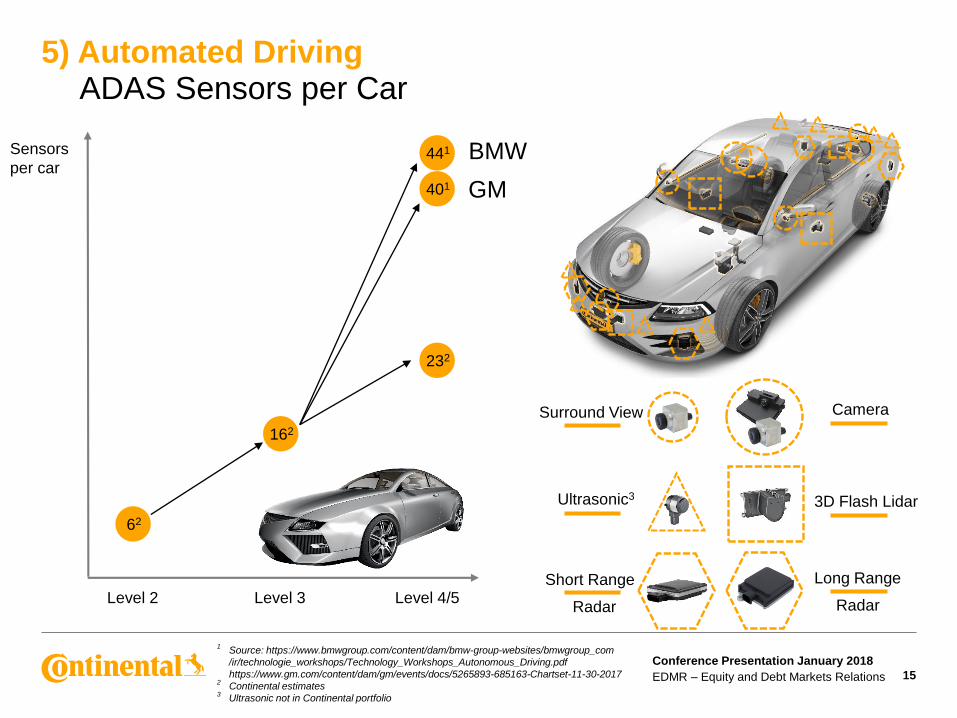
5) Automated DrivingADAS Sensors per Car
Sensors
per car
Short Range
Radar
Surround View
Ultrasonic3
Camera
3D Flash Lidar
Long Range
RadarLevel 4/5Level 3Level 2
441
401
232
162
62
1Source: https://www.bmwgroup.com/content/dam/bmw-group-websites/bmwgroup_com
/ir/technologie_workshops/Technology_Workshops_Autonomous_Driving.pdf
https://www.gm.com/content/dam/gm/events/docs/5265893-685163-Chartset-11-30-20172
Continental estimates3
Ultrasonic not in Continental portfolio
BMW
GM
Conference Presentation January 2018
EDMR – Equity and Debt Markets Relations 16
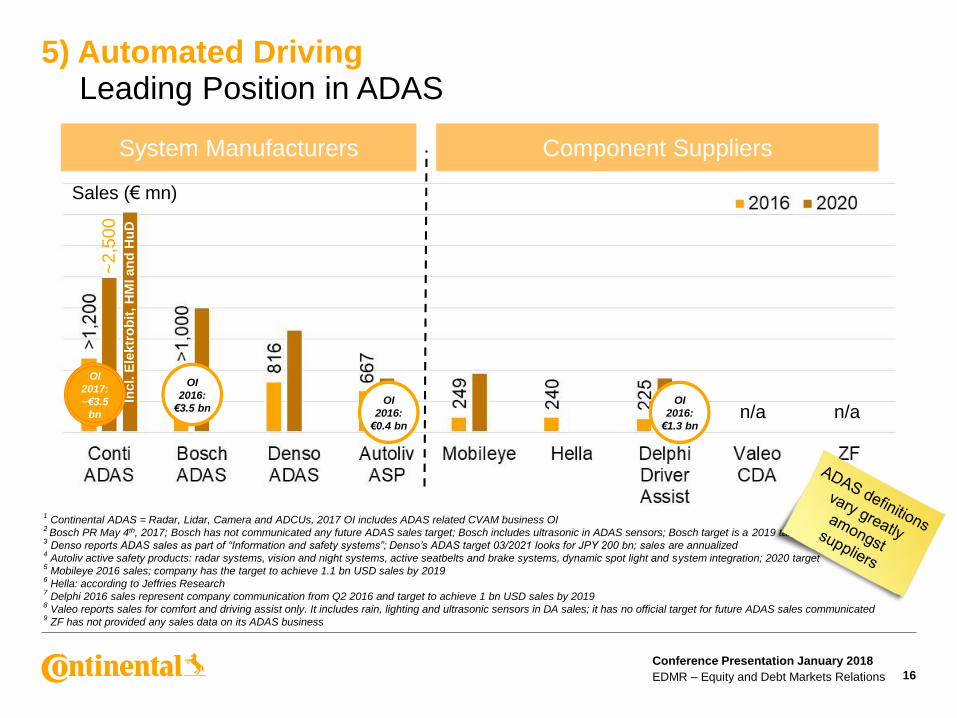
5) Automated DrivingLeading Position in ADAS
1Continental ADAS = Radar, Lidar, Camera and ADCUs, 2017 OI includes ADAS related CVAM business OI
2 Bosch PR May 4th, 2017; Bosch has not communicated any future ADAS sales target; Bosch includes ultrasonic in ADAS sensors; Bosch target is a 2019 target
3Denso reports ADAS sales as part of “Information and safety systems”; Denso’s ADAS target 03/2021 looks for JPY 200 bn; sales are annualized
4Autoliv active safety products: radar systems, vision and night systems, active seatbelts and brake systems, dynamic spot light and system integration; 2020 target
5Mobileye 2016 sales; company has the target to achieve 1.1 bn USD sales by 2019
6Hella: according to Jeffries Research
7Delphi 2016 sales represent company communication from Q2 2016 and target to achieve 1 bn USD sales by 2019
8Valeo reports sales for comfort and driving assist only. It includes rain, lighting and ultrasonic sensors in DA sales; it has no official target for future ADAS sales communicated
9ZF has not provided any sales data on its ADAS business
System Manufacturers Component Suppliers
OI
2017:
~€3.5
bn
OI
2016:
€3.5 bn
Sales (€ mn)
Incl. E
lektr
ob
it, H
MI an
d H
uD
n/a n/a
~2
,50
0
OI
2016:
€0.4 bn
OI
2016:
€1.3 bn
Conference Presentation January 2018
EDMR – Equity and Debt Markets Relations 17
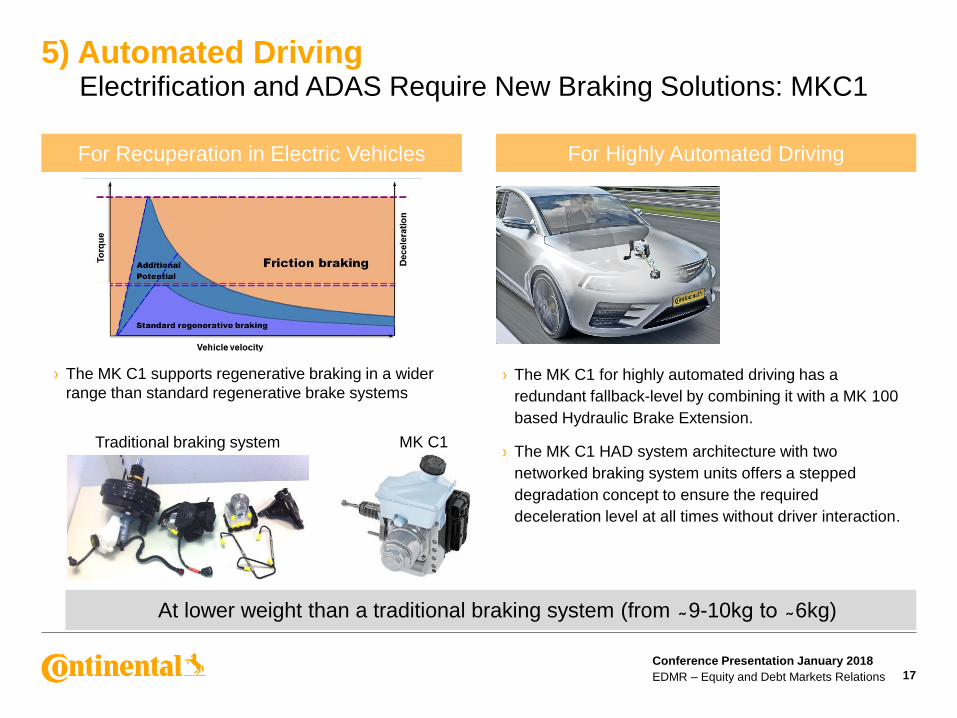
5) Automated DrivingElectrification and ADAS Require New Braking Solutions: MKC1
For Recuperation in Electric Vehicles For Highly Automated Driving
› The MK C1 for highly automated driving has a
redundant fallback-level by combining it with a MK 100
based Hydraulic Brake Extension.
› The MK C1 HAD system architecture with two
networked braking system units offers a stepped
degradation concept to ensure the required
deceleration level at all times without driver interaction.
At lower weight than a traditional braking system (from ̴ 9-10kg to ̴ 6kg)
› The MK C1 supports regenerative braking in a wider
range than standard regenerative brake systems
Traditional braking system MK C1
1
2
3
4
Conference Presentation January 2018
EDMR – Equity and Debt Markets Relations 18
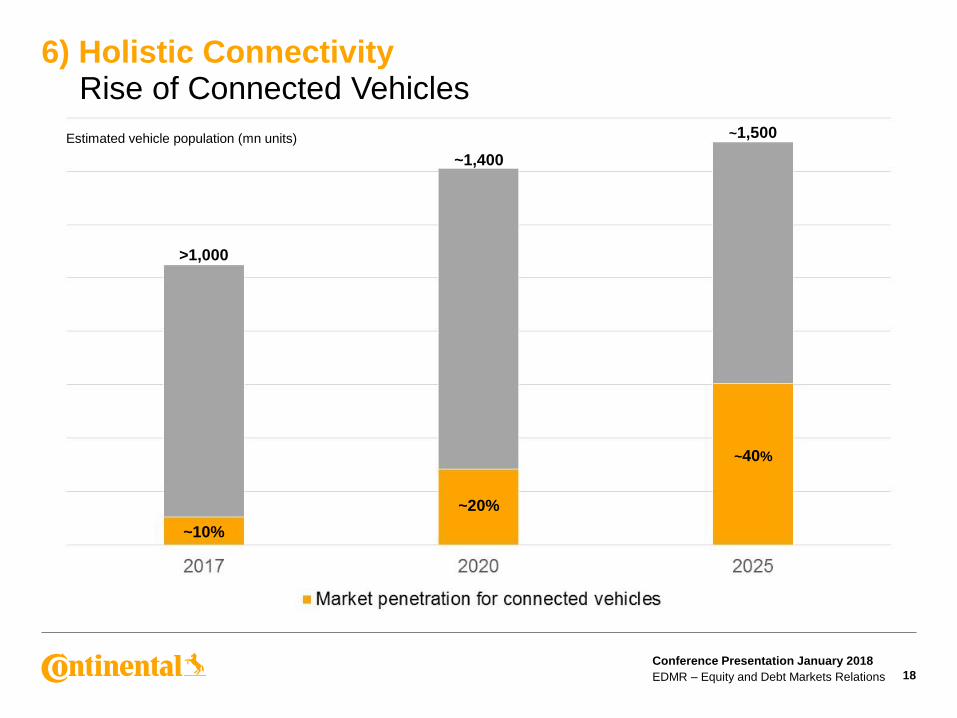
6) Holistic ConnectivityRise of Connected Vehicles
~10%
~20%
~40%
>1,000
~1,400
~1,500Estimated vehicle population (mn units)
Conference Presentation January 2018
EDMR – Equity and Debt Markets Relations 19
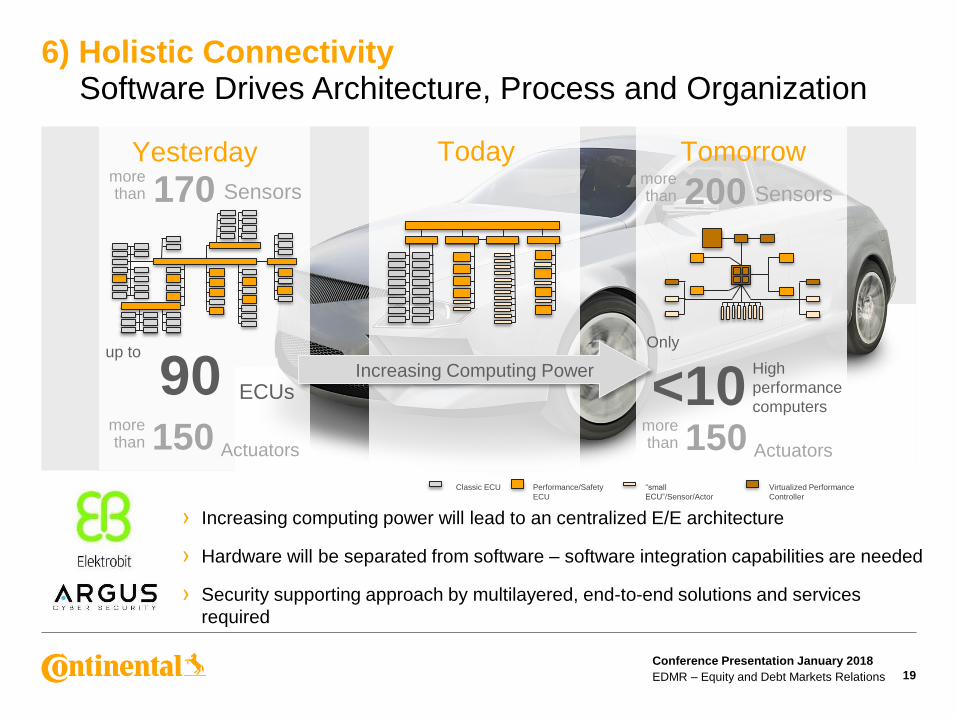
6) Holistic ConnectivitySoftware Drives Architecture, Process and Organization
morethan 170 Sensors
Actuators
morethan 150
Yesterday Today
up to
ECUs
› Increasing computing power will lead to an centralized E/E architecture
› Hardware will be separated from software – software integration capabilities are needed
› Security supporting approach by multilayered, end-to-end solutions and services
required
Classic ECU Performance/Safety
ECU
“small
ECU”/Sensor/Actor
Virtualized Performance
Controller
90 <10
morethan 200 Sensors
Actuators
morethan 150
Tomorrow
Only
High
performance
computers
Increasing Computing Power
Conference Presentation January 2018
EDMR – Equity and Debt Markets Relations 20
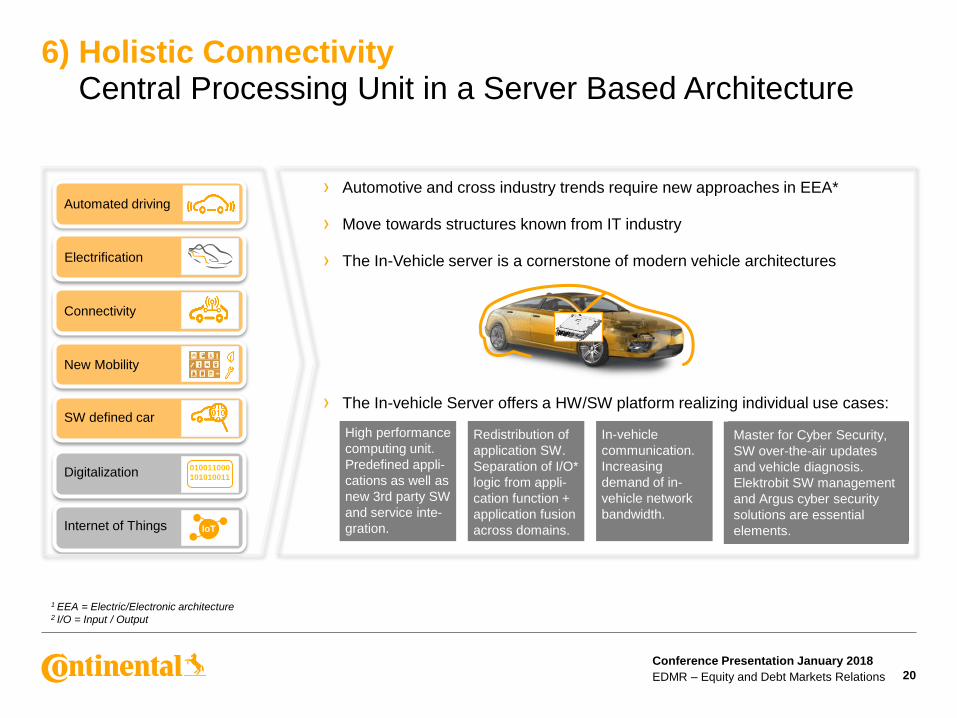
6) Holistic ConnectivityCentral Processing Unit in a Server Based Architecture
Automated driving
Electrification
Connectivity
New Mobility
010011000
101010011Digitalization
IoTInternet of Things
SW defined car
Master for Cyber Security,
SW over-the-air updates
and vehicle diagnosis.
Elektrobit SW management
and Argus cyber security
solutions are essential
elements.
› Automotive and cross industry trends require new approaches in EEA*
› Move towards structures known from IT industry
› The In-Vehicle server is a cornerstone of modern vehicle architectures
› The In-vehicle Server offers a HW/SW platform realizing individual use cases:
High performance
computing unit.
Predefined appli-
cations as well as
new 3rd party SW
and service inte-
gration.
Redistribution of
application SW.
Separation of I/O*
logic from appli-
cation function +
application fusion
across domains.
In-vehicle
communication.
Increasing
demand of in-
vehicle network
bandwidth.
1 EEA = Electric/Electronic architecture2 I/O = Input / Output
Conference Presentation January 2018
EDMR – Equity and Debt Markets Relations 21
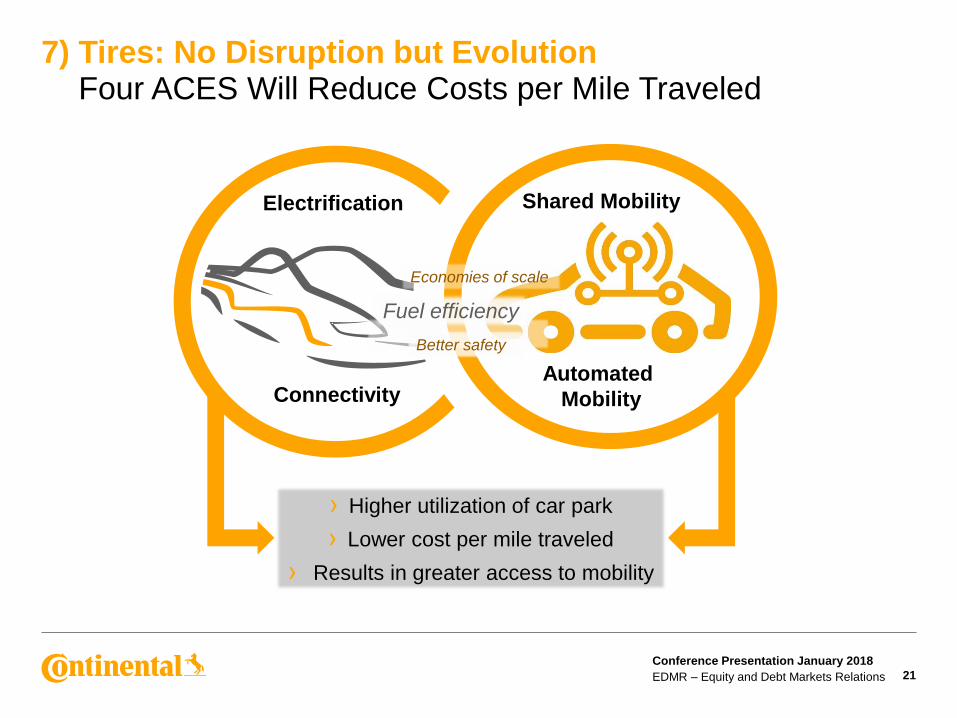
7) Tires: No Disruption but EvolutionFour ACES Will Reduce Costs per Mile Traveled
Shared Mobility
Automated
Mobility
Electrification
Connectivity
Better safety
Fuel efficiency
Economies of scale
› Higher utilization of car park
› Lower cost per mile traveled
› Results in greater access to mobility
Conference Presentation January 2018
EDMR – Equity and Debt Markets Relations 22
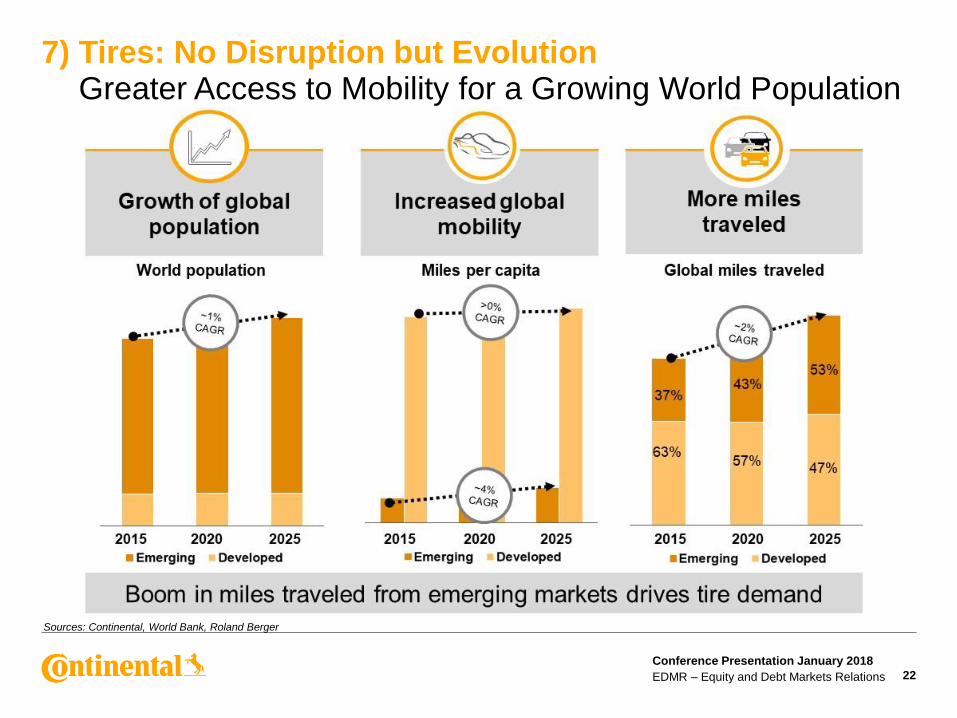
7) Tires: No Disruption but EvolutionGreater Access to Mobility for a Growing World Population
Sources: Continental, World Bank, Roland Berger
Conference Presentation January 2018
EDMR – Equity and Debt Markets Relations 23
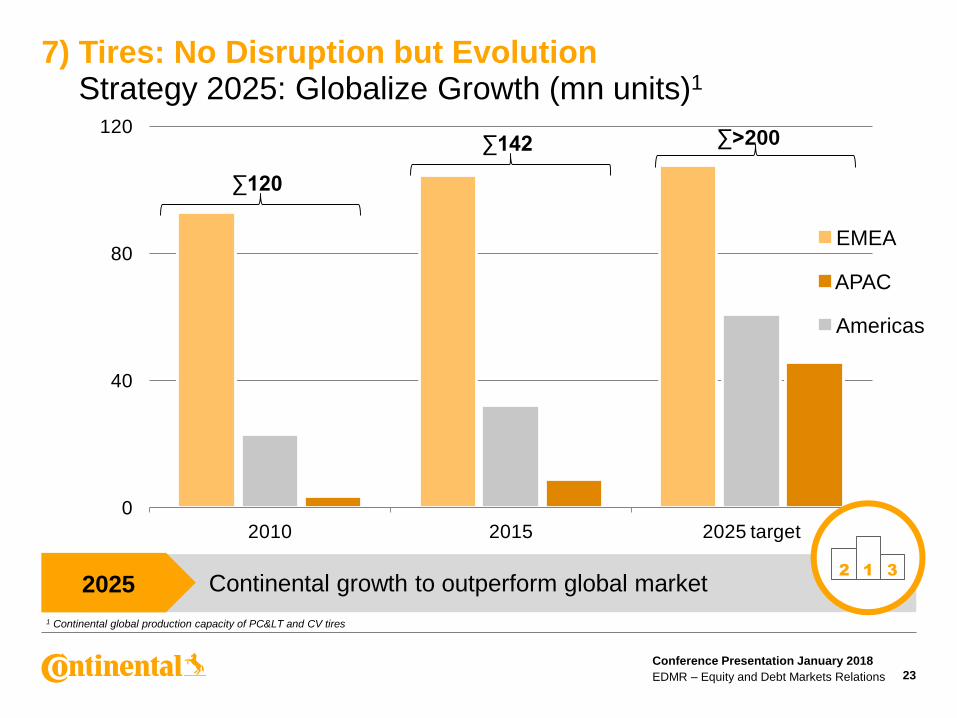
0
40
80
120
2010 2015 2025 target
2025 Continental growth to outperform global market2 1 3
APAC
Americas
EMEA
7) Tires: No Disruption but EvolutionStrategy 2025: Globalize Growth (mn units)1
∑120
∑142 ∑>200
1 Continental global production capacity of PC< and CV tires
Conference Presentation January 2018
EDMR – Equity and Debt Markets Relations 24
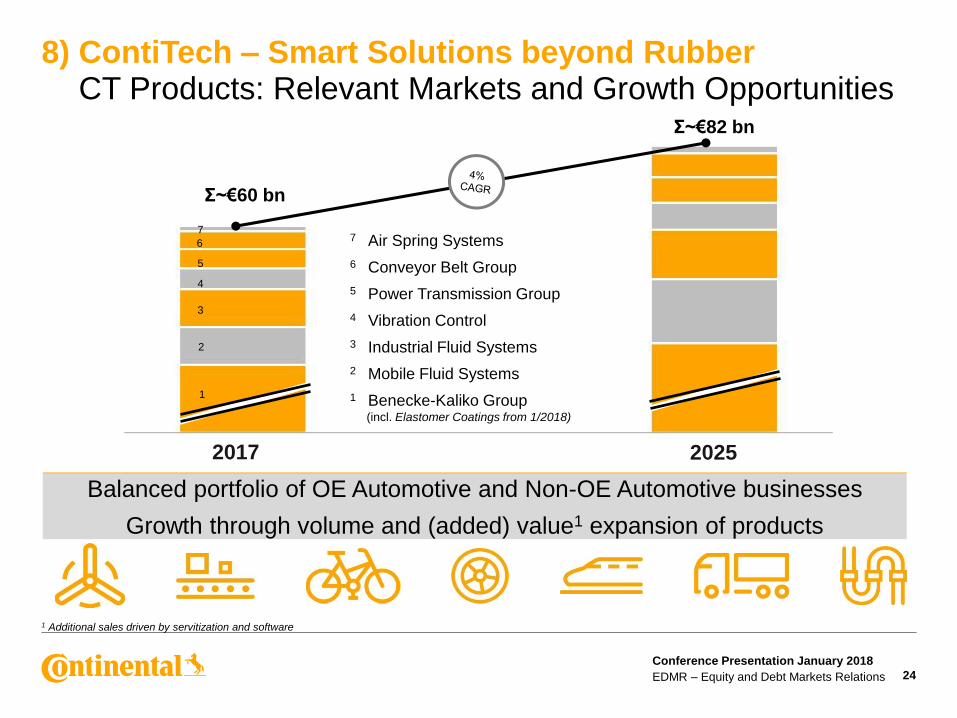
8) ContiTech – Smart Solutions beyond RubberCT Products: Relevant Markets and Growth Opportunities
Σ~€82 bn
Σ~€60 bn
1 Benecke-Kaliko Group (incl. Elastomer Coatings from 1/2018)
3 Industrial Fluid Systems
4 Vibration Control
5 Power Transmission Group
6 Conveyor Belt Group
7 Air Spring Systems
2 Mobile Fluid Systems
Balanced portfolio of OE Automotive and Non-OE Automotive businesses
Growth through volume and (added) value1 expansion of products
1
2
3
4
5
6
7
20252017
1 Additional sales driven by servitization and software
Conference Presentation January 2018
EDMR – Equity and Debt Markets Relations 25
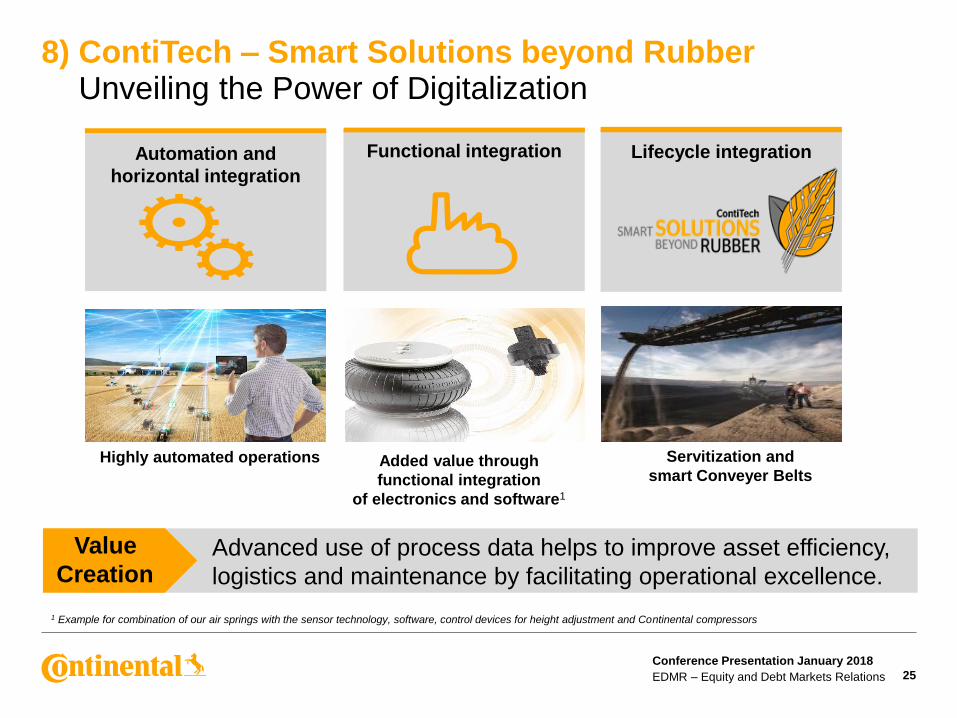
8) ContiTech – Smart Solutions beyond RubberUnveiling the Power of Digitalization
Value
CreationAdvanced use of process data helps to improve asset efficiency,
logistics and maintenance by facilitating operational excellence.
Servitization and
smart Conveyer BeltsAdded value through
functional integration
of electronics and software1
Highly automated operations
Automation and
horizontal integration
Functional integration Lifecycle integration
1 Example for combination of our air springs with the sensor technology, software, control devices for height adjustment and Continental compressors
Conference Presentation January 2018
EDMR – Equity and Debt Markets Relations 26
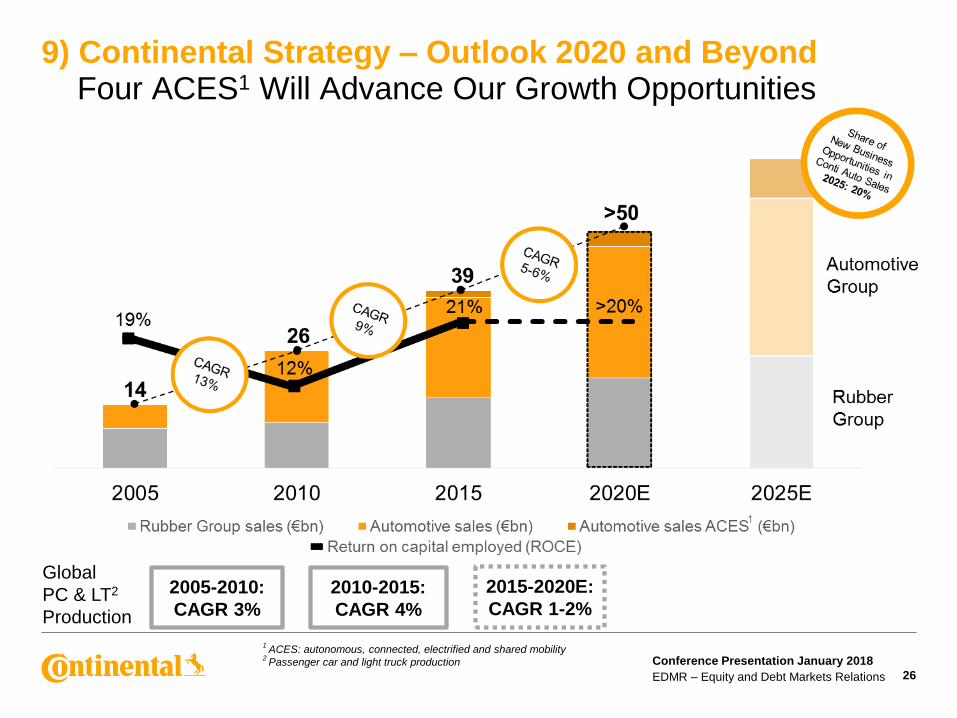
1 ACES: autonomous, connected, electrified and shared mobility
2 Passenger car and light truck production
2005-2010:
CAGR 3%
Global
PC & LT2
Production
9) Continental Strategy – Outlook 2020 and BeyondFour ACES1 Will Advance Our Growth Opportunities
2015-2020E:
CAGR 1-2%2010-2015:
CAGR 4%

Conference Presentation January 2018
EDMR – Equity and Debt Markets Relations 27
10) Outlook 2018PC & LT Production by Quarter1
1Source: IHS and own estimates, Europe excluding Kazakhstan and Uzbekistan
2016:
21.4
2017E:
22.0
2018E:
22.4
Europe (mn units)
2016:
17.8
2017E:
17.1
2018E:
16.8
North America (mn units)
2016:
27.1
2017E:
27.8
2018E:
27.9
China (mn units)
Q1 2018 blurred by
statistical effects
Conference Presentation January 2018
EDMR – Equity and Debt Markets Relations 28
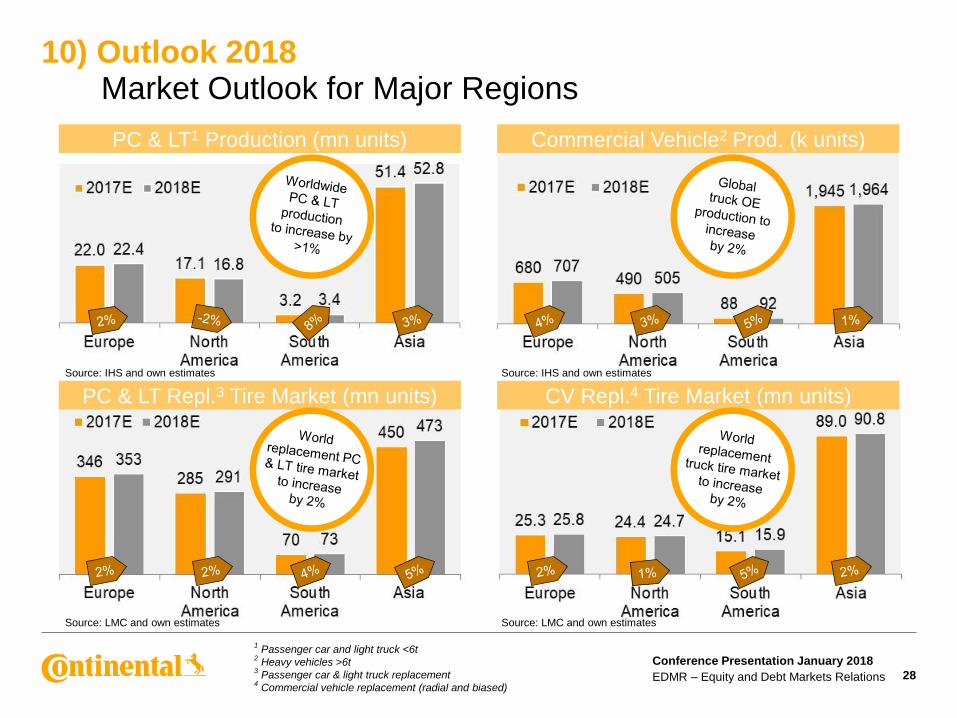
10) Outlook 2018Market Outlook for Major Regions
Commercial Vehicle2 Prod. (k units)
CV Repl.4 Tire Market (mn units)
Source: IHS and own estimates
Source: LMC and own estimates
Source: IHS and own estimates
PC & LT1 Production (mn units)
Source: LMC and own estimates
PC & LT Repl.3 Tire Market (mn units)
1Passenger car and light truck <6t
2Heavy vehicles >6t
3Passenger car & light truck replacement
4Commercial vehicle replacement (radial and biased)
Conference Presentation January 2018
EDMR – Equity and Debt Markets Relations
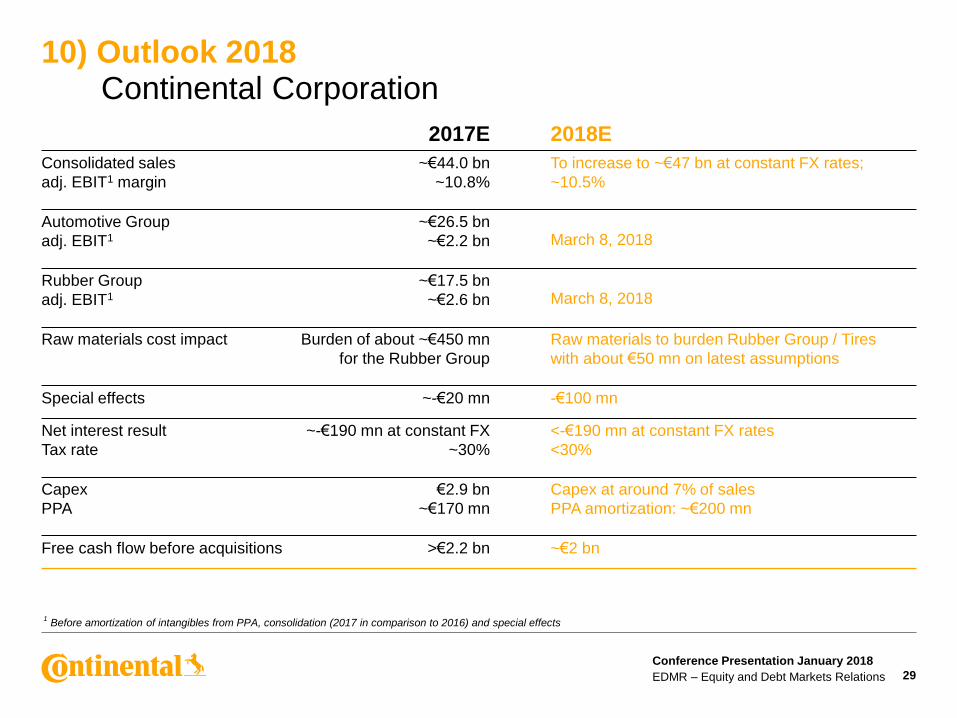
10) Outlook 2018Continental Corporation
1Before amortization of intangibles from PPA, consolidation (2017 in comparison to 2016) and special effects
29
2017E 2018E
Consolidated sales
adj. EBIT1 margin
~€44.0 bn
~10.8%
To increase to ~€47 bn at constant FX rates;
~10.5%
Automotive Group
adj. EBIT1
~€26.5 bn
~€2.2 bn March 8, 2018
Rubber Group
adj. EBIT1
~€17.5 bn
~€2.6 bn March 8, 2018
Raw materials cost impact Burden of about ~€450 mn
for the Rubber Group
Raw materials to burden Rubber Group / Tires
with about €50 mn on latest assumptions
Special effects ~-€20 mn -€100 mn
Net interest result
Tax rate
~-€190 mn at constant FX
~30%
<-€190 mn at constant FX rates
<30%
Capex
PPA
€2.9 bn
~€170 mn
Capex at around 7% of sales
PPA amortization: ~€200 mn
Free cash flow before acquisitions >€2.2 bn ~€2 bn
Conference Presentation January 2018
EDMR – Equity and Debt Markets Relations 30
Thank you!
Conference Presentation January 2018
EDMR – Equity and Debt Markets Relations 31
Disclaimer
› This presentation has been prepared by Continental Aktiengesellschaft solely in connection with the release of thepreliminary figures for fiscal 2017 on January 9, 2018, in Las Vegas and the subsequent conferences in New York,Detroit and Frankfurt in January 2018. It has not been independently verified. It does not constitute an offer, invitationor recommendation to purchase or subscribe for any shares or other securities issued by Continental AG or anysubsidiary and neither shall any part of it form the basis of, or be relied upon in connection with, any contract orcommitment concerning the purchase or sale of such shares or other securities whatsoever.
› Neither Continental Aktiengesellschaft nor any of its affiliates, advisors or representatives shall have any liabilitywhatsoever (in negligence or otherwise) for any loss that may arise from any use of this presentation or its contentsor otherwise arising in connection with this presentation.
› This presentation includes assumptions, estimates, forecasts and other forward-looking statements, includingstatements about our beliefs and expectations regarding future developments as well as their effect on the results ofContinental. These statements are based on plans, estimates and projections as they are currently available to themanagement of Continental. Therefore, these statements speak only as of the date they are made, and weundertake no obligation to update publicly any of them in light of new information or future events. Furthermore,although the management is of the opinion that these statements, and their underlying beliefs and expectations, arerealistic as of the date they are made, no guarantee can be given that the expected developments and effects willactually occur. Many factors may cause the actual development to be materially different from the expectationsexpressed here. Such factors include, for example and without limitation, changes in general economic and businessconditions, fluctuations in currency exchange rates or interest rates, the introduction of competing products, the lackof acceptance for new products or services and changes in business strategy.
› All statements with regard to markets or market position(s) of Continental or any of its competitors are estimates ofContinental based on data available to Continental. Such data are neither comprehensive nor independently verified.Consequently, the data used are not adequate for and the statements based on such data are not meant to be anaccurate or proper definition of regional and/or product markets or market shares of Continental and any of theparticipants in any market.
› Unless otherwise stated, all amounts are shown in millions of euro. Please note that differences may arise as a resultof the use of rounded amounts and percentages.
Conference Presentation January 2018
EDMR – Equity and Debt Markets Relations 32
Back-upPreliminary Figures for Fiscal 2017
and Outlook 2018
Conference Presentation January 2018
EDMR – Equity and Debt Markets Relations 33
AGENDA Back-up
Corporation Highlights 2017 1
2 14Opportunities and Challenges in 2018
3 Opportunities and Challenges in the Medium Term
4 Outlook

Conference Presentation January 2018
EDMR – Equity and Debt Markets Relations
1) Corporation Highlights 2017Most Important KPIs
34
FY 2017
› Sales up by >8% to ~€44.0 bn; organic sales growth at ~8%
› Adj. EBIT1 totaled >€4.7 bn; adj. EBIT1 margin ~10.8%
› Free cash flow before acquisitions amounted to >€2.2 bn, leading to a cash conversion2 of <75%
› Net debt <€2.2 bn; gearing ratio below 15% at YE 2017
› Order intake in the Automotive Group totaling more than €39 bn
Q4 2017
› Automotive Group organic sales growth >9%, around 8%-points above global PC< production
› Automotive Group adj. EBIT1 margin in Q4 2017 stood ~9%
› Winter tire sales up 5%; overall tire volumes in Q4 2017 up by 2% despite challenging comparables; volumes and improved PM drove Q4 sales and EBIT in the Tires division to prior year levels
1Before amortization of intangibles from PPA, consolidation and special effects
2Cash flow before financing activities and acquisitions divided by net income attributable to the shareholders of the parent
Conference Presentation January 2018
EDMR – Equity and Debt Markets Relations
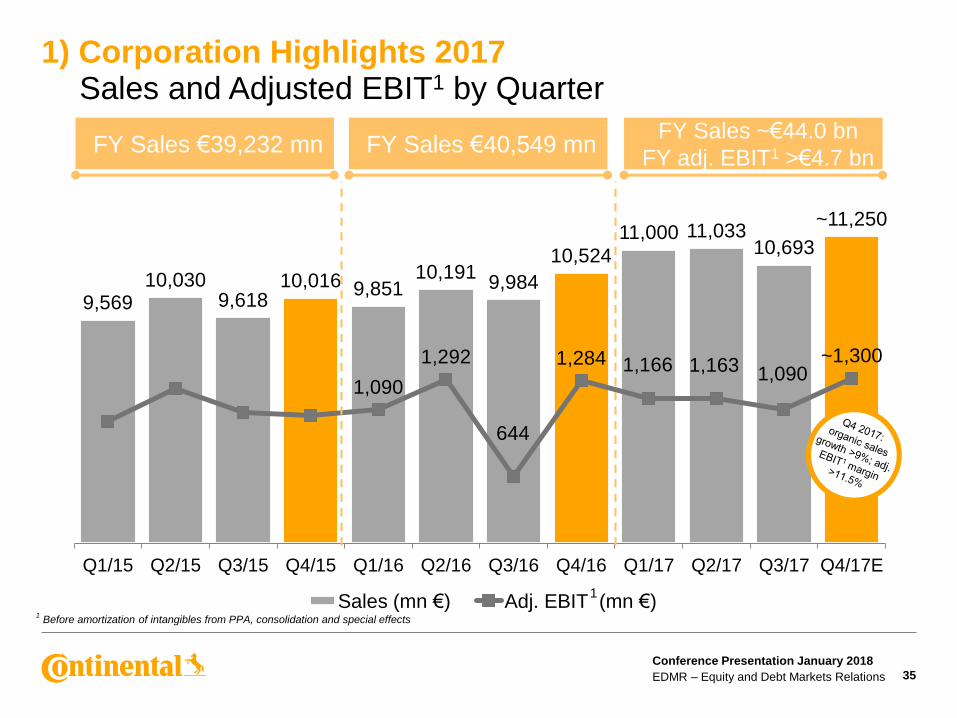
9,56910,030
9,61810,016 9,851
10,1919,984
10,524
11,000 11,03310,693
~11,250
1,090
1,292
644
1,284 1,166 1,163 1,090~1,300
Q1/15 Q2/15 Q3/15 Q4/15 Q1/16 Q2/16 Q3/16 Q4/16 Q1/17 Q2/17 Q3/17 Q4/17E
Sales (mn €) Adj. EBIT (mn €)
1) Corporation Highlights 2017 Sales and Adjusted EBIT1 by Quarter
35
FY Sales €39,232 mn
1Before amortization of intangibles from PPA, consolidation and special effects
FY Sales ~€44.0 bn
FY adj. EBIT1 >€4.7 bn
1
FY Sales €40,549 mn
Conference Presentation January 2018
EDMR – Equity and Debt Markets Relations
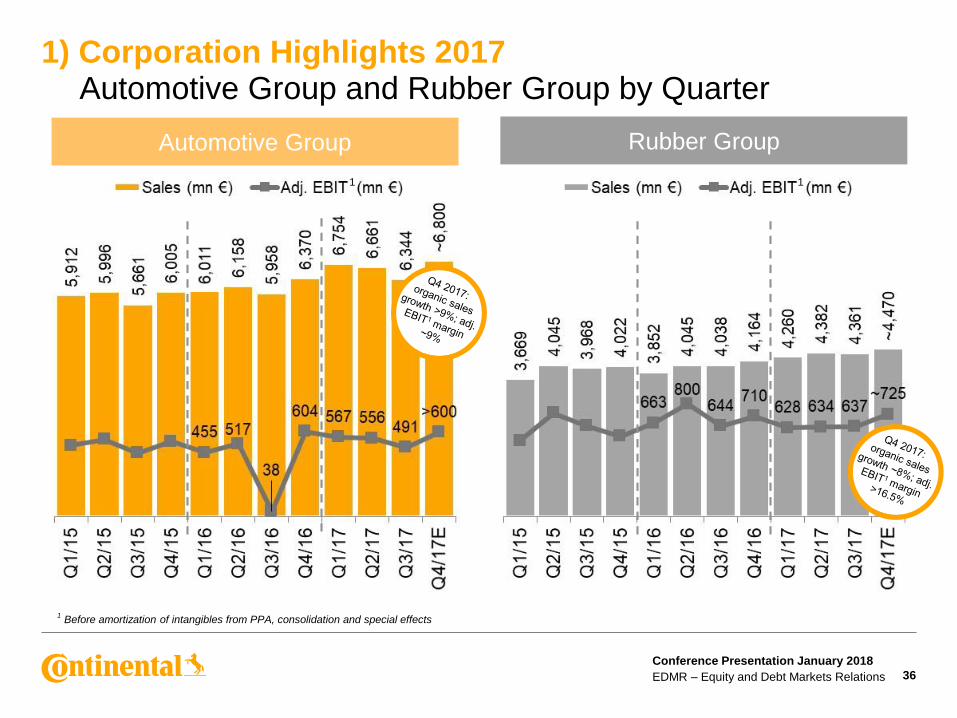
1) Corporation Highlights 2017Automotive Group and Rubber Group by Quarter
36
Automotive Group Rubber Group
1Before amortization of intangibles from PPA, consolidation and special effects
1 1
Conference Presentation January 2018
EDMR – Equity and Debt Markets Relations 37
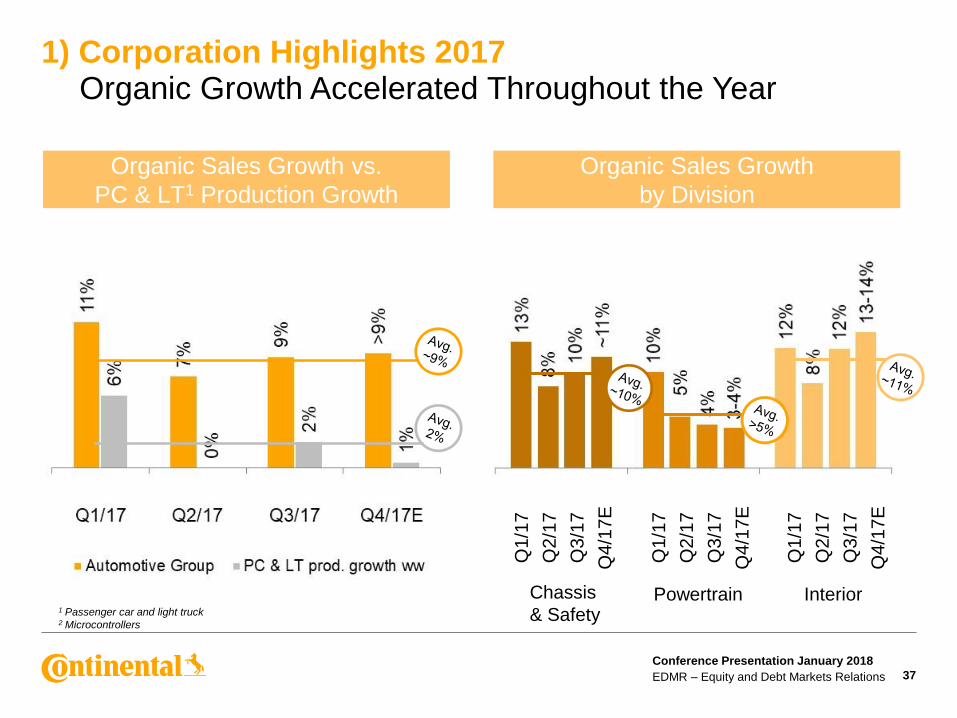
1) Corporation Highlights 2017 Organic Growth Accelerated Throughout the Year
Organic Sales Growth vs.
PC & LT1 Production Growth
Organic Sales Growth
by Division
Chassis
& SafetyPowertrain Interior
1 Passenger car and light truck2 Microcontrollers
Q1
/17
Q2
/17
Q3
/17
Q4
/17
E
Q1/1
7
Q2
/17
Q3
/17
Q4
/17
E
Q1
/17
Q2
/17
Q3
/17
Q4
/17
E
Conference Presentation January 2018
EDMR – Equity and Debt Markets Relations 38
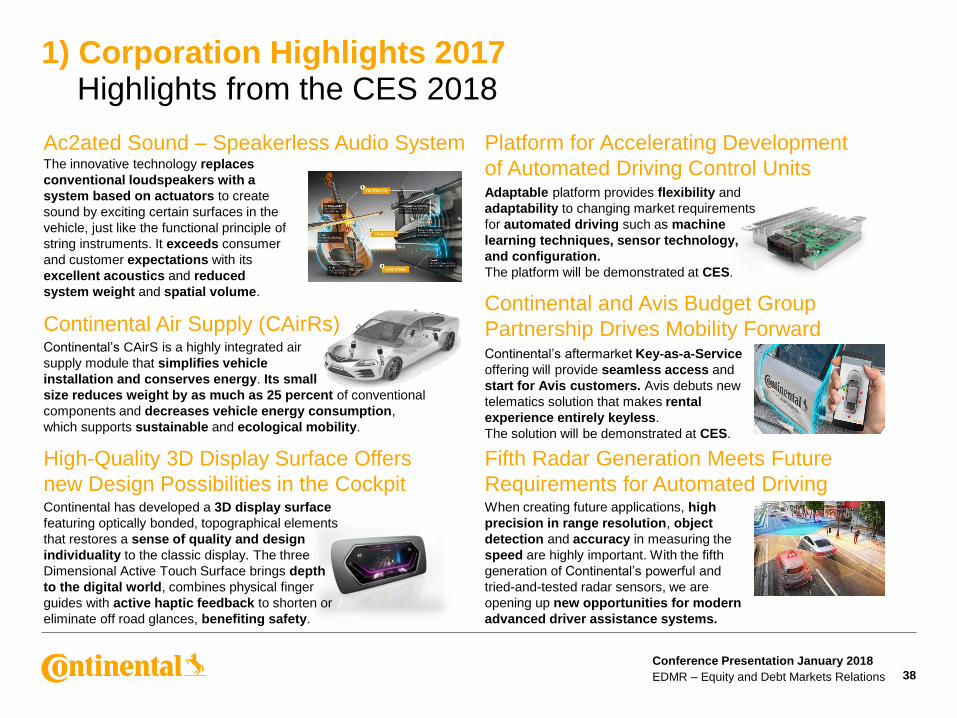
1) Corporation Highlights 2017 Highlights from the CES 2018
High-Quality 3D Display Surface Offers
new Design Possibilities in the CockpitContinental has developed a 3D display surface
featuring optically bonded, topographical elements
that restores a sense of quality and design
individuality to the classic display. The three
Dimensional Active Touch Surface brings depth
to the digital world, combines physical finger
guides with active haptic feedback to shorten or
eliminate off road glances, benefiting safety.
Continental’s aftermarket Key-as-a-Service
offering will provide seamless access and
start for Avis customers. Avis debuts new
telematics solution that makes rental
experience entirely keyless.
The solution will be demonstrated at CES.
Continental and Avis Budget Group
Partnership Drives Mobility Forward
Ac2ated Sound – Speakerless Audio SystemThe innovative technology replaces
conventional loudspeakers with a
system based on actuators to create
sound by exciting certain surfaces in the
vehicle, just like the functional principle of
string instruments. It exceeds consumer
and customer expectations with its
excellent acoustics and reduced
system weight and spatial volume.
Platform for Accelerating Development
of Automated Driving Control UnitsAdaptable platform provides flexibility and
adaptability to changing market requirements
for automated driving such as machine
learning techniques, sensor technology,
and configuration.
The platform will be demonstrated at CES.
Continental Air Supply (CAirRs)Continental’s CAirS is a highly integrated air
supply module that simplifies vehicle
installation and conserves energy. Its small
size reduces weight by as much as 25 percent of conventional
components and decreases vehicle energy consumption,
which supports sustainable and ecological mobility.
Fifth Radar Generation Meets Future
Requirements for Automated DrivingWhen creating future applications, high
precision in range resolution, object
detection and accuracy in measuring the
speed are highly important. With the fifth
generation of Continental’s powerful and
tried-and-tested radar sensors, we are
opening up new opportunities for modern
advanced driver assistance systems.
Conference Presentation January 2018
EDMR – Equity and Debt Markets Relations
2) Opportunities and Challenges in 2018
39
› 2018
› European growth to more than compensate expected decline in North America
› China: expect increased volatility if no additional stimulus is provided
› Russia and Brazil to further recover from depressed levels
› ContiTech: oil and mining-related businesses to slowly recover
› Tires: raw materials will provide tailwind in H1 2018 but expect slight headwind for the year as a whole
› Medium Term
› Tire business to benefit further from mix improvement – industry capex in line with prior years despite rising demand
› Order intake supports Automotive Group growth
› Rising R&D expenses in Automotive, a consequence of successfully transforming the business towards electronics and software
› High growth combined with continuous investment in R&D will limit operating leverage in the next 12-18 month
› Regional sales and customer mix becoming more balanced
Conference Presentation January 2018
EDMR – Equity and Debt Markets Relations
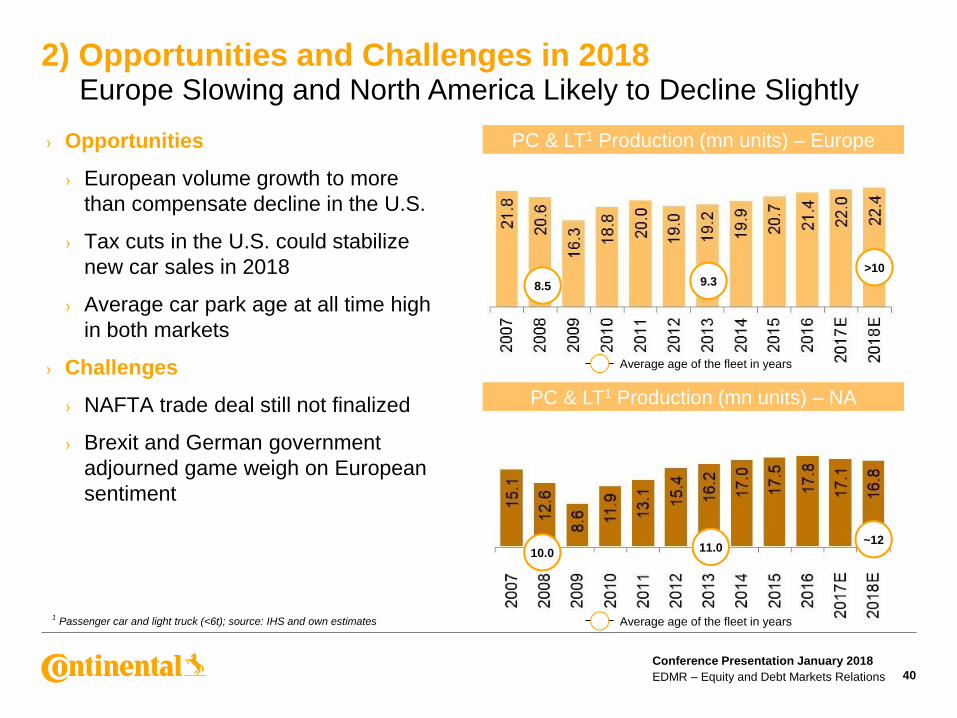
2) Opportunities and Challenges in 2018Europe Slowing and North America Likely to Decline Slightly
1Passenger car and light truck (<6t); source: IHS and own estimates
› Opportunities
› European volume growth to more
than compensate decline in the U.S.
› Tax cuts in the U.S. could stabilize
new car sales in 2018
› Average car park age at all time high
in both markets
› Challenges
› NAFTA trade deal still not finalized
› Brexit and German government
adjourned game weigh on European
sentiment
40
PC & LT1 Production (mn units) – NA
8.5 9.3>10
Average age of the fleet in years
10.0 11.0~12
Average age of the fleet in years
PC & LT1 Production (mn units) – Europe
Conference Presentation January 2018
EDMR – Equity and Debt Markets Relations
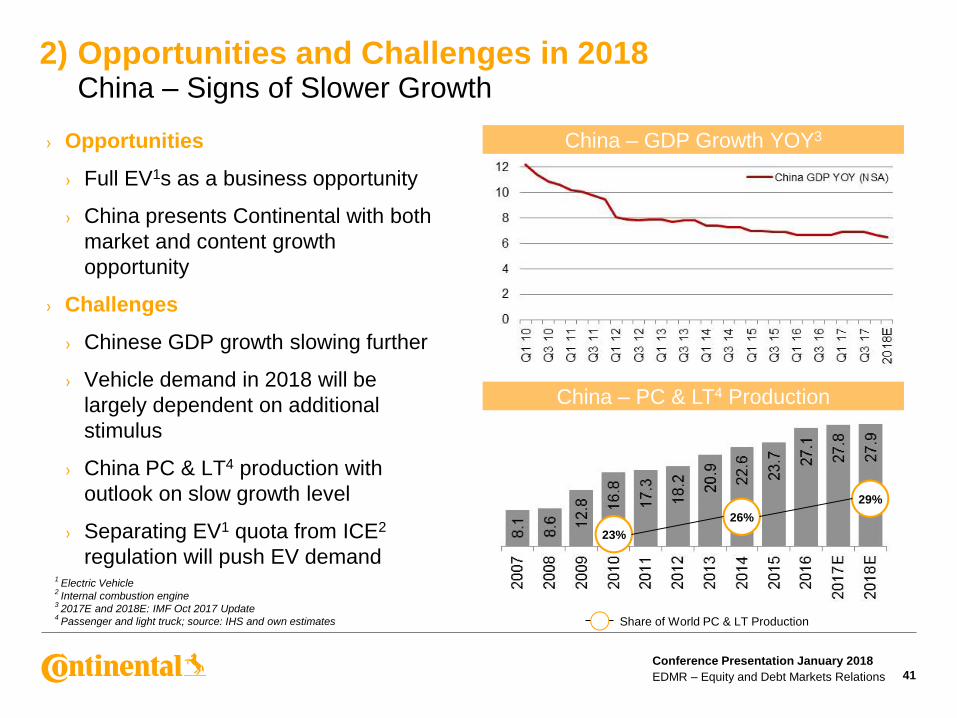
› Opportunities
› Full EV1s as a business opportunity
› China presents Continental with both
market and content growth
opportunity
› Challenges
› Chinese GDP growth slowing further
› Vehicle demand in 2018 will be
largely dependent on additional
stimulus
› China PC & LT4 production with
outlook on slow growth level
› Separating EV1 quota from ICE2
regulation will push EV demand
2) Opportunities and Challenges in 2018 China – Signs of Slower Growth
41
1Electric Vehicle
2Internal combustion engine
32017E and 2018E: IMF Oct 2017 Update
4Passenger and light truck; source: IHS and own estimates
China – GDP Growth YOY3
China – PC & LT4 Production
23%
26%
29%
Share of World PC & LT Production
Conference Presentation January 2018
EDMR – Equity and Debt Markets Relations
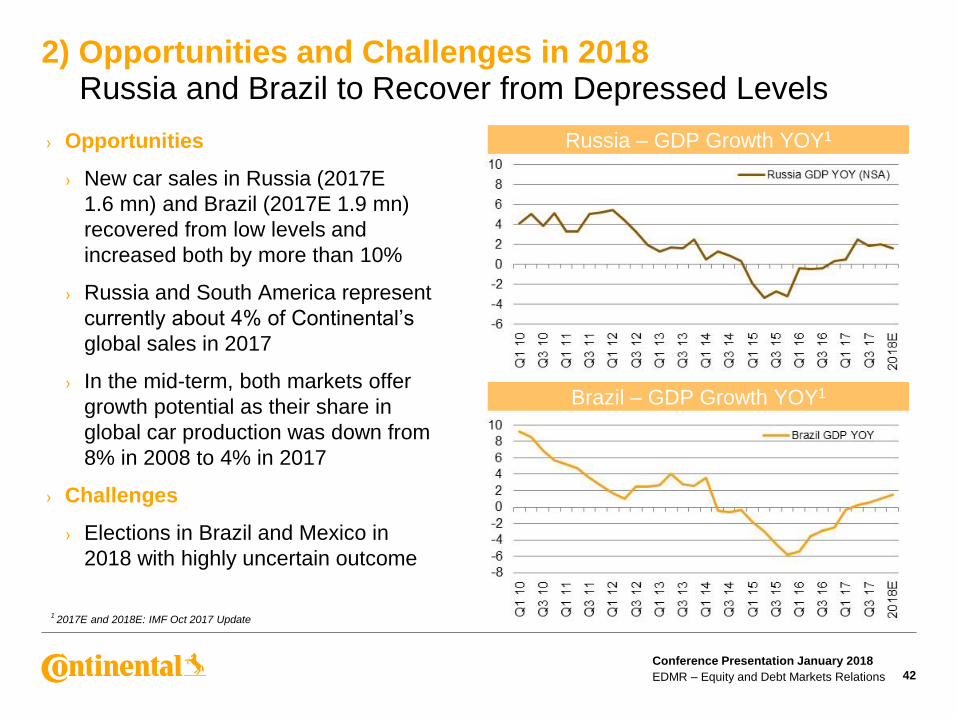
› Opportunities
› New car sales in Russia (2017E
1.6 mn) and Brazil (2017E 1.9 mn)
recovered from low levels and
increased both by more than 10%
› Russia and South America represent
currently about 4% of Continental’s
global sales in 2017
› In the mid-term, both markets offer
growth potential as their share in
global car production was down from
8% in 2008 to 4% in 2017
› Challenges
› Elections in Brazil and Mexico in
2018 with highly uncertain outcome
2) Opportunities and Challenges in 2018 Russia and Brazil to Recover from Depressed Levels
Brazil – GDP Growth YOY1
Russia – GDP Growth YOY1
1 2017E and 2018E: IMF Oct 2017 Update
42
Conference Presentation January 2018
EDMR – Equity and Debt Markets Relations
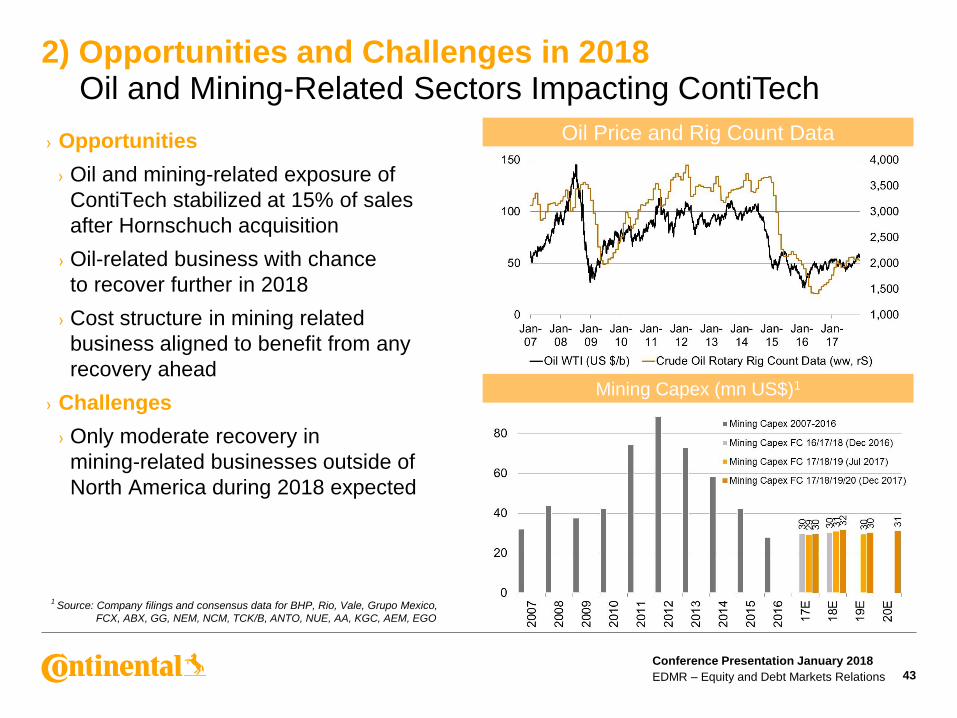
2) Opportunities and Challenges in 2018Oil and Mining-Related Sectors Impacting ContiTech
1Source: Company filings and consensus data for BHP, Rio, Vale, Grupo Mexico,
FCX, ABX, GG, NEM, NCM, TCK/B, ANTO, NUE, AA, KGC, AEM, EGO
43
Oil Price and Rig Count Data
Mining Capex (mn US$)1
› Opportunities
› Oil and mining-related exposure of
ContiTech stabilized at 15% of sales
after Hornschuch acquisition
› Oil-related business with chance
to recover further in 2018
› Cost structure in mining related
business aligned to benefit from any
recovery ahead
› Challenges
› Only moderate recovery in
mining-related businesses outside of
North America during 2018 expected
Conference Presentation January 2018
EDMR – Equity and Debt Markets Relations
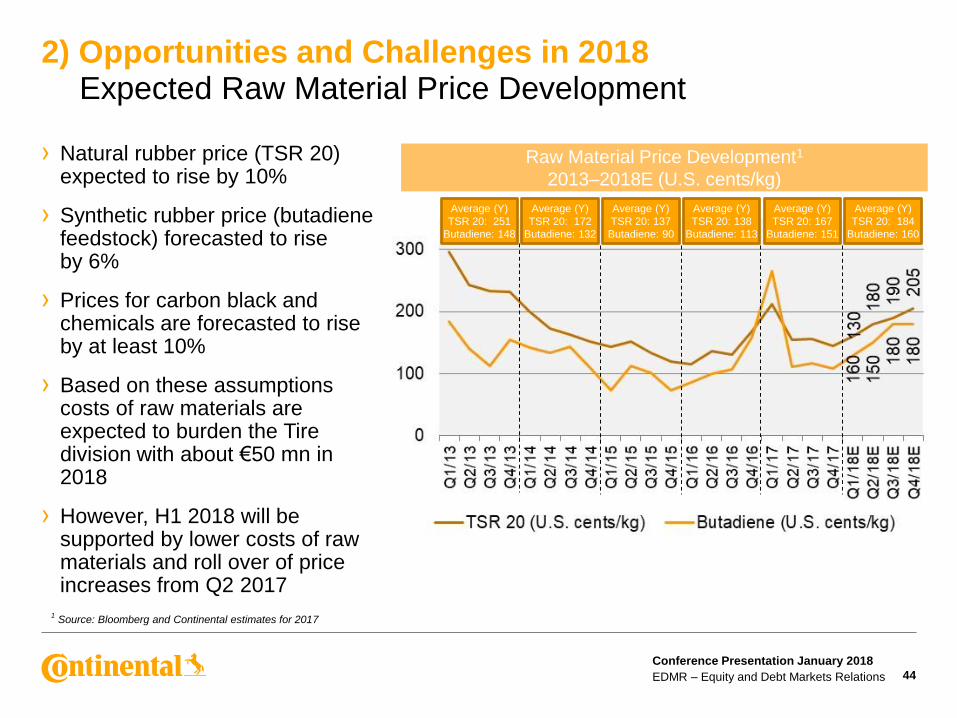
› Natural rubber price (TSR 20) expected to rise by 10%
› Synthetic rubber price (butadiene feedstock) forecasted to rise by 6%
› Prices for carbon black and chemicals are forecasted to rise by at least 10%
› Based on these assumptions costs of raw materials are expected to burden the Tire division with about €50 mn in 2018
› However, H1 2018 will be supported by lower costs of raw materials and roll over of price increases from Q2 2017
44
2) Opportunities and Challenges in 2018 Expected Raw Material Price Development
Raw Material Price Development1
2013–2018E (U.S. cents/kg)
1Source: Bloomberg and Continental estimates for 2017
Average (Y)
TSR 20: 251
Butadiene: 148
Average (Y)
TSR 20: 172
Butadiene: 132
Average (Y)
TSR 20: 137
Butadiene: 90
Average (Y)
TSR 20: 138
Butadiene: 113
Average (Y)
TSR 20: 167
Butadiene: 151
Average (Y)
TSR 20: 184
Butadiene: 160
Conference Presentation January 2018
EDMR – Equity and Debt Markets Relations
3) Opportunities and Challenges in the Medium Term
45
› 2018
› European growth to more than compensate North America decline
› China: expect increased volatility if no additional stimulus is provided
› Russia and Brazil to further recover from depressed levels
› ContiTech: oil and mining-related businesses to slowly recover
› Tires: raw materials will provide tailwind in H1 2018 but expect slight headwind for the year as a whole
› Medium Term
› Tire business to benefit further from mix improvement – industry capex in line with prior years despite rising demand
› Order intake supports Automotive Group growth
› Rising R&D expenses in Automotive, a consequence of successfully transforming the business towards electronics and software
› High growth combined with continuous investment in R&D will limit operating leverage in the next 12-18 months
› Regional sales and customer mix becoming more balanced
Conference Presentation January 2018
EDMR – Equity and Debt Markets Relations
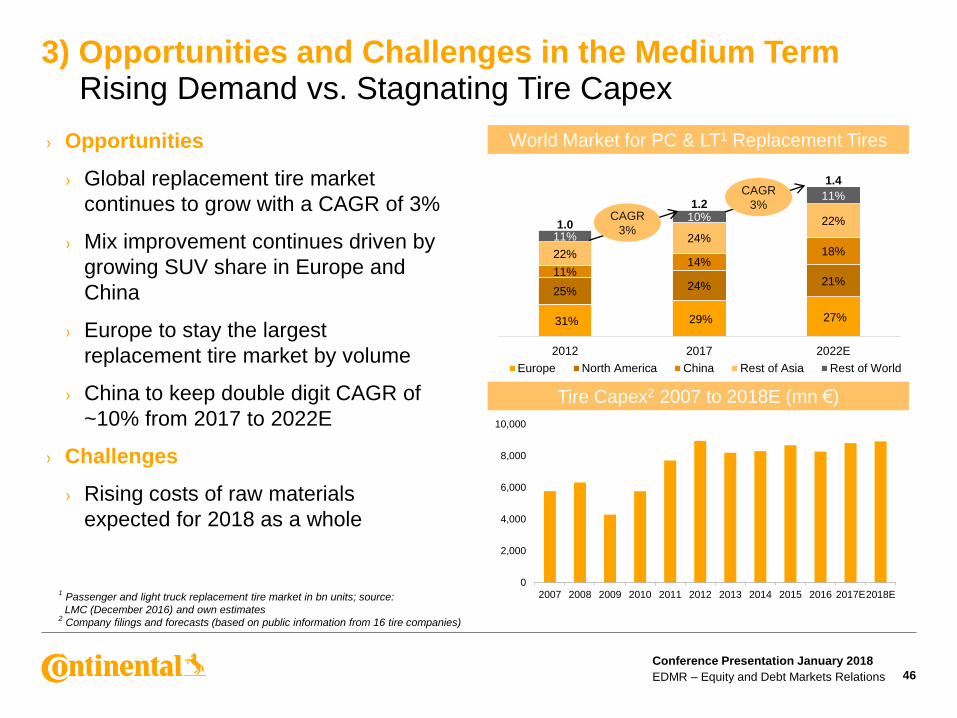
31% 29% 27%
25% 24% 21%11%
14%18%22%
24%
22%
11%
10%
11%
1.0
1.2
1.4
2012 2017 2022E
Europe North America China Rest of Asia Rest of World
› Opportunities
› Global replacement tire market
continues to grow with a CAGR of 3%
› Mix improvement continues driven by
growing SUV share in Europe and
China
› Europe to stay the largest
replacement tire market by volume
› China to keep double digit CAGR of
~10% from 2017 to 2022E
› Challenges
› Rising costs of raw materials
expected for 2018 as a whole
3) Opportunities and Challenges in the Medium Term Rising Demand vs. Stagnating Tire Capex
World Market for PC & LT1 Replacement Tires
Tire Capex2 2007 to 2018E (mn €)
CAGR
3%
CAGR
3%
1Passenger and light truck replacement tire market in bn units; source:
LMC (December 2016) and own estimates2
Company filings and forecasts (based on public information from 16 tire companies)
0
2,000
4,000
6,000
8,000
10,000
2007 2008 2009 2010 2011 2012 2013 2014 2015 2016 2017E2018E
46
Conference Presentation January 2018
EDMR – Equity and Debt Markets Relations
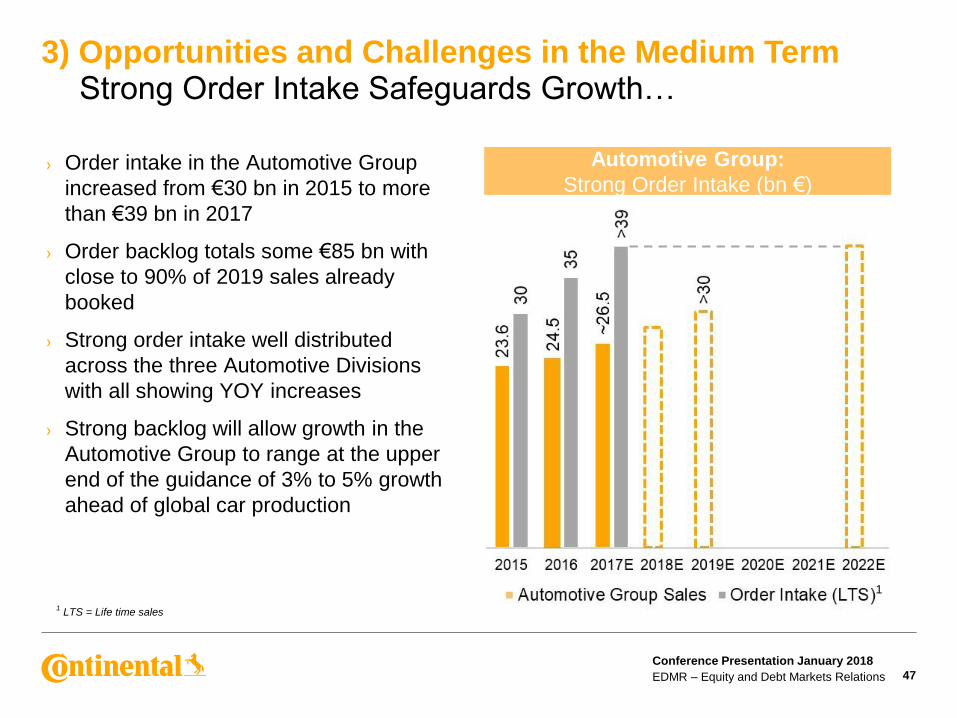
Automotive Group:
Strong Order Intake (bn €)
47
1LTS = Life time sales
3) Opportunities and Challenges in the Medium Term Strong Order Intake Safeguards Growth…
› Order intake in the Automotive Group
increased from €30 bn in 2015 to more
than €39 bn in 2017
› Order backlog totals some €85 bn with
close to 90% of 2019 sales already
booked
› Strong order intake well distributed
across the three Automotive Divisions
with all showing YOY increases
› Strong backlog will allow growth in the
Automotive Group to range at the upper
end of the guidance of 3% to 5% growth
ahead of global car production
1
Conference Presentation January 2018
EDMR – Equity and Debt Markets Relations
Automotive Group Capex (mn €)
48
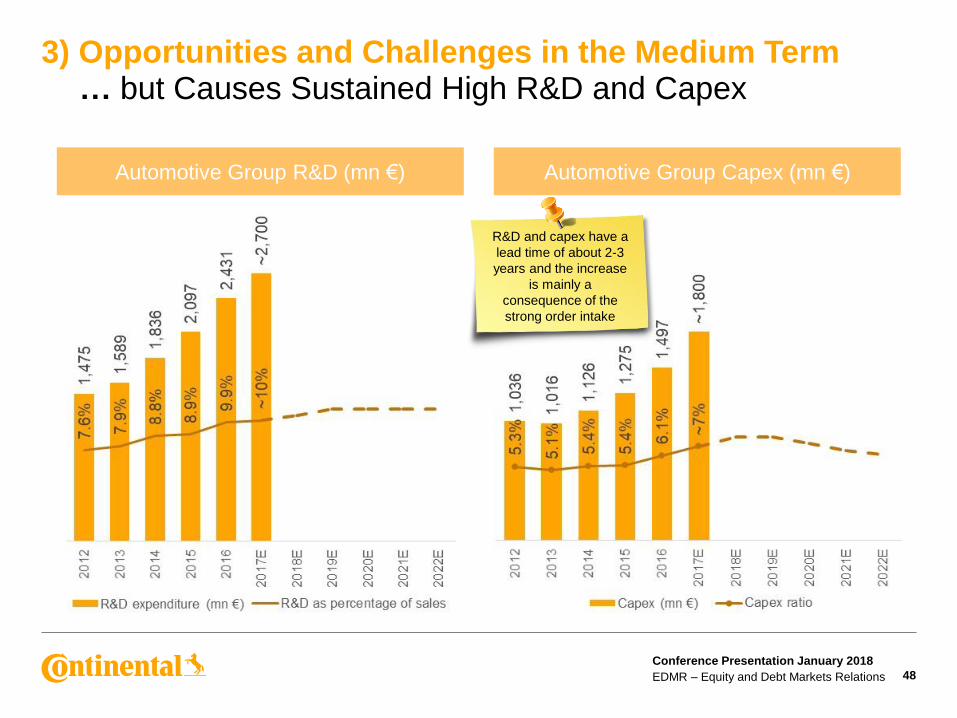
3) Opportunities and Challenges in the Medium Term … but Causes Sustained High R&D and Capex
Automotive Group R&D (mn €)
R&D and capex have a
lead time of about 2-3
years and the increase
is mainly a
consequence of the
strong order intake
Conference Presentation January 2018
EDMR – Equity and Debt Markets Relations
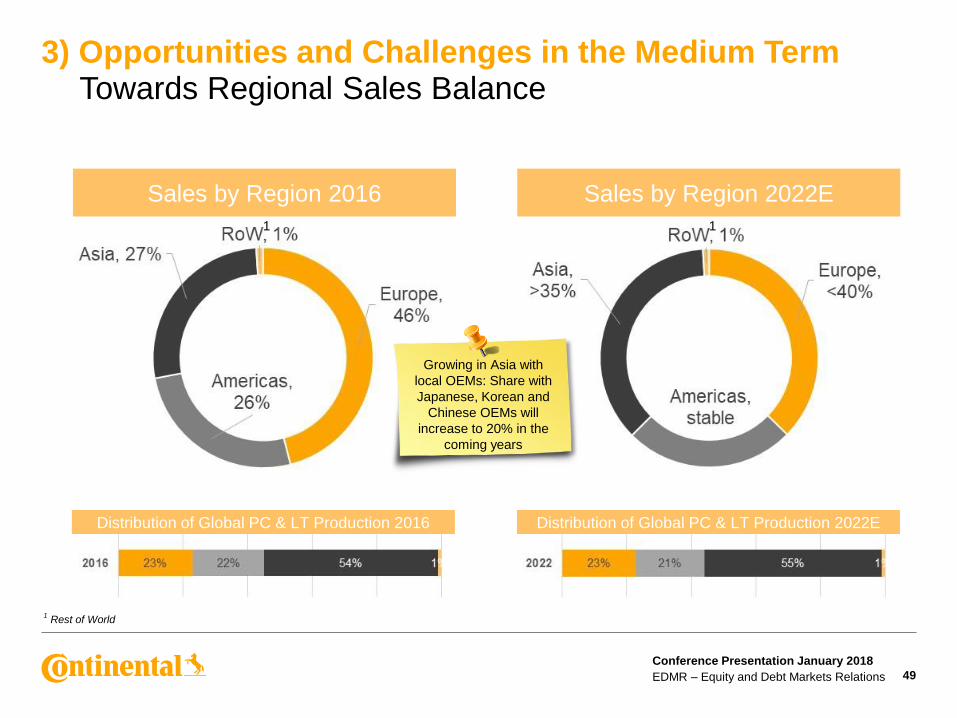
3) Opportunities and Challenges in the Medium Term Towards Regional Sales Balance
49
Sales by Region 2016
1Rest of World
Sales by Region 2022E
Distribution of Global PC & LT Production 2016 Distribution of Global PC & LT Production 2022E
Growing in Asia with
local OEMs: Share with
Japanese, Korean and
Chinese OEMs will
increase to 20% in the
coming years
1 1
Conference Presentation January 2018
EDMR – Equity and Debt Markets Relations 50
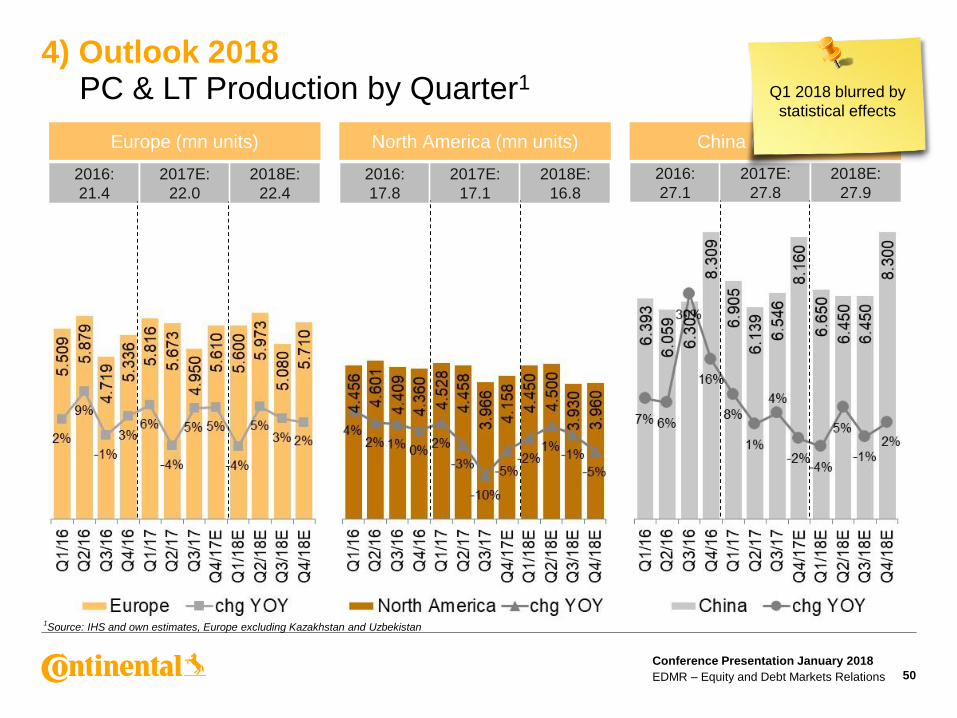
4) Outlook 2018PC & LT Production by Quarter1
1Source: IHS and own estimates, Europe excluding Kazakhstan and Uzbekistan
2016:
21.4
2017E:
22.0
2018E:
22.4
Europe (mn units)
2016:
17.8
2017E:
17.1
2018E:
16.8
North America (mn units)
2016:
27.1
2017E:
27.8
2018E:
27.9
China (mn units)
Q1 2018 blurred by
statistical effects

Conference Presentation January 2018
EDMR – Equity and Debt Markets Relations 51
4) Outlook 2018Market Outlook for Major Regions
Commercial Vehicle2 Prod. (k units)
CV Repl.4 Tire Market (mn units)
Source: IHS and own estimates
Source: LMC and own estimates
Source: IHS and own estimates
PC & LT1 Production (mn units)
Source: LMC and own estimates
PC & LT Repl.3 Tire Market (mn units)
1Passenger car and light truck <6t
2Heavy vehicles >6t
3Passenger car & light truck replacement
4Commercial vehicle replacement (radial and biased)
Conference Presentation January 2018
EDMR – Equity and Debt Markets Relations
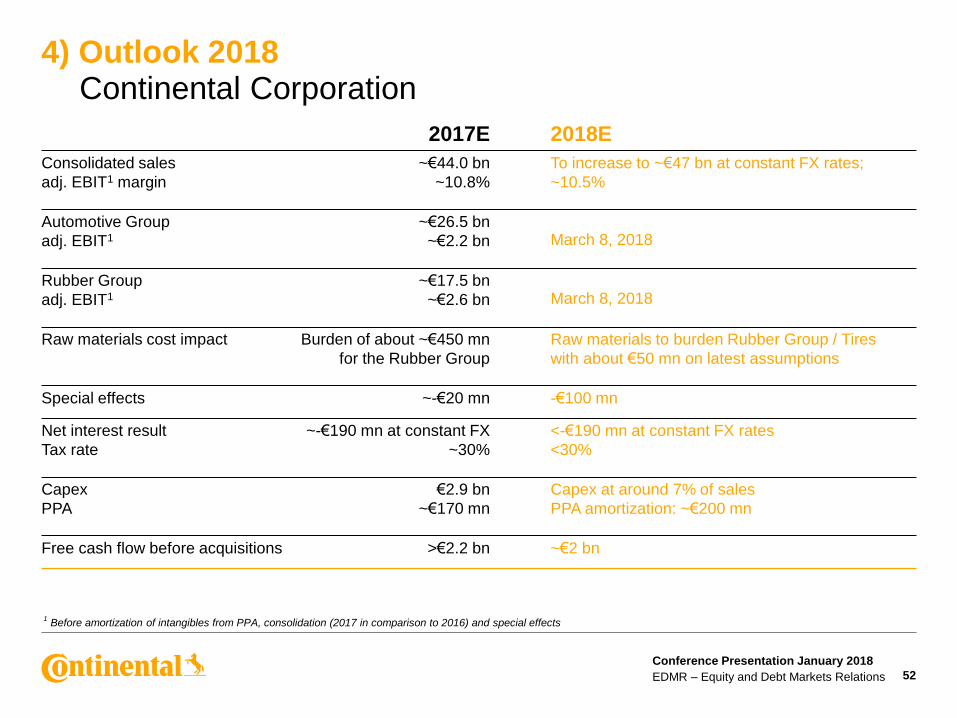
4) Outlook 2018Continental Corporation
1Before amortization of intangibles from PPA, consolidation (2017 in comparison to 2016) and special effects
52
2017E 2018E
Consolidated sales
adj. EBIT1 margin
~€44.0 bn
~10.8%
To increase to ~€47 bn at constant FX rates;
~10.5%
Automotive Group
adj. EBIT1
~€26.5 bn
~€2.2 bn March 8, 2018
Rubber Group
adj. EBIT1
~€17.5 bn
~€2.6 bn March 8, 2018
Raw materials cost impact Burden of about ~€450 mn
for the Rubber Group
Raw materials to burden Rubber Group / Tires
with about €50 mn on latest assumptions
Special effects ~-€20 mn -€100 mn
Net interest result
Tax rate
~-€190 mn at constant FX
~30%
<-€190 mn at constant FX rates
<30%
Capex
PPA
€2.9 bn
~€170 mn
Capex at around 7% of sales
PPA amortization: ~€200 mn
Free cash flow before acquisitions >€2.2 bn ~€2 bn