establishment of genetically encoded h2o2 probes and...
TRANSCRIPT
Professur für Biochemie und Molekularbiologie
Establishment of genetically encoded H2O2 probes
and dynamic measurements of H2O2 levels in the
malaria parasite Plasmodium falciparum
Inaugural-Dissertation
zur Erlangung des akademischen Grades
Doktor der Naturwissenschaften
– Dr. rer. nat. –
im Fachbereich Biologie und Chemie
der Justus-Liebig-Universität Gießen
vorgelegt von
Dipl. Biol. Mahsa Rahbari
aus Aachen
September 2017
08 Fall
Erstgutachterin: Prof. Dr. med. Katja Becker
Professur für Biochemie und Molekularbiologie
Institut für Ernährungswissenschaften
Justus-Liebig-Universität Gießen
Interdisziplinäres Forschungszentrum
Heinrich-Buff-Ring 26-32
35392 Gießen
Zweitgutachterin: Prof. Dr. Tina E. Trenczek
Professur für zelluläre Erkennungs- und Abwehrprozesse
Institut für Allgemeine und Spezielle Zoologie
Justus-Liebig-Universität Gießen
Stephanstraße 24
35390 Gießen
Weitere Mitglieder der Prüfungskommission:
Prof. Dr. Christoph Grevelding
Prof. Dr. Michael Kracht
Die vorliegende Arbeit wurde im Interdisziplinären Forschungszentrum der Justus-Liebig-Universität Gießen an der Professur für Biochemie und Molekularbiologie unter Leitung von Prof. Dr. Katja Becker angefertigt.

Dedicated to my family
It always seems impossible until it's done.
Nelson Mandela
You can do anything you set your mind to.
Benjamin Franklin
Erklärung
i
Erklärung
Ich erkläre: Ich habe die vorgelegte Dissertation selbständig und ohne unerlaubte fremde Hilfe und nur mit den Hilfen angefertigt, die ich in der Dissertation angegeben habe. Alle Textstellen, die wörtlich oder sinngemäß aus veröffentlichten Schriften entnommen sind, und alle Angaben, die auf mündlichen Auskünften beruhen, sind als solche kenntlich gemacht. Bei den von mir durchgeführten und in der Dissertation erwähnten Untersuchungen habe ich die Grundsätze guter wissenschaftlicher Praxis, wie sie in der „Satzung der Justus-Liebig-Universität Gießen zur Sicherung guter wissenschaftlicher Praxis“ niedergelegt sind, eingehalten. ________________________________ ________________________________ Mahsa Rahbari Ort, Datum
Danksagung
ii
Danksagung
Zunächst möchte ich mich ganz herzlich bei Prof. Dr. Katja Becker bedanken. Sie hat mir ermöglicht, meine Doktorarbeit im Gebiet der Malariaforschung anzufertigen und hat mir ein sehr spannendes und innovatives Projekt zur Verfügung gestellt. Ich bin sehr dankbar für ihre exzellente Betreuung und Unterstützung zu jeder Zeit und für das Ermöglichen von nationalen sowie internationalen Kollaborationen mit Auslandsforschungsarbeiten, die mich persönlich und beruflich bereichert haben. Ich möchte mich auch bei Prof. Tina E. Trenczek für die Übernahme der Zweitbetreuung und ihrem Interesse an dieser Arbeit bedanken. Ich danke Franziska Mohring für ihre Unterstützung im Labor bei allen kleinen und großen Fragen zu jeder Tageszeit. Bei Höhen und Tiefen im Laboralltag stand sie mir stets zur Seite. Zudem danke ich Katharina Schuh für ihre stetige Hilfsbereitschaft und Engagement im Labor während meiner Auslandsaufenthalte. Für ihre hervorragende Unterstützung im Labor danke ich auch Michaela Stumpf und Siegrid Franke, zum einen bei den endlosen Western Blots, zum anderen bei der Parasitenkultivierung und -Versorgung, vor allem bei meinen Auslandsaufenthalten. Ich möchte allen Mitgliedern der Arbeitsgruppe danken, die zu einer sehr guten Arbeitsatmosphäre beigetragen haben und bei Fragen stets geholfen haben. Timothy D. Bostick danke ich sehr für seine Korrekturen bei Postern, Papern und meiner Doktorarbeit. Ich danke meiner Masterstudentin Stine Weder, dessen wissenschaftliche Ergebnisse und ihr großes Engagement im Labor zum Erfolg meines Projektes beigetragen haben. Spezieller Dank geht an Dr. Stefan Rahlfs und Dr. Esther Jortzik für ihre Hilfestellungen, konstruktiven Ideen und Unterstützung in der Planung bei der Projektumsetzung. Weiterhin möchte ich Prof. David A. Fidock danken für die Aufnahme in seinem Labor an der Columbia University in New York und der fruchtvollen Kollaboration. Ganz besonderer Dank gilt dabei aus seiner Arbeitsgruppe Stanislav Gabryszewski für seine Betreuung während meiner Arbeit und seine exzellente Unterstützung in molekularbiologischen und Zellkulturfragen sowohl vor Ort als auch per Email. Bei meinem zweiten Auslandsaufenthalt danke ich Prof. Georges Grau für die Aufnahme in seinem Labor an der Sydney University in Australien und der Kollaboration als auch der gesamten Arbeitsgruppe sowie Prof. Nicholas H. Hunt, die mir stets geholfen haben. Ich möchte mich besonders bei Amy Cohen bedanken, ohne ihr Engagement wären keine live-cell Experimente möglich gewesen aufgrund der dort herrschenden Bürokratie. Ganz herzlich bedanken möchte ich mich auch bei Dr. Pamela A. Young und Dr. Michael Kuligowski. Sie haben mich nicht nur bei den Experimenten am Konfokalmikroskop hervorragend unterstützt, sondern auch bei der Nachbearbeitung der Bilder und Videos. Sie haben mir den Kontakt zu Remko Dijkstra ermöglicht, ohne seine stetige Hilfe zur Dekonvolution-Software Huygens wäre die Aufarbeitung der 3D-Videos nicht möglich gewesen. Außerhalb unserer Arbeitsgruppe danke ich Prof. Jude M. Przyborski für seine Unterstützung bei den Fluoreszenzbildern und Dr. Bruce Morgan, Dr. Markus Schwarzländer und Dr. Ivan Bogeski für ihre sehr hilfreichen Anregungen und Diskussionen auf Konferenzen. Ein ganz besonderer Dank gilt meiner Familie und meinen Freunden für die Unterstützung, Motivation und Fürsorge in allen Lebenslagen. Speziell danke ich Maryam Afsharian, die ich am Anfang meiner Doktorarbeit in Gießen kennengelernt habe und mir seitdem eine sehr gute Freundin ist. Ohne sie wäre die Zeit in Gießen nur halb so schön gewesen.
List of publications
iii
List of publications
Rahbari M, Rahlfs S, Przyborski JM, Schuh AK, Hunt NH, Fidock DA, Grau G, and Becker K (2017) Hydrogen peroxide dynamics in subcellular compartments of malaria parasites using genetically encoded redox probes. Sci Rep 7: 10449.
Rahbari M, Rahlfs S, Jortzik E, Bogeski I, and Becker K (2017) H2O2 dynamics in the malaria parasite Plasmodium falciparum. PLoS One 12: e0174837.
Krieg R, Jortzik E, Goetz AA, Blandin S, Wittlin S, Mourad E, Rahbari M, Nuryyeva S, Voigt K, Dahse HM, Brakhage A, Beckmann S, Quack T, Grevelding CG, Pinkerton AB, Schönecker B, Burrows J, Davioud-Charvet E, Rahlfs S, and Becker K (2017) Arylmethylamino steroids as novel antiparasitic agents. Nat Commun 8: 14478.
Mohring F, Rahbari M, Zechmann B, Rahlfs S, Przyborski JM, Meyer AJ, and Becker K (2017) Determination of glutathione redox potential and pH value in subcellular compartments of malaria parasites. Free Radic Biol Med 104: 104-117.
Schuh AK*, Rahbari M*, Mohring F, Gabryszewski SJ, Schipper S, Rahlfs S, Fidock DA, and Becker K (2017) Stable integration of hGrx1-roGFP2 and sfroGFP2 redox probes and establishment of plate reader detection in the malaria parasite Plasmodium falciparum. In preparation.
* shared first authorship
Khalil SM, Römpp A, Pretzel J, Rahbari M, Becker K, and Spengler B (2017) Mass spectrometry imaging for characterizing parasite host cell interactions in malaria research. In preparation.
Rahbari M*, Diederich K*, Becker K, Krauth-Siegel L, and Jortzik E (2015) Detection of thiol-based redox switch processes in parasites – facts and future. Biol Chem 396: 445-463.
* shared first authorship (review article)
Contributions to conferences
iv
Contributions to conferences
Sep. 2016 6th Symposium of the DFG Priority Program SPP 1710 “Dynamics of thiol-based redox switches in cellular physiology,” Irsee, Germany Poster: Establishment of genetically encoded GSH/GSSG, H2O2 and pH probes and dynamic measurements of the redox potential and H2O2 levels in the malaria parasite Plasmodium falciparum.
Apr. 2016 Malaria Seminar Series, Melbourne University, Australia Talk: Establishment of H2O2 sensors and dynamic monitoring of H2O2
levels in the cytosol of Plasmodium falciparum. Feb./March 2016 5th Symposium of the DFG Priority Program SPP 1710 “Dynamics of thiol-
based redox switches in cellular physiology,” Rauischholzhausen, Germany Poster: Establishment of genetically encoded H2O2 probes and dynamic measurements of H2O2 levels in the malaria parasite Plasmodium falciparum.
July 2015 Gordon Research Conference “Thiol-based redox regulation and signaling,” Girona, Spain
Poster: Establishment of genetically encoded H2O2 probes and dynamic measurements of H2O2 levels in the malaria parasite Plasmodium falciparum.
May 2015 EMBL Conference BioMalPar XI Biology and Pathology of the Malaria Parasite, Heidelberg, Germany Poster: Acridizinium derivatives have a strong antimalarial activity and inhibit indoleamine dioxygenase.
Sep. 2014 25th Annual Molecular Parasitology Meeting, Woods Hole, MA, USA Poster: Real-time imaging of the intracellular glutathione redox potential in the malaria parasite Plasmodium falciparum.
Table of contents
v
Table of contents
Erklärung .................................................................................................................... i
Danksagung .............................................................................................................. ii
List of publications .................................................................................................. iii
Contributions to conferences ................................................................................. iv
Table of contents ...................................................................................................... v
List of figures ............................................................................................................ x
List of tables .......................................................................................................... xiii
List of abbreviations ............................................................................................. xvi
Summary .............................................................................................................. xviii
Zusammenfassung ................................................................................................. xx
1 Introduction.......................................................................................................... 1
1.1 Malaria ............................................................................................................. 1
1.1.1 Anopheles spp. .................................................................................................... 2
1.1.2 Plasmodium ......................................................................................................... 2
1.1.2.1 The P. falciparum life cycle ........................................................................................ 3
1.1.2.2 P. falciparum subcellular compartments .................................................................... 4
1.1.3 Malaria treatment ................................................................................................. 7
1.1.3.1 4-aminoquinolines, 8-aminoquinolines, arylaminoalcohols ....................................... 7
1.1.3.2 Artemisinins ............................................................................................................... 8
1.1.3.3 Other antimalarial drugs and compounds .................................................................. 9
1.2 Redox and antioxidant systems of P. falciparum ........................................... 11
1.2.1 The glutathione redox system .............................................................................13
1.2.2 The thioredoxin redox system .............................................................................14
1.3 ROS and H2O2 ............................................................................................... 15
1.4 Genetically encoded fluorescent probes ........................................................ 16
1.4.1 H2O2 redox sensor roGFP2-Orp1 ........................................................................17
1.4.2 H2O2 redox sensor HyPer-3 ................................................................................18
1.4.3 Glutathione redox sensor hGrx1-roGFP2 ............................................................20
1.5 Objectives of the study ................................................................................... 21
2 Materials ............................................................................................................. 22
2.1 Equipment, consumables, and software ........................................................ 22
2.2 Chemicals, buffers, media, proteins, kits ........................................................ 23
2.2.1 Chemicals and buffers ........................................................................................23
2.2.2 Buffer compositions ............................................................................................25
2.2.3 Medium for E. coli culture ...................................................................................26
Table of contents
vi
2.2.4 Antibiotics and antimalarial drugs .......................................................................27
2.2.5 Kits for protein biochemistry, molecular- and cell biology ....................................28
2.2.6 Enzymes, antibodies, fluorescent dyes, and other proteins .................................28
2.3 Plasmids and primers..................................................................................... 29
2.3.1 Plasmids .............................................................................................................29
2.3.2 Primers ...............................................................................................................31
2.4 Organisms ...................................................................................................... 33
2.4.1 Parasite strains ...................................................................................................33
2.4.2 Bacterial strains ..................................................................................................33
3 Methods .............................................................................................................. 34
3.1 Molecular biology methods ............................................................................ 34
3.1.1 Cloning cytosolic roGFP2-Orp1, HyPer-3, SypHer, and pHluorin into pARL1a(+) .........................................................................................................34
3.1.1.1 Polymerase chain reaction (PCR) ........................................................................... 34
3.1.1.2 Agarose gel electrophoresis .................................................................................... 35
3.1.1.3 Cleaving double-stranded DNA with restriction endonucleases.............................. 35
3.1.1.4 DNA quantification ................................................................................................... 36
3.1.1.5 Ligation .................................................................................................................... 36
3.1.1.6 Transformation ......................................................................................................... 37
3.1.1.7 Preparation of E. coli stocks .................................................................................... 38
3.1.1.8 Preparation of plasmid DNA .................................................................................... 38
3.1.2 Vector construction for Api-, Mito-, DV-, and ER-targeted roGFP2-Orp1, HyPer-3, and SypHer into pARL1a(+) ................................................................38
3.1.2.1 Polymerase chain reaction ...................................................................................... 39
3.1.2.2 Initial preparation for targeting ................................................................................. 40
3.1.2.3 Dephosphorylation of vectors .................................................................................. 42
3.1.2.4 Gel extraction of ACP and CS ................................................................................. 42
3.1.2.5 Ligation .................................................................................................................... 42
3.1.2.6 Transformation ......................................................................................................... 43
3.1.2.7 Preparation of plasmid DNA .................................................................................... 43
3.1.2.8 Verification of inserts ............................................................................................... 44
3.1.3 Stable integration of the biosensors into the pDC2-CRT-X-attP and pDC2-CAM-X-attP vector .............................................................................................44
3.1.3.1 Polymerase chain reaction ...................................................................................... 45
3.1.3.2 Cleavage of double-stranded DNA via restriction endonucleases .......................... 46
3.1.3.3 Ligation .................................................................................................................... 47
3.1.3.4 Transformation ......................................................................................................... 48
3.1.3.5 Preparation of plasmid DNA .................................................................................... 48
3.1.4 Vector construction for heterologous overexpression of HyPer-3 and SypHer ....49
3.1.4.1 Polymerase chain reaction ...................................................................................... 50
Table of contents
vii
3.1.4.2 Cleavage of double-stranded DNA via restriction endonucleases .......................... 50
3.1.4.3 Ligation .................................................................................................................... 51
3.1.4.4 Transformation ......................................................................................................... 51
3.1.4.5 Preparation of plasmid DNA .................................................................................... 51
3.1.5 Production of recombinant roGFP2-Orp1, HyPer-3, and SypHer in E. coli cells ....................................................................................................................52
3.1.5.1 Heterologous overexpression of recombinant proteins in E. coli cells .................... 52
3.1.5.2 Purification of recombinant proteins ........................................................................ 52
3.2 P. falciparum culture methods ........................................................................ 52
3.2.1 P. falciparum maintenance .................................................................................52
3.2.2 Sorbitol synchronization ......................................................................................53
3.2.3 Purification and enrichment of trophozoite-stage parasites .................................53
3.2.4 In vitro P. falciparum drug susceptibility assays ..................................................53
3.2.5 Preparation of parasite cell extracts with saponin ...............................................53
3.3 P. falciparum transfection methods ................................................................ 54
3.3.1 Transient transfection of P. falciparum ................................................................54
3.3.2 Stable transfection of P. falciparum ....................................................................54
3.3.3 Preparation of cloning plates for stably transfected parasites .............................56
3.4 Biochemical methods ..................................................................................... 57
3.4.1 Protein quantification with the Bradford assay ....................................................57
3.4.2 SDS-polyacrylamide gel electrophoresis .............................................................57
3.4.3 Western blot analysis ..........................................................................................58
3.5 Biosensor methods ........................................................................................ 58
3.5.1 In vitro fluorescence measurements of recombinant proteins with a plate reader ................................................................................................................58
3.5.2 Live-cell imaging of P. falciparum via CLSM .......................................................59
3.5.3 Live-cell imaging of P. falciparum with a fluorescence plate reader ....................60
3.5.4 Localization studies using fluorescence methods................................................60
3.6 Determining H2O2, drug and pH susceptibility of roGFP2-Orp1, HyPer-3 and SypHer in P. falciparum via CLSM .......................................................... 61
3.6.1 H2O2 susceptibility of roGFP2-Orp1 and HyPer-3 expressing Pf3D7 parasites with intact and saponin-lysed RBCs ....................................................61
3.6.2 Drug susceptibility of redox probes .....................................................................61
3.6.3 Determining pH susceptibility of SypHer, HyPer-3, and pHluorin in P. falciparum ..........................................................................................................62
3.6.4 Determining H2O2 susceptibility of P. falciparum 3D7 transfected with roGFP2-Orp1 after priming with stress factors....................................................62
4 Results ............................................................................................................... 63
4.1 In vitro measurements with the plate reader .................................................. 63
4.1.1 In vitro characterization of recombinant roGFP2-Orp1 and HyPer-3 ...................63
Table of contents
viii
4.1.2 Direct interactions of antimalarial drugs and redox-active compounds with recombinant roGFP2-Orp1, HyPer-3, and hGrx1-roGFP2 ..................................64
4.2 Determining cytosolic pH with SypHer and pHluorin ...................................... 69
4.3 Determining EC50 values of P. falciparum 3D7 and NF54-attB parasites ....... 71
4.4 In-cell expression of the roGFP2-Orp1, HyPer-3, SypHer, hGrx1-roGFP2, and sfroGFP2 probes in P. falciparum ........................................................... 72
4.5 In-cell measurements with P. falciparum 3D7 parasites (CLSM) ................... 74
4.5.1 Determining of H2O2 effects on P. falciparum 3D7 transfected with roGFP2-Orp1 and HyPer-3 ..............................................................................................74
4.5.2 Determining of the dynamic range of roGFP2-Orp1 and HyPer-3 in transfected P. falciparum 3D7 parasites .............................................................77
4.5.3 Determining drug effects on P. falciparum 3D7 parasites transfected with roGFP2-Orp1 and HyPer-3 ................................................................................78
4.5.4 Determining H2O2 susceptibility of P. falciparum 3D7[roGFP2-Orp1]-transfected parasites after priming with antimalarial drugs and heat shock ...........................80
4.5.5 Investigating the cytosolic glutathione redox state using 3D7[hGrx1-roGFP2]-transfected parasites ..........................................................................................81
4.6 Targeting roGFP2-Orp1, HyPer-3, and SypHer to subcellular compartments of P. falciparum 3D7 parasites ............................................... 84
4.7 Optimizing H2O2 homeostasis imaging via stable integration into NF54-attB parasites ................................................................................................. 85
4.7.1 Stably integrated roGFP2-Orp1 improves detection of H2O2 levels .....................86
4.7.2 Targeting roGFP2-Orp1 to the cytosol and mitochondrion of P. falciparum NF54-attB parasites ...........................................................................................86
4.7.3 Real-time imaging of cytosolic H2O2 homeostasis in NF54[roGFP2-Orp1] and NF54[Mito-roGFP2-Orp1] parasites ...............................................................................88
4.7.5 Mid- and long-term drug effects on H2O2 homeostasis in NF54[roGFP2-Orp1] and NF54[Mito-roGFP2-Orp1] parasites ...............................................................................91
4.8 Optimizing glutathione homeostasis imaging via stable integration into NF54-attB parasites ....................................................................................... 95
4.8.1 Stably integrated hGrx1-roGFP2 improves detection of the glutathione redox state ...................................................................................................................98
4.8.2 Stably integrated sfroGFP2 improves detection of the glutathione redox state .. 101
5 Discussion ....................................................................................................... 104
5.1 RoGFP2-Orp1 and HyPer-3 as dynamic H2O2 biosensors in P. falciparum 3D7 parasites ............................................................................................... 104
5.2 Effects of antimalarial drugs on cytosolic roGFP2-Orp1 and HyPer-3 in Plasmodium 3D7 parasites .......................................................................... 106
5.3 Optimizing detection of H2O2 levels in P. falciparum .................................... 106
5.4 Effects of novel compounds on hGrx1-roGFP2 expressing P. falciparum 3D7 parasites ............................................................................................... 108
5.5 Optimizing glutathione redox potential detection in P. falciparum ................ 109

Table of contents
ix
5.6 Future perspectives...................................................................................... 110
5.6.1 Malaria control .................................................................................................. 110
5.6.2 Genetic markers of resistance .......................................................................... 110
5.6.3 Further development of redox sensor methodology .......................................... 111
6 References ....................................................................................................... 113
7 Appendix .......................................................................................................... 125
List of figures
x
List of figures
Figure 1.1 Population at risk of malaria infection in 2013.. ................................................ 1 Figure 1.2 Mid-trophozoite stage of Plasmodium. ............................................................. 3 Figure 1.3 P. falciparum life cycle. .................................................................................... 4 Figure 1.4 P. falciparum apicoplast pathways and metabolism. ........................................ 5 Figure 1.5 P. falciparum mitochondrial respiratory chain. ................................................. 6 Figure 1.6 Structure of the electron transport chain blocker (ETCB) rotenone. ................ 6 Figure 1.7 Structure of the glycolysis inhibitor 2-deoxy-D-glucose. ................................... 7 Figure 1.8 Structures of 4-aminoquinolines, 8-aminoquinolines, and
arylaminoalcohols.. .......................................................................................... 8 Figure 1.9 Artemisinin structures. ..................................................................................... 9 Figure 1.10 Structures of other antimalarial compounds. ...................................................11 Figure 1.11 Compartmentation of redox metabolism in malaria parasites. .........................12 Figure 1.12 Different oxidation states of cysteine residues. ...............................................13 Figure 1.13 The glutathione system of P. falciparum.. .......................................................14 Figure 1.14 The thioredoxin system of P. falciparum. ........................................................15 Figure 1.15 Antioxidant defense system of P. falciparum-infected red blood cells. ............16 Figure 1.16 Oxidant transfer in roGFP2-Orp1. ...................................................................18 Figure 1.17 Composition and conformational change in HyPer after exposition to
H2O2. ..............................................................................................................19 Figure 1.18 Oxidation mechanism of the glutathione redox sensor hGrx1-roGFP2. ...........20 Figure 3.1 Cloned roGFP2-Orp1, HyPer-3, SypHer, and pHluorin constructs.. ................34 Figure 3.2 Cloned roGFP2-Orp1, HyPer-3 and SypHer constructs targeted to
different organelles.. .......................................................................................39 Figure 3.3 Cloning roGFP2-Orp1, HyPer-3, SypHer, and hGrx1-roGFP2 constructs
into the pDC2-CRT-X-BSD-attP vector. ..........................................................45 Figure 3.4 Cloning roGFP2-Orp1, HyPer-3, SypHer, hGrx1-roGFP2, and pHluorin
constructs into the pDC2-CAM-X-attP vector. .................................................45 Figure 3.5 Site-specific integration in the P. falciparum chromosome mediated by
mycobacteriophage Bxb1 integrase. ...............................................................56 Figure 4.1 In vitro excitation spectra of recombinant roGFP2-Orp1 and HyPer-3. ............63 Figure 4.2 In vitro characterization of recombinant roGFP2-Orp1 and HyPer-3. ..............64 Figure 4.3 Effects of antimalarial drugs on the reduced roGFP2-Orp1 protein. ................67 Figure 4.4 Effects of antimalarial drugs on the reduced hGrx1-roGFP2 protein. ..............69 Figure 4.5 The pH characteristics of HyPer-3 and SypHer measured in vitro and in-
cell. .................................................................................................................70 Figure 4.6 In vitro time course of SypHer and HyPer-3 at different pH values. ................70 Figure 4.7 Determining the cytosolic pH of P. falciparum 3D7[SypHer] and 3D7[pHluorin]
parasites. ........................................................................................................71 Figure 4.8 Western blots of 3D7 parasite lysates transfected with roGFP2-Orp1,
HyPer-3, and SypHer and the corresponding recombinant purified proteins. .........................................................................................................73
Figure 4.9 Western blot of NF54-attB (CRT promoter) parasite lysates transfected with roGFP2-Orp1, HyPer-3, and SypHer and the corresponding recombinant purified proteins..........................................................................73
Figure 4.10 Western blots of NF54-attB (CAM promoter) parasite lysates transfected with roGFP2-Orp1, HyPer-3, SypHer, roGFP2-Orp1, and Mito-roGFP2- Orp1 and the corresponding recombinant purified proteins. ............................74
Figure 4.11 Western blots of NF54-attB (CAM promoter) parasite lysates transfected with hGrx1-roGFP2 and sfroGFP2 and the recombinant sfroGFP2 protein.. ..........................................................................................................74
Figure 4.12 Effect of H2O2 on P. falciparum parasites transfected with 3D7[roGFP2-Orp1]- and 3D7[HyPer-3] within intact RBCs and after RBC lysis. ...................................76
List of figures
xi
Figure 4.13 Comparison of 3D7[roGFP2-Orp1] parasites within intact RBCs and 3D7[roGFP2-
Orp1] parasites lysed with saponin. ...................................................................76 Figure 4.14 Real-time imaging of P. falciparum 3D7 control parasites transfected with
roGFP2-Orp1 and 2 mM NEM pre-blocked parasites after exposure to DIA. ................................................................................................................77
Figure 4.15 Dynamic range of roGFP2-Orp1 and HyPer-3 expressed in transfected parasites within intact RBCs and after host cell lysis. .....................................78
Figure 4.16 Short-term effects of antimalarial drugs on the redox ratio of P. falciparum 3D7[roGFP2-Orp1]-transfected parasites. ..............................................79
Figure 4.17 Real-time imaging of the effect of H2O2 on P. falciparum 3D7[roGFP2-Orp1]- transfected parasites after 4 h pre-incubation with antimalarial compounds and heat shock. ...........................................................................81
Figure 4.18 Mid- and long-term effects of compound 1o on the redox ratio of P. falciparum 3D7[hGrx1-roGFP2] parasites. ...............................................................82
Figure 4.19 Mid- and long-term effects of ML304 and its novel derivative compound S on the redox ratio of P. falciparum 3D7[hGrx1-roGFP2] parasites.. .........................83
Figure 4.20 Long-term incubation (24 h) of 3D7[hGrx1-roGFP2] and 3D7[Mito-roGFP2-hGrx1] parasites with Rot and 2-DG. ..........................................................................84
Figure 4.21 Immunofluorescence assays of P. falciparum 3D7[Mito-roGFP2-Orp1], 3D7[Api-
SypHer], and 3D7[ER-HyPer].. ..................................................................................85 Figure 4.22 Comparison of 3D7[roGFP2-Orp1] and NF54[roGFP2-Orp1] parasites. ..........................86 Figure 4.23 Confirming cytosolic and mitochondrial localization of the roGFP2-Orp1
probe in P. falciparum NF54[roGFP2-Orp1] and NF54[Mito-roGFP2-Orp1] parasites, respectively. ...................................................................................87
Figure 4.24 Dynamic range of roGFP2-Orp1 and Mito-roGFP2-Orp1 in transfected NF54-attB parasites. .......................................................................................88
Figure 4.25 Effect of H2O2 on P. falciparum NF54[roGFP2-Orp1]- and NF54[Mito-roGFP2-
Orp1]-transfected parasites. ..............................................................................89 Figure 4.26 High-resolution imaging of the effects of H2O2 on P. falciparum
NF54[roGFP2-Orp1] parasites over time. ................................................................90 Figure 4.27 Mid- and long-term effects of ART, ATM, ATS, CQ, QN, MQ, AQ, and
LUM on the redox ratio of P. falciparum NF54[roGFP2-Orp1] and NF54[Mito-roGFP2-Orp1]-transfected parasites. ........................................................92
Figure 4.28 CLSM images of P. falciparum NF54[Mito-roGFP2-Orp1] parasites after 24 h of treatment with ATM. ............................................................................93
Figure 4.29 Mid- and long-term effects of Rot, 2-DG, ATQ, PQ, compound 1o, ML304, and compound S on the redox ratio of P. falciparum NF54[roGFP2-
Orp1]- and NF54[Mito-roGFP2-Orp1] -transfected parasites. ........................................94 Figure 4.30 Dynamic response of NF54[hGrx1-roGFP2] and NF54[sfroGFP2]
parasites to DIA and DTT using plate reader detection. ..................................96 Figure 4.31 Comparison of NF54[hGrx1-roGFP2] and NF54[sfroGFP2] parasites. ...........................96 Figure 4.32 High-resolution imaging of the effects of H2O2 on P. falciparum NF54[hGrx1-
roGFP2] parasites over time. ...............................................................................97 Figure 4.33 Mid- and long-term effects of ML304 on the glutathione redox ratio of P.
falciparum NF54[hGrx1-roGFP2] parasites.. ............................................................98 Figure 4.34 Mid- and long-term effects of antimalarial drugs at 4 x EC50 (24 h) and
50 x EC50 (4 h) on the glutathione redox ratio of P. falciparum NF54[hGrx1-
roGFP2] parasites.. .............................................................................................99 Figure 4.35 Mid- and long-term effects of compound 1o, ML304, and its derivative
compound S on the glutathione redox ratio of P. falciparum NF54[hGrx1-
roGFP2] parasites. ............................................................................................ 100 Figure 4.36 Mid- and long-term effects of antimalarial drugs at 10 x EC50 (24 h) and
100 x EC50 (4 h) on the glutathione redox ratio of P. falciparum NF54[hGrx1-
roGFP2] parasites. ............................................................................................ 101
List of figures
xii
Figure 4.37 Mid- and long-term effects of compound 1o, ML304, and its derivative compound S on the glutathione redox ratio of P. falciparum NF54[sfroGFP2] parasites. ...................................................................................................... 102
Figure 4.38 Mid- and long-term effects of antimalarial drugs at 10 x EC50 (24 h) and 100 x EC50 (4 h) on the redox ratio of P. falciparum NF54[sfroGFP2] parasites.. ..................................................................................................... 103
List of tables
xiii
List of tables
Table 1.1 Mutations in roGFP1 and roGFP2. ...................................................................18 Table 1.2 Mutations in HyPer. ..........................................................................................20 Table 1.3 Mutations in sfroGFP2. ....................................................................................21 Table 2.1 Nomenclature and manufacturer of equipment used in alphabetical order. ......22 Table 2.2 Nomenclature and manufacturer of the consumables used in alphabetical
order. ...............................................................................................................23 Table 2.3 Nomenclature and manufacturer of the software used in alphabetical
order. ...............................................................................................................23 Table 2.4 Nomenclature and manufacturer of the chemicals used in alphabetical
order. ...............................................................................................................23 Table 2.5 Composition of gels and gel electrophoresis buffers used. ...............................25 Table 2.6 SDS-PAGE buffers and solutions used. ...........................................................25 Table 2.7 Composition oft the assay buffers used. ..........................................................25 Table 2.8 Composition of the immunofluorescence assay buffers used. ..........................25 Table 2.9 Composition of the protein purification buffers used. ........................................26 Table 2.10 Composition of western blot buffers and solutions used. ..................................26 Table 2.11 Composition of P. falciparum cell culture buffers used. ....................................26 Table 2.12 Composition of the medium for cultivating of E. coli cells. ................................26 Table 2.13 Nomenclature, manufacturer, and stock/final concentrations of the
antibiotics used. ...............................................................................................27 Table 2.14 Nomenclature and manufacturer of the antimalarial drugs used. ......................27 Table 2.15 Nomenclature and manufacturer of P. falciparum selectable drugs used. ........27 Table 2.16 Nomenclature and manufacturer of the kits used. ............................................28 Table 2.17 Nomenclature and manufacturer of restriction enzymes used in
alphabetical order. ...........................................................................................28 Table 2.18 Nomenclature and manufacturer of other enzymes used in alphabetical
order. ...............................................................................................................28 Table 2.19 Nomenclature and manufacturer of antibodies used. .......................................28 Table 2.20 Nomenclature and manufacturer of fluorescent dyes used in alphabetical
order. ...............................................................................................................28 Table 2.21 Working concentrations of protease inhibitors used. ........................................29 Table 2.22 Nomenclature, antibiotic resistance, and source of plasmids used. ..................29 Table 2.23 Nomenclature and antibiotic resistance of plasmids used for cloning in E.
coli and P. falciparum cell culture. ....................................................................30 Table 2.24 Nomenclature and sizes of plasmids/constructs used. .....................................30 Table 2.25 Sizes of target peptides used. ..........................................................................31 Table 2.26 Nomenclature and protein sizes of inserts used. ..............................................31 Table 2.27 PCR and sequencing primer nucleotide sequences for roGFP2-Orp1,
HyPer-3, SypHer, and pHluorin. .......................................................................31 Table 2.28 P. falciparum strains. .......................................................................................33 Table 2.29 Escherichia coli (E. coli) cells. ..........................................................................33 Table 3.1 Times and temperatures for cytosolic roGFP2-Orp1, HyPer-3, SypHer,
and pHluorin. ...................................................................................................35 Table 3.2 PCR conditions for amplifying roGFP2-Orp1, HyPer-3, SypHer, and
pHluorin. ..........................................................................................................35 Table 3.3 Digestion mixture of PCR products and the pARL1a(+) vector. ........................36 Table 3.4 Ligation mixture of HyPer-3 and SypHer with the vector pARL1a(+). ...............36 Table 3.5 Ligation mixture of pHluorin with the vector pARL1a(+). ...................................37 Table 3.6 Ligation mixture of roGFP2-Orp1 with the vector pARL1a(+). ..........................37 Table 3.7 Ligation partners of roGFP2-Orp1, HyPer-3, SypHer, and pHluorin. ................37 Table 3.8 Transformations of roGFP2-Orp1, HyPer-3, SypHer, and pHluorin in E.
coli cells. ..........................................................................................................38 Table 3.9 PCR conditions to amplify roGFP2-Orp1, HyPer-3, and SypHer for
organelle targeting. ..........................................................................................40
List of tables
xiv
Table 3.10 PCR conditions to amplify the target sequences ACP, CS, and PM IV. ............40 Table 3.11 PCR mixture to amplify roGFP2-Orp1, HyPer-3, and SypHer for organelle
targeting (-KX- and -AX-) and to amplify the target sequences ACP, CS, and PM. ...........................................................................................................40
Table 3.12 Digestion mixture of the PCR products and the pARL1a(+) and pARL1a(+)-STEVOR-[X-SDEL] vectors. ..........................................................41
Table 3.13 Ligation mixture of roGFP2-Orp1, HyPer-3, and SypHer (-KX- and -AX-) with the vector pARL1a(+) and pARL1a(+)-STEVOR. ......................................41
Table 3.14 Ligation partners of cytosolic roGFP2-Orp1, HyPer-3, and SypHer for targeting to Api, Mito, DV, and ER. ..................................................................41
Table 3.15 Digestion mixture of the sequenced pARL1a(+)-[roGFP2-Orp1]/-[HyPer-3]/-[SypHer] vector with KpnI/XmaI restriction sites and the organelle coding sequences ACP, CS, and PM. ..............................................................42
Table 3.16 Dephosphorylation conditions with alkaline phosphatase. ................................42 Table 3.17 Ligation mixture of the target sequences ACP, CS, and PM IV and the
pARL1a(+)-[roGFP2-Orp1]/-[HyPer-3]/-[SypHer] vector. ..................................43 Table 3.18 Ligation partners of ACP-, CS-, and PM-coding sequences with the
pARL1a(+)-[roGFP2-Orp1]/-[HyPer-3] and -[SypHer] vector. ...........................43 Table 3.19 Transformations. ..............................................................................................43 Table 3.20 PCR conditions for the amplification of cytosolic, Api-, and Mito-targeted
roGFP2-Orp1, HyPer-3, SypHer, and hGrx1-roGFP2 for the pDC2-CRT-X-attP and pDC2-CAM-X-attP vectors. ............................................................46
Table 3.21 PCR mixture for the amplification of cytosolic, Api-, and Mito-targeted roGFP2-Orp1, HyPer-3, SypHer, and hGrx1-roGFP2 for the pDC2-CRT-X-attP and pDC2-CAM-X-attP vector. ..............................................................46
Table 3.22 Digestion mixture of the PCR products and the original pDC2-CRT-[FA2a-roGFP1]-attP and pDC2-CAM-[hGrx1-roGFP2]-attP plasmids. ........................47
Table 3.23 Ligation mixture of roGFP2-Orp1, HyPer-3, SypHer, hGrx1-roGFP2, pHluorin, ACP-/CS-roGFP2, and ACP-/CS-roGFP2-hGrx1 with the vectors pDC2-CRT-[X]-attP and pDC2-CAM-[X]-attP. ..................................................47
Table 3.24 Ligation partners of roGFP2-Orp1, HyPer-3, SypHer, hGrx1-roGFP2, pHluorin, ACP-/CS-roGFP2, and ACP-/CS-roGFP2-hGrx1 with the vectors pDC2-CRT-[X]-attP and pDC2-CAM-[X]-attP. ..................................................48
Table 3.25 Transformations in E. coli cells.........................................................................48 Table 3.26 Colony PCR conditions for verifying inserted DNA. ..........................................49 Table 3.27 PCR mixture for amplifying inserted DNA after colony PCR. ............................49 Table 3.28 PCR conditions for the amplification of HyPer-3/SypHer for
overexpression. ...............................................................................................50 Table 3.29 PCR mixture to amplify HyPer-3/SypHer for overexpression. ...........................50 Table 3.30 Digestion mixture of the HyPer-3/SypHer PCR products and the
pET28a(+) vector. ............................................................................................51 Table 3.31 Ligation mixture of HyPer-3 and SypHer. .........................................................51 Table 3.32 Ligation partners of HyPer-3 and SypHer. ........................................................51 Table 3.33 Transformation of HyPer-3 and SypHer in E. coli cells. ....................................51 Table 3.34 Blood PCR for verifying genomically integrated constructs. .............................55 Table 3.35 PCR mixture for blood PCR. ............................................................................55 Table 3.36 Pipetting scheme of the Bradford assay. ..........................................................57 Table 4.1 Effects of antimalarial drugs on the redox ratio of recombinant roGFP2-
Orp1.................................................................................................................64 Table 4.2 Effects of antimalarial drugs on the redox ratio of recombinant HyPer-3. .........65 Table 4.3 EC50 of compounds on P. falciparum 3D7 parasites via the [3H]-
incorporation assay. .........................................................................................71 Table 4.4 EC50 of compounds on P. falciparum NF54-attB parasites via the SYBR
Green assay. ...................................................................................................71 Table 4.5 Concentrations of compounds used in P. falciparum 3D7 experiments. ...........72

List of tables
xv
Table 4.6 Concentrations of compounds used in P. falciparum NF54-attB experiments. ....................................................................................................72
Table 4.7 Effects of antimalarial drugs on the redox ratio of 3D7[roGFP2-Orp1] parasites after 4 h incubation. .........................................................................................79
Table 4.8 Effects of antimalarial drugs on the redox ratio of 3D7[roGFP2-Orp1] parasites after 24 h incubation. .......................................................................................80
List of abbreviations
xvi
List of abbreviations
ACP Acyl carrier protein ACTs Artemisinin-based combination therapies Api Apicoplast APS Ammonium persulfate ART Artemisinin ATM Artemether ATP Adenosine triphosphate ATS Artesunate ATQ Atovaquone Bp Base pairs BSA Bovine serum albumin CEA Coruleoellagic acid Cn Carbenicillin cp(Y)FP Circularly permuted (yellow) fluorescent protein CDC Centers for Disease Control and Prevention CLSM Confocal laser scanning microscopy CS Citrate synthase CQ Chloroquine Da Dalton kDa Kilodalton Cys Cysteine ddH2O Double-distilled water DIA Diamide/diazene dicarboxamide DHFR Dihydrofolate reductase DMSO Dimethylsulfoxide DNA Deoxyribonucleic acid dNTP Deoxynucleotide triphosphate DOXP 1-deoxy-D-xylulose 5-phosphate DTT 1,4-dithiothreitol DV Digestive vacuole E. coli Escherichia coli EA Ellagic acid ECL Enhanced chemiluminescence EC50 Half maximal effective concentration EDTA Ethylenediaminetetraacetic acid EGSH Glutathione redox potential ER Endoplasmic reticulum ETC Electron transport chain FADH2 Flavin adenine dinucleotide FEA Flavellagic acid FP Ferriprotoporphyrin FeS Iron sulfur cluster yGCS γ-glutamylcysteine synthetase GFP Green fluorescent protein GluPho Glucose-6-phosphate dehydrogenase 6-phosphogluconolactonase G6PD Glucose 6-phosphate dehydrogenase GPx Glutathione peroxidase GR Glutathione reductase Grx Glutaredoxin GS Glutathione synthetase GSH Reduced glutathione GSSG Glutathione disulfide hGrx1 Human glutaredoxin1
List of abbreviations
xvii
GST Glutathione S-transferase HeLa cells Henrietta Lacks cells Hemoglobin Hb His-tag Polyhistidine ltag IFA Immunofluorescence assay IPTG Isopropyl-β-D-thiogalactopyranoside IRBC Infected red blood cell Kan Kanamycin LB Luria-Bertani medium Δψm Mitochondrial membrane potential MES 2-(N-morpholino)ethanesulfonic acid Mito Mitochondrion MQ Mefloquine MtETC Mitochondrial electron transport chain NADPH Nicotinamide adenine dinucleotide phosphate NEM N-ethylmaleimide Ni-NTA Nickel-nitrilotriacetic acid OD600 Optical density at 600 nm Orp Oxidant receptor peroxidase PBS Phosphate buffered saline PCR Polymerase chain reaction P. falciparum Plasmodium falciparum PfCRT Plasmodium falciparum chloroquine resistance transporter PfMDR1 Plasmodium falciparum multi drug resistance protein-1 PMSF Phenylmethylsulfonyl fluoride PVDF Polyvinylidene difluoride QN Quinine RBC Red blood cell RD Regulatory domain RFU Relative fluorescence units roGFP Reduction-oxidation sensitive green fluorescent protein ROS Reactive oxygen species RNA Ribonucleic acid RNS Reactive nitrogen species rpm Revolutions per minute RT Room temperature S. cerevisiae Saccharomyces cerevisiae SDS Sodium dodecyl sulfate SDS-PAGE Sodium dodecyl sulfate – polyacrylamide gel electrophoresis SOD Superoxide dismutase TBE Tris-borate-EDTA TBS(T) Tris-buffered saline (with Tween 20) TCA Tricarboxylic acid TEMED Tetramethylethylenediamine Tris Tris(hydroxymethyl)-aminomethane Trx(R) Thioredoxin (reductase) QN Quinine WHO World Health Organization wtOxyR Wild type OxyR YFP Yellow fluorescent protein
Summary
xviii
Summary
Malaria, caused by the apicomplexan parasite Plasmodium falciparum (P. falciparum), is still one of the world’s most severe human infectious diseases and threatens the health and life of millions of people, mainly those living in tropical and subtropical regions, despite strong eradication efforts. P. falciparum depends on its complex antioxidative system based on thioredoxin and glutathione for survival. The intraerythrocytic parasite lives in a pro-oxidant environment, and the host immune response increases the oxidative burden on the parasite, which can cause major oxidative damage. Interfering with the parasites’ essential redox system is a promising target for malaria-eradicating drugs. Several antimalarial drugs are supposed to mediate their effects at least partially by increasing reactive oxygen species (ROS) in the parasite. ROS are highly reactive and damaging towards DNA, lipids and proteins. Hydrogen peroxide (H2O2) is one of the most important cellular ROS. Until now, neither molecular targets nor regulatory mechanisms and dynamic changes of H2O2-mediated signaling in P. falciparum are known. The development of the genetically encoded H2O2 sensors roGFP2-Orp1 and HyPer paved the way for non-disruptive, ratiometric, real-time, dynamic, and specific measurements of changes in H2O2 concentrations within a living cell. Studying the dynamics of H2O2 signaling in parasites exposed to antimalarial drugs can lead to a better comprehension of their molecular mode of action and give further insights into the development of future chemotherapeutic agents. In this work, the ratiometric H2O2 redox sensors roGFP2-Orp1 and HyPer-3 and the pH-insensitive version of HyPer (SypHer) were successfully transiently expressed in the cytosol of blood stage P. falciparum parasites and their functionality was systematically characterized in vitro and in cell culture. Both redox probes showed reproducible sensitivity towards H2O2 in the lower micromolar range in vitro and in cell culture. Due to the pH sensitivity of HyPer-3, parasites expressing roGFP2-Orp1 were used for evaluating the short, medium, and long-term effects of antimalarial drugs on H2O2 levels and detoxification in Plasmodium in combination with confocal live-cell imaging. None of the quinolines or artemisinins tested had significant effects on H2O2 homeostasis at pharmacologically relevant concentrations. However, pre-treatment of the cells with antimalarial drugs or heat shock led to a higher tolerance towards exogenous H2O2. Based on the data, both roGFP2-Orp1 and HyPer-3 probes are reliable and valuable tools for studying H2O2 metabolism in living malaria parasites. However, the necessity to use a pH probe in parallel makes utilizing HyPer-3 more challenging and time consuming. Determination of the effects of oxidative and pharmacological stress on the H2O2 homeostasis was optimized by stably integrating the redox sensor roGFP2-Orp1 into the genome of P. falciparum using the attB/attP integration method. Stable genomic integration overcomes limitations of transient transfection of the probes, allowing more detailed in-cell studies. For the first time H2O2 dynamics in the mitochondrial subcellular compartment could be determined using the stably integrated Mito-roGFP2-Orp1 redox probe. In both cytosol and mitochondrion, the sensors showed reproducible sensitivity towards H2O2 in the low micromolar range and towards antimalarial compounds at pharmacologically relevant concentrations. Upon short-term exposure (4 h), artemisinin derivatives, quinine and mefloquine impacted H2O2 levels in mitochondria, whereas chloroquine and G6PD inhibitors affected the cytosol; 24 h exposure to an arylmethylamino steroid and G6PD inhibitors revealed oxidation of mitochondria and cytosol, respectively. Furthermore, the redox sensors hGrx1-roGFP2 (glutathione sensor) and sfroGFP2 were expressed in the cytosol of NF54-attB blood-stage P. falciparum parasites. Prior to stable integration, studies with the episomal transfected hGrx1-roGFP2 strain were performed. Both sensors were evaluated with regard to their sensitivity towards oxidative stress in cell culture. The results showed that G6PD inhibitors and the arylmethylamino steroid disturb GSH (reduced glutathione) redox ratio in either 4 h or 24 h incubations. The redox sensors hGrx1-roGFP2 and sfroGFP2 are both reliable tools for studying redox metabolism in malaria parasites with comparable oxidation/reduction sensitivities, at which sfroGFP2 appeared to exhibit a more pronounced fluorescence intensity. Microscopic and plate reader-based detection methods were directly compared in order to evaluate plate reader-based measurement of bulk cell cultures as an

Summary
xix
alternative for single live-cell imaging. It is now possible to investigate quickly and efficiently with high reproducibility direct responses and long-term effects of compounds on H2O2/GSH homeostasis in cell populations.
Zusammenfassung
xx
Zusammenfassung
Tropische Malaria, verursacht durch den einzelligen Parasiten Plasmodium falciparum (P. falciparum), stellt noch immer eine der weltweit schwerwiegendsten Infektionskrankheiten dar. Trotz intensiver Bemühungen die Malaria auszurotten, bedroht sie hauptsächlich in tropischen und subtropischen Regionen der Erde die Gesundheit und das Leben von Millionen von Menschen. P. falciparum ist in hohem Maße von seinen komplexen antioxidativen Systemen, insbesondere dem Thioredoxin- und dem Glutathionsystem, abhängig. Der intraerythrozytäre Parasit lebt in einer pro-oxidativen Umgebung und die Immunantwort des Wirtes erhöht zusätzlich den oxidativen Stress auf den Erreger. Das Eingreifen in den Redoxstoffwechsel des Parasiten stellt daher ein vielversprechendes Ziel für neue Wirkstoffe gegen Malaria dar. Mehrere Malariamedikamente vermitteln bereits jetzt ihre Wirkungen zumindest teilweise durch das Erhöhen der Konzentrationen von reaktiven Sauerstoffspezies (ROS) im Parasiten, wodurch DNA, Lipide und Proteine geschädigt werden können. Wasserstoffperoxid (H2O2) ist eine der wichtigsten zellulären ROS. Bislang waren molekulare Targets von H2O2, H2O2-vermittelte Signaltransduktion sowie dynamische Veränderungen der H2O2-Konzentration in P. falciparum wenig untersucht. Die Entwicklung der genetisch kodierten H2O2-Sensoren roGFP2-Orp1 und HyPer haben den Weg für ratiometrische, dynamische und hochspezifische Echtzeitmessungen der H2O2-Konzentrationen in lebenden Zellen geebnet. Das Erforschen der H2O2-Dynamik in Parasiten, die Malariamedikamenten ausgesetzt sind, kann zu einem besseren Verständnis ihrer molekularen Wirkungsweise und zu weiteren Erkenntnissen für die Entwicklung von zukünftigen Chemotherapeutika beitragen. In der vorliegenden Arbeit wurden die ratiometrischen H2O2-Redoxsensoren roGFP2-Orp1 und das pH-sensitive HyPer-3 sowie die pH-insensitive Version von HyPer (SypHer) im Zytosol von P. falciparum Blutstadien erfolgreich transient exprimiert und ihre Funktionalität systematisch in vitro und in Zellkultur charakterisiert. Beide Redoxsonden haben eine reproduzierbare Sensitivität in Bezug auf H2O2 im unteren mikromolaren Bereich in vitro und in Zellkultur. Aufgrund der pH-Sensitivität von HyPer-3, wurden nur in roGFP2-Orp1 exprimierenden Parasiten mittels konfokalem live-cell imaging Kurz-, Mittel- und Langzeiteffekte von Malariamedikamenten auf H2O2-Konzentrationen und Entgiftung analysiert. Keines der getesteten Quinoline oder Artemisinine zeigte in pharmakologisch relevanten Konzentrationen eine signifikante Wirkung auf die H2O2-Homöostase. Allerdings führte die Vorbehandlung der Zellen mit Malariamedikamenten oder Hitzeschock zu einer höheren Toleranz gegenüber exogenem H2O2. Auf diesen Daten basierend, sind beide Sonden, roGFP2-Orp1 und HyPer-3, zuverlässige und wertvolle Instrumente, um den H2O2-Metabolismus in lebenden Malariaparasiten zu erforschen. Die Notwendigkeit, zeitgleich mit HyPer-3 eine pH-Sonde als Kontrolle einsetzen zu müssen, macht die Verwendung von roGFP2-Orp1 allerdings deutlich leichter. In einem zweiten Schritt wurde die Bestimmung der Effekte von oxidativem und pharmakologischem Stress auf die H2O2-Homöostase weiter optimiert. Dies gelang durch die stabile Integration des Redoxsensors roGFP2-Orp1 in das Genom von P. falciparum mittels der attB/attP-Methode. Stabile genomische Integration hebt die multiplen Einschränkungen einer transienten Transfektion der Sonden auf, was deutlich detailliertere Zellstudien erlaubt. Mittels des stabil integrierten Mito-roGFP2-Orp1 Redoxsensors konnten somit zum ersten Mal H2O2-Dynamiken in einem subzellulären Kompartiment, hier dem Mitochondrium, bestimmt werden. Sowohl im Zytosol als auch im Mitochondrion zeigten die Sensoren reproduzierbare Sensitivität gegenüber H2O2 im unteren mikromolaren Bereich und gegenüber Malariamedikamenten in pharmakologisch relevanten Konzentrationen. Bei der Kurzzeit-Inkubation (4 h) zeigten Artemisinin-Derivate, Chinin und Mefloquin deutliche Effekte auf H2O2-Konzentrationen in Mitochondrien, wogegen Chloroquin und Glucose-6-Phosphat-Dehydrogenase Inhibitoren besonders das Zytosol beeinflussten. Eine 24 h Inkubation mit einem Arylmethylaminosteroid und mit G6PD Inhibitoren zeigten eine deutliche Oxidation von Mitochondrien und Zytosol.
Zusammenfassung
xxi
Parallel zu den H2O2-Sonden wurden die Redoxsensoren hGrx1-roGFP2 (Glutathionsensor) und sfroGFP2 stabil in das Genom von P. falciparum integriert und im Zytosol von NF54-attB Blutstadienparasiten exprimiert. Vorausgegangen waren auch hier Untersuchungen mit episomal transfizierten Zellen. Beide Sensoren messen das intrazelluläre glutathionabhängige Redoxpotenzial und wurden hinsichtlich ihrer Sensitivität auf oxidativen Stress in der Zellkultur evaluiert. In 4 h und 24 h Inkubationen wurden deutliche Effekte von G6PD Inhibitoren und dem Arylmethylaminosteroid auf das Redoxpotenzial gemessen. Dabei erwiesen sich beide stabil integrierten Sensoren, hGrx1-roGFP2 und sfroGFP2, als zuverlässige Instrumente mit vergleichbaren Oxidation-/Reduktion-Sensitivitäten, wobei sich sfroGFP2 durch eine stärkere Fluoreszenzintensität auszeichnete. Mikroskopische und Plattenleser-basierte Detektionsmethoden wurden für die Sonden direkt miteinander verglichen, um Plattenleser-basierte Messungen von Zellpopulationen als Alternative zur Einzelzell-Visualisierung zu evaluieren. Auf Basis dieser Arbeiten ist es nun möglich, die H2O2/GSH-Homöostase von Zellpopulationen schnell und effizient mit einer hohen Reproduzierbarkeit zu untersuchen.
Introduction
1
1 Introduction
1.1 Malaria
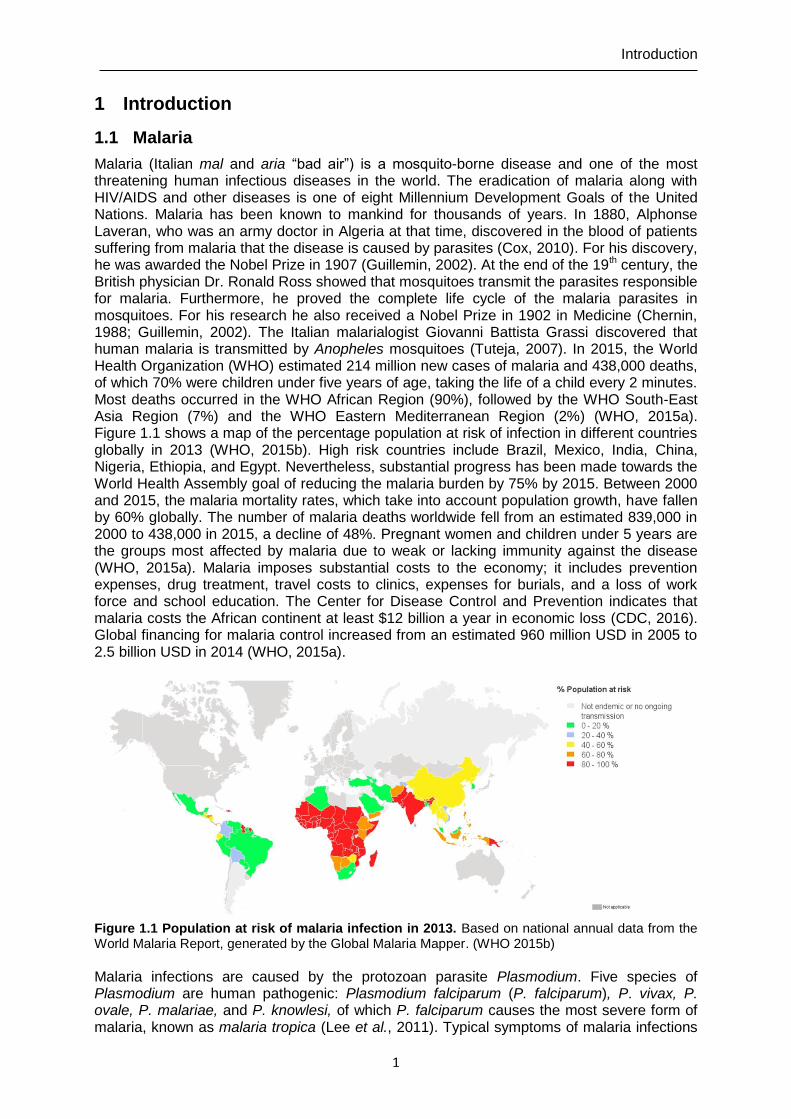
Malaria (Italian mal and aria “bad air”) is a mosquito-borne disease and one of the most threatening human infectious diseases in the world. The eradication of malaria along with HIV/AIDS and other diseases is one of eight Millennium Development Goals of the United Nations. Malaria has been known to mankind for thousands of years. In 1880, Alphonse Laveran, who was an army doctor in Algeria at that time, discovered in the blood of patients suffering from malaria that the disease is caused by parasites (Cox, 2010). For his discovery, he was awarded the Nobel Prize in 1907 (Guillemin, 2002). At the end of the 19th century, the British physician Dr. Ronald Ross showed that mosquitoes transmit the parasites responsible for malaria. Furthermore, he proved the complete life cycle of the malaria parasites in mosquitoes. For his research he also received a Nobel Prize in 1902 in Medicine (Chernin, 1988; Guillemin, 2002). The Italian malarialogist Giovanni Battista Grassi discovered that human malaria is transmitted by Anopheles mosquitoes (Tuteja, 2007). In 2015, the World Health Organization (WHO) estimated 214 million new cases of malaria and 438,000 deaths, of which 70% were children under five years of age, taking the life of a child every 2 minutes. Most deaths occurred in the WHO African Region (90%), followed by the WHO South-East Asia Region (7%) and the WHO Eastern Mediterranean Region (2%) (WHO, 2015a). Figure 1.1 shows a map of the percentage population at risk of infection in different countries globally in 2013 (WHO, 2015b). High risk countries include Brazil, Mexico, India, China, Nigeria, Ethiopia, and Egypt. Nevertheless, substantial progress has been made towards the World Health Assembly goal of reducing the malaria burden by 75% by 2015. Between 2000 and 2015, the malaria mortality rates, which take into account population growth, have fallen by 60% globally. The number of malaria deaths worldwide fell from an estimated 839,000 in 2000 to 438,000 in 2015, a decline of 48%. Pregnant women and children under 5 years are the groups most affected by malaria due to weak or lacking immunity against the disease (WHO, 2015a). Malaria imposes substantial costs to the economy; it includes prevention expenses, drug treatment, travel costs to clinics, expenses for burials, and a loss of work force and school education. The Center for Disease Control and Prevention indicates that malaria costs the African continent at least $12 billion a year in economic loss (CDC, 2016). Global financing for malaria control increased from an estimated 960 million USD in 2005 to 2.5 billion USD in 2014 (WHO, 2015a).
Figure 1.1 Population at risk of malaria infection in 2013. Based on national annual data from the World Malaria Report, generated by the Global Malaria Mapper. (WHO 2015b)
Malaria infections are caused by the protozoan parasite Plasmodium. Five species of Plasmodium are human pathogenic: Plasmodium falciparum (P. falciparum), P. vivax, P. ovale, P. malariae, and P. knowlesi, of which P. falciparum causes the most severe form of malaria, known as malaria tropica (Lee et al., 2011). Typical symptoms of malaria infections
Introduction
2
include headache, fever, shivering, respiratory diseases, joint ache, nausea, and delirium and appear seven to thirty days after the bite of an infected female Anopheles mosquito (Taylor, 2009; CDC, 2015a). P. falciparum is the only human pathogenic species to cause cerebral malaria, one of the most common fatal neurological complications of severe malaria. Infected red blood cells (iRBCs) expose parasite-derived molecules on the surface of the erythrocyte and sequester in the brain microvasculature, which leads to reduced levels of consciousness, coma, and if untreated death (MacPherson et al., 1985; Idro et al., 2010). P. falciparum sequestration in pregnant women can lead to placental malaria, which might lead to anemia, abortion, stillbirth, and low birth weight (Uneke, 2007). In most cases malaria infections are not fatal, and reasons for transition from mild to serious infections are not well understood. Severe malaria is a complex process, including infection of a high number of RBCs, which results in destruction of RBCs and anemia, and a combination of inflammatory processes. Uncomplicated P. falciparum infections are usually treated with artemisinin-based combination therapies (ACTs) (WHO, 2015). Although a number of antimalarial drugs are available from seven drug classes e.g. 4-aminoquinolines, arylaminoalcohols, 8-aminoquinolines, artemisinins, antifolates, inhibitors of the respiratory chain, and antibiotics (Schlitzer, 2008), malaria eradication has not yet been achieved. One of the main problems is the emerging resistance of Plasmodium parasites to most antimalarial drugs (Dondorp et al., 2009; Egan and Kaschula, 2007; Trape, 2001; Ginsburg, 2005). This results in an ongoing need for novel antimalarial drugs and the intense search for new parasitic drug targets. The Global Technical Strategy for Malaria sets ambitious but achievable goals for 2030 in reducing malaria case incidence and mortality rates globally by at least 90%, eliminating malaria in at least 35 countries, and preventing a resurgence of malaria in all countries that are malaria free (WHO, 2015c).
1.1.1 Anopheles spp.
The female Anopheles mosquito transmits the malaria parasite among humans. Of the approximately 430 Anopheles species found worldwide except in Antarctica, about 30 to 40 transmit malaria. In South America A. darlingi and A. marajoara are the main vectors of malaria, in Africa mainly A. gambiae and A. arabiensis, and in India mainly A. stephensi and A. culicifacies, transmit the parasite. A. gambiae, the principal vector in sub-Saharan Africa, is a particularly effective malaria vector because of its preference for feeding on humans and its long life compared to some other anopheline species. The adult male feeds on nectar, while the female adult feeds primarily upon blood. Mosquitoes undergo four stages in their life cycle: egg, larva, pupa, and adult; the first three stages are aquatic. Different species show different patterns of feeding and resting. They are active at dusk or dawn (crepuscular) or active at night (nocturnal); some feed indoors (endophagic) while others feed outdoors (exophagic). After blood feeding, some Anopheles mosquitoes rest indoors (endophilic), while others prefer to rest outdoors (exophilic). Furthermore, Anopheles mosquitoes have preferences for different hosts. Therefore, appropriate strategies for vector control take biology, behavior, host preference, susceptibility to Plasmodium and insecticides into consideration (CDC, 2015b).
1.1.2 Plasmodium
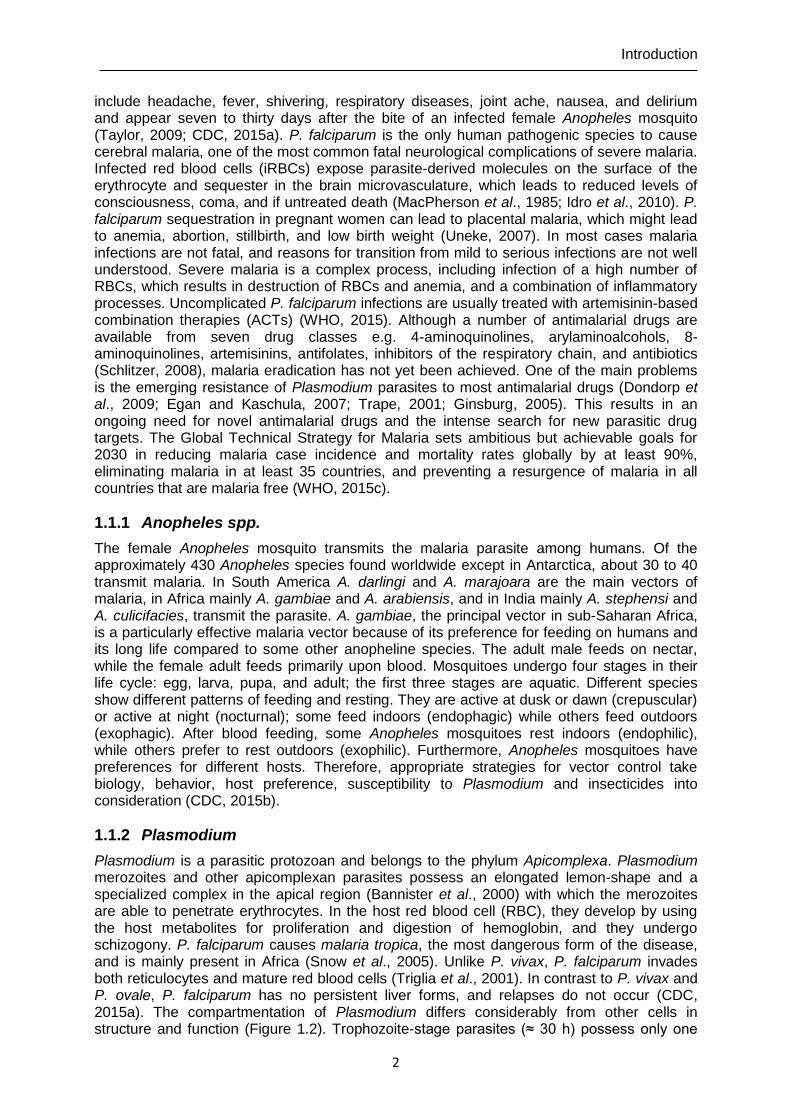
Plasmodium is a parasitic protozoan and belongs to the phylum Apicomplexa. Plasmodium merozoites and other apicomplexan parasites possess an elongated lemon-shape and a specialized complex in the apical region (Bannister et al., 2000) with which the merozoites are able to penetrate erythrocytes. In the host red blood cell (RBC), they develop by using the host metabolites for proliferation and digestion of hemoglobin, and they undergo schizogony. P. falciparum causes malaria tropica, the most dangerous form of the disease, and is mainly present in Africa (Snow et al., 2005). Unlike P. vivax, P. falciparum invades both reticulocytes and mature red blood cells (Triglia et al., 2001). In contrast to P. vivax and P. ovale, P. falciparum has no persistent liver forms, and relapses do not occur (CDC, 2015a). The compartmentation of Plasmodium differs considerably from other cells in structure and function (Figure 1.2). Trophozoite-stage parasites (≈ 30 h) possess only one
Introduction
3
mitochondrion, a plastid, called the apicoplast (Lim and McFadden, 2010), which is attached to the mitochondrion, as well as a digestive vacuole (DV, also referred to as pigment vacuole or food vacuole), where hemoglobin degradation takes place (Moura et al., 2009). The parasite forms a parasitophorous vacuolar membrane, which differs substantially from other known biological membranes (Lingelbach and Joiner, 1998).
Figure 1.2 Mid-trophozoite stage of Plasmodium. Mid-trophozoite stage of P. falciparum, characterized by its irregular outline, the increase in protein synthesizing apparatus, increased feeding through multiple cytostomes, growth of the pigment vacuole, and structures associated with export of parasite proteins (Golgi body, exocytic vesicles). Inset: relative sizes of the trophozoite and red blood cell (RBC) as seen by light microscopy. ER, endoplasmic reticulum. (Bannister et al., 2000)
1.1.2.1 The P. falciparum life cycle
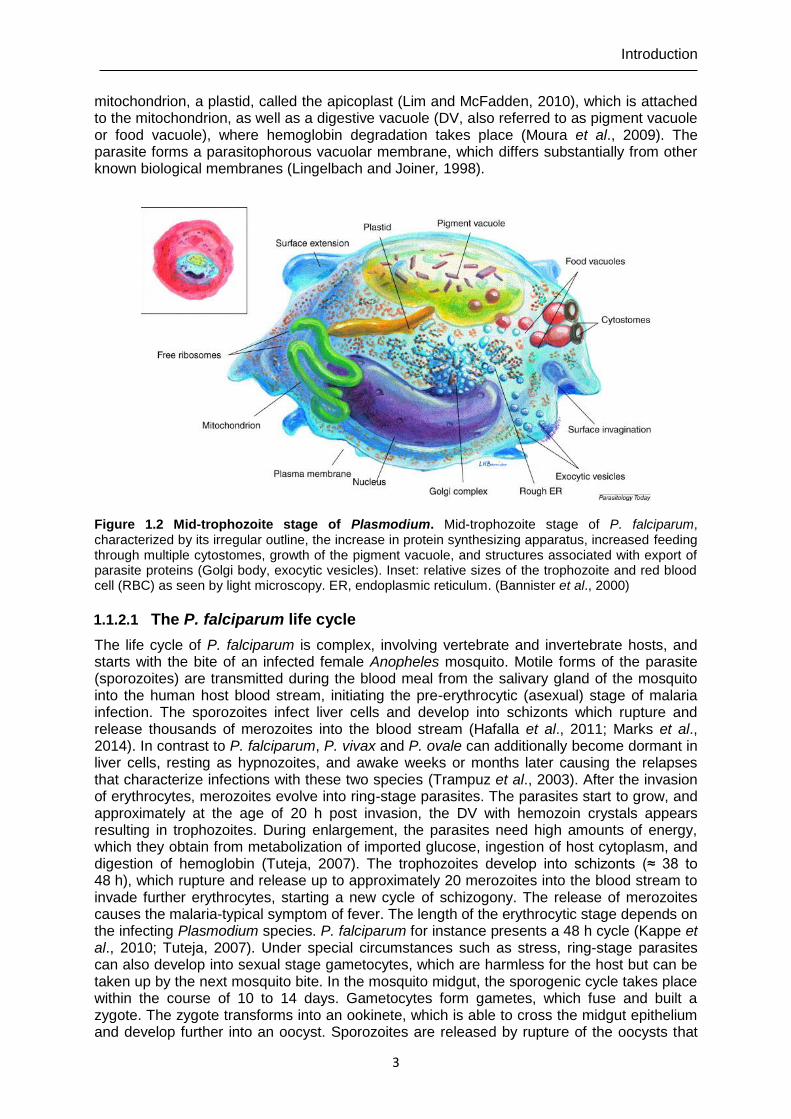
The life cycle of P. falciparum is complex, involving vertebrate and invertebrate hosts, and starts with the bite of an infected female Anopheles mosquito. Motile forms of the parasite (sporozoites) are transmitted during the blood meal from the salivary gland of the mosquito into the human host blood stream, initiating the pre-erythrocytic (asexual) stage of malaria infection. The sporozoites infect liver cells and develop into schizonts which rupture and release thousands of merozoites into the blood stream (Hafalla et al., 2011; Marks et al., 2014). In contrast to P. falciparum, P. vivax and P. ovale can additionally become dormant in liver cells, resting as hypnozoites, and awake weeks or months later causing the relapses that characterize infections with these two species (Trampuz et al., 2003). After the invasion of erythrocytes, merozoites evolve into ring-stage parasites. The parasites start to grow, and approximately at the age of 20 h post invasion, the DV with hemozoin crystals appears resulting in trophozoites. During enlargement, the parasites need high amounts of energy, which they obtain from metabolization of imported glucose, ingestion of host cytoplasm, and digestion of hemoglobin (Tuteja, 2007). The trophozoites develop into schizonts (≈ 38 to 48 h), which rupture and release up to approximately 20 merozoites into the blood stream to invade further erythrocytes, starting a new cycle of schizogony. The release of merozoites causes the malaria-typical symptom of fever. The length of the erythrocytic stage depends on the infecting Plasmodium species. P. falciparum for instance presents a 48 h cycle (Kappe et al., 2010; Tuteja, 2007). Under special circumstances such as stress, ring-stage parasites can also develop into sexual stage gametocytes, which are harmless for the host but can be taken up by the next mosquito bite. In the mosquito midgut, the sporogenic cycle takes place within the course of 10 to 14 days. Gametocytes form gametes, which fuse and built a zygote. The zygote transforms into an ookinete, which is able to cross the midgut epithelium and develop further into an oocyst. Sporozoites are released by rupture of the oocysts that
Introduction
4
enter the salivary gland of the mosquito and are transmitted to the human host through an infectious mosquito’s bite (Marks et al., 2014; Kappe et al., 2010; Tuteja, 2007) (Figure 1.3).
Figure 1.3 P. falciparum life cycle. P. falciparum undergoes a complex developmental cycle in man (sexual stage) and mosquito (asexual stage) that requires rapid adaptation to various environments. (Cowmen et al., 2012)
1.1.2.2 P. falciparum subcellular compartments
Plasmodium harbors a non-photosynthetic plastid derived from the endobiosis of Cyanobacteria called the apicoplast, which is essential for the parasite’s survival (Yeh and DeRisi, 2011). The apicoplast has four membranes and harbors biochemical pathways such as fatty acid synthesis, lipoate synthesis, isoprenoid synthesis, iron-sulfur cluster (FeS) synthesis, tRNA modification, and in part heme biosynthesis (Ralph et al., 2004) (Figure 1.4); it also has a small circular genome ≈ 35 kb in size (Wilson et al., 1996). Fatty acids are essential for the formation of membrane lipids and can be obtained by scavenging from the host or via the type two fatty acid synthesis (FAS-II) pathway (Tarun et al., 2009). For P. falciparum’s asexual blood stage replication, the FAS-II pathway is not essential (Vaughan et al., 2009). Isoprenoids are synthesized by the mevalonate-independent methylerythritol phosphate (MEP) pathway in P. falciparum, also known as the 1-deoxy-D-xylulose 5-phosphate (DOXP) pathway. The pathway leads to the production of isopentenyl diphosphate (IPP) and dimethylallyl diphosphate, the precursors of ubiquinones and dolichols and the prenylation of proteins. The MEP isoprenoid pathway was recently shown to be essential for the survival of erythrocytic stage malaria parasites (Yeh and DeRisi, 2011; Jomaa et al., 1999). Isoprenoids are the only metabolites produced in the apicoplast that are needed outside the organelle (Yeh and DeRisi, 2011). FeS clusters are protein cofactors found in most organisms and have multifunctional roles: they transfer single electrons, donate sulfur atoms, initiate free radical chemistry, sense oxygen, and have structural roles (Beinert, 2000; Brzoska et al., 2006). FeS cluster proteins are likely required for the production of essential isoprenoids. In P. falciparum, two of three known FeS cluster biosynthesis pathways are present: the mitochondrial Isc pathway and the Suf pathway located in the apicoplast. Both FeS cluster synthesis pathways follow the same basic steps to mobilize sulfur: cluster assembly and cluster transfer. The Suf pathway is not found in humans but is essential for maintaining the apicoplast organelle (Gisselberg et al., 2013). Heme biosynthesis is initiated in the mitochondrion and is therefore explained in more detail in the following paragraph.
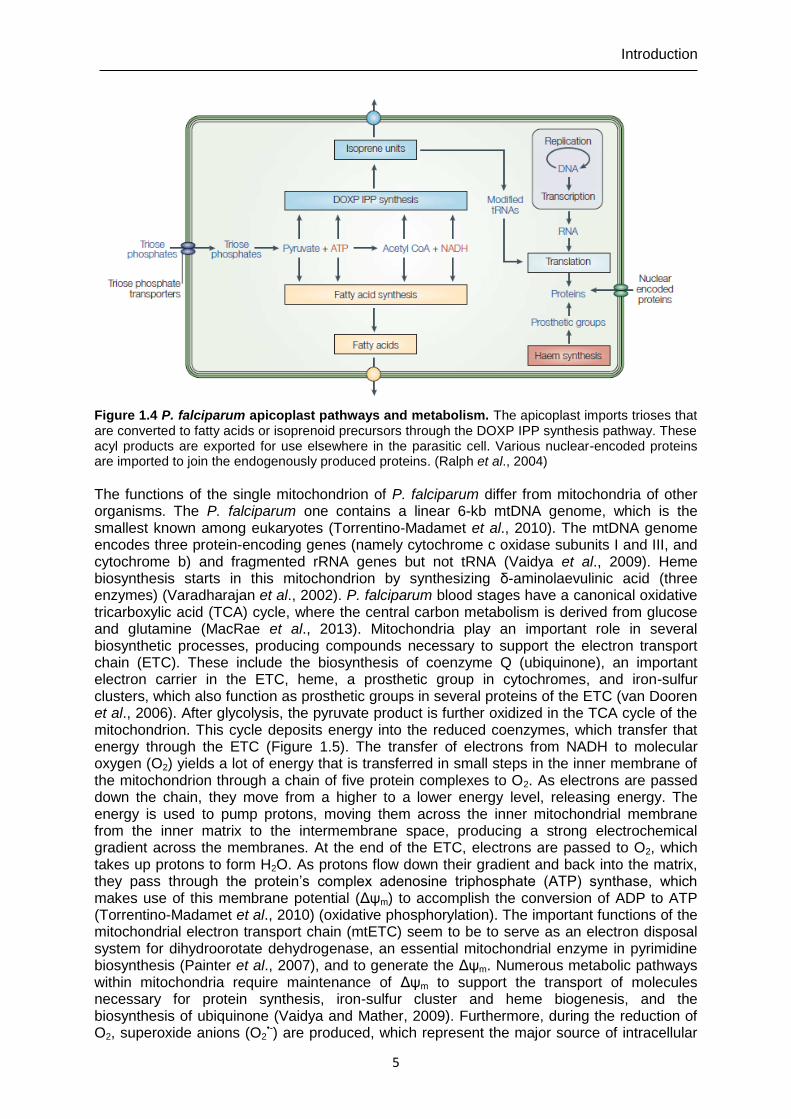
Introduction
5
Figure 1.4 P. falciparum apicoplast pathways and metabolism. The apicoplast imports trioses that are converted to fatty acids or isoprenoid precursors through the DOXP IPP synthesis pathway. These acyl products are exported for use elsewhere in the parasitic cell. Various nuclear-encoded proteins are imported to join the endogenously produced proteins. (Ralph et al., 2004) The functions of the single mitochondrion of P. falciparum differ from mitochondria of other organisms. The P. falciparum one contains a linear 6-kb mtDNA genome, which is the smallest known among eukaryotes (Torrentino-Madamet et al., 2010). The mtDNA genome encodes three protein-encoding genes (namely cytochrome c oxidase subunits I and III, and cytochrome b) and fragmented rRNA genes but not tRNA (Vaidya et al., 2009). Heme biosynthesis starts in this mitochondrion by synthesizing δ-aminolaevulinic acid (three enzymes) (Varadharajan et al., 2002). P. falciparum blood stages have a canonical oxidative tricarboxylic acid (TCA) cycle, where the central carbon metabolism is derived from glucose and glutamine (MacRae et al., 2013). Mitochondria play an important role in several biosynthetic processes, producing compounds necessary to support the electron transport chain (ETC). These include the biosynthesis of coenzyme Q (ubiquinone), an important electron carrier in the ETC, heme, a prosthetic group in cytochromes, and iron-sulfur clusters, which also function as prosthetic groups in several proteins of the ETC (van Dooren et al., 2006). After glycolysis, the pyruvate product is further oxidized in the TCA cycle of the mitochondrion. This cycle deposits energy into the reduced coenzymes, which transfer that energy through the ETC (Figure 1.5). The transfer of electrons from NADH to molecular oxygen (O2) yields a lot of energy that is transferred in small steps in the inner membrane of the mitochondrion through a chain of five protein complexes to O2. As electrons are passed down the chain, they move from a higher to a lower energy level, releasing energy. The energy is used to pump protons, moving them across the inner mitochondrial membrane from the inner matrix to the intermembrane space, producing a strong electrochemical gradient across the membranes. At the end of the ETC, electrons are passed to O2, which takes up protons to form H2O. As protons flow down their gradient and back into the matrix, they pass through the protein’s complex adenosine triphosphate (ATP) synthase, which makes use of this membrane potential (Δψm) to accomplish the conversion of ADP to ATP (Torrentino-Madamet et al., 2010) (oxidative phosphorylation). The important functions of the mitochondrial electron transport chain (mtETC) seem to be to serve as an electron disposal system for dihydroorotate dehydrogenase, an essential mitochondrial enzyme in pyrimidine biosynthesis (Painter et al., 2007), and to generate the Δψm. Numerous metabolic pathways within mitochondria require maintenance of Δψm to support the transport of molecules necessary for protein synthesis, iron-sulfur cluster and heme biogenesis, and the biosynthesis of ubiquinone (Vaidya and Mather, 2009). Furthermore, during the reduction of O2, superoxide anions (O2
•-) are produced, which represent the major source of intracellular
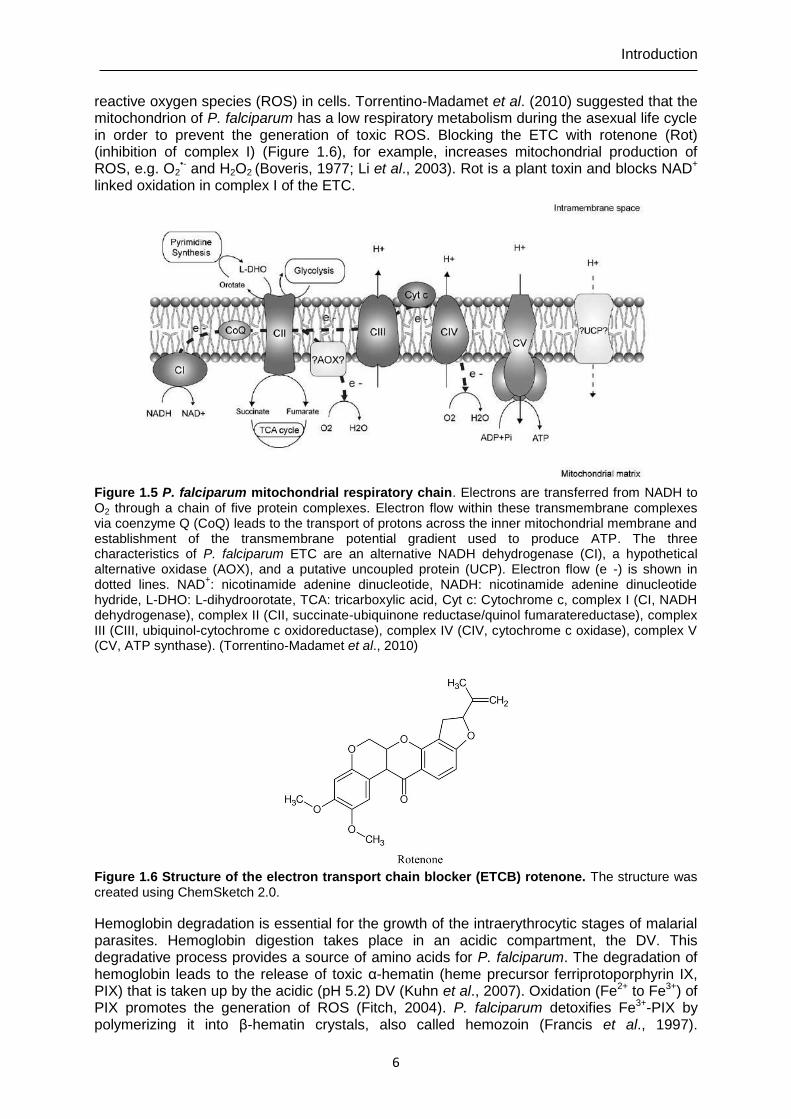
Introduction
6
reactive oxygen species (ROS) in cells. Torrentino-Madamet et al. (2010) suggested that the mitochondrion of P. falciparum has a low respiratory metabolism during the asexual life cycle in order to prevent the generation of toxic ROS. Blocking the ETC with rotenone (Rot) (inhibition of complex I) (Figure 1.6), for example, increases mitochondrial production of ROS, e.g. O2
•- and H2O2 (Boveris, 1977; Li et al., 2003). Rot is a plant toxin and blocks NAD+ linked oxidation in complex I of the ETC.
Figure 1.5 P. falciparum mitochondrial respiratory chain. Electrons are transferred from NADH to O2 through a chain of five protein complexes. Electron flow within these transmembrane complexes via coenzyme Q (CoQ) leads to the transport of protons across the inner mitochondrial membrane and establishment of the transmembrane potential gradient used to produce ATP. The three characteristics of P. falciparum ETC are an alternative NADH dehydrogenase (CI), a hypothetical alternative oxidase (AOX), and a putative uncoupled protein (UCP). Electron flow (e -) is shown in dotted lines. NAD
+: nicotinamide adenine dinucleotide, NADH: nicotinamide adenine dinucleotide
hydride, L-DHO: L-dihydroorotate, TCA: tricarboxylic acid, Cyt c: Cytochrome c, complex I (CI, NADH dehydrogenase), complex II (CII, succinate-ubiquinone reductase/quinol fumaratereductase), complex III (CIII, ubiquinol-cytochrome c oxidoreductase), complex IV (CIV, cytochrome c oxidase), complex V (CV, ATP synthase). (Torrentino-Madamet et al., 2010)
Figure 1.6 Structure of the electron transport chain blocker (ETCB) rotenone. The structure was created using ChemSketch 2.0.
Hemoglobin degradation is essential for the growth of the intraerythrocytic stages of malarial parasites. Hemoglobin digestion takes place in an acidic compartment, the DV. This degradative process provides a source of amino acids for P. falciparum. The degradation of hemoglobin leads to the release of toxic α-hematin (heme precursor ferriprotoporphyrin IX, PIX) that is taken up by the acidic (pH 5.2) DV (Kuhn et al., 2007). Oxidation (Fe2+ to Fe3+) of PIX promotes the generation of ROS (Fitch, 2004). P. falciparum detoxifies Fe3+-PIX by polymerizing it into β-hematin crystals, also called hemozoin (Francis et al., 1997).
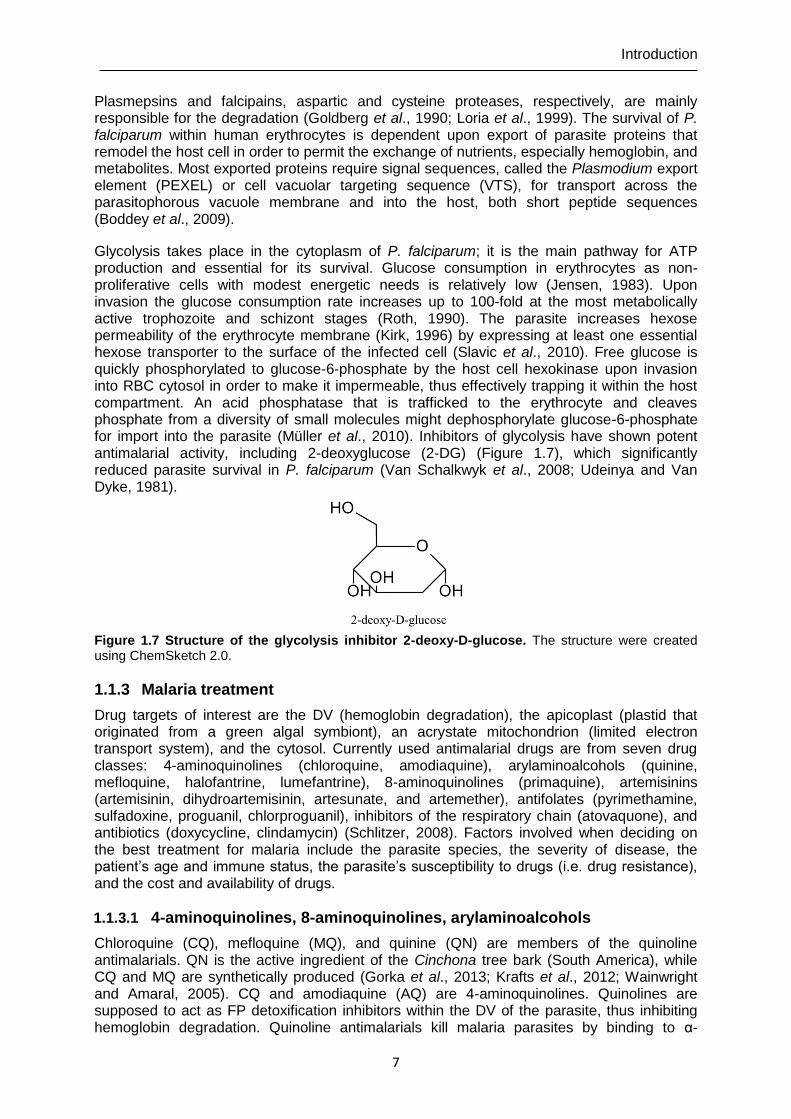
Introduction
7
Plasmepsins and falcipains, aspartic and cysteine proteases, respectively, are mainly responsible for the degradation (Goldberg et al., 1990; Loria et al., 1999). The survival of P. falciparum within human erythrocytes is dependent upon export of parasite proteins that remodel the host cell in order to permit the exchange of nutrients, especially hemoglobin, and metabolites. Most exported proteins require signal sequences, called the Plasmodium export element (PEXEL) or cell vacuolar targeting sequence (VTS), for transport across the parasitophorous vacuole membrane and into the host, both short peptide sequences (Boddey et al., 2009).
Glycolysis takes place in the cytoplasm of P. falciparum; it is the main pathway for ATP production and essential for its survival. Glucose consumption in erythrocytes as non-proliferative cells with modest energetic needs is relatively low (Jensen, 1983). Upon invasion the glucose consumption rate increases up to 100-fold at the most metabolically active trophozoite and schizont stages (Roth, 1990). The parasite increases hexose permeability of the erythrocyte membrane (Kirk, 1996) by expressing at least one essential hexose transporter to the surface of the infected cell (Slavic et al., 2010). Free glucose is quickly phosphorylated to glucose-6-phosphate by the host cell hexokinase upon invasion into RBC cytosol in order to make it impermeable, thus effectively trapping it within the host compartment. An acid phosphatase that is trafficked to the erythrocyte and cleaves phosphate from a diversity of small molecules might dephosphorylate glucose-6-phosphate for import into the parasite (Müller et al., 2010). Inhibitors of glycolysis have shown potent antimalarial activity, including 2-deoxyglucose (2-DG) (Figure 1.7), which significantly reduced parasite survival in P. falciparum (Van Schalkwyk et al., 2008; Udeinya and Van Dyke, 1981).
Figure 1.7 Structure of the glycolysis inhibitor 2-deoxy-D-glucose. The structure were created using ChemSketch 2.0.
1.1.3 Malaria treatment
Drug targets of interest are the DV (hemoglobin degradation), the apicoplast (plastid that originated from a green algal symbiont), an acrystate mitochondrion (limited electron transport system), and the cytosol. Currently used antimalarial drugs are from seven drug classes: 4-aminoquinolines (chloroquine, amodiaquine), arylaminoalcohols (quinine, mefloquine, halofantrine, lumefantrine), 8-aminoquinolines (primaquine), artemisinins (artemisinin, dihydroartemisinin, artesunate, and artemether), antifolates (pyrimethamine, sulfadoxine, proguanil, chlorproguanil), inhibitors of the respiratory chain (atovaquone), and antibiotics (doxycycline, clindamycin) (Schlitzer, 2008). Factors involved when deciding on the best treatment for malaria include the parasite species, the severity of disease, the patient’s age and immune status, the parasite’s susceptibility to drugs (i.e. drug resistance), and the cost and availability of drugs.
1.1.3.1 4-aminoquinolines, 8-aminoquinolines, arylaminoalcohols
Chloroquine (CQ), mefloquine (MQ), and quinine (QN) are members of the quinoline antimalarials. QN is the active ingredient of the Cinchona tree bark (South America), while CQ and MQ are synthetically produced (Gorka et al., 2013; Krafts et al., 2012; Wainwright and Amaral, 2005). CQ and amodiaquine (AQ) are 4-aminoquinolines. Quinolines are supposed to act as FP detoxification inhibitors within the DV of the parasite, thus inhibiting hemoglobin degradation. Quinoline antimalarials kill malaria parasites by binding to α-
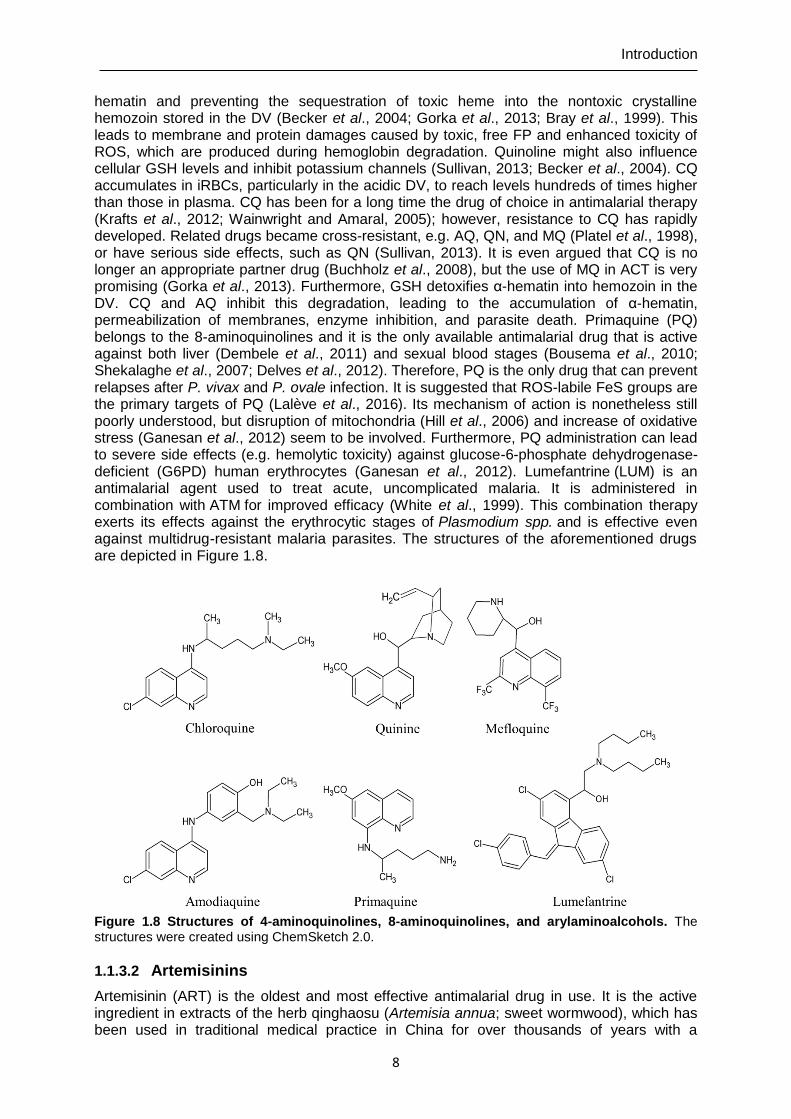
Introduction
8
hematin and preventing the sequestration of toxic heme into the nontoxic crystalline hemozoin stored in the DV (Becker et al., 2004; Gorka et al., 2013; Bray et al., 1999). This leads to membrane and protein damages caused by toxic, free FP and enhanced toxicity of ROS, which are produced during hemoglobin degradation. Quinoline might also influence cellular GSH levels and inhibit potassium channels (Sullivan, 2013; Becker et al., 2004). CQ accumulates in iRBCs, particularly in the acidic DV, to reach levels hundreds of times higher than those in plasma. CQ has been for a long time the drug of choice in antimalarial therapy (Krafts et al., 2012; Wainwright and Amaral, 2005); however, resistance to CQ has rapidly developed. Related drugs became cross-resistant, e.g. AQ, QN, and MQ (Platel et al., 1998), or have serious side effects, such as QN (Sullivan, 2013). It is even argued that CQ is no longer an appropriate partner drug (Buchholz et al., 2008), but the use of MQ in ACT is very promising (Gorka et al., 2013). Furthermore, GSH detoxifies α-hematin into hemozoin in the DV. CQ and AQ inhibit this degradation, leading to the accumulation of α-hematin, permeabilization of membranes, enzyme inhibition, and parasite death. Primaquine (PQ) belongs to the 8-aminoquinolines and it is the only available antimalarial drug that is active against both liver (Dembele et al., 2011) and sexual blood stages (Bousema et al., 2010; Shekalaghe et al., 2007; Delves et al., 2012). Therefore, PQ is the only drug that can prevent relapses after P. vivax and P. ovale infection. It is suggested that ROS-labile FeS groups are the primary targets of PQ (Lalève et al., 2016). Its mechanism of action is nonetheless still poorly understood, but disruption of mitochondria (Hill et al., 2006) and increase of oxidative stress (Ganesan et al., 2012) seem to be involved. Furthermore, PQ administration can lead to severe side effects (e.g. hemolytic toxicity) against glucose-6-phosphate dehydrogenase-deficient (G6PD) human erythrocytes (Ganesan et al., 2012). Lumefantrine (LUM) is an antimalarial agent used to treat acute, uncomplicated malaria. It is administered in combination with ATM for improved efficacy (White et al., 1999). This combination therapy exerts its effects against the erythrocytic stages of Plasmodium spp. and is effective even against multidrug-resistant malaria parasites. The structures of the aforementioned drugs are depicted in Figure 1.8.
Figure 1.8 Structures of 4-aminoquinolines, 8-aminoquinolines, and arylaminoalcohols. The structures were created using ChemSketch 2.0.
1.1.3.2 Artemisinins
Artemisinin (ART) is the oldest and most effective antimalarial drug in use. It is the active ingredient in extracts of the herb qinghaosu (Artemisia annua; sweet wormwood), which has been used in traditional medical practice in China for over thousands of years with a
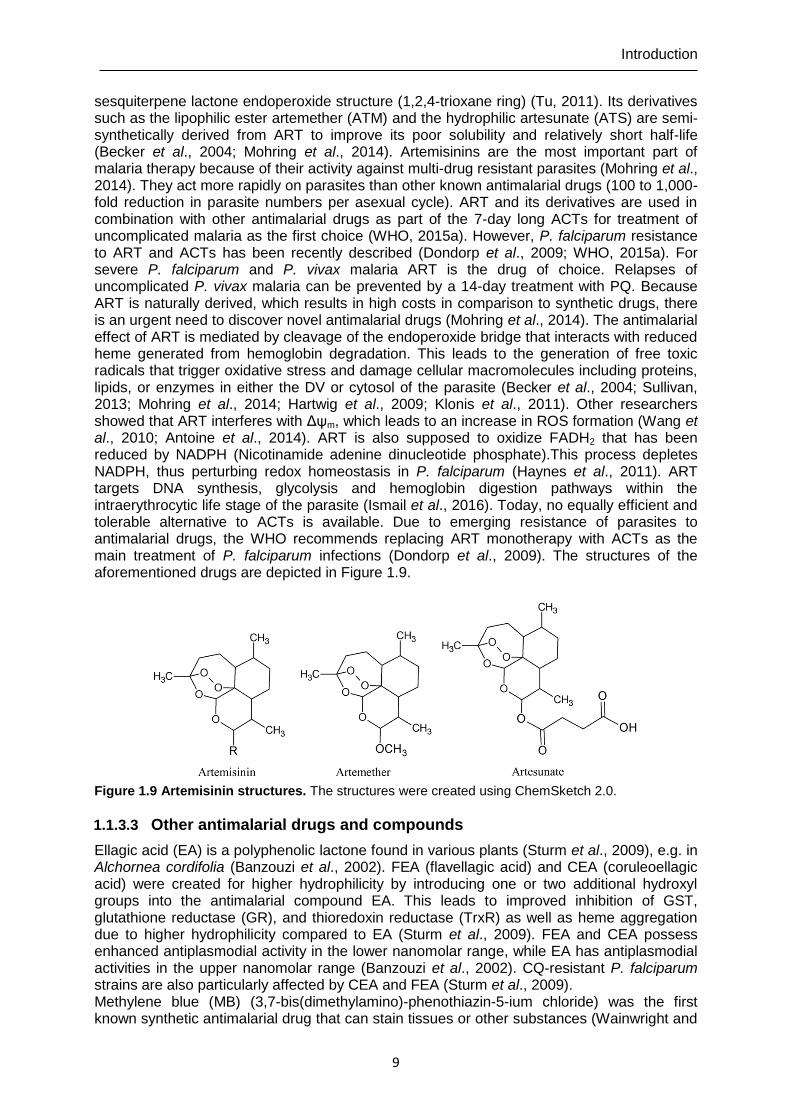
Introduction
9
sesquiterpene lactone endoperoxide structure (1,2,4-trioxane ring) (Tu, 2011). Its derivatives such as the lipophilic ester artemether (ATM) and the hydrophilic artesunate (ATS) are semi-synthetically derived from ART to improve its poor solubility and relatively short half-life (Becker et al., 2004; Mohring et al., 2014). Artemisinins are the most important part of malaria therapy because of their activity against multi-drug resistant parasites (Mohring et al., 2014). They act more rapidly on parasites than other known antimalarial drugs (100 to 1,000-fold reduction in parasite numbers per asexual cycle). ART and its derivatives are used in combination with other antimalarial drugs as part of the 7-day long ACTs for treatment of uncomplicated malaria as the first choice (WHO, 2015a). However, P. falciparum resistance to ART and ACTs has been recently described (Dondorp et al., 2009; WHO, 2015a). For severe P. falciparum and P. vivax malaria ART is the drug of choice. Relapses of uncomplicated P. vivax malaria can be prevented by a 14-day treatment with PQ. Because ART is naturally derived, which results in high costs in comparison to synthetic drugs, there is an urgent need to discover novel antimalarial drugs (Mohring et al., 2014). The antimalarial effect of ART is mediated by cleavage of the endoperoxide bridge that interacts with reduced heme generated from hemoglobin degradation. This leads to the generation of free toxic radicals that trigger oxidative stress and damage cellular macromolecules including proteins, lipids, or enzymes in either the DV or cytosol of the parasite (Becker et al., 2004; Sullivan, 2013; Mohring et al., 2014; Hartwig et al., 2009; Klonis et al., 2011). Other researchers showed that ART interferes with Δψm, which leads to an increase in ROS formation (Wang et al., 2010; Antoine et al., 2014). ART is also supposed to oxidize FADH2 that has been reduced by NADPH (Nicotinamide adenine dinucleotide phosphate).This process depletes NADPH, thus perturbing redox homeostasis in P. falciparum (Haynes et al., 2011). ART targets DNA synthesis, glycolysis and hemoglobin digestion pathways within the intraerythrocytic life stage of the parasite (Ismail et al., 2016). Today, no equally efficient and tolerable alternative to ACTs is available. Due to emerging resistance of parasites to antimalarial drugs, the WHO recommends replacing ART monotherapy with ACTs as the main treatment of P. falciparum infections (Dondorp et al., 2009). The structures of the aforementioned drugs are depicted in Figure 1.9.
Figure 1.9 Artemisinin structures. The structures were created using ChemSketch 2.0.
1.1.3.3 Other antimalarial drugs and compounds
Ellagic acid (EA) is a polyphenolic lactone found in various plants (Sturm et al., 2009), e.g. in Alchornea cordifolia (Banzouzi et al., 2002). FEA (flavellagic acid) and CEA (coruleoellagic acid) were created for higher hydrophilicity by introducing one or two additional hydroxyl groups into the antimalarial compound EA. This leads to improved inhibition of GST, glutathione reductase (GR), and thioredoxin reductase (TrxR) as well as heme aggregation due to higher hydrophilicity compared to EA (Sturm et al., 2009). FEA and CEA possess enhanced antiplasmodial activity in the lower nanomolar range, while EA has antiplasmodial activities in the upper nanomolar range (Banzouzi et al., 2002). CQ-resistant P. falciparum strains are also particularly affected by CEA and FEA (Sturm et al., 2009). Methylene blue (MB) (3,7-bis(dimethylamino)-phenothiazin-5-ium chloride) was the first known synthetic antimalarial drug that can stain tissues or other substances (Wainwright and
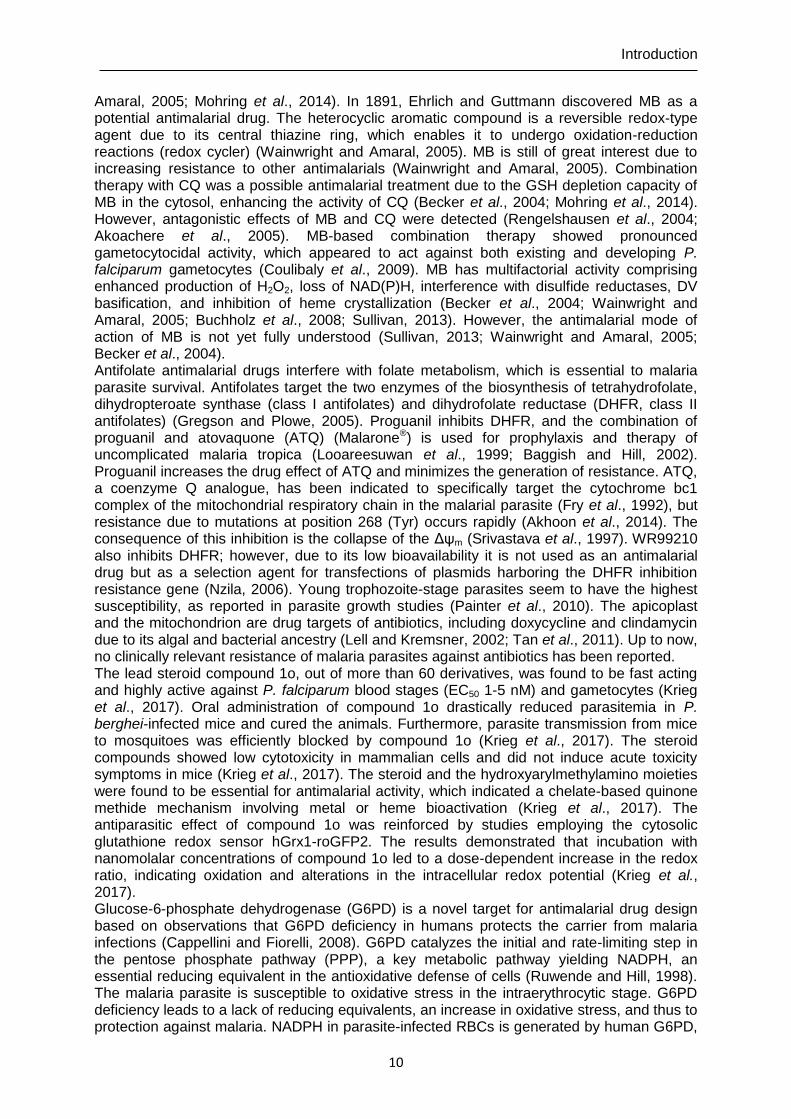
Introduction
10
Amaral, 2005; Mohring et al., 2014). In 1891, Ehrlich and Guttmann discovered MB as a potential antimalarial drug. The heterocyclic aromatic compound is a reversible redox-type agent due to its central thiazine ring, which enables it to undergo oxidation-reduction reactions (redox cycler) (Wainwright and Amaral, 2005). MB is still of great interest due to increasing resistance to other antimalarials (Wainwright and Amaral, 2005). Combination therapy with CQ was a possible antimalarial treatment due to the GSH depletion capacity of MB in the cytosol, enhancing the activity of CQ (Becker et al., 2004; Mohring et al., 2014). However, antagonistic effects of MB and CQ were detected (Rengelshausen et al., 2004; Akoachere et al., 2005). MB-based combination therapy showed pronounced gametocytocidal activity, which appeared to act against both existing and developing P. falciparum gametocytes (Coulibaly et al., 2009). MB has multifactorial activity comprising enhanced production of H2O2, loss of NAD(P)H, interference with disulfide reductases, DV basification, and inhibition of heme crystallization (Becker et al., 2004; Wainwright and Amaral, 2005; Buchholz et al., 2008; Sullivan, 2013). However, the antimalarial mode of action of MB is not yet fully understood (Sullivan, 2013; Wainwright and Amaral, 2005; Becker et al., 2004). Antifolate antimalarial drugs interfere with folate metabolism, which is essential to malaria parasite survival. Antifolates target the two enzymes of the biosynthesis of tetrahydrofolate, dihydropteroate synthase (class I antifolates) and dihydrofolate reductase (DHFR, class II antifolates) (Gregson and Plowe, 2005). Proguanil inhibits DHFR, and the combination of proguanil and atovaquone (ATQ) (Malarone®) is used for prophylaxis and therapy of uncomplicated malaria tropica (Looareesuwan et al., 1999; Baggish and Hill, 2002). Proguanil increases the drug effect of ATQ and minimizes the generation of resistance. ATQ, a coenzyme Q analogue, has been indicated to specifically target the cytochrome bc1 complex of the mitochondrial respiratory chain in the malarial parasite (Fry et al., 1992), but resistance due to mutations at position 268 (Tyr) occurs rapidly (Akhoon et al., 2014). The consequence of this inhibition is the collapse of the Δψm (Srivastava et al., 1997). WR99210 also inhibits DHFR; however, due to its low bioavailability it is not used as an antimalarial drug but as a selection agent for transfections of plasmids harboring the DHFR inhibition resistance gene (Nzila, 2006). Young trophozoite-stage parasites seem to have the highest susceptibility, as reported in parasite growth studies (Painter et al., 2010). The apicoplast and the mitochondrion are drug targets of antibiotics, including doxycycline and clindamycin due to its algal and bacterial ancestry (Lell and Kremsner, 2002; Tan et al., 2011). Up to now, no clinically relevant resistance of malaria parasites against antibiotics has been reported. The lead steroid compound 1o, out of more than 60 derivatives, was found to be fast acting and highly active against P. falciparum blood stages (EC50 1-5 nM) and gametocytes (Krieg et al., 2017). Oral administration of compound 1o drastically reduced parasitemia in P. berghei-infected mice and cured the animals. Furthermore, parasite transmission from mice to mosquitoes was efficiently blocked by compound 1o (Krieg et al., 2017). The steroid compounds showed low cytotoxicity in mammalian cells and did not induce acute toxicity symptoms in mice (Krieg et al., 2017). The steroid and the hydroxyarylmethylamino moieties were found to be essential for antimalarial activity, which indicated a chelate-based quinone methide mechanism involving metal or heme bioactivation (Krieg et al., 2017). The antiparasitic effect of compound 1o was reinforced by studies employing the cytosolic glutathione redox sensor hGrx1-roGFP2. The results demonstrated that incubation with nanomolalar concentrations of compound 1o led to a dose-dependent increase in the redox ratio, indicating oxidation and alterations in the intracellular redox potential (Krieg et al., 2017). Glucose-6-phosphate dehydrogenase (G6PD) is a novel target for antimalarial drug design based on observations that G6PD deficiency in humans protects the carrier from malaria infections (Cappellini and Fiorelli, 2008). G6PD catalyzes the initial and rate-limiting step in the pentose phosphate pathway (PPP), a key metabolic pathway yielding NADPH, an essential reducing equivalent in the antioxidative defense of cells (Ruwende and Hill, 1998). The malaria parasite is susceptible to oxidative stress in the intraerythrocytic stage. G6PD deficiency leads to a lack of reducing equivalents, an increase in oxidative stress, and thus to protection against malaria. NADPH in parasite-infected RBCs is generated by human G6PD,
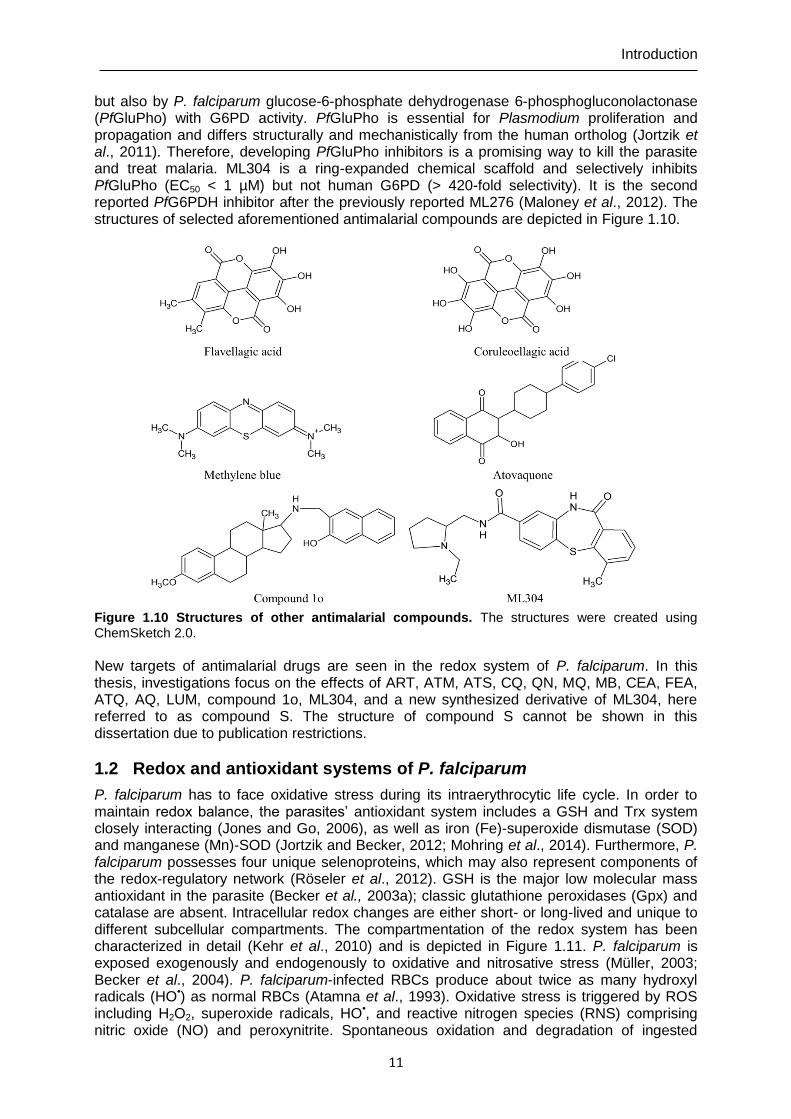
Introduction
11
but also by P. falciparum glucose-6-phosphate dehydrogenase 6-phosphogluconolactonase (PfGluPho) with G6PD activity. PfGluPho is essential for Plasmodium proliferation and propagation and differs structurally and mechanistically from the human ortholog (Jortzik et al., 2011). Therefore, developing PfGluPho inhibitors is a promising way to kill the parasite and treat malaria. ML304 is a ring-expanded chemical scaffold and selectively inhibits PfGluPho (EC50 < 1 µM) but not human G6PD (> 420-fold selectivity). It is the second reported PfG6PDH inhibitor after the previously reported ML276 (Maloney et al., 2012). The structures of selected aforementioned antimalarial compounds are depicted in Figure 1.10.
Figure 1.10 Structures of other antimalarial compounds. The structures were created using ChemSketch 2.0.
New targets of antimalarial drugs are seen in the redox system of P. falciparum. In this thesis, investigations focus on the effects of ART, ATM, ATS, CQ, QN, MQ, MB, CEA, FEA, ATQ, AQ, LUM, compound 1o, ML304, and a new synthesized derivative of ML304, here referred to as compound S. The structure of compound S cannot be shown in this dissertation due to publication restrictions.
1.2 Redox and antioxidant systems of P. falciparum
P. falciparum has to face oxidative stress during its intraerythrocytic life cycle. In order to maintain redox balance, the parasites’ antioxidant system includes a GSH and Trx system closely interacting (Jones and Go, 2006), as well as iron (Fe)-superoxide dismutase (SOD) and manganese (Mn)-SOD (Jortzik and Becker, 2012; Mohring et al., 2014). Furthermore, P. falciparum possesses four unique selenoproteins, which may also represent components of the redox-regulatory network (Röseler et al., 2012). GSH is the major low molecular mass antioxidant in the parasite (Becker et al., 2003a); classic glutathione peroxidases (Gpx) and catalase are absent. Intracellular redox changes are either short- or long-lived and unique to different subcellular compartments. The compartmentation of the redox system has been characterized in detail (Kehr et al., 2010) and is depicted in Figure 1.11. P. falciparum is exposed exogenously and endogenously to oxidative and nitrosative stress (Müller, 2003; Becker et al., 2004). P. falciparum-infected RBCs produce about twice as many hydroxyl radicals (HO•) as normal RBCs (Atamna et al., 1993). Oxidative stress is triggered by ROS including H2O2, superoxide radicals, HO•, and reactive nitrogen species (RNS) comprising nitric oxide (NO) and peroxynitrite. Spontaneous oxidation and degradation of ingested
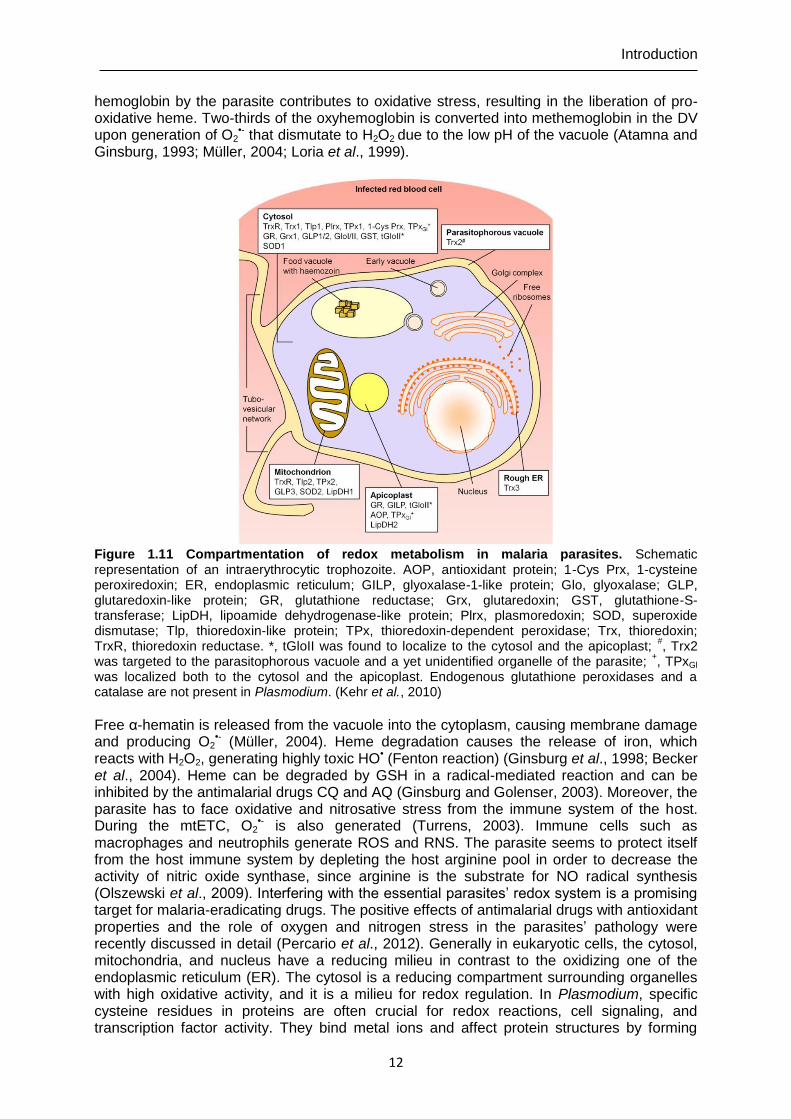
Introduction
12
hemoglobin by the parasite contributes to oxidative stress, resulting in the liberation of pro-oxidative heme. Two-thirds of the oxyhemoglobin is converted into methemoglobin in the DV upon generation of O2
•- that dismutate to H2O2 due to the low pH of the vacuole (Atamna and Ginsburg, 1993; Müller, 2004; Loria et al., 1999).
Figure 1.11 Compartmentation of redox metabolism in malaria parasites. Schematic representation of an intraerythrocytic trophozoite. AOP, antioxidant protein; 1-Cys Prx, 1-cysteine peroxiredoxin; ER, endoplasmic reticulum; GILP, glyoxalase-1-like protein; Glo, glyoxalase; GLP, glutaredoxin-like protein; GR, glutathione reductase; Grx, glutaredoxin; GST, glutathione-S-transferase; LipDH, lipoamide dehydrogenase-like protein; Plrx, plasmoredoxin; SOD, superoxide dismutase; Tlp, thioredoxin-like protein; TPx, thioredoxin-dependent peroxidase; Trx, thioredoxin; TrxR, thioredoxin reductase. *, tGloII was found to localize to the cytosol and the apicoplast;
#, Trx2
was targeted to the parasitophorous vacuole and a yet unidentified organelle of the parasite; +, TPxGl
was localized both to the cytosol and the apicoplast. Endogenous glutathione peroxidases and a catalase are not present in Plasmodium. (Kehr et al., 2010)
Free α-hematin is released from the vacuole into the cytoplasm, causing membrane damage and producing O2
•- (Müller, 2004). Heme degradation causes the release of iron, which reacts with H2O2, generating highly toxic HO• (Fenton reaction) (Ginsburg et al., 1998; Becker et al., 2004). Heme can be degraded by GSH in a radical-mediated reaction and can be inhibited by the antimalarial drugs CQ and AQ (Ginsburg and Golenser, 2003). Moreover, the parasite has to face oxidative and nitrosative stress from the immune system of the host. During the mtETC, O2
•- is also generated (Turrens, 2003). Immune cells such as macrophages and neutrophils generate ROS and RNS. The parasite seems to protect itself from the host immune system by depleting the host arginine pool in order to decrease the activity of nitric oxide synthase, since arginine is the substrate for NO radical synthesis (Olszewski et al., 2009). Interfering with the essential parasites’ redox system is a promising target for malaria-eradicating drugs. The positive effects of antimalarial drugs with antioxidant properties and the role of oxygen and nitrogen stress in the parasites’ pathology were recently discussed in detail (Percario et al., 2012). Generally in eukaryotic cells, the cytosol, mitochondria, and nucleus have a reducing milieu in contrast to the oxidizing one of the endoplasmic reticulum (ER). The cytosol is a reducing compartment surrounding organelles with high oxidative activity, and it is a milieu for redox regulation. In Plasmodium, specific cysteine residues in proteins are often crucial for redox reactions, cell signaling, and transcription factor activity. They bind metal ions and affect protein structures by forming
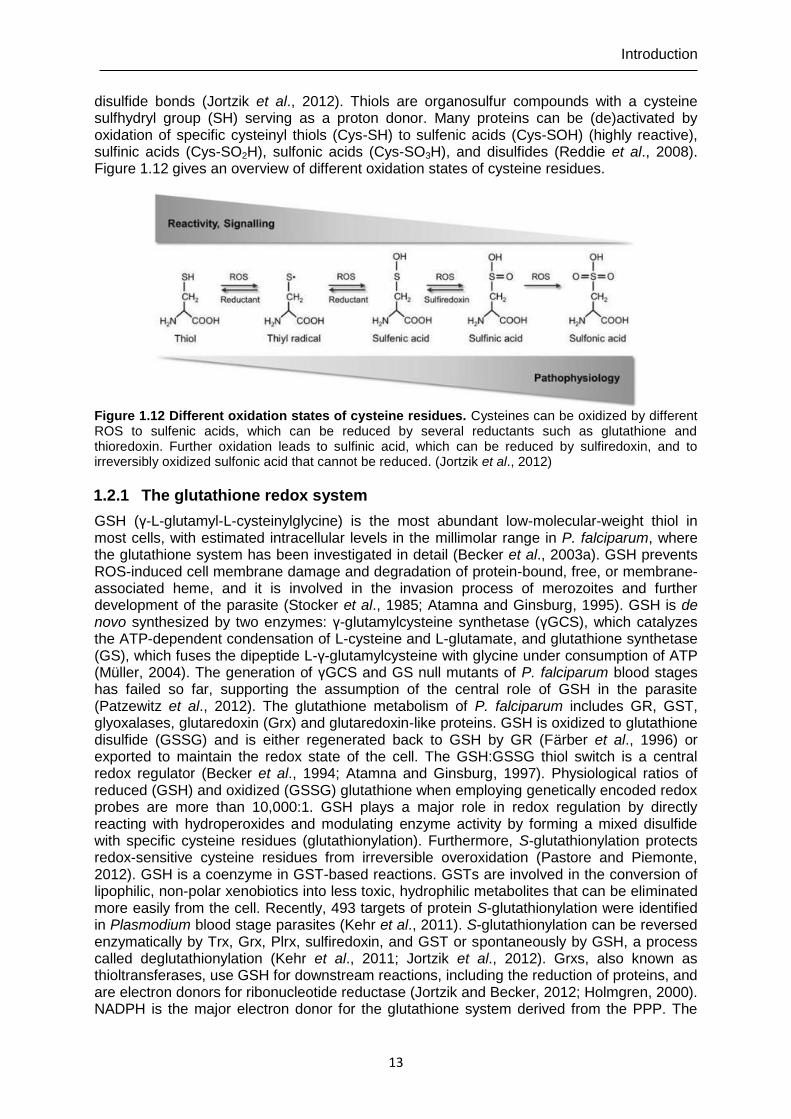
Introduction
13
disulfide bonds (Jortzik et al., 2012). Thiols are organosulfur compounds with a cysteine sulfhydryl group (SH) serving as a proton donor. Many proteins can be (de)activated by oxidation of specific cysteinyl thiols (Cys-SH) to sulfenic acids (Cys-SOH) (highly reactive), sulfinic acids (Cys-SO2H), sulfonic acids (Cys-SO3H), and disulfides (Reddie et al., 2008). Figure 1.12 gives an overview of different oxidation states of cysteine residues.
Figure 1.12 Different oxidation states of cysteine residues. Cysteines can be oxidized by different ROS to sulfenic acids, which can be reduced by several reductants such as glutathione and thioredoxin. Further oxidation leads to sulfinic acid, which can be reduced by sulfiredoxin, and to irreversibly oxidized sulfonic acid that cannot be reduced. (Jortzik et al., 2012)
1.2.1 The glutathione redox system
GSH (γ-L-glutamyl-L-cysteinylglycine) is the most abundant low-molecular-weight thiol in most cells, with estimated intracellular levels in the millimolar range in P. falciparum, where the glutathione system has been investigated in detail (Becker et al., 2003a). GSH prevents ROS-induced cell membrane damage and degradation of protein-bound, free, or membrane-associated heme, and it is involved in the invasion process of merozoites and further development of the parasite (Stocker et al., 1985; Atamna and Ginsburg, 1995). GSH is de novo synthesized by two enzymes: γ-glutamylcysteine synthetase (γGCS), which catalyzes the ATP-dependent condensation of L-cysteine and L-glutamate, and glutathione synthetase (GS), which fuses the dipeptide L-γ-glutamylcysteine with glycine under consumption of ATP (Müller, 2004). The generation of γGCS and GS null mutants of P. falciparum blood stages has failed so far, supporting the assumption of the central role of GSH in the parasite (Patzewitz et al., 2012). The glutathione metabolism of P. falciparum includes GR, GST, glyoxalases, glutaredoxin (Grx) and glutaredoxin-like proteins. GSH is oxidized to glutathione disulfide (GSSG) and is either regenerated back to GSH by GR (Färber et al., 1996) or exported to maintain the redox state of the cell. The GSH:GSSG thiol switch is a central redox regulator (Becker et al., 1994; Atamna and Ginsburg, 1997). Physiological ratios of reduced (GSH) and oxidized (GSSG) glutathione when employing genetically encoded redox probes are more than 10,000:1. GSH plays a major role in redox regulation by directly reacting with hydroperoxides and modulating enzyme activity by forming a mixed disulfide with specific cysteine residues (glutathionylation). Furthermore, S-glutathionylation protects redox-sensitive cysteine residues from irreversible overoxidation (Pastore and Piemonte, 2012). GSH is a coenzyme in GST-based reactions. GSTs are involved in the conversion of lipophilic, non-polar xenobiotics into less toxic, hydrophilic metabolites that can be eliminated more easily from the cell. Recently, 493 targets of protein S-glutathionylation were identified in Plasmodium blood stage parasites (Kehr et al., 2011). S-glutathionylation can be reversed enzymatically by Trx, Grx, Plrx, sulfiredoxin, and GST or spontaneously by GSH, a process called deglutathionylation (Kehr et al., 2011; Jortzik et al., 2012). Grxs, also known as thioltransferases, use GSH for downstream reactions, including the reduction of proteins, and are electron donors for ribonucleotide reductase (Jortzik and Becker, 2012; Holmgren, 2000). NADPH is the major electron donor for the glutathione system derived from the PPP. The
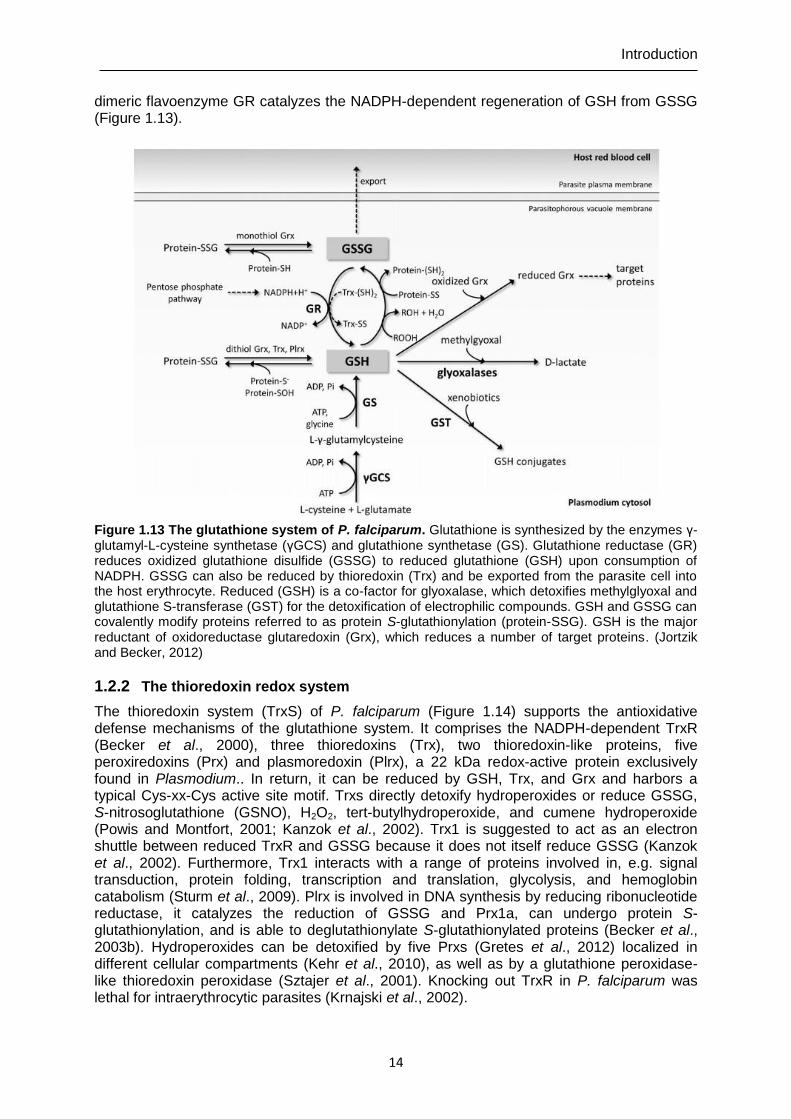
Introduction
14
dimeric flavoenzyme GR catalyzes the NADPH-dependent regeneration of GSH from GSSG (Figure 1.13).
Figure 1.13 The glutathione system of P. falciparum. Glutathione is synthesized by the enzymes γ-glutamyl-L-cysteine synthetase (γGCS) and glutathione synthetase (GS). Glutathione reductase (GR) reduces oxidized glutathione disulfide (GSSG) to reduced glutathione (GSH) upon consumption of NADPH. GSSG can also be reduced by thioredoxin (Trx) and be exported from the parasite cell into the host erythrocyte. Reduced (GSH) is a co-factor for glyoxalase, which detoxifies methylglyoxal and glutathione S-transferase (GST) for the detoxification of electrophilic compounds. GSH and GSSG can covalently modify proteins referred to as protein S-glutathionylation (protein-SSG). GSH is the major reductant of oxidoreductase glutaredoxin (Grx), which reduces a number of target proteins. (Jortzik and Becker, 2012)
1.2.2 The thioredoxin redox system
The thioredoxin system (TrxS) of P. falciparum (Figure 1.14) supports the antioxidative defense mechanisms of the glutathione system. It comprises the NADPH-dependent TrxR (Becker et al., 2000), three thioredoxins (Trx), two thioredoxin-like proteins, five peroxiredoxins (Prx) and plasmoredoxin (Plrx), a 22 kDa redox-active protein exclusively found in Plasmodium.. In return, it can be reduced by GSH, Trx, and Grx and harbors a typical Cys-xx-Cys active site motif. Trxs directly detoxify hydroperoxides or reduce GSSG, S-nitrosoglutathione (GSNO), H2O2, tert-butylhydroperoxide, and cumene hydroperoxide (Powis and Montfort, 2001; Kanzok et al., 2002). Trx1 is suggested to act as an electron shuttle between reduced TrxR and GSSG because it does not itself reduce GSSG (Kanzok et al., 2002). Furthermore, Trx1 interacts with a range of proteins involved in, e.g. signal transduction, protein folding, transcription and translation, glycolysis, and hemoglobin catabolism (Sturm et al., 2009). Plrx is involved in DNA synthesis by reducing ribonucleotide reductase, it catalyzes the reduction of GSSG and Prx1a, can undergo protein S-glutathionylation, and is able to deglutathionylate S-glutathionylated proteins (Becker et al., 2003b). Hydroperoxides can be detoxified by five Prxs (Gretes et al., 2012) localized in different cellular compartments (Kehr et al., 2010), as well as by a glutathione peroxidase-like thioredoxin peroxidase (Sztajer et al., 2001). Knocking out TrxR in P. falciparum was lethal for intraerythrocytic parasites (Krnajski et al., 2002).
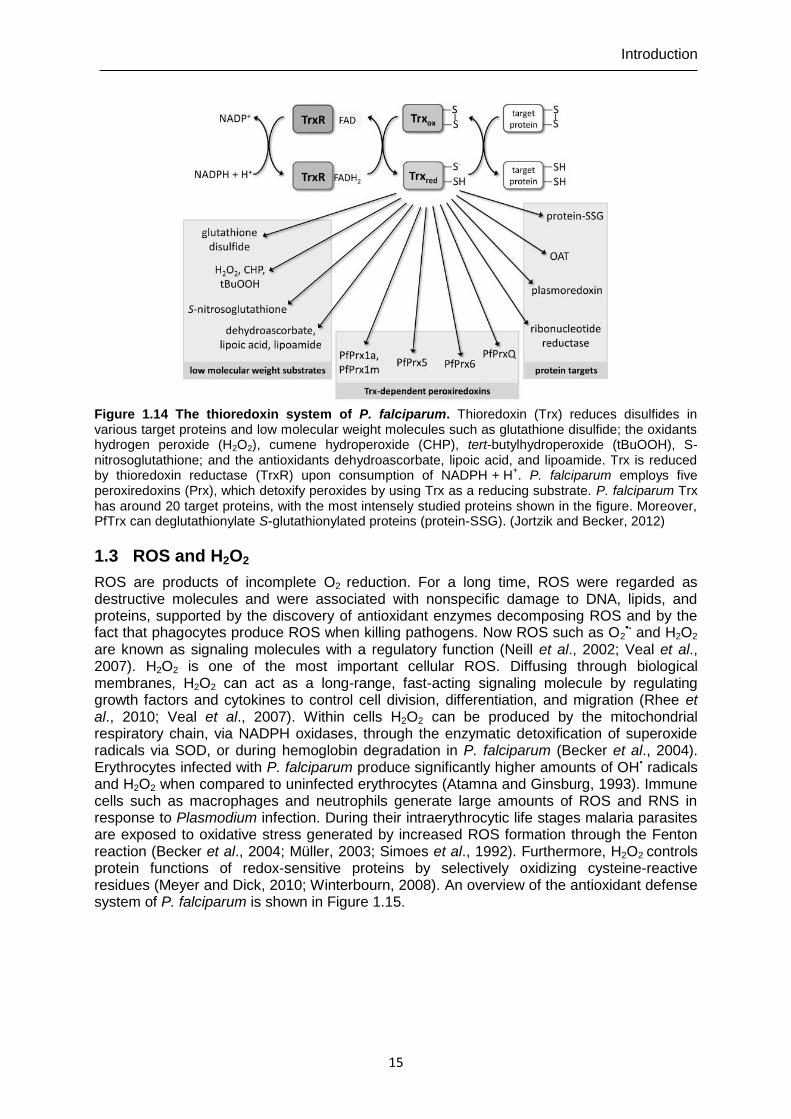
Introduction
15
Figure 1.14 The thioredoxin system of P. falciparum. Thioredoxin (Trx) reduces disulfides in various target proteins and low molecular weight molecules such as glutathione disulfide; the oxidants hydrogen peroxide (H2O2), cumene hydroperoxide (CHP), tert-butylhydroperoxide (tBuOOH), S-nitrosoglutathione; and the antioxidants dehydroascorbate, lipoic acid, and lipoamide. Trx is reduced by thioredoxin reductase (TrxR) upon consumption of NADPH + H
+. P. falciparum employs five
peroxiredoxins (Prx), which detoxify peroxides by using Trx as a reducing substrate. P. falciparum Trx has around 20 target proteins, with the most intensely studied proteins shown in the figure. Moreover, PfTrx can deglutathionylate S-glutathionylated proteins (protein-SSG). (Jortzik and Becker, 2012)
1.3 ROS and H2O2
ROS are products of incomplete O2 reduction. For a long time, ROS were regarded as destructive molecules and were associated with nonspecific damage to DNA, lipids, and proteins, supported by the discovery of antioxidant enzymes decomposing ROS and by the fact that phagocytes produce ROS when killing pathogens. Now ROS such as O2
•- and H2O2
are known as signaling molecules with a regulatory function (Neill et al., 2002; Veal et al., 2007). H2O2 is one of the most important cellular ROS. Diffusing through biological membranes, H2O2 can act as a long-range, fast-acting signaling molecule by regulating growth factors and cytokines to control cell division, differentiation, and migration (Rhee et al., 2010; Veal et al., 2007). Within cells H2O2 can be produced by the mitochondrial respiratory chain, via NADPH oxidases, through the enzymatic detoxification of superoxide radicals via SOD, or during hemoglobin degradation in P. falciparum (Becker et al., 2004). Erythrocytes infected with P. falciparum produce significantly higher amounts of OH• radicals and H2O2 when compared to uninfected erythrocytes (Atamna and Ginsburg, 1993). Immune cells such as macrophages and neutrophils generate large amounts of ROS and RNS in response to Plasmodium infection. During their intraerythrocytic life stages malaria parasites are exposed to oxidative stress generated by increased ROS formation through the Fenton reaction (Becker et al., 2004; Müller, 2003; Simoes et al., 1992). Furthermore, H2O2 controls protein functions of redox-sensitive proteins by selectively oxidizing cysteine-reactive residues (Meyer and Dick, 2010; Winterbourn, 2008). An overview of the antioxidant defense system of P. falciparum is shown in Figure 1.15.
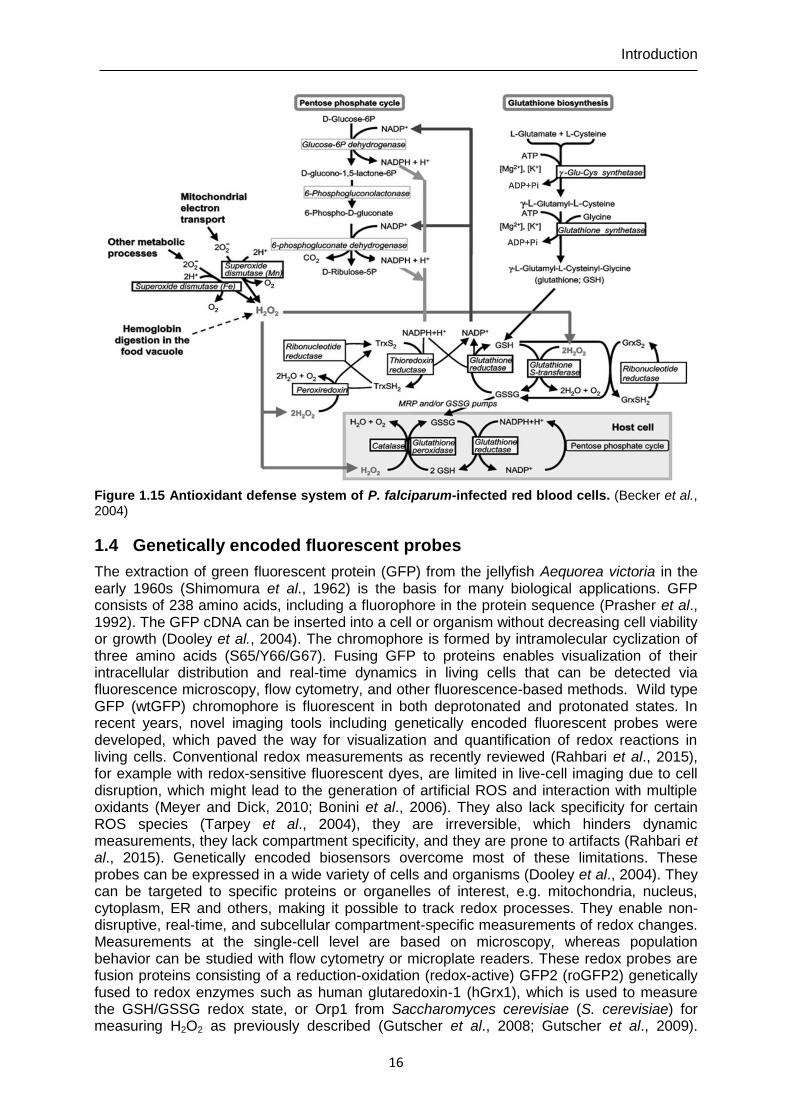
Introduction
16
Figure 1.15 Antioxidant defense system of P. falciparum-infected red blood cells. (Becker et al., 2004)
1.4 Genetically encoded fluorescent probes
The extraction of green fluorescent protein (GFP) from the jellyfish Aequorea victoria in the early 1960s (Shimomura et al., 1962) is the basis for many biological applications. GFP consists of 238 amino acids, including a fluorophore in the protein sequence (Prasher et al., 1992). The GFP cDNA can be inserted into a cell or organism without decreasing cell viability or growth (Dooley et al., 2004). The chromophore is formed by intramolecular cyclization of three amino acids (S65/Y66/G67). Fusing GFP to proteins enables visualization of their intracellular distribution and real-time dynamics in living cells that can be detected via fluorescence microscopy, flow cytometry, and other fluorescence-based methods. Wild type GFP (wtGFP) chromophore is fluorescent in both deprotonated and protonated states. In recent years, novel imaging tools including genetically encoded fluorescent probes were developed, which paved the way for visualization and quantification of redox reactions in living cells. Conventional redox measurements as recently reviewed (Rahbari et al., 2015), for example with redox-sensitive fluorescent dyes, are limited in live-cell imaging due to cell disruption, which might lead to the generation of artificial ROS and interaction with multiple oxidants (Meyer and Dick, 2010; Bonini et al., 2006). They also lack specificity for certain ROS species (Tarpey et al., 2004), they are irreversible, which hinders dynamic measurements, they lack compartment specificity, and they are prone to artifacts (Rahbari et al., 2015). Genetically encoded biosensors overcome most of these limitations. These probes can be expressed in a wide variety of cells and organisms (Dooley et al., 2004). They can be targeted to specific proteins or organelles of interest, e.g. mitochondria, nucleus, cytoplasm, ER and others, making it possible to track redox processes. They enable non-disruptive, real-time, and subcellular compartment-specific measurements of redox changes. Measurements at the single-cell level are based on microscopy, whereas population behavior can be studied with flow cytometry or microplate readers. These redox probes are fusion proteins consisting of a reduction-oxidation (redox-active) GFP2 (roGFP2) genetically fused to redox enzymes such as human glutaredoxin-1 (hGrx1), which is used to measure the GSH/GSSG redox state, or Orp1 from Saccharomyces cerevisiae (S. cerevisiae) for measuring H2O2 as previously described (Gutscher et al., 2008; Gutscher et al., 2009).
Introduction
17
HyPer (hydrogen peroxide) is also a redox probe used for measuring changes in H2O2 concentration but consists of a circularly permuted yellow fluorescent protein (YFP) (Belousov et al., 2006). YFP is generated via point mutation (T203Y) of GFP, resulting in a shift in emission from green to yellow fluorescence (Rhee et al., 2010). These probes allow real-time monitoring of the thiol redox state and ROS in living cells and tissues. RoGFP was constructed by introducing two redox-active cysteines (S147C, Q204C) into wtGFP molecules close to the chromophore, where disulfides can be formed (Hanson et al., 2004). GFP is pH stable under physiological conditions (pH 5.5-8.0) and is not degraded by proteases. A key advantage of roGFPs, in comparison to other fluorescent probes, is that ratiometric studies independent of intracellular protein concentrations can be performed since it has two excitation peaks and one emission peak (Meyer and Dick, 2010). These minimize measurement errors that can occur due to different expression levels, cell thickness, or photo bleaching (Morgan et al., 2011; Hanson et al., 2004). Different mutants of GFPs led to the development of roGFP variants with differences in pH sensitivity, in the dynamic range, and mid-point redox potential (Dooley et al., 2004). RoGFP1 has low pH sensitivity, which is useful for measurements in highly acidic environments. Its low mid-point redox potential makes it suitable for analyses in highly reducing milieus. RoGFP2 was developed by adding the mutation S65T. The amino acid exchange leads to a shift in the excitation spectrum, brighter fluorescence, and an extended dynamic range for ratiometric fluorescence measurements (Lukyanov and Belousov, 2014). The consensus average values of the midpoint redox potential of roGFP1 and roGFP2 at pH 7 are -291 mV and -280 mV, respectively (Dooley et al., 2004). In order to engineer roGFP variants better suited for analysis within more oxidizing compartments such as the ER, roGFP1-iX and roGFP2-iX (insertion of amino acid X, (E or L)) with midpoint potentials of -220 mV to -240 mV have been developed (Lohman and Remington, 2008). Current genetically encoded fluorescent indicators (GEFIs) emit light in the green part of the visible spectrum and cannot be used for dual-compartment or dual-redox-couple imaging within the same cell. This would enable the study of the interplay between different redox couples or redox interactions between organelles on an individual cell basis. Therefore, red fluorescent sensors for H2O2, GSH/GSSG, and other redox couples are in high demand because they improve the brightness and photostability of existing probes. GEFIs for O2
•, NO•, and other important redox-related molecules still have to be developed.
1.4.1 H2O2 redox sensor roGFP2-Orp1
The genetically encoded fluorescent redox probe roGFP2-Orp1 detects changes in H2O2 concentration. It has the spectral properties of roGFP2: a ratiometric pH-stable readout reporting submicromolar H2O2 (Gutscher et al., 2009). The sensor consists of roGFP2 fused to Orp1 (oxidant receptor peroxidase 1), a highly sensitive thiol peroxidase (Delaunay et al., 2002; Hanson et al., 2004). Orp1 is classified as a Prx due to its Trx dependency. It is also known as GPx3, a seleno-independent member of the GPx family (Gutscher et al., 2009). In yeast (S. cerevisiae), Orp1 oxidizes the basic leucine zipper transcription factor Yap1 that regulates H2O2 homeostasis by indirectly sensing cellular H2O2 levels (Gutscher et al., 2009; D’Autréaux and Toledano, 2007; Delaunay et al., 2002). Orp1 acts as a primary oxidant receptor that transfers oxidation to Yap1, a secondary oxidant target protein. Initially, H2O2 oxidizes one of the three cysteines in Orp1, resulting in the sulfenic acid Cys36-SOH. Cys36-SOH forms an intermolecular disulfide bond with Yap1 by reacting with the target thiol Cys598. The intermolecular disulfide linkage of Orp1-Yap1 is transposed to an intramolecular disulfide bond of activated Yap1 (Cys303-S-S-Cys598) (Delaunay et al., 2002). Then, a second disulfide bond (Cys310-SS-Cys629) can be formed via a similar pathway with another oxidized Orp1 molecule (D’Autréaux and Toledano, 2007). The yeast transcription factor Yap1 activates expression of antioxidant genes in response to oxidative stress. To oxidize Yap1 with Orp1, a complex of Yap1 must be formed with a second protein (Ybp1). However, the exact function of Ybp1 is still unknown (Veal et al., 2007). The protein oxidation relay is not restricted to Yap1 but can also oxidize other proteins, for example roGFP (Gutscher et al., 2009). Gutscher et al. (2009) engineered covalent fusions of the yeast thiol
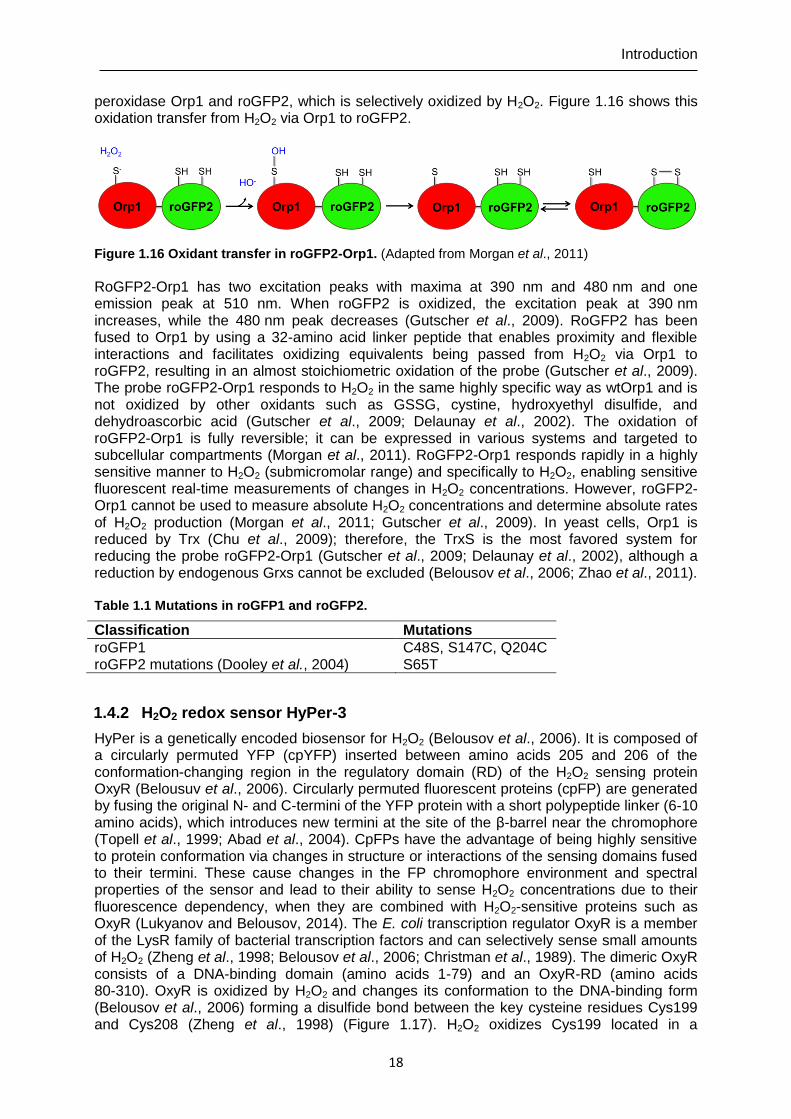
Introduction
18
peroxidase Orp1 and roGFP2, which is selectively oxidized by H2O2. Figure 1.16 shows this oxidation transfer from H2O2 via Orp1 to roGFP2.
Figure 1.16 Oxidant transfer in roGFP2-Orp1. (Adapted from Morgan et al., 2011)
RoGFP2-Orp1 has two excitation peaks with maxima at 390 nm and 480 nm and one emission peak at 510 nm. When roGFP2 is oxidized, the excitation peak at 390 nm increases, while the 480 nm peak decreases (Gutscher et al., 2009). RoGFP2 has been fused to Orp1 by using a 32-amino acid linker peptide that enables proximity and flexible interactions and facilitates oxidizing equivalents being passed from H2O2 via Orp1 to roGFP2, resulting in an almost stoichiometric oxidation of the probe (Gutscher et al., 2009). The probe roGFP2-Orp1 responds to H2O2 in the same highly specific way as wtOrp1 and is not oxidized by other oxidants such as GSSG, cystine, hydroxyethyl disulfide, and dehydroascorbic acid (Gutscher et al., 2009; Delaunay et al., 2002). The oxidation of roGFP2-Orp1 is fully reversible; it can be expressed in various systems and targeted to subcellular compartments (Morgan et al., 2011). RoGFP2-Orp1 responds rapidly in a highly sensitive manner to H2O2 (submicromolar range) and specifically to H2O2, enabling sensitive fluorescent real-time measurements of changes in H2O2 concentrations. However, roGFP2-Orp1 cannot be used to measure absolute H2O2 concentrations and determine absolute rates of H2O2 production (Morgan et al., 2011; Gutscher et al., 2009). In yeast cells, Orp1 is reduced by Trx (Chu et al., 2009); therefore, the TrxS is the most favored system for reducing the probe roGFP2-Orp1 (Gutscher et al., 2009; Delaunay et al., 2002), although a reduction by endogenous Grxs cannot be excluded (Belousov et al., 2006; Zhao et al., 2011). Table 1.1 Mutations in roGFP1 and roGFP2.
Classification Mutations
roGFP1 roGFP2 mutations (Dooley et al., 2004)
C48S, S147C, Q204C S65T
1.4.2 H2O2 redox sensor HyPer-3
HyPer is a genetically encoded biosensor for H2O2 (Belousov et al., 2006). It is composed of a circularly permuted YFP (cpYFP) inserted between amino acids 205 and 206 of the conformation-changing region in the regulatory domain (RD) of the H2O2 sensing protein OxyR (Belousuv et al., 2006). Circularly permuted fluorescent proteins (cpFP) are generated by fusing the original N- and C-termini of the YFP protein with a short polypeptide linker (6-10 amino acids), which introduces new termini at the site of the β-barrel near the chromophore (Topell et al., 1999; Abad et al., 2004). CpFPs have the advantage of being highly sensitive to protein conformation via changes in structure or interactions of the sensing domains fused to their termini. These cause changes in the FP chromophore environment and spectral properties of the sensor and lead to their ability to sense H2O2 concentrations due to their fluorescence dependency, when they are combined with H2O2-sensitive proteins such as OxyR (Lukyanov and Belousov, 2014). The E. coli transcription regulator OxyR is a member of the LysR family of bacterial transcription factors and can selectively sense small amounts of H2O2 (Zheng et al., 1998; Belousov et al., 2006; Christman et al., 1989). The dimeric OxyR consists of a DNA-binding domain (amino acids 1-79) and an OxyR-RD (amino acids 80-310). OxyR is oxidized by H2O2 and changes its conformation to the DNA-binding form (Belousov et al., 2006) forming a disulfide bond between the key cysteine residues Cys199 and Cys208 (Zheng et al., 1998) (Figure 1.17). H2O2 oxidizes Cys199 located in a
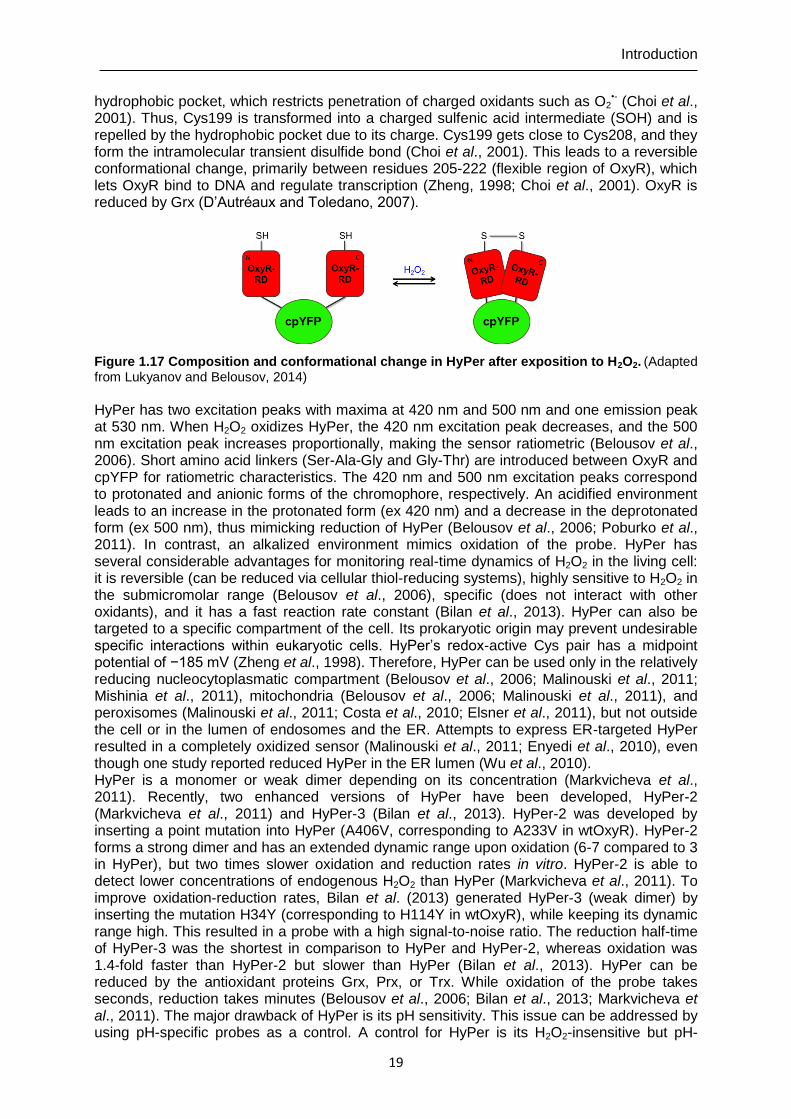
Introduction
19
hydrophobic pocket, which restricts penetration of charged oxidants such as O2•- (Choi et al.,
2001). Thus, Cys199 is transformed into a charged sulfenic acid intermediate (SOH) and is repelled by the hydrophobic pocket due to its charge. Cys199 gets close to Cys208, and they form the intramolecular transient disulfide bond (Choi et al., 2001). This leads to a reversible conformational change, primarily between residues 205-222 (flexible region of OxyR), which lets OxyR bind to DNA and regulate transcription (Zheng, 1998; Choi et al., 2001). OxyR is reduced by Grx (D’Autréaux and Toledano, 2007).
Figure 1.17 Composition and conformational change in HyPer after exposition to H2O2. (Adapted from Lukyanov and Belousov, 2014)
HyPer has two excitation peaks with maxima at 420 nm and 500 nm and one emission peak at 530 nm. When H2O2 oxidizes HyPer, the 420 nm excitation peak decreases, and the 500 nm excitation peak increases proportionally, making the sensor ratiometric (Belousov et al., 2006). Short amino acid linkers (Ser-Ala-Gly and Gly-Thr) are introduced between OxyR and cpYFP for ratiometric characteristics. The 420 nm and 500 nm excitation peaks correspond to protonated and anionic forms of the chromophore, respectively. An acidified environment leads to an increase in the protonated form (ex 420 nm) and a decrease in the deprotonated form (ex 500 nm), thus mimicking reduction of HyPer (Belousov et al., 2006; Poburko et al., 2011). In contrast, an alkalized environment mimics oxidation of the probe. HyPer has several considerable advantages for monitoring real-time dynamics of H2O2 in the living cell: it is reversible (can be reduced via cellular thiol-reducing systems), highly sensitive to H2O2 in the submicromolar range (Belousov et al., 2006), specific (does not interact with other oxidants), and it has a fast reaction rate constant (Bilan et al., 2013). HyPer can also be targeted to a specific compartment of the cell. Its prokaryotic origin may prevent undesirable specific interactions within eukaryotic cells. HyPer’s redox-active Cys pair has a midpoint potential of −185 mV (Zheng et al., 1998). Therefore, HyPer can be used only in the relatively reducing nucleocytoplasmatic compartment (Belousov et al., 2006; Malinouski et al., 2011; Mishinia et al., 2011), mitochondria (Belousov et al., 2006; Malinouski et al., 2011), and peroxisomes (Malinouski et al., 2011; Costa et al., 2010; Elsner et al., 2011), but not outside the cell or in the lumen of endosomes and the ER. Attempts to express ER-targeted HyPer resulted in a completely oxidized sensor (Malinouski et al., 2011; Enyedi et al., 2010), even though one study reported reduced HyPer in the ER lumen (Wu et al., 2010). HyPer is a monomer or weak dimer depending on its concentration (Markvicheva et al., 2011). Recently, two enhanced versions of HyPer have been developed, HyPer-2 (Markvicheva et al., 2011) and HyPer-3 (Bilan et al., 2013). HyPer-2 was developed by inserting a point mutation into HyPer (A406V, corresponding to A233V in wtOxyR). HyPer-2 forms a strong dimer and has an extended dynamic range upon oxidation (6-7 compared to 3 in HyPer), but two times slower oxidation and reduction rates in vitro. HyPer-2 is able to detect lower concentrations of endogenous H2O2 than HyPer (Markvicheva et al., 2011). To improve oxidation-reduction rates, Bilan et al. (2013) generated HyPer-3 (weak dimer) by inserting the mutation H34Y (corresponding to H114Y in wtOxyR), while keeping its dynamic range high. This resulted in a probe with a high signal-to-noise ratio. The reduction half-time of HyPer-3 was the shortest in comparison to HyPer and HyPer-2, whereas oxidation was 1.4-fold faster than HyPer-2 but slower than HyPer (Bilan et al., 2013). HyPer can be reduced by the antioxidant proteins Grx, Prx, or Trx. While oxidation of the probe takes seconds, reduction takes minutes (Belousov et al., 2006; Bilan et al., 2013; Markvicheva et al., 2011). The major drawback of HyPer is its pH sensitivity. This issue can be addressed by using pH-specific probes as a control. A control for HyPer is its H2O2-insensitive but pH-
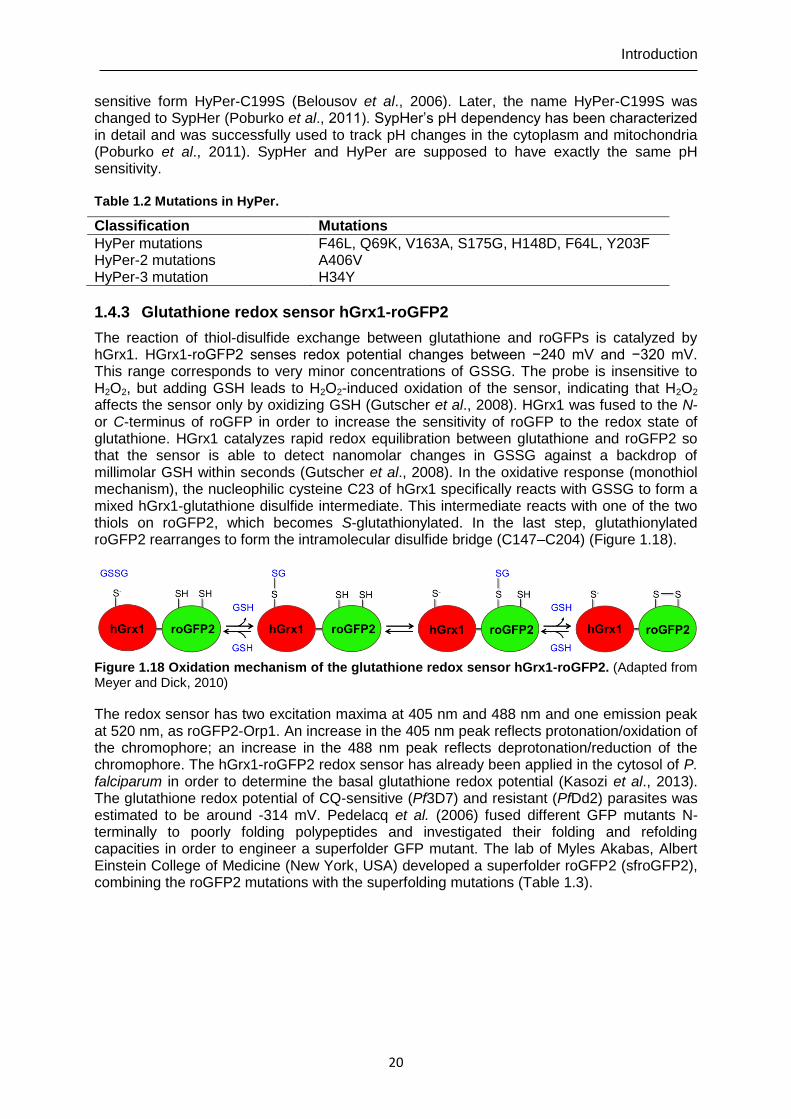
Introduction
20
sensitive form HyPer-C199S (Belousov et al., 2006). Later, the name HyPer-C199S was changed to SypHer (Poburko et al., 2011). SypHer’s pH dependency has been characterized in detail and was successfully used to track pH changes in the cytoplasm and mitochondria (Poburko et al., 2011). SypHer and HyPer are supposed to have exactly the same pH sensitivity. Table 1.2 Mutations in HyPer.
Classification Mutations
HyPer mutations HyPer-2 mutations HyPer-3 mutation
F46L, Q69K, V163A, S175G, H148D, F64L, Y203F A406V H34Y
1.4.3 Glutathione redox sensor hGrx1-roGFP2
The reaction of thiol-disulfide exchange between glutathione and roGFPs is catalyzed by hGrx1. HGrx1-roGFP2 senses redox potential changes between −240 mV and −320 mV. This range corresponds to very minor concentrations of GSSG. The probe is insensitive to H2O2, but adding GSH leads to H2O2-induced oxidation of the sensor, indicating that H2O2 affects the sensor only by oxidizing GSH (Gutscher et al., 2008). HGrx1 was fused to the N- or C-terminus of roGFP in order to increase the sensitivity of roGFP to the redox state of glutathione. HGrx1 catalyzes rapid redox equilibration between glutathione and roGFP2 so that the sensor is able to detect nanomolar changes in GSSG against a backdrop of millimolar GSH within seconds (Gutscher et al., 2008). In the oxidative response (monothiol mechanism), the nucleophilic cysteine C23 of hGrx1 specifically reacts with GSSG to form a mixed hGrx1-glutathione disulfide intermediate. This intermediate reacts with one of the two thiols on roGFP2, which becomes S-glutathionylated. In the last step, glutathionylated roGFP2 rearranges to form the intramolecular disulfide bridge (C147–C204) (Figure 1.18).
Figure 1.18 Oxidation mechanism of the glutathione redox sensor hGrx1-roGFP2. (Adapted from Meyer and Dick, 2010)
The redox sensor has two excitation maxima at 405 nm and 488 nm and one emission peak at 520 nm, as roGFP2-Orp1. An increase in the 405 nm peak reflects protonation/oxidation of the chromophore; an increase in the 488 nm peak reflects deprotonation/reduction of the chromophore. The hGrx1-roGFP2 redox sensor has already been applied in the cytosol of P. falciparum in order to determine the basal glutathione redox potential (Kasozi et al., 2013). The glutathione redox potential of CQ-sensitive (Pf3D7) and resistant (PfDd2) parasites was estimated to be around -314 mV. Pedelacq et al. (2006) fused different GFP mutants N-terminally to poorly folding polypeptides and investigated their folding and refolding capacities in order to engineer a superfolder GFP mutant. The lab of Myles Akabas, Albert Einstein College of Medicine (New York, USA) developed a superfolder roGFP2 (sfroGFP2), combining the roGFP2 mutations with the superfolding mutations (Table 1.3).
Introduction
21
Table 1.3 Mutations in sfroGFP2.
Classification Mutations
roGFP2 mutations (Dooley et al., 2004) C48S, S65T, S147C, Q204C “superfolding” mutations, including folding-enhancing, enhanced-GFP, and cycle-3 GFP mutations (Pedelacq et al., 2006)
S30R, Y39N, F64L, S65T (note: same as roGFP2-specific S65T mutation listed above), F99S, N105T, Y145F, M153T, V163A, I171V, A206V
GFP-specific mutations (present among various existing GFP forms)
L68V, A72S, Q80R, F223R (blocks dimerization)
1.5 Objectives of the study
The goal of this work was to elucidate the impact of antimalarial drugs and new compounds on H2O2-mediated signaling of P. falciparum under physiological and pharmacological conditions. The antiplasmodial mechanisms and oxidative capacities of antimalarial drugs and newly synthetized compounds are not fully known; further research is therefore necessary. Establishing genetically encoded H2O2 probes within the parasite enables non-disruptive, real-time, and subcellular compartment-specific monitoring of changes in H2O2 levels. Cellular and subcellular effects of oxidants on the H2O2 level can be determined by employing this new tool. In order to implement these goals, the following steps were taken:
Cloning and transfection of the redox-sensitive H2O2 sensors roGFP2-Orp1, HyPer-3, and the pH control SypHer into P. falciparum blood stage parasites
Cloning and transfection of the sensors targeting the compartments apicoplast, mitochondrion, DV, and ER of P. falciparum
Live-cell imaging of P. falciparum H2O2 signaling and the effects of antimalarial drugs and new compounds on its cytosol and organelles via fluorescence microscopy
Determination of the cytosolic pH using SypHer and the pH-sensitive protein pHluorin
Optimization of real-time imaging of parasites expressing genetically encoded redox and pH sensors via stable integration
Real-time 3D visualization of P. falciparum parasites expressing the probe roGFP2-Orp1 exposed to different concentrations of H2O2
Establishing a method to measure redox changes with a microtiter plate reader As part of this work, the impact of new compounds on the glutathione redox system of P. falciparum was also investigated using the already established glutathione redox probe hGrx1-roGFP2 and the alternative redox-sensitive roGFP2 version, namely sfroGFP2, leading to the following steps:
Live-cell imaging of the effects of new compounds on the glutathione redox system of P. falciparum using hGrx1-roGFP2 and sfroGFP2
Optimization of real-time imaging of parasites expressing the redox sensors hGrx1-roGFP2 and sfroGFP2
Real-time 3D visualization of P. falciparum parasites expressing the probe hGrx1-roGFP2 exposed to different concentrations of H2O2
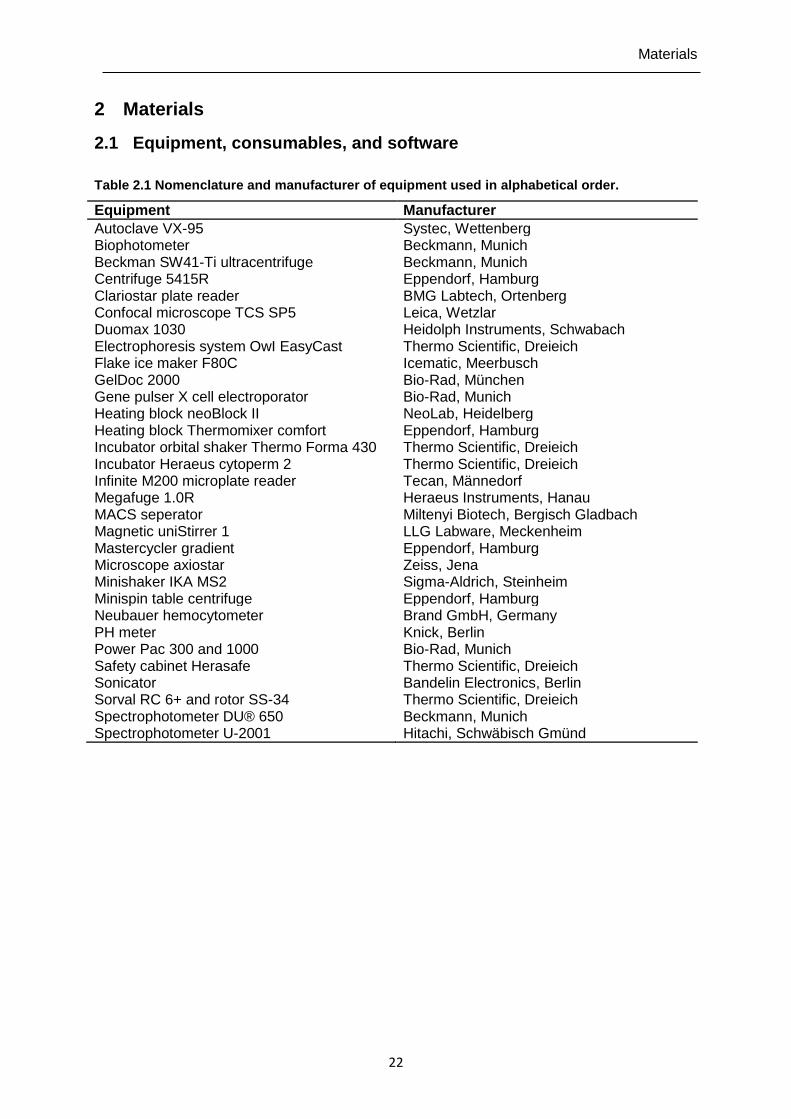
Materials
22
2 Materials
2.1 Equipment, consumables, and software
Table 2.1 Nomenclature and manufacturer of equipment used in alphabetical order.
Equipment Manufacturer
Autoclave VX-95 Systec, Wettenberg Biophotometer Beckmann, Munich Beckman SW41-Ti ultracentrifuge Centrifuge 5415R Clariostar plate reader Confocal microscope TCS SP5 Duomax 1030 Electrophoresis system OwI EasyCast Flake ice maker F80C GelDoc 2000 Gene pulser X cell electroporator Heating block neoBlock II
Beckmann, Munich Eppendorf, Hamburg BMG Labtech, Ortenberg Leica, Wetzlar Heidolph Instruments, Schwabach Thermo Scientific, Dreieich Icematic, Meerbusch Bio-Rad, München Bio-Rad, Munich NeoLab, Heidelberg
Heating block Thermomixer comfort Incubator orbital shaker Thermo Forma 430 Incubator Heraeus cytoperm 2 Infinite M200 microplate reader
Eppendorf, Hamburg Thermo Scientific, Dreieich Thermo Scientific, Dreieich Tecan, Männedorf
Megafuge 1.0R Heraeus Instruments, Hanau MACS seperator Miltenyi Biotech, Bergisch Gladbach Magnetic uniStirrer 1 LLG Labware, Meckenheim Mastercycler gradient Eppendorf, Hamburg Microscope axiostar Zeiss, Jena Minishaker IKA MS2 Sigma-Aldrich, Steinheim Minispin table centrifuge Eppendorf, Hamburg Neubauer hemocytometer PH meter
Brand GmbH, Germany Knick, Berlin
Power Pac 300 and 1000 Bio-Rad, Munich Safety cabinet Herasafe Sonicator
Thermo Scientific, Dreieich Bandelin Electronics, Berlin
Sorval RC 6+ and rotor SS-34 Thermo Scientific, Dreieich Spectrophotometer DU® 650 Beckmann, Munich Spectrophotometer U-2001 Hitachi, Schwäbisch Gmünd
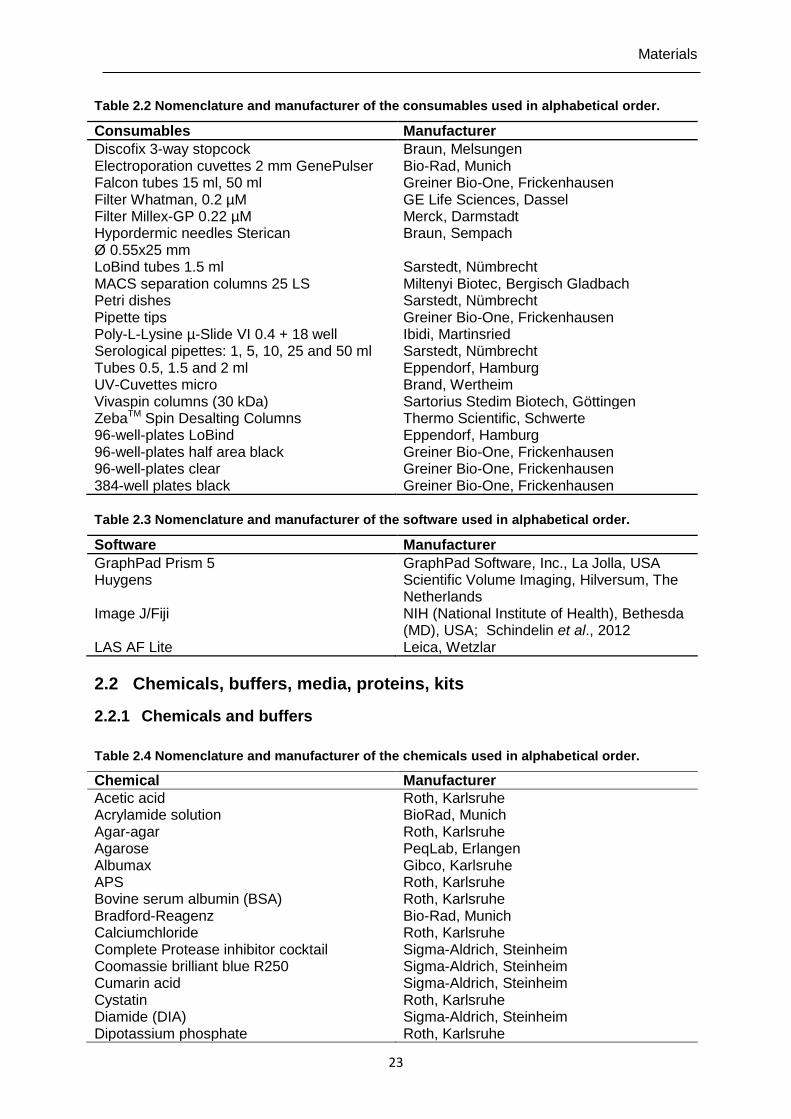
Materials
23
Table 2.2 Nomenclature and manufacturer of the consumables used in alphabetical order.
Consumables Manufacturer
Discofix 3-way stopcock Electroporation cuvettes 2 mm GenePulser Falcon tubes 15 ml, 50 ml
Braun, Melsungen Bio-Rad, Munich Greiner Bio-One, Frickenhausen
Filter Whatman, 0.2 µM Filter Millex-GP 0.22 µM
GE Life Sciences, Dassel Merck, Darmstadt
Hypordermic needles Sterican Ø 0.55x25 mm
Braun, Sempach
LoBind tubes 1.5 ml Sarstedt, Nümbrecht MACS separation columns 25 LS Miltenyi Biotec, Bergisch Gladbach Petri dishes Sarstedt, Nümbrecht Pipette tips Greiner Bio-One, Frickenhausen Poly-L-Lysine µ-Slide VI 0.4 + 18 well Serological pipettes: 1, 5, 10, 25 and 50 ml
Ibidi, Martinsried Sarstedt, Nümbrecht
Tubes 0.5, 1.5 and 2 ml Eppendorf, Hamburg UV-Cuvettes micro Brand, Wertheim Vivaspin columns (30 kDa) Sartorius Stedim Biotech, Göttingen ZebaTM Spin Desalting Columns Thermo Scientific, Schwerte 96-well-plates LoBind Eppendorf, Hamburg 96-well-plates half area black 96-well-plates clear
Greiner Bio-One, Frickenhausen Greiner Bio-One, Frickenhausen
384-well plates black Greiner Bio-One, Frickenhausen
Table 2.3 Nomenclature and manufacturer of the software used in alphabetical order.
Software Manufacturer
GraphPad Prism 5 GraphPad Software, Inc., La Jolla, USA Huygens Image J/Fiji
Scientific Volume Imaging, Hilversum, The Netherlands NIH (National Institute of Health), Bethesda (MD), USA; Schindelin et al., 2012
LAS AF Lite Leica, Wetzlar
2.2 Chemicals, buffers, media, proteins, kits
2.2.1 Chemicals and buffers
Table 2.4 Nomenclature and manufacturer of the chemicals used in alphabetical order.
Chemical Manufacturer
Acetic acid Acrylamide solution Agar-agar Agarose Albumax APS Bovine serum albumin (BSA) Bradford-Reagenz Calciumchloride Complete Protease inhibitor cocktail Coomassie brilliant blue R250 Cumarin acid Cystatin Diamide (DIA) Dipotassium phosphate
Roth, Karlsruhe BioRad, Munich Roth, Karlsruhe PeqLab, Erlangen Gibco, Karlsruhe Roth, Karlsruhe Roth, Karlsruhe Bio-Rad, Munich Roth, Karlsruhe Sigma-Aldrich, Steinheim Sigma-Aldrich, Steinheim Sigma-Aldrich, Steinheim Roth, Karlsruhe Sigma-Aldrich, Steinheim Roth, Karlsruhe
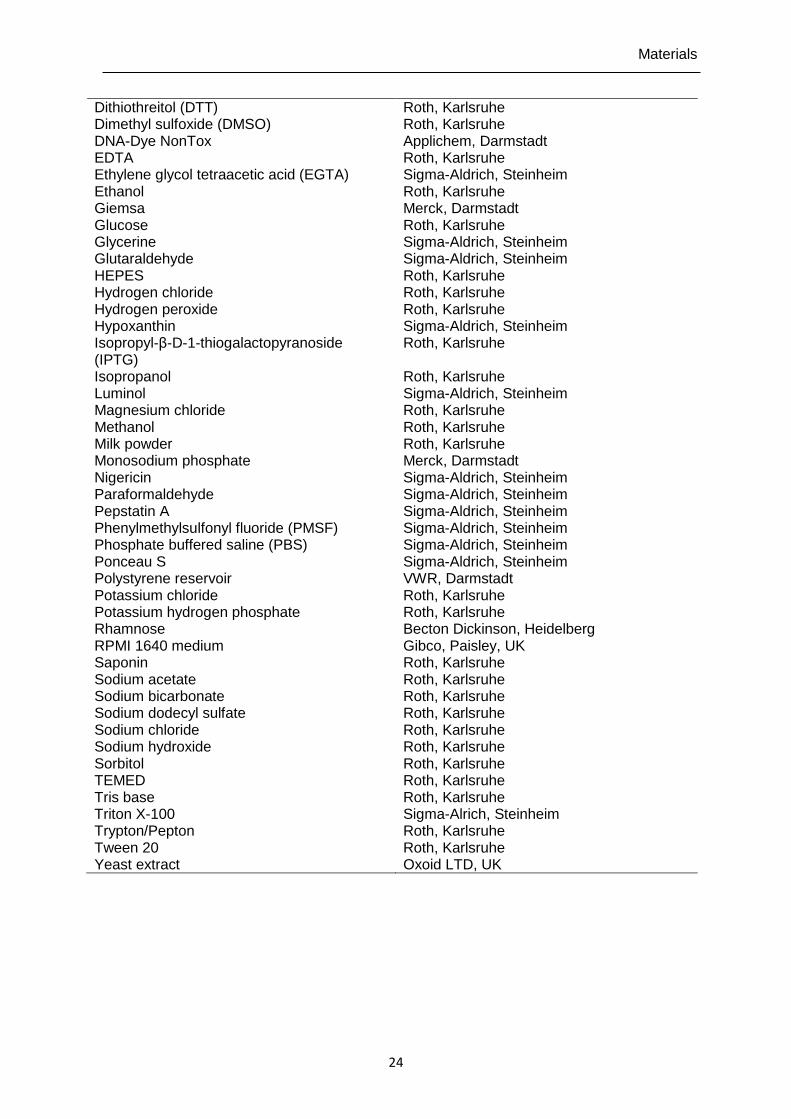
Materials
24
Dithiothreitol (DTT) Dimethyl sulfoxide (DMSO) DNA-Dye NonTox EDTA Ethylene glycol tetraacetic acid (EGTA) Ethanol Giemsa Glucose Glycerine Glutaraldehyde HEPES Hydrogen chloride Hydrogen peroxide Hypoxanthin Isopropyl-β-D-1-thiogalactopyranoside (IPTG) Isopropanol Luminol Magnesium chloride Methanol Milk powder Monosodium phosphate Nigericin Paraformaldehyde Pepstatin A Phenylmethylsulfonyl fluoride (PMSF) Phosphate buffered saline (PBS) Ponceau S Polystyrene reservoir Potassium chloride Potassium hydrogen phosphate Rhamnose RPMI 1640 medium Saponin Sodium acetate Sodium bicarbonate Sodium dodecyl sulfate Sodium chloride Sodium hydroxide Sorbitol TEMED Tris base Triton X-100 Trypton/Pepton Tween 20 Yeast extract
Roth, Karlsruhe Roth, Karlsruhe Applichem, Darmstadt Roth, Karlsruhe Sigma-Aldrich, Steinheim Roth, Karlsruhe Merck, Darmstadt Roth, Karlsruhe Sigma-Aldrich, Steinheim Sigma-Aldrich, Steinheim Roth, Karlsruhe Roth, Karlsruhe Roth, Karlsruhe Sigma-Aldrich, Steinheim Roth, Karlsruhe Roth, Karlsruhe Sigma-Aldrich, Steinheim Roth, Karlsruhe Roth, Karlsruhe Roth, Karlsruhe Merck, Darmstadt Sigma-Aldrich, Steinheim Sigma-Aldrich, Steinheim Sigma-Aldrich, Steinheim Sigma-Aldrich, Steinheim Sigma-Aldrich, Steinheim Sigma-Aldrich, Steinheim VWR, Darmstadt Roth, Karlsruhe Roth, Karlsruhe Becton Dickinson, Heidelberg Gibco, Paisley, UK Roth, Karlsruhe Roth, Karlsruhe Roth, Karlsruhe Roth, Karlsruhe Roth, Karlsruhe Roth, Karlsruhe Roth, Karlsruhe Roth, Karlsruhe Roth, Karlsruhe Sigma-Alrich, Steinheim Roth, Karlsruhe Roth, Karlsruhe Oxoid LTD, UK
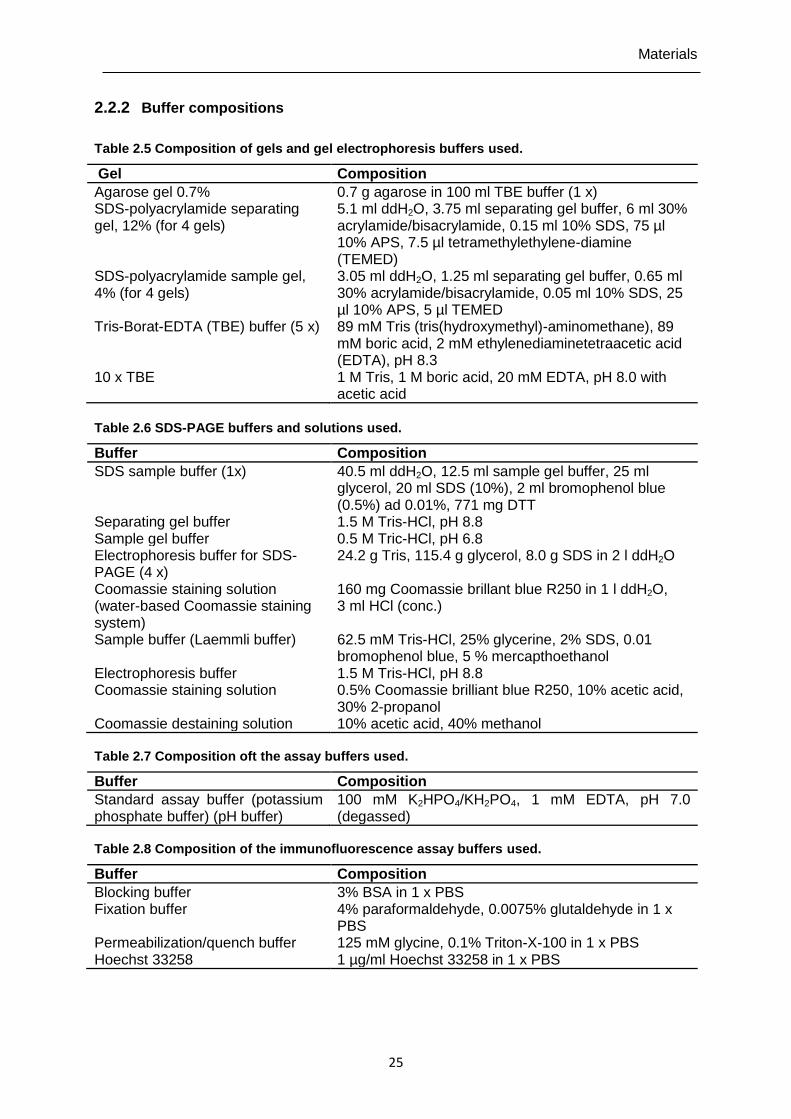
Materials
25
2.2.2 Buffer compositions
Table 2.5 Composition of gels and gel electrophoresis buffers used.
Gel Composition
Agarose gel 0.7% SDS-polyacrylamide separating gel, 12% (for 4 gels)
0.7 g agarose in 100 ml TBE buffer (1 x) 5.1 ml ddH2O, 3.75 ml separating gel buffer, 6 ml 30% acrylamide/bisacrylamide, 0.15 ml 10% SDS, 75 µl 10% APS, 7.5 µl tetramethylethylene-diamine (TEMED)
SDS-polyacrylamide sample gel, 4% (for 4 gels)
3.05 ml ddH2O, 1.25 ml separating gel buffer, 0.65 ml 30% acrylamide/bisacrylamide, 0.05 ml 10% SDS, 25 µl 10% APS, 5 µl TEMED
Tris-Borat-EDTA (TBE) buffer (5 x) 89 mM Tris (tris(hydroxymethyl)-aminomethane), 89 mM boric acid, 2 mM ethylenediaminetetraacetic acid (EDTA), pH 8.3
10 x TBE 1 M Tris, 1 M boric acid, 20 mM EDTA, pH 8.0 with acetic acid
Table 2.6 SDS-PAGE buffers and solutions used.
Buffer Composition
SDS sample buffer (1x) 40.5 ml ddH2O, 12.5 ml sample gel buffer, 25 ml glycerol, 20 ml SDS (10%), 2 ml bromophenol blue (0.5%) ad 0.01%, 771 mg DTT
Separating gel buffer 1.5 M Tris-HCl, pH 8.8 Sample gel buffer 0.5 M Tric-HCl, pH 6.8 Electrophoresis buffer for SDS- PAGE (4 x)
24.2 g Tris, 115.4 g glycerol, 8.0 g SDS in 2 l ddH2O
Coomassie staining solution (water-based Coomassie staining system)
160 mg Coomassie brillant blue R250 in 1 l ddH2O, 3 ml HCl (conc.)
Sample buffer (Laemmli buffer) 62.5 mM Tris-HCl, 25% glycerine, 2% SDS, 0.01 bromophenol blue, 5 % mercapthoethanol
Electrophoresis buffer 1.5 M Tris-HCl, pH 8.8 Coomassie staining solution 0.5% Coomassie brilliant blue R250, 10% acetic acid,
30% 2-propanol Coomassie destaining solution 10% acetic acid, 40% methanol Table 2.7 Composition oft the assay buffers used.
Buffer Composition
Standard assay buffer (potassium phosphate buffer) (pH buffer)
100 mM K2HPO4/KH2PO4, 1 mM EDTA, pH 7.0 (degassed)
Table 2.8 Composition of the immunofluorescence assay buffers used.
Buffer Composition
Blocking buffer 3% BSA in 1 x PBS Fixation buffer 4% paraformaldehyde, 0.0075% glutaldehyde in 1 x
PBS Permeabilization/quench buffer Hoechst 33258
125 mM glycine, 0.1% Triton-X-100 in 1 x PBS 1 µg/ml Hoechst 33258 in 1 x PBS
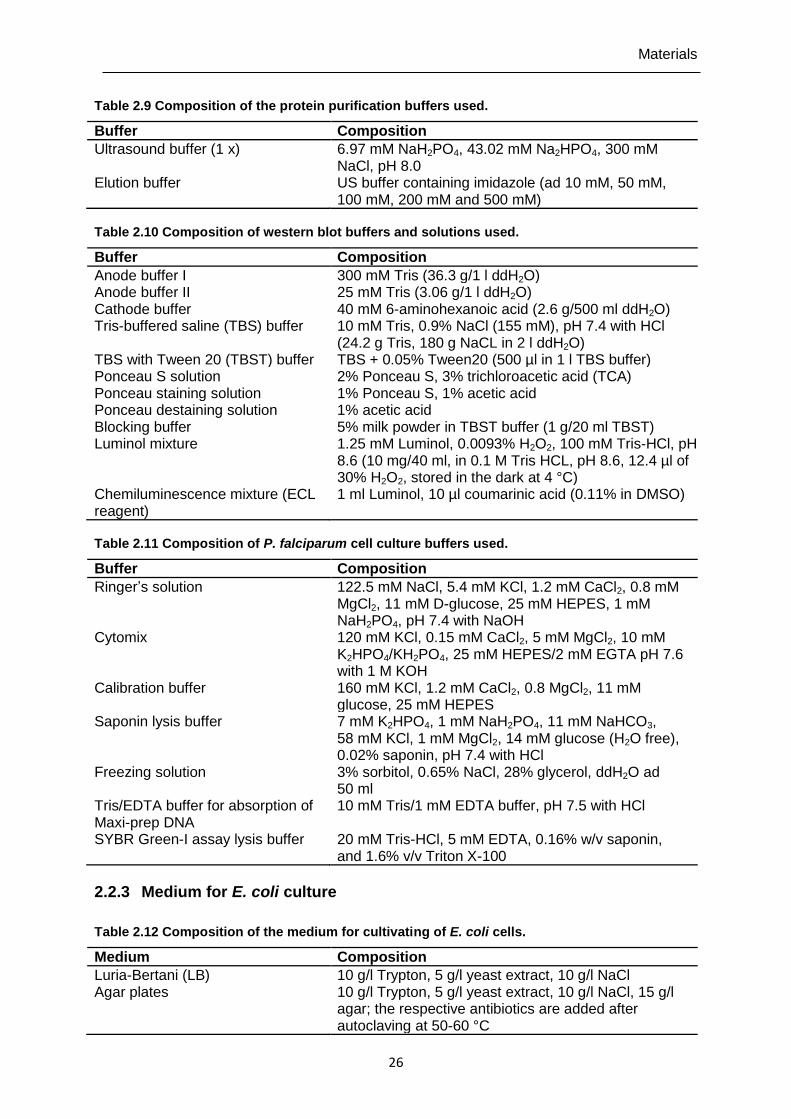
Materials
26
Table 2.9 Composition of the protein purification buffers used.
Buffer Composition
Ultrasound buffer (1 x) 6.97 mM NaH2PO4, 43.02 mM Na2HPO4, 300 mM NaCl, pH 8.0
Elution buffer US buffer containing imidazole (ad 10 mM, 50 mM, 100 mM, 200 mM and 500 mM)
Table 2.10 Composition of western blot buffers and solutions used.
Buffer Composition
Anode buffer I 300 mM Tris (36.3 g/1 l ddH2O) Anode buffer II 25 mM Tris (3.06 g/1 l ddH2O) Cathode buffer 40 mM 6-aminohexanoic acid (2.6 g/500 ml ddH2O) Tris-buffered saline (TBS) buffer 10 mM Tris, 0.9% NaCl (155 mM), pH 7.4 with HCl
(24.2 g Tris, 180 g NaCL in 2 l ddH2O) TBS with Tween 20 (TBST) buffer TBS + 0.05% Tween20 (500 µl in 1 l TBS buffer) Ponceau S solution 2% Ponceau S, 3% trichloroacetic acid (TCA) Ponceau staining solution 1% Ponceau S, 1% acetic acid Ponceau destaining solution 1% acetic acid Blocking buffer 5% milk powder in TBST buffer (1 g/20 ml TBST) Luminol mixture 1.25 mM Luminol, 0.0093% H2O2, 100 mM Tris-HCl, pH
8.6 (10 mg/40 ml, in 0.1 M Tris HCL, pH 8.6, 12.4 µl of 30% H2O2, stored in the dark at 4 °C)
Chemiluminescence mixture (ECL reagent)
1 ml Luminol, 10 µl coumarinic acid (0.11% in DMSO)
Table 2.11 Composition of P. falciparum cell culture buffers used.
Buffer Composition
Ringer’s solution Cytomix
122.5 mM NaCl, 5.4 mM KCl, 1.2 mM CaCl2, 0.8 mM MgCl2, 11 mM D-glucose, 25 mM HEPES, 1 mM NaH2PO4, pH 7.4 with NaOH 120 mM KCl, 0.15 mM CaCl2, 5 mM MgCl2, 10 mM K2HPO4/KH2PO4, 25 mM HEPES/2 mM EGTA pH 7.6 with 1 M KOH
Calibration buffer 160 mM KCl, 1.2 mM CaCl2, 0.8 MgCl2, 11 mM glucose, 25 mM HEPES
Saponin lysis buffer 7 mM K2HPO4, 1 mM NaH2PO4, 11 mM NaHCO3, 58 mM KCl, 1 mM MgCl2, 14 mM glucose (H2O free), 0.02% saponin, pH 7.4 with HCl
Freezing solution Tris/EDTA buffer for absorption of Maxi-prep DNA SYBR Green-I assay lysis buffer
3% sorbitol, 0.65% NaCl, 28% glycerol, ddH2O ad 50 ml 10 mM Tris/1 mM EDTA buffer, pH 7.5 with HCl 20 mM Tris-HCl, 5 mM EDTA, 0.16% w/v saponin, and 1.6% v/v Triton X-100
2.2.3 Medium for E. coli culture
Table 2.12 Composition of the medium for cultivating of E. coli cells.
Medium Composition
Luria-Bertani (LB) 10 g/l Trypton, 5 g/l yeast extract, 10 g/l NaCl Agar plates 10 g/l Trypton, 5 g/l yeast extract, 10 g/l NaCl, 15 g/l
agar; the respective antibiotics are added after autoclaving at 50-60 °C
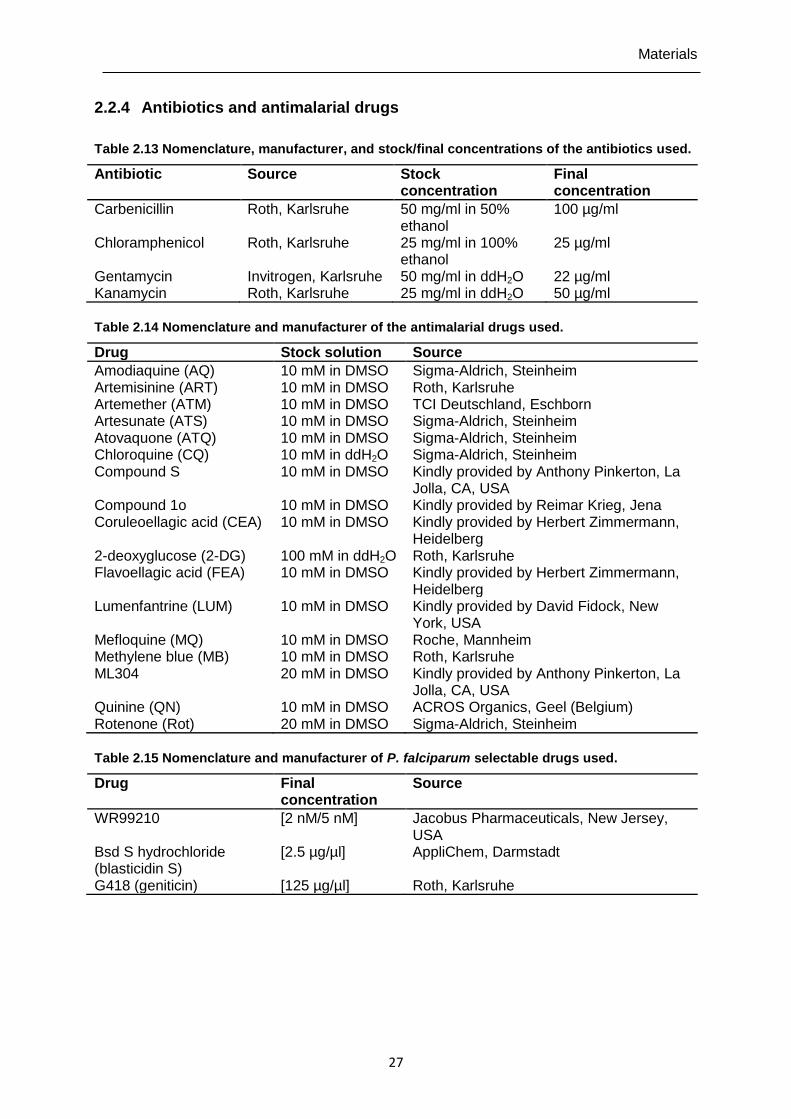
Materials
27
2.2.4 Antibiotics and antimalarial drugs
Table 2.13 Nomenclature, manufacturer, and stock/final concentrations of the antibiotics used.
Antibiotic Source Stock concentration
Final concentration
Carbenicillin Chloramphenicol
Roth, Karlsruhe Roth, Karlsruhe
50 mg/ml in 50% ethanol 25 mg/ml in 100% ethanol
100 µg/ml 25 µg/ml
Gentamycin Kanamycin
Invitrogen, Karlsruhe Roth, Karlsruhe
50 mg/ml in ddH2O 25 mg/ml in ddH2O
22 µg/ml 50 µg/ml
Table 2.14 Nomenclature and manufacturer of the antimalarial drugs used.
Drug Stock solution Source
Amodiaquine (AQ) Artemisinine (ART)
10 mM in DMSO 10 mM in DMSO
Sigma-Aldrich, Steinheim Roth, Karlsruhe
Artemether (ATM) 10 mM in DMSO TCI Deutschland, Eschborn Artesunate (ATS) 10 mM in DMSO Sigma-Aldrich, Steinheim Atovaquone (ATQ) Chloroquine (CQ) Compound S Compound 1o
10 mM in DMSO 10 mM in ddH2O 10 mM in DMSO 10 mM in DMSO
Sigma-Aldrich, Steinheim Sigma-Aldrich, Steinheim Kindly provided by Anthony Pinkerton, La Jolla, CA, USA Kindly provided by Reimar Krieg, Jena
Coruleoellagic acid (CEA) 10 mM in DMSO Kindly provided by Herbert Zimmermann, Heidelberg
2-deoxyglucose (2-DG) Flavoellagic acid (FEA)
100 mM in ddH2O 10 mM in DMSO
Roth, Karlsruhe Kindly provided by Herbert Zimmermann, Heidelberg
Lumenfantrine (LUM) Mefloquine (MQ)
10 mM in DMSO 10 mM in DMSO
Kindly provided by David Fidock, New York, USA Roche, Mannheim
Methylene blue (MB) ML304
10 mM in DMSO 20 mM in DMSO
Roth, Karlsruhe Kindly provided by Anthony Pinkerton, La Jolla, CA, USA
Quinine (QN) Rotenone (Rot)
10 mM in DMSO 20 mM in DMSO
ACROS Organics, Geel (Belgium) Sigma-Aldrich, Steinheim
Table 2.15 Nomenclature and manufacturer of P. falciparum selectable drugs used.
Drug Final concentration
Source
WR99210 [2 nM/5 nM] Jacobus Pharmaceuticals, New Jersey, USA
Bsd S hydrochloride (blasticidin S)
[2.5 µg/µl] AppliChem, Darmstadt
G418 (geniticin) [125 µg/µl] Roth, Karlsruhe
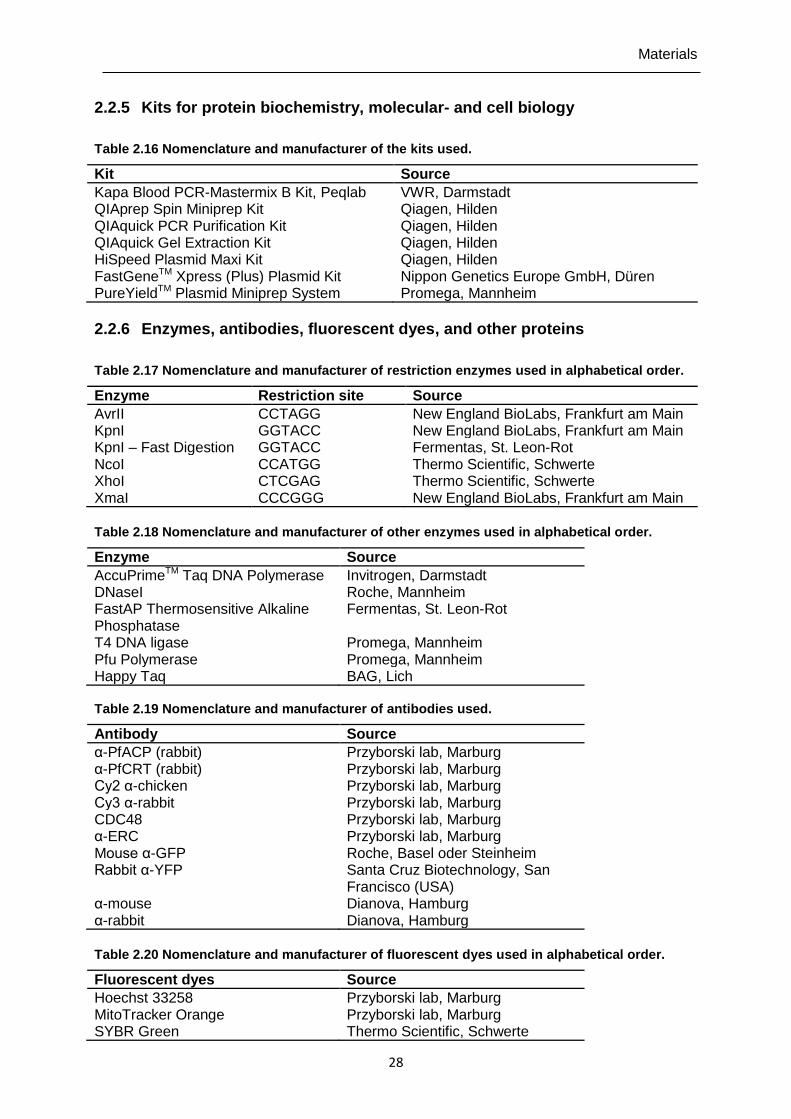
Materials
28
2.2.5 Kits for protein biochemistry, molecular- and cell biology
Table 2.16 Nomenclature and manufacturer of the kits used.
Kit Source
Kapa Blood PCR-Mastermix B Kit, Peqlab QIAprep Spin Miniprep Kit
VWR, Darmstadt Qiagen, Hilden
QIAquick PCR Purification Kit Qiagen, Hilden QIAquick Gel Extraction Kit Qiagen, Hilden HiSpeed Plasmid Maxi Kit Qiagen, Hilden FastGeneTM Xpress (Plus) Plasmid Kit Nippon Genetics Europe GmbH, Düren PureYieldTM Plasmid Miniprep System Promega, Mannheim
2.2.6 Enzymes, antibodies, fluorescent dyes, and other proteins
Table 2.17 Nomenclature and manufacturer of restriction enzymes used in alphabetical order.
Enzyme Restriction site Source
AvrII CCTAGG New England BioLabs, Frankfurt am Main KpnI GGTACC New England BioLabs, Frankfurt am Main KpnI – Fast Digestion GGTACC Fermentas, St. Leon-Rot NcoI XhoI
CCATGG CTCGAG
Thermo Scientific, Schwerte Thermo Scientific, Schwerte
XmaI CCCGGG New England BioLabs, Frankfurt am Main
Table 2.18 Nomenclature and manufacturer of other enzymes used in alphabetical order.
Enzyme Source
AccuPrimeTM Taq DNA Polymerase Invitrogen, Darmstadt DNaseI Roche, Mannheim FastAP Thermosensitive Alkaline Phosphatase
Fermentas, St. Leon-Rot
T4 DNA ligase Promega, Mannheim Pfu Polymerase Promega, Mannheim Happy Taq BAG, Lich Table 2.19 Nomenclature and manufacturer of antibodies used.
Antibody Source
α-PfACP (rabbit) Przyborski lab, Marburg α-PfCRT (rabbit) Przyborski lab, Marburg Cy2 α-chicken Przyborski lab, Marburg Cy3 α-rabbit Przyborski lab, Marburg CDC48 Przyborski lab, Marburg α-ERC Przyborski lab, Marburg Mouse α-GFP Roche, Basel oder Steinheim Rabbit α-YFP Santa Cruz Biotechnology, San
Francisco (USA) α-mouse Dianova, Hamburg α-rabbit Dianova, Hamburg
Table 2.20 Nomenclature and manufacturer of fluorescent dyes used in alphabetical order.
Fluorescent dyes Source
Hoechst 33258 Przyborski lab, Marburg MitoTracker Orange SYBR Green
Przyborski lab, Marburg Thermo Scientific, Schwerte
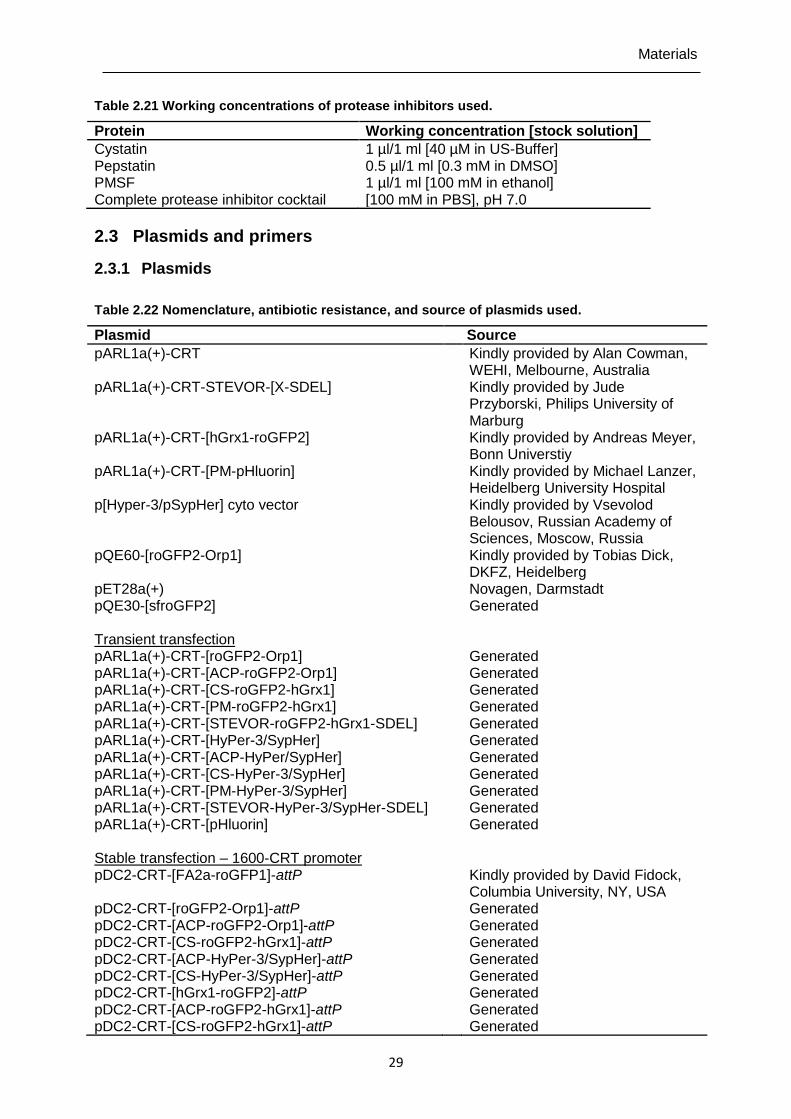
Materials
29
Table 2.21 Working concentrations of protease inhibitors used.
Protein Working concentration [stock solution]
Cystatin 1 µl/1 ml [40 µM in US-Buffer] Pepstatin 0.5 µl/1 ml [0.3 mM in DMSO] PMSF Complete protease inhibitor cocktail
1 µl/1 ml [100 mM in ethanol] [100 mM in PBS], pH 7.0
2.3 Plasmids and primers
2.3.1 Plasmids Table 2.22 Nomenclature, antibiotic resistance, and source of plasmids used.
Plasmid Source
pARL1a(+)-CRT
Kindly provided by Alan Cowman, WEHI, Melbourne, Australia
pARL1a(+)-CRT-STEVOR-[X-SDEL] Kindly provided by Jude Przyborski, Philips University of Marburg
pARL1a(+)-CRT-[hGrx1-roGFP2] pARL1a(+)-CRT-[PM-pHluorin] p[Hyper-3/pSypHer] cyto vector pQE60-[roGFP2-Orp1] pET28a(+) pQE30-[sfroGFP2] Transient transfection pARL1a(+)-CRT-[roGFP2-Orp1] pARL1a(+)-CRT-[ACP-roGFP2-Orp1] pARL1a(+)-CRT-[CS-roGFP2-hGrx1] pARL1a(+)-CRT-[PM-roGFP2-hGrx1] pARL1a(+)-CRT-[STEVOR-roGFP2-hGrx1-SDEL] pARL1a(+)-CRT-[HyPer-3/SypHer] pARL1a(+)-CRT-[ACP-HyPer/SypHer] pARL1a(+)-CRT-[CS-HyPer-3/SypHer] pARL1a(+)-CRT-[PM-HyPer-3/SypHer] pARL1a(+)-CRT-[STEVOR-HyPer-3/SypHer-SDEL] pARL1a(+)-CRT-[pHluorin] Stable transfection – 1600-CRT promoter pDC2-CRT-[FA2a-roGFP1]-attP pDC2-CRT-[roGFP2-Orp1]-attP pDC2-CRT-[ACP-roGFP2-Orp1]-attP pDC2-CRT-[CS-roGFP2-hGrx1]-attP pDC2-CRT-[ACP-HyPer-3/SypHer]-attP pDC2-CRT-[CS-HyPer-3/SypHer]-attP pDC2-CRT-[hGrx1-roGFP2]-attP pDC2-CRT-[ACP-roGFP2-hGrx1]-attP pDC2-CRT-[CS-roGFP2-hGrx1]-attP
Kindly provided by Andreas Meyer, Bonn Universtiy Kindly provided by Michael Lanzer, Heidelberg University Hospital Kindly provided by Vsevolod Belousov, Russian Academy of Sciences, Moscow, Russia Kindly provided by Tobias Dick, DKFZ, Heidelberg Novagen, Darmstadt Generated Generated Generated Generated Generated Generated Generated Generated Generated Generated Generated Generated Kindly provided by David Fidock, Columbia University, NY, USA Generated Generated Generated Generated Generated Generated Generated Generated
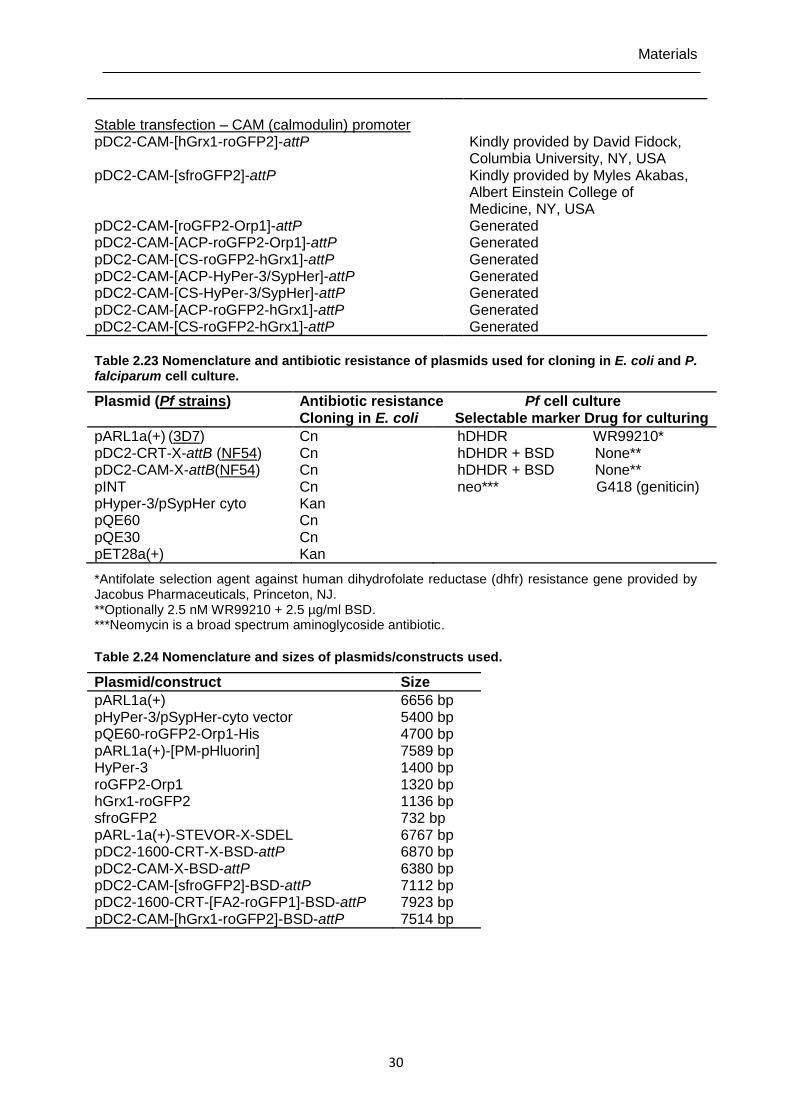
Materials
30
Stable transfection – CAM (calmodulin) promoter pDC2-CAM-[hGrx1-roGFP2]-attP pDC2-CAM-[sfroGFP2]-attP pDC2-CAM-[roGFP2-Orp1]-attP pDC2-CAM-[ACP-roGFP2-Orp1]-attP pDC2-CAM-[CS-roGFP2-hGrx1]-attP pDC2-CAM-[ACP-HyPer-3/SypHer]-attP pDC2-CAM-[CS-HyPer-3/SypHer]-attP pDC2-CAM-[ACP-roGFP2-hGrx1]-attP pDC2-CAM-[CS-roGFP2-hGrx1]-attP
Kindly provided by David Fidock, Columbia University, NY, USA Kindly provided by Myles Akabas, Albert Einstein College of Medicine, NY, USA Generated Generated Generated Generated Generated Generated Generated
Table 2.23 Nomenclature and antibiotic resistance of plasmids used for cloning in E. coli and P. falciparum cell culture.
Plasmid (Pf strains) Antibiotic resistance Pf cell culture Cloning in E. coli Selectable marker Drug for culturing
pARL1a(+) (3D7) Cn hDHDR WR99210* pDC2-CRT-X-attB (NF54) pDC2-CAM-X-attB(NF54) pINT pHyper-3/pSypHer cyto pQE60 pQE30
Cn Cn Cn Kan Cn Cn
hDHDR + BSD None** hDHDR + BSD None** neo*** G418 (geniticin)
pET28a(+) Kan
*Antifolate selection agent against human dihydrofolate reductase (dhfr) resistance gene provided by Jacobus Pharmaceuticals, Princeton, NJ. **Optionally 2.5 nM WR99210 + 2.5 µg/ml BSD. ***Neomycin is a broad spectrum aminoglycoside antibiotic.
Table 2.24 Nomenclature and sizes of plasmids/constructs used.
Plasmid/construct Size
pARL1a(+) 6656 bp pHyPer-3/pSypHer-cyto vector 5400 bp pQE60-roGFP2-Orp1-His pARL1a(+)-[PM-pHluorin]
4700 bp 7589 bp
HyPer-3 1400 bp roGFP2-Orp1 1320 bp hGrx1-roGFP2 sfroGFP2
1136 bp 732 bp
pARL-1a(+)-STEVOR-X-SDEL pDC2-1600-CRT-X-BSD-attP pDC2-CAM-X-BSD-attP pDC2-CAM-[sfroGFP2]-BSD-attP pDC2-1600-CRT-[FA2-roGFP1]-BSD-attP
6767 bp 6870 bp 6380 bp 7112 bp 7923 bp
pDC2-CAM-[hGrx1-roGFP2]-BSD-attP 7514 bp
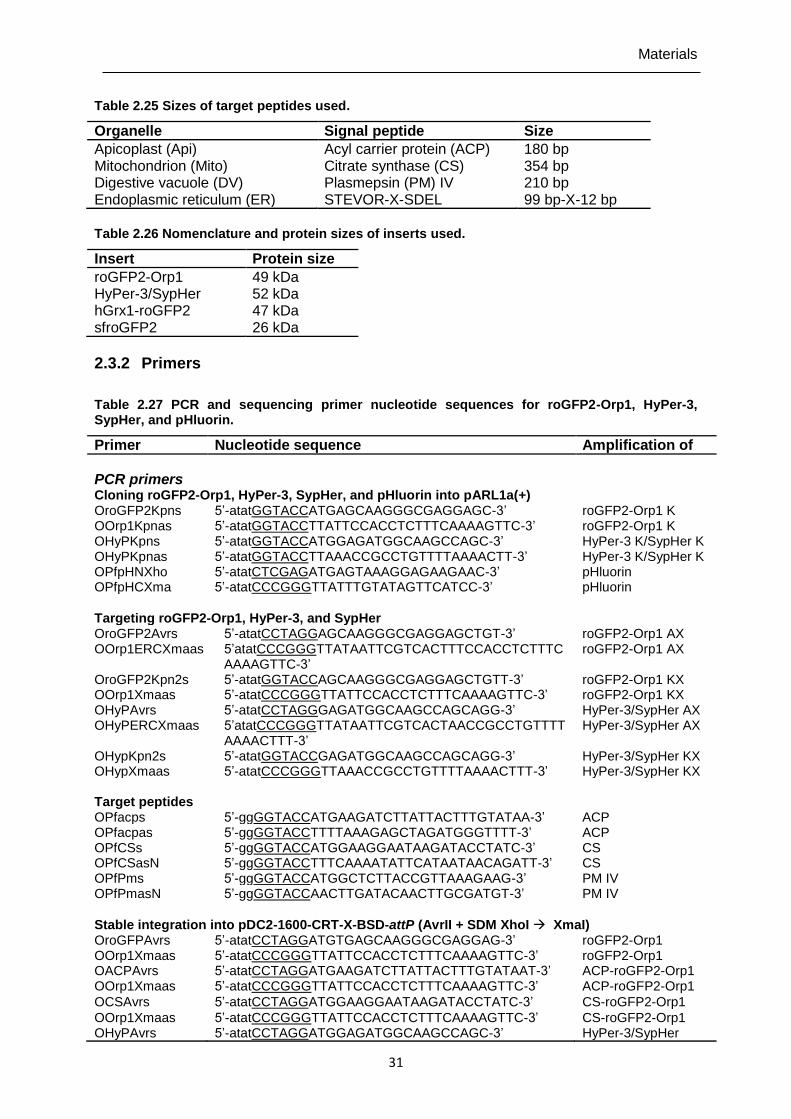
Materials
31
Table 2.25 Sizes of target peptides used.
Organelle Signal peptide Size
Apicoplast (Api) Acyl carrier protein (ACP) 180 bp Mitochondrion (Mito) Citrate synthase (CS) 354 bp Digestive vacuole (DV) Plasmepsin (PM) IV 210 bp Endoplasmic reticulum (ER) STEVOR-X-SDEL 99 bp-X-12 bp
Table 2.26 Nomenclature and protein sizes of inserts used.
Insert Protein size
roGFP2-Orp1 49 kDa HyPer-3/SypHer 52 kDa hGrx1-roGFP2 sfroGFP2
47 kDa 26 kDa
2.3.2 Primers Table 2.27 PCR and sequencing primer nucleotide sequences for roGFP2-Orp1, HyPer-3, SypHer, and pHluorin.
Primer Nucleotide sequence Amplification of
PCR primers Cloning roGFP2-Orp1, HyPer-3, SypHer, and pHluorin into pARL1a(+)
OroGFP2Kpns 5’-atatGGTACCATGAGCAAGGGCGAGGAGC-3’ roGFP2-Orp1 K OOrp1Kpnas 5’-atatGGTACCTTATTCCACCTCTTTCAAAAGTTC-3’ roGFP2-Orp1 K OHyPKpns 5’-atatGGTACCATGGAGATGGCAAGCCAGC-3’ HyPer-3 K/SypHer K OHyPKpnas OPfpHNXho OPfpHCXma
5’-atatGGTACCTTAAACCGCCTGTTTTAAAACTT-3’ 5’-atatCTCGAGATGAGTAAAGGAGAAGAAC-3’ 5’-atatCCCGGGTTATTTGTATAGTTCATCC-3’
HyPer-3 K/SypHer K pHluorin pHluorin
Targeting roGFP2-Orp1, HyPer-3, and SypHer
OroGFP2Avrs 5’-atatCCTAGGAGCAAGGGCGAGGAGCTGT-3’ roGFP2-Orp1 AX OOrp1ERCXmaas 5’atatCCCGGGTTATAATTCGTCACTTTCCACCTCTTTC
AAAAGTTC-3’ roGFP2-Orp1 AX
OroGFP2Kpn2s 5’-atatGGTACCAGCAAGGGCGAGGAGCTGTT-3’ roGFP2-Orp1 KX OOrp1Xmaas 5’-atatCCCGGGTTATTCCACCTCTTTCAAAAGTTC-3’ roGFP2-Orp1 KX OHyPAvrs OHyPERCXmaas OHypKpn2s
5’-atatCCTAGGGAGATGGCAAGCCAGCAGG-3’ 5’atatCCCGGGTTATAATTCGTCACTAACCGCCTGTTTTAAAACTTT-3’ 5’-atatGGTACCGAGATGGCAAGCCAGCAGG-3’
HyPer-3/SypHer AX HyPer-3/SypHer AX HyPer-3/SypHer KX
OHypXmaas 5’-atatCCCGGGTTAAACCGCCTGTTTTAAAACTTT-3’ HyPer-3/SypHer KX Target peptides OPfacps
5’-ggGGTACCATGAAGATCTTATTACTTTGTATAA-3’
ACP
OPfacpas OPfCSs
5’-ggGGTACCTTTTAAAGAGCTAGATGGGTTTT-3’ 5’-ggGGTACCATGGAAGGAATAAGATACCTATC-3’
ACP CS
OPfCSasN 5’-ggGGTACCTTTCAAAATATTCATAATAACAGATT-3’ CS OPfPms 5’-ggGGTACCATGGCTCTTACCGTTAAAGAAG-3’ PM IV OPfPmasN 5’-ggGGTACCAACTTGATACAACTTGCGATGT-3’ PM IV
Stable integration into pDC2-1600-CRT-X-BSD-attP (AvrII + SDM XhoI XmaI)
OroGFPAvrs 5’-atatCCTAGGATGTGAGCAAGGGCGAGGAG-3’ roGFP2-Orp1 OOrp1Xmaas OACPAvrs
5’-atatCCCGGGTTATTCCACCTCTTTCAAAAGTTC-3’ 5’-atatCCTAGGATGAAGATCTTATTACTTTGTATAAT-3’
roGFP2-Orp1 ACP-roGFP2-Orp1
OOrp1Xmaas 5’-atatCCCGGGTTATTCCACCTCTTTCAAAAGTTC-3’ ACP-roGFP2-Orp1
OCSAvrs 5’-atatCCTAGGATGGAAGGAATAAGATACCTATC-3’ CS-roGFP2-Orp1
OOrp1Xmaas OHyPAvrs
5’-atatCCCGGGTTATTCCACCTCTTTCAAAAGTTC-3’ 5’-atatCCTAGGATGGAGATGGCAAGCCAGC-3’
CS-roGFP2-Orp1 HyPer-3/SypHer
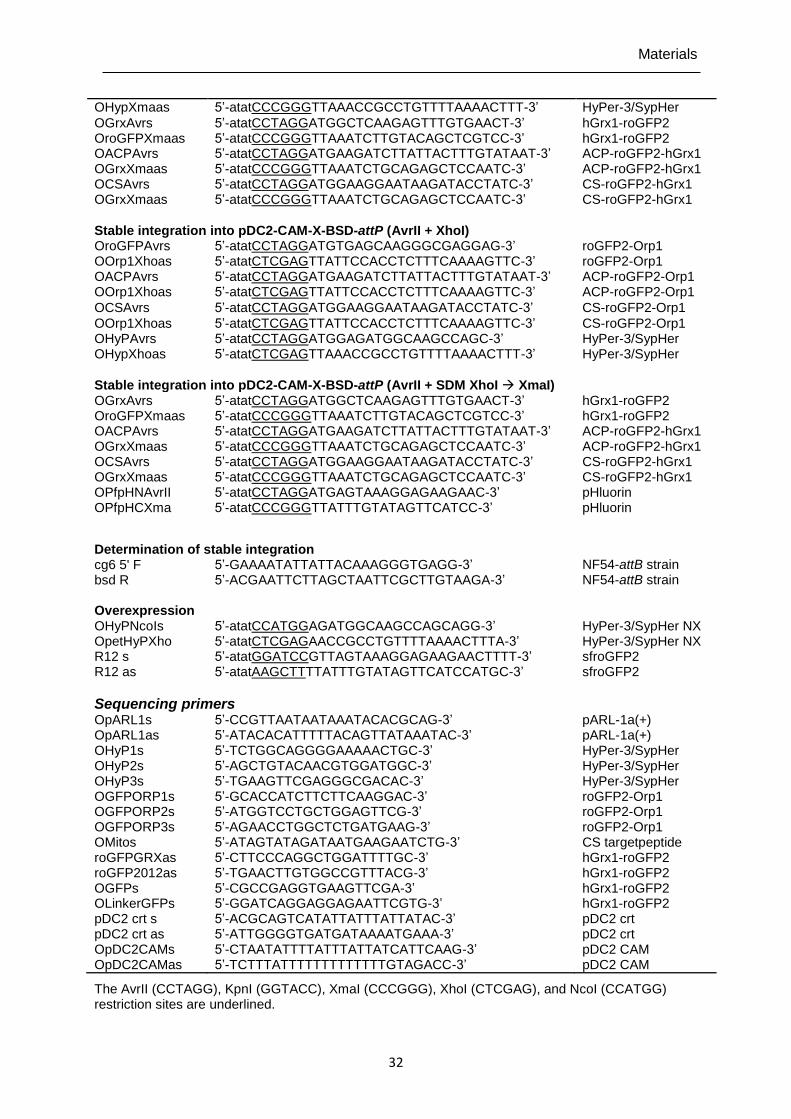
Materials
32
OHypXmaas 5’-atatCCCGGGTTAAACCGCCTGTTTTAAAACTTT-3’ HyPer-3/SypHer
OGrxAvrs OroGFPXmaas
5’-atatCCTAGGATGGCTCAAGAGTTTGTGAACT-3’ 5’-atatCCCGGGTTAAATCTTGTACAGCTCGTCC-3’
hGrx1-roGFP2 hGrx1-roGFP2
OACPAvrs 5’-atatCCTAGGATGAAGATCTTATTACTTTGTATAAT-3’ ACP-roGFP2-hGrx1 OGrxXmaas 5’-atatCCCGGGTTAAATCTGCAGAGCTCCAATC-3’ ACP-roGFP2-hGrx1 OCSAvrs OGrxXmaas
5’-atatCCTAGGATGGAAGGAATAAGATACCTATC-3’ 5’-atatCCCGGGTTAAATCTGCAGAGCTCCAATC-3’
CS-roGFP2-hGrx1 CS-roGFP2-hGrx1
Stable integration into pDC2-CAM-X-BSD-attP (AvrII + XhoI)
OroGFPAvrs 5’-atatCCTAGGATGTGAGCAAGGGCGAGGAG-3’ roGFP2-Orp1 OOrp1Xhoas OACPAvrs
5’-atatCTCGAGTTATTCCACCTCTTTCAAAAGTTC-3’ 5’-atatCCTAGGATGAAGATCTTATTACTTTGTATAAT-3’
roGFP2-Orp1 ACP-roGFP2-Orp1
OOrp1Xhoas 5’-atatCTCGAGTTATTCCACCTCTTTCAAAAGTTC-3’ ACP-roGFP2-Orp1
OCSAvrs 5’-atatCCTAGGATGGAAGGAATAAGATACCTATC-3’ CS-roGFP2-Orp1
OOrp1Xhoas OHyPAvrs OHypXhoas
5’-atatCTCGAGTTATTCCACCTCTTTCAAAAGTTC-3’ 5’-atatCCTAGGATGGAGATGGCAAGCCAGC-3’ 5’-atatCTCGAGTTAAACCGCCTGTTTTAAAACTTT-3’
CS-roGFP2-Orp1 HyPer-3/SypHer HyPer-3/SypHer
Stable integration into pDC2-CAM-X-BSD-attP (AvrII + SDM XhoI XmaI)
OGrxAvrs OroGFPXmaas
5’-atatCCTAGGATGGCTCAAGAGTTTGTGAACT-3’ 5’-atatCCCGGGTTAAATCTTGTACAGCTCGTCC-3’
hGrx1-roGFP2 hGrx1-roGFP2
OACPAvrs 5’-atatCCTAGGATGAAGATCTTATTACTTTGTATAAT-3’ ACP-roGFP2-hGrx1 OGrxXmaas OCSAvrs OGrxXmaas OPfpHNAvrII OPfpHCXma
5’-atatCCCGGGTTAAATCTGCAGAGCTCCAATC-3’ 5’-atatCCTAGGATGGAAGGAATAAGATACCTATC-3’ 5’-atatCCCGGGTTAAATCTGCAGAGCTCCAATC-3’ 5’-atatCCTAGGATGAGTAAAGGAGAAGAAC-3’ 5’-atatCCCGGGTTATTTGTATAGTTCATCC-3’
ACP-roGFP2-hGrx1 CS-roGFP2-hGrx1 CS-roGFP2-hGrx1 pHluorin pHluorin
Determination of stable integration cg6 5' F 5’-GAAAATATTATTACAAAGGGTGAGG-3’ NF54-attB strain bsd R 5’-ACGAATTCTTAGCTAATTCGCTTGTAAGA-3’ NF54-attB strain Overexpression OHyPNcoIs OpetHyPXho R12 s R12 as
5’-atatCCATGGAGATGGCAAGCCAGCAGG-3’ 5’-atatCTCGAGAACCGCCTGTTTTAAAACTTTA-3’ 5’-atatGGATCCGTTAGTAAAGGAGAAGAACTTTT-3’ 5’-atatAAGCTTTTATTTGTATAGTTCATCCATGC-3’
HyPer-3/SypHer NX HyPer-3/SypHer NX sfroGFP2 sfroGFP2
Sequencing primers OpARL1s 5’-CCGTTAATAATAAATACACGCAG-3’ pARL-1a(+) OpARL1as 5’-ATACACATTTTTACAGTTATAAATAC-3’ pARL-1a(+) OHyP1s 5’-TCTGGCAGGGGAAAAACTGC-3’ HyPer-3/SypHer OHyP2s 5’-AGCTGTACAACGTGGATGGC-3’ HyPer-3/SypHer OHyP3s 5’-TGAAGTTCGAGGGCGACAC-3’ HyPer-3/SypHer OGFPORP1s 5’-GCACCATCTTCTTCAAGGAC-3’ roGFP2-Orp1 OGFPORP2s 5’-ATGGTCCTGCTGGAGTTCG-3’ roGFP2-Orp1 OGFPORP3s OMitos roGFPGRXas roGFP2012as OGFPs OLinkerGFPs pDC2 crt s pDC2 crt as OpDC2CAMs
5’-AGAACCTGGCTCTGATGAAG-3’ 5’-ATAGTATAGATAATGAAGAATCTG-3’ 5’-CTTCCCAGGCTGGATTTTGC-3’ 5’-TGAACTTGTGGCCGTTTACG-3’ 5’-CGCCGAGGTGAAGTTCGA-3’ 5’-GGATCAGGAGGAGAATTCGTG-3’ 5’-ACGCAGTCATATTATTTATTATAC-3’ 5’-ATTGGGGTGATGATAAAATGAAA-3’ 5’-CTAATATTTTATTTATTATCATTCAAG-3’
roGFP2-Orp1 CS targetpeptide hGrx1-roGFP2 hGrx1-roGFP2 hGrx1-roGFP2 hGrx1-roGFP2 pDC2 crt pDC2 crt pDC2 CAM
OpDC2CAMas 5’-TCTTTATTTTTTTTTTTTTGTAGACC-3’ pDC2 CAM
The AvrII (CCTAGG), KpnI (GGTACC), XmaI (CCCGGG), XhoI (CTCGAG), and NcoI (CCATGG) restriction sites are underlined.
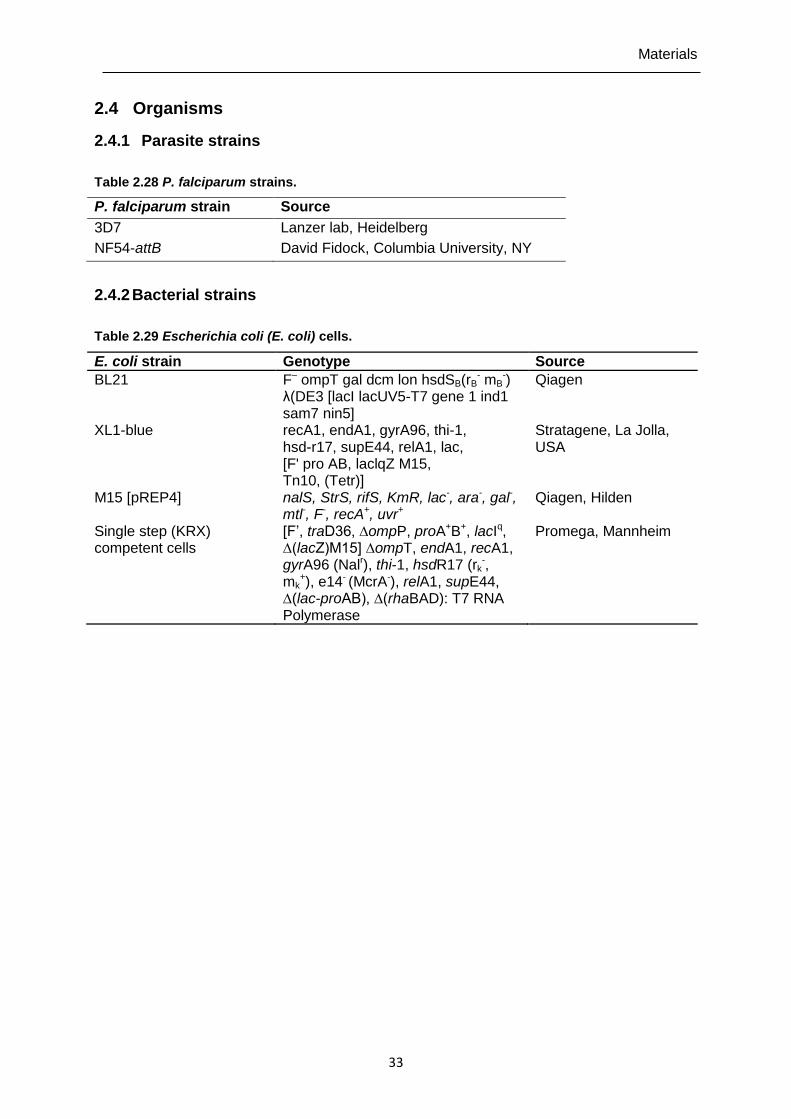
Materials
33
2.4 Organisms
2.4.1 Parasite strains
Table 2.28 P. falciparum strains.
P. falciparum strain Source
3D7 Lanzer lab, Heidelberg
NF54-attB David Fidock, Columbia University, NY
2.4.2 Bacterial strains
Table 2.29 Escherichia coli (E. coli) cells.
E. coli strain Genotype Source
BL21 XL1-blue M15 [pREP4]
F– ompT gal dcm lon hsdSB(rB- mB
-) λ(DE3 [lacI lacUV5-T7 gene 1 ind1 sam7 nin5] recA1, endA1, gyrA96, thi-1, hsd-r17, supE44, relA1, lac, [F' pro AB, laclqZ M15, Tn10, (Tetr)] nalS, StrS, rifS, KmR, lac-, ara-, gal-, mtl-, F-, recA+, uvr+
Qiagen Stratagene, La Jolla, USA Qiagen, Hilden
Single step (KRX) competent cells
[F’, traD36, ∆ompP, proA+B+, lacIq, ∆(lacZ)M15] ∆ompT, endA1, recA1, gyrA96 (Nalr), thi-1, hsdR17 (rk
-, mk
+), e14- (McrA-), relA1, supE44, ∆(lac-proAB), ∆(rhaBAD): T7 RNA Polymerase
Promega, Mannheim
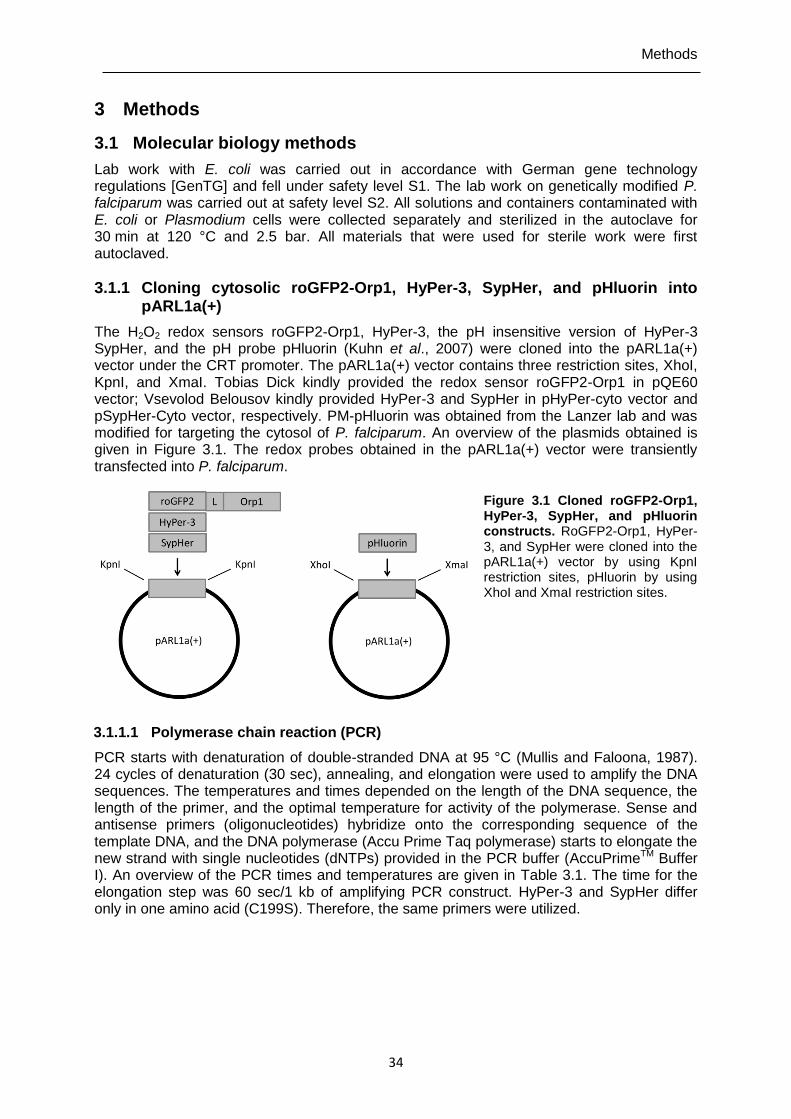
Methods
34
3 Methods
3.1 Molecular biology methods
Lab work with E. coli was carried out in accordance with German gene technology regulations [GenTG] and fell under safety level S1. The lab work on genetically modified P. falciparum was carried out at safety level S2. All solutions and containers contaminated with E. coli or Plasmodium cells were collected separately and sterilized in the autoclave for 30 min at 120 °C and 2.5 bar. All materials that were used for sterile work were first autoclaved.
3.1.1 Cloning cytosolic roGFP2-Orp1, HyPer-3, SypHer, and pHluorin into pARL1a(+)
The H2O2 redox sensors roGFP2-Orp1, HyPer-3, the pH insensitive version of HyPer-3 SypHer, and the pH probe pHluorin (Kuhn et al., 2007) were cloned into the pARL1a(+) vector under the CRT promoter. The pARL1a(+) vector contains three restriction sites, XhoI, KpnI, and XmaI. Tobias Dick kindly provided the redox sensor roGFP2-Orp1 in pQE60 vector; Vsevolod Belousov kindly provided HyPer-3 and SypHer in pHyPer-cyto vector and pSypHer-Cyto vector, respectively. PM-pHluorin was obtained from the Lanzer lab and was modified for targeting the cytosol of P. falciparum. An overview of the plasmids obtained is given in Figure 3.1. The redox probes obtained in the pARL1a(+) vector were transiently transfected into P. falciparum.
Figure 3.1 Cloned roGFP2-Orp1, HyPer-3, SypHer, and pHluorin constructs. RoGFP2-Orp1, HyPer-3, and SypHer were cloned into the pARL1a(+) vector by using KpnI restriction sites, pHluorin by using XhoI and XmaI restriction sites.
3.1.1.1 Polymerase chain reaction (PCR)
PCR starts with denaturation of double-stranded DNA at 95 °C (Mullis and Faloona, 1987). 24 cycles of denaturation (30 sec), annealing, and elongation were used to amplify the DNA sequences. The temperatures and times depended on the length of the DNA sequence, the length of the primer, and the optimal temperature for activity of the polymerase. Sense and antisense primers (oligonucleotides) hybridize onto the corresponding sequence of the template DNA, and the DNA polymerase (Accu Prime Taq polymerase) starts to elongate the new strand with single nucleotides (dNTPs) provided in the PCR buffer (AccuPrimeTM Buffer I). An overview of the PCR times and temperatures are given in Table 3.1. The time for the elongation step was 60 sec/1 kb of amplifying PCR construct. HyPer-3 and SypHer differ only in one amino acid (C199S). Therefore, the same primers were utilized.
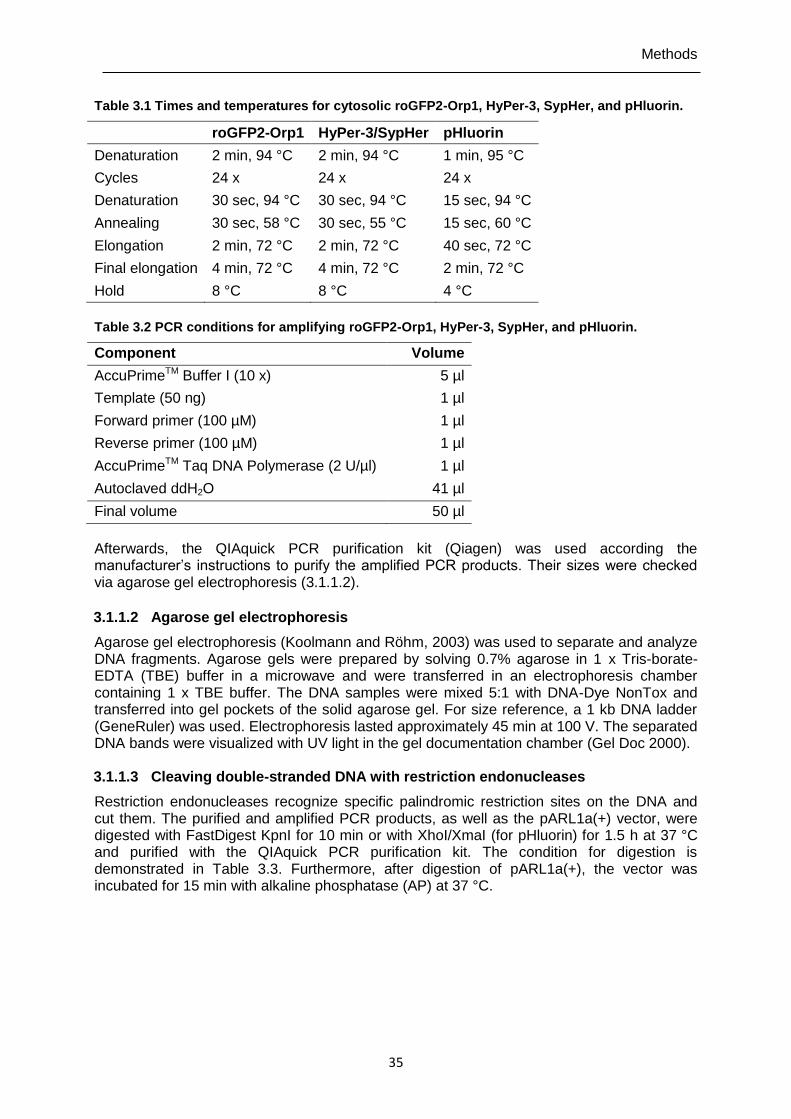
Methods
35
Table 3.1 Times and temperatures for cytosolic roGFP2-Orp1, HyPer-3, SypHer, and pHluorin.
roGFP2-Orp1 HyPer-3/SypHer pHluorin
Denaturation 2 min, 94 °C 2 min, 94 °C 1 min, 95 °C
Cycles 24 x 24 x 24 x
Denaturation 30 sec, 94 °C 30 sec, 94 °C 15 sec, 94 °C
Annealing 30 sec, 58 °C 30 sec, 55 °C 15 sec, 60 °C
Elongation 2 min, 72 °C 2 min, 72 °C 40 sec, 72 °C
Final elongation 4 min, 72 °C 4 min, 72 °C 2 min, 72 °C
Hold 8 °C 8 °C 4 °C
Table 3.2 PCR conditions for amplifying roGFP2-Orp1, HyPer-3, SypHer, and pHluorin.
Afterwards, the QIAquick PCR purification kit (Qiagen) was used according the manufacturer’s instructions to purify the amplified PCR products. Their sizes were checked via agarose gel electrophoresis (3.1.1.2).
3.1.1.2 Agarose gel electrophoresis
Agarose gel electrophoresis (Koolmann and Röhm, 2003) was used to separate and analyze DNA fragments. Agarose gels were prepared by solving 0.7% agarose in 1 x Tris-borate-EDTA (TBE) buffer in a microwave and were transferred in an electrophoresis chamber containing 1 x TBE buffer. The DNA samples were mixed 5:1 with DNA-Dye NonTox and transferred into gel pockets of the solid agarose gel. For size reference, a 1 kb DNA ladder (GeneRuler) was used. Electrophoresis lasted approximately 45 min at 100 V. The separated DNA bands were visualized with UV light in the gel documentation chamber (Gel Doc 2000). 3.1.1.3 Cleaving double-stranded DNA with restriction endonucleases
Restriction endonucleases recognize specific palindromic restriction sites on the DNA and cut them. The purified and amplified PCR products, as well as the pARL1a(+) vector, were digested with FastDigest KpnI for 10 min or with XhoI/XmaI (for pHluorin) for 1.5 h at 37 °C and purified with the QIAquick PCR purification kit. The condition for digestion is demonstrated in Table 3.3. Furthermore, after digestion of pARL1a(+), the vector was incubated for 15 min with alkaline phosphatase (AP) at 37 °C.
Component Volume
AccuPrimeTM Buffer I (10 x) 5 µl
Template (50 ng) 1 µl
Forward primer (100 µM) 1 µl
Reverse primer (100 µM) 1 µl
AccuPrimeTM Taq DNA Polymerase (2 U/µl) 1 µl
Autoclaved ddH2O 41 µl
Final volume 50 µl
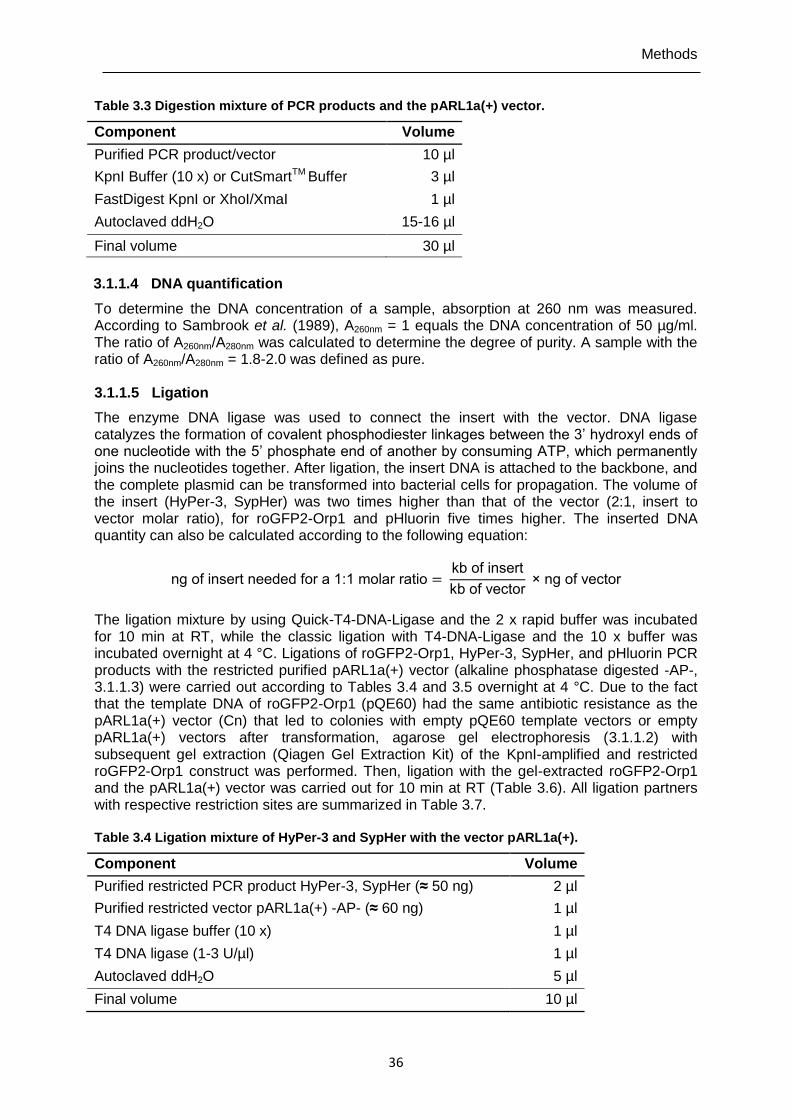
Methods
36
Table 3.3 Digestion mixture of PCR products and the pARL1a(+) vector.
Component Volume
Purified PCR product/vector 10 µl
KpnI Buffer (10 x) or CutSmartTM Buffer 3 µl
FastDigest KpnI or XhoI/XmaI 1 µl
Autoclaved ddH2O 15-16 µl
Final volume 30 µl
3.1.1.4 DNA quantification
To determine the DNA concentration of a sample, absorption at 260 nm was measured. According to Sambrook et al. (1989), A260nm = 1 equals the DNA concentration of 50 µg/ml. The ratio of A260nm/A280nm was calculated to determine the degree of purity. A sample with the ratio of A260nm/A280nm = 1.8-2.0 was defined as pure. 3.1.1.5 Ligation
The enzyme DNA ligase was used to connect the insert with the vector. DNA ligase catalyzes the formation of covalent phosphodiester linkages between the 3’ hydroxyl ends of one nucleotide with the 5’ phosphate end of another by consuming ATP, which permanently joins the nucleotides together. After ligation, the insert DNA is attached to the backbone, and the complete plasmid can be transformed into bacterial cells for propagation. The volume of the insert (HyPer-3, SypHer) was two times higher than that of the vector (2:1, insert to vector molar ratio), for roGFP2-Orp1 and pHluorin five times higher. The inserted DNA quantity can also be calculated according to the following equation:
ng of insert needed for a 1:1 molar ratio = kb of insert
kb of vector × ng of vector
The ligation mixture by using Quick-T4-DNA-Ligase and the 2 x rapid buffer was incubated for 10 min at RT, while the classic ligation with T4-DNA-Ligase and the 10 x buffer was incubated overnight at 4 °C. Ligations of roGFP2-Orp1, HyPer-3, SypHer, and pHluorin PCR products with the restricted purified pARL1a(+) vector (alkaline phosphatase digested -AP-, 3.1.1.3) were carried out according to Tables 3.4 and 3.5 overnight at 4 °C. Due to the fact that the template DNA of roGFP2-Orp1 (pQE60) had the same antibiotic resistance as the pARL1a(+) vector (Cn) that led to colonies with empty pQE60 template vectors or empty pARL1a(+) vectors after transformation, agarose gel electrophoresis (3.1.1.2) with subsequent gel extraction (Qiagen Gel Extraction Kit) of the KpnI-amplified and restricted roGFP2-Orp1 construct was performed. Then, ligation with the gel-extracted roGFP2-Orp1 and the pARL1a(+) vector was carried out for 10 min at RT (Table 3.6). All ligation partners with respective restriction sites are summarized in Table 3.7. Table 3.4 Ligation mixture of HyPer-3 and SypHer with the vector pARL1a(+).
Component Volume
Purified restricted PCR product HyPer-3, SypHer (≈ 50 ng) 2 µl
Purified restricted vector pARL1a(+) -AP- (≈ 60 ng) 1 µl
T4 DNA ligase buffer (10 x) 1 µl
T4 DNA ligase (1-3 U/µl) 1 µl
Autoclaved ddH2O 5 µl
Final volume 10 µl
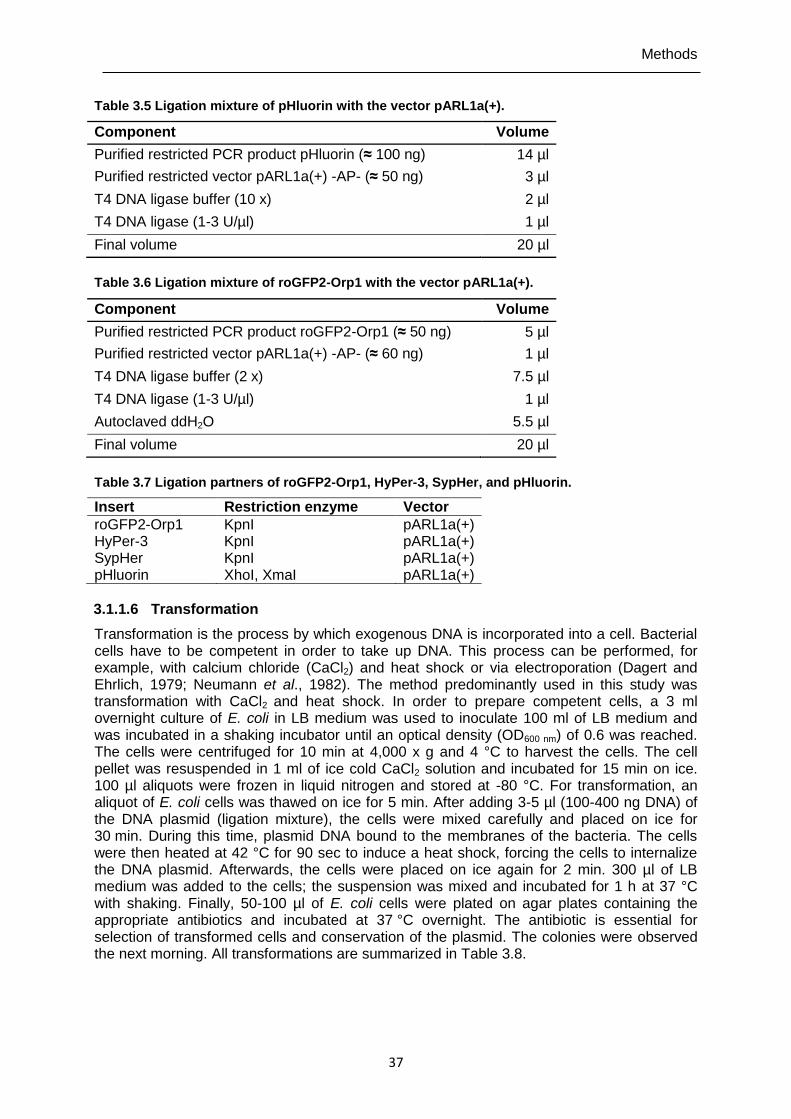
Methods
37
Table 3.5 Ligation mixture of pHluorin with the vector pARL1a(+).
Component Volume
Purified restricted PCR product pHluorin (≈ 100 ng) 14 µl
Purified restricted vector pARL1a(+) -AP- (≈ 50 ng) 3 µl
T4 DNA ligase buffer (10 x) 2 µl
T4 DNA ligase (1-3 U/µl) 1 µl
Final volume 20 µl
Table 3.6 Ligation mixture of roGFP2-Orp1 with the vector pARL1a(+).
Component Volume
Purified restricted PCR product roGFP2-Orp1 (≈ 50 ng) 5 µl
Purified restricted vector pARL1a(+) -AP- (≈ 60 ng) 1 µl
T4 DNA ligase buffer (2 x) 7.5 µl
T4 DNA ligase (1-3 U/µl) 1 µl
Autoclaved ddH2O 5.5 µl
Final volume 20 µl
Table 3.7 Ligation partners of roGFP2-Orp1, HyPer-3, SypHer, and pHluorin.
Insert Restriction enzyme Vector
roGFP2-Orp1 HyPer-3 SypHer pHluorin
KpnI KpnI KpnI XhoI, XmaI
pARL1a(+) pARL1a(+) pARL1a(+) pARL1a(+)
3.1.1.6 Transformation
Transformation is the process by which exogenous DNA is incorporated into a cell. Bacterial cells have to be competent in order to take up DNA. This process can be performed, for example, with calcium chloride (CaCl2) and heat shock or via electroporation (Dagert and Ehrlich, 1979; Neumann et al., 1982). The method predominantly used in this study was transformation with CaCl2 and heat shock. In order to prepare competent cells, a 3 ml overnight culture of E. coli in LB medium was used to inoculate 100 ml of LB medium and was incubated in a shaking incubator until an optical density (OD600 nm) of 0.6 was reached. The cells were centrifuged for 10 min at 4,000 x g and 4 °C to harvest the cells. The cell pellet was resuspended in 1 ml of ice cold CaCl2 solution and incubated for 15 min on ice. 100 µl aliquots were frozen in liquid nitrogen and stored at -80 °C. For transformation, an aliquot of E. coli cells was thawed on ice for 5 min. After adding 3-5 µl (100-400 ng DNA) of the DNA plasmid (ligation mixture), the cells were mixed carefully and placed on ice for 30 min. During this time, plasmid DNA bound to the membranes of the bacteria. The cells were then heated at 42 °C for 90 sec to induce a heat shock, forcing the cells to internalize the DNA plasmid. Afterwards, the cells were placed on ice again for 2 min. 300 µl of LB medium was added to the cells; the suspension was mixed and incubated for 1 h at 37 °C with shaking. Finally, 50-100 µl of E. coli cells were plated on agar plates containing the appropriate antibiotics and incubated at 37 °C overnight. The antibiotic is essential for selection of transformed cells and conservation of the plasmid. The colonies were observed the next morning. All transformations are summarized in Table 3.8.
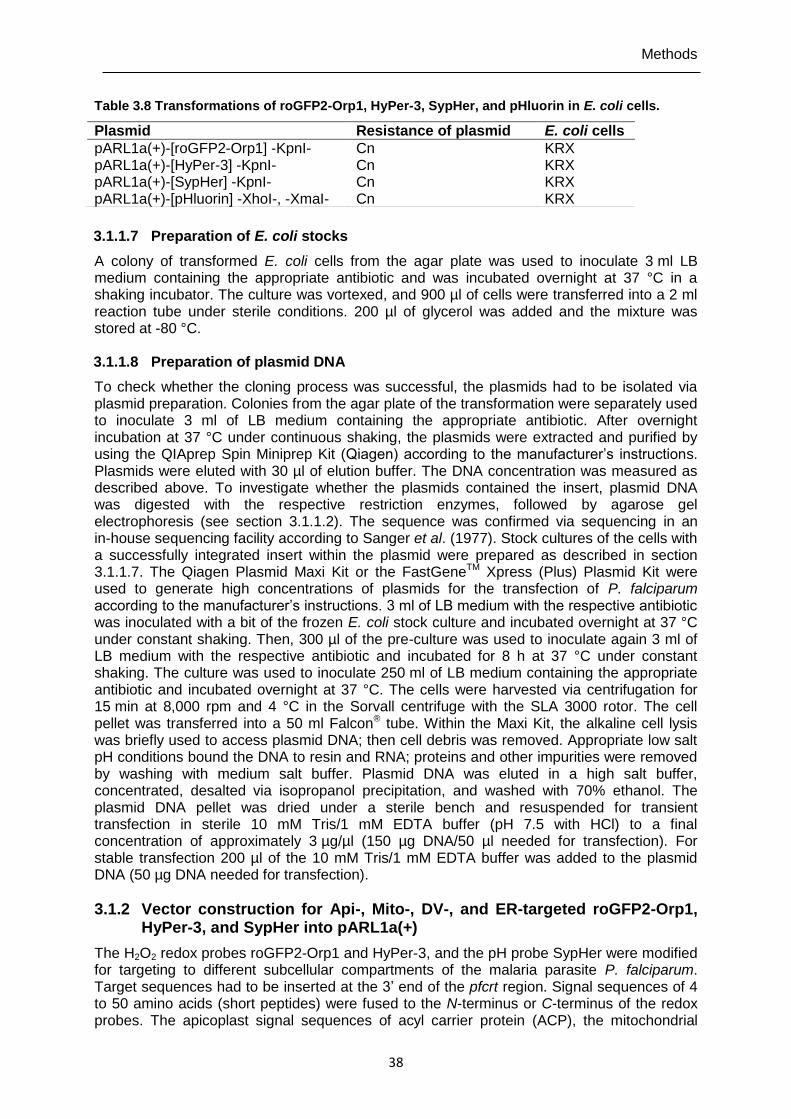
Methods
38
Table 3.8 Transformations of roGFP2-Orp1, HyPer-3, SypHer, and pHluorin in E. coli cells.
3.1.1.7 Preparation of E. coli stocks
A colony of transformed E. coli cells from the agar plate was used to inoculate 3 ml LB medium containing the appropriate antibiotic and was incubated overnight at 37 °C in a shaking incubator. The culture was vortexed, and 900 µl of cells were transferred into a 2 ml reaction tube under sterile conditions. 200 µl of glycerol was added and the mixture was stored at -80 °C. 3.1.1.8 Preparation of plasmid DNA
To check whether the cloning process was successful, the plasmids had to be isolated via plasmid preparation. Colonies from the agar plate of the transformation were separately used to inoculate 3 ml of LB medium containing the appropriate antibiotic. After overnight incubation at 37 °C under continuous shaking, the plasmids were extracted and purified by using the QIAprep Spin Miniprep Kit (Qiagen) according to the manufacturer’s instructions. Plasmids were eluted with 30 µl of elution buffer. The DNA concentration was measured as described above. To investigate whether the plasmids contained the insert, plasmid DNA was digested with the respective restriction enzymes, followed by agarose gel electrophoresis (see section 3.1.1.2). The sequence was confirmed via sequencing in an in-house sequencing facility according to Sanger et al. (1977). Stock cultures of the cells with a successfully integrated insert within the plasmid were prepared as described in section 3.1.1.7. The Qiagen Plasmid Maxi Kit or the FastGeneTM Xpress (Plus) Plasmid Kit were used to generate high concentrations of plasmids for the transfection of P. falciparum according to the manufacturer’s instructions. 3 ml of LB medium with the respective antibiotic was inoculated with a bit of the frozen E. coli stock culture and incubated overnight at 37 °C under constant shaking. Then, 300 µl of the pre-culture was used to inoculate again 3 ml of LB medium with the respective antibiotic and incubated for 8 h at 37 °C under constant shaking. The culture was used to inoculate 250 ml of LB medium containing the appropriate antibiotic and incubated overnight at 37 °C. The cells were harvested via centrifugation for 15 min at 8,000 rpm and 4 °C in the Sorvall centrifuge with the SLA 3000 rotor. The cell pellet was transferred into a 50 ml Falcon® tube. Within the Maxi Kit, the alkaline cell lysis was briefly used to access plasmid DNA; then cell debris was removed. Appropriate low salt pH conditions bound the DNA to resin and RNA; proteins and other impurities were removed by washing with medium salt buffer. Plasmid DNA was eluted in a high salt buffer, concentrated, desalted via isopropanol precipitation, and washed with 70% ethanol. The plasmid DNA pellet was dried under a sterile bench and resuspended for transient transfection in sterile 10 mM Tris/1 mM EDTA buffer (pH 7.5 with HCl) to a final concentration of approximately 3 µg/µl (150 µg DNA/50 µl needed for transfection). For stable transfection 200 µl of the 10 mM Tris/1 mM EDTA buffer was added to the plasmid DNA (50 µg DNA needed for transfection).
3.1.2 Vector construction for Api-, Mito-, DV-, and ER-targeted roGFP2-Orp1, HyPer-3, and SypHer into pARL1a(+)
The H2O2 redox probes roGFP2-Orp1 and HyPer-3, and the pH probe SypHer were modified for targeting to different subcellular compartments of the malaria parasite P. falciparum. Target sequences had to be inserted at the 3’ end of the pfcrt region. Signal sequences of 4 to 50 amino acids (short peptides) were fused to the N-terminus or C-terminus of the redox probes. The apicoplast signal sequences of acyl carrier protein (ACP), the mitochondrial
Plasmid Resistance of plasmid E. coli cells
pARL1a(+)-[roGFP2-Orp1] -KpnI- Cn KRX pARL1a(+)-[HyPer-3] -KpnI- Cn KRX pARL1a(+)-[SypHer] -KpnI- pARL1a(+)-[pHluorin] -XhoI-, -XmaI-
Cn Cn
KRX KRX
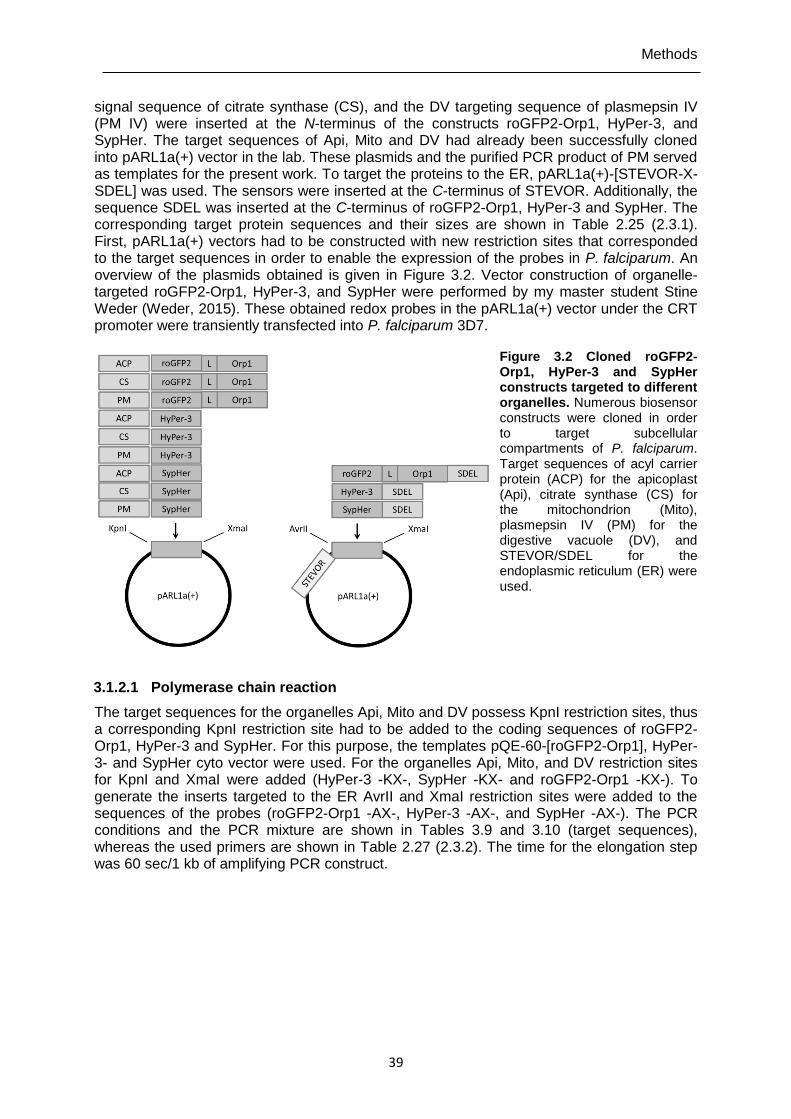
Methods
39
signal sequence of citrate synthase (CS), and the DV targeting sequence of plasmepsin IV (PM IV) were inserted at the N-terminus of the constructs roGFP2-Orp1, HyPer-3, and SypHer. The target sequences of Api, Mito and DV had already been successfully cloned into pARL1a(+) vector in the lab. These plasmids and the purified PCR product of PM served as templates for the present work. To target the proteins to the ER, pARL1a(+)-[STEVOR-X-SDEL] was used. The sensors were inserted at the C-terminus of STEVOR. Additionally, the sequence SDEL was inserted at the C-terminus of roGFP2-Orp1, HyPer-3 and SypHer. The corresponding target protein sequences and their sizes are shown in Table 2.25 (2.3.1). First, pARL1a(+) vectors had to be constructed with new restriction sites that corresponded to the target sequences in order to enable the expression of the probes in P. falciparum. An overview of the plasmids obtained is given in Figure 3.2. Vector construction of organelle-targeted roGFP2-Orp1, HyPer-3, and SypHer were performed by my master student Stine Weder (Weder, 2015). These obtained redox probes in the pARL1a(+) vector under the CRT promoter were transiently transfected into P. falciparum 3D7.
Figure 3.2 Cloned roGFP2-Orp1, HyPer-3 and SypHer constructs targeted to different organelles. Numerous biosensor constructs were cloned in order to target subcellular compartments of P. falciparum. Target sequences of acyl carrier protein (ACP) for the apicoplast (Api), citrate synthase (CS) for the mitochondrion (Mito), plasmepsin IV (PM) for the digestive vacuole (DV), and STEVOR/SDEL for the endoplasmic reticulum (ER) were used.
3.1.2.1 Polymerase chain reaction
The target sequences for the organelles Api, Mito and DV possess KpnI restriction sites, thus a corresponding KpnI restriction site had to be added to the coding sequences of roGFP2-Orp1, HyPer-3 and SypHer. For this purpose, the templates pQE-60-[roGFP2-Orp1], HyPer-3- and SypHer cyto vector were used. For the organelles Api, Mito, and DV restriction sites for KpnI and XmaI were added (HyPer-3 -KX-, SypHer -KX- and roGFP2-Orp1 -KX-). To generate the inserts targeted to the ER AvrII and XmaI restriction sites were added to the sequences of the probes (roGFP2-Orp1 -AX-, HyPer-3 -AX-, and SypHer -AX-). The PCR conditions and the PCR mixture are shown in Tables 3.9 and 3.10 (target sequences), whereas the used primers are shown in Table 2.27 (2.3.2). The time for the elongation step was 60 sec/1 kb of amplifying PCR construct.
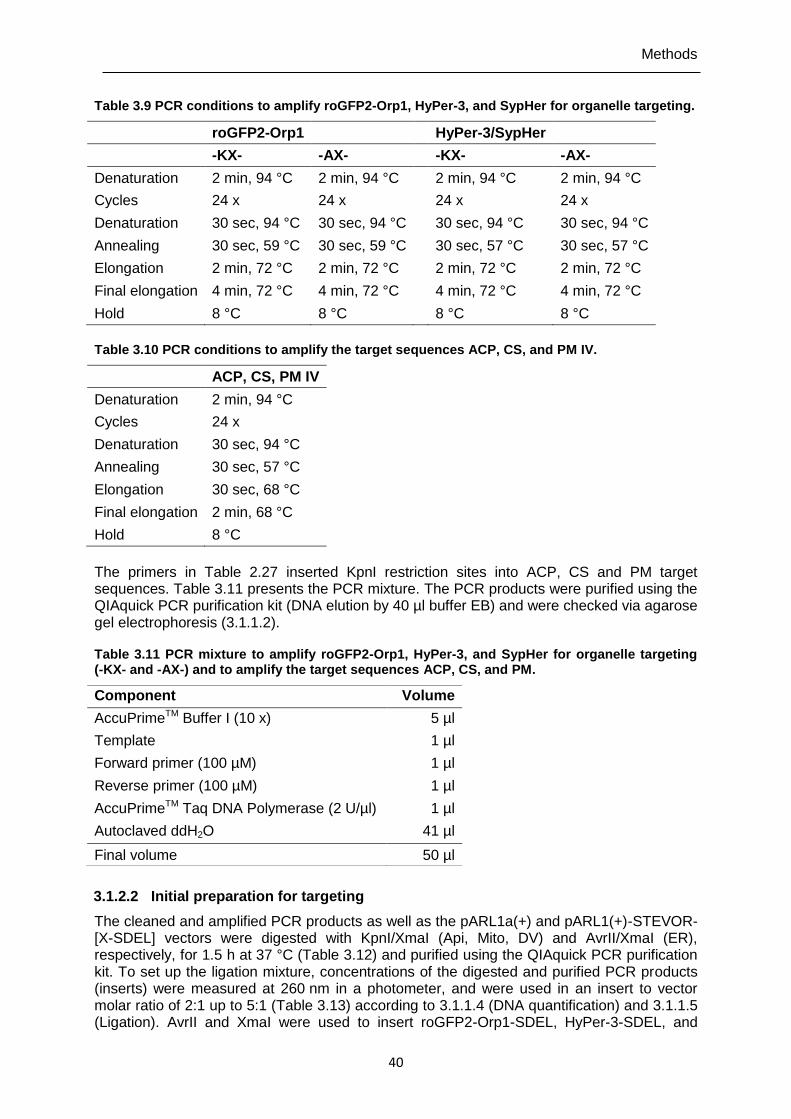
Methods
40
Table 3.9 PCR conditions to amplify roGFP2-Orp1, HyPer-3, and SypHer for organelle targeting.
roGFP2-Orp1 HyPer-3/SypHer
-KX- -AX- -KX- -AX-
Denaturation 2 min, 94 °C 2 min, 94 °C 2 min, 94 °C 2 min, 94 °C
Cycles 24 x 24 x 24 x 24 x
Denaturation 30 sec, 94 °C 30 sec, 94 °C 30 sec, 94 °C 30 sec, 94 °C
Annealing 30 sec, 59 °C 30 sec, 59 °C 30 sec, 57 °C 30 sec, 57 °C
Elongation 2 min, 72 °C 2 min, 72 °C 2 min, 72 °C 2 min, 72 °C
Final elongation 4 min, 72 °C 4 min, 72 °C 4 min, 72 °C 4 min, 72 °C
Hold 8 °C 8 °C 8 °C 8 °C
Table 3.10 PCR conditions to amplify the target sequences ACP, CS, and PM IV.
ACP, CS, PM IV
Denaturation 2 min, 94 °C
Cycles 24 x
Denaturation 30 sec, 94 °C
Annealing 30 sec, 57 °C
Elongation 30 sec, 68 °C
Final elongation 2 min, 68 °C
Hold 8 °C
The primers in Table 2.27 inserted KpnI restriction sites into ACP, CS and PM target sequences. Table 3.11 presents the PCR mixture. The PCR products were purified using the QIAquick PCR purification kit (DNA elution by 40 µl buffer EB) and were checked via agarose gel electrophoresis (3.1.1.2).
Table 3.11 PCR mixture to amplify roGFP2-Orp1, HyPer-3, and SypHer for organelle targeting (-KX- and -AX-) and to amplify the target sequences ACP, CS, and PM.
3.1.2.2 Initial preparation for targeting
The cleaned and amplified PCR products as well as the pARL1a(+) and pARL1(+)-STEVOR-[X-SDEL] vectors were digested with KpnI/XmaI (Api, Mito, DV) and AvrII/XmaI (ER), respectively, for 1.5 h at 37 °C (Table 3.12) and purified using the QIAquick PCR purification kit. To set up the ligation mixture, concentrations of the digested and purified PCR products (inserts) were measured at 260 nm in a photometer, and were used in an insert to vector molar ratio of 2:1 up to 5:1 (Table 3.13) according to 3.1.1.4 (DNA quantification) and 3.1.1.5 (Ligation). AvrII and XmaI were used to insert roGFP2-Orp1-SDEL, HyPer-3-SDEL, and
Component Volume
AccuPrimeTM Buffer I (10 x) 5 µl
Template 1 µl
Forward primer (100 µM) 1 µl
Reverse primer (100 µM) 1 µl
AccuPrimeTM Taq DNA Polymerase (2 U/µl) 1 µl
Autoclaved ddH2O 41 µl
Final volume 50 µl
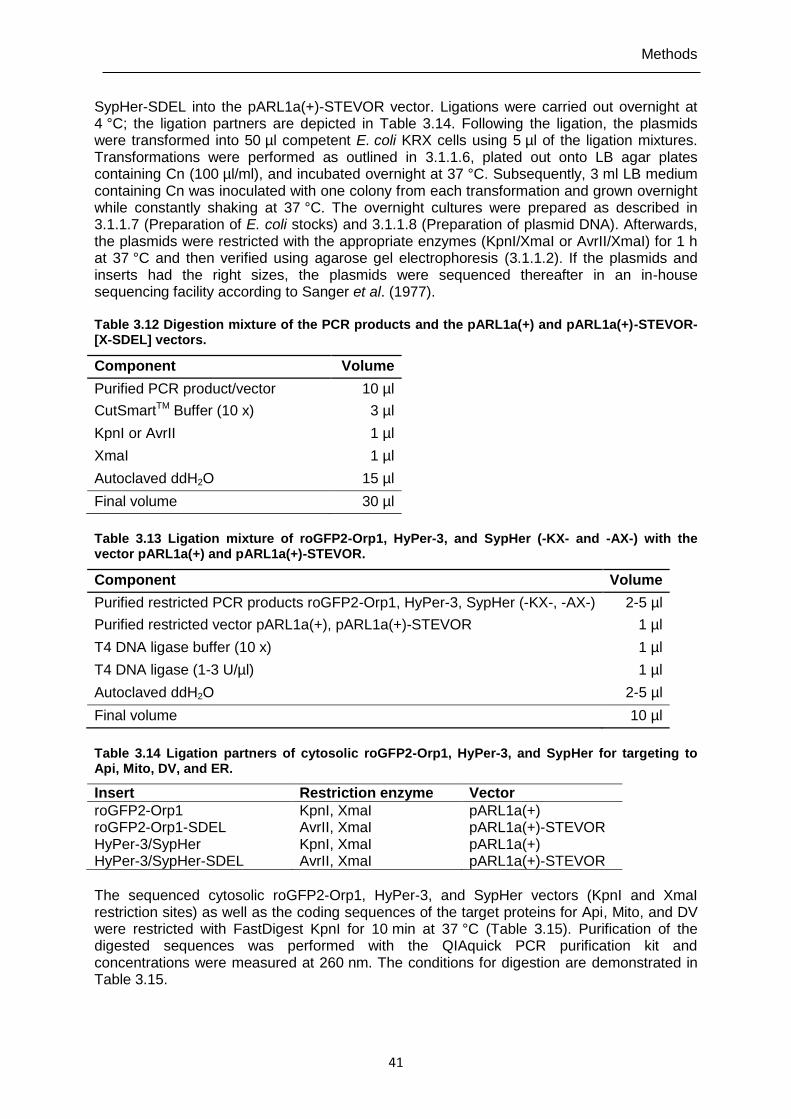
Methods
41
SypHer-SDEL into the pARL1a(+)-STEVOR vector. Ligations were carried out overnight at 4 °C; the ligation partners are depicted in Table 3.14. Following the ligation, the plasmids were transformed into 50 µl competent E. coli KRX cells using 5 µl of the ligation mixtures. Transformations were performed as outlined in 3.1.1.6, plated out onto LB agar plates containing Cn (100 µl/ml), and incubated overnight at 37 °C. Subsequently, 3 ml LB medium containing Cn was inoculated with one colony from each transformation and grown overnight while constantly shaking at 37 °C. The overnight cultures were prepared as described in 3.1.1.7 (Preparation of E. coli stocks) and 3.1.1.8 (Preparation of plasmid DNA). Afterwards, the plasmids were restricted with the appropriate enzymes (KpnI/XmaI or AvrII/XmaI) for 1 h at 37 °C and then verified using agarose gel electrophoresis (3.1.1.2). If the plasmids and inserts had the right sizes, the plasmids were sequenced thereafter in an in-house sequencing facility according to Sanger et al. (1977). Table 3.12 Digestion mixture of the PCR products and the pARL1a(+) and pARL1a(+)-STEVOR-[X-SDEL] vectors.
Component Volume
Purified PCR product/vector 10 µl
CutSmartTM Buffer (10 x) 3 µl
KpnI or AvrII 1 µl
XmaI 1 µl
Autoclaved ddH2O 15 µl
Final volume 30 µl
Table 3.13 Ligation mixture of roGFP2-Orp1, HyPer-3, and SypHer (-KX- and -AX-) with the vector pARL1a(+) and pARL1a(+)-STEVOR.
Component Volume
Purified restricted PCR products roGFP2-Orp1, HyPer-3, SypHer (-KX-, -AX-) 2-5 µl
Purified restricted vector pARL1a(+), pARL1a(+)-STEVOR 1 µl
T4 DNA ligase buffer (10 x) 1 µl
T4 DNA ligase (1-3 U/µl) 1 µl
Autoclaved ddH2O 2-5 µl
Final volume 10 µl
Table 3.14 Ligation partners of cytosolic roGFP2-Orp1, HyPer-3, and SypHer for targeting to Api, Mito, DV, and ER.
Insert Restriction enzyme Vector
roGFP2-Orp1 roGFP2-Orp1-SDEL HyPer-3/SypHer HyPer-3/SypHer-SDEL
KpnI, XmaI AvrII, XmaI KpnI, XmaI AvrII, XmaI
pARL1a(+) pARL1a(+)-STEVOR pARL1a(+) pARL1a(+)-STEVOR
The sequenced cytosolic roGFP2-Orp1, HyPer-3, and SypHer vectors (KpnI and XmaI restriction sites) as well as the coding sequences of the target proteins for Api, Mito, and DV were restricted with FastDigest KpnI for 10 min at 37 °C (Table 3.15). Purification of the digested sequences was performed with the QIAquick PCR purification kit and concentrations were measured at 260 nm. The conditions for digestion are demonstrated in Table 3.15.
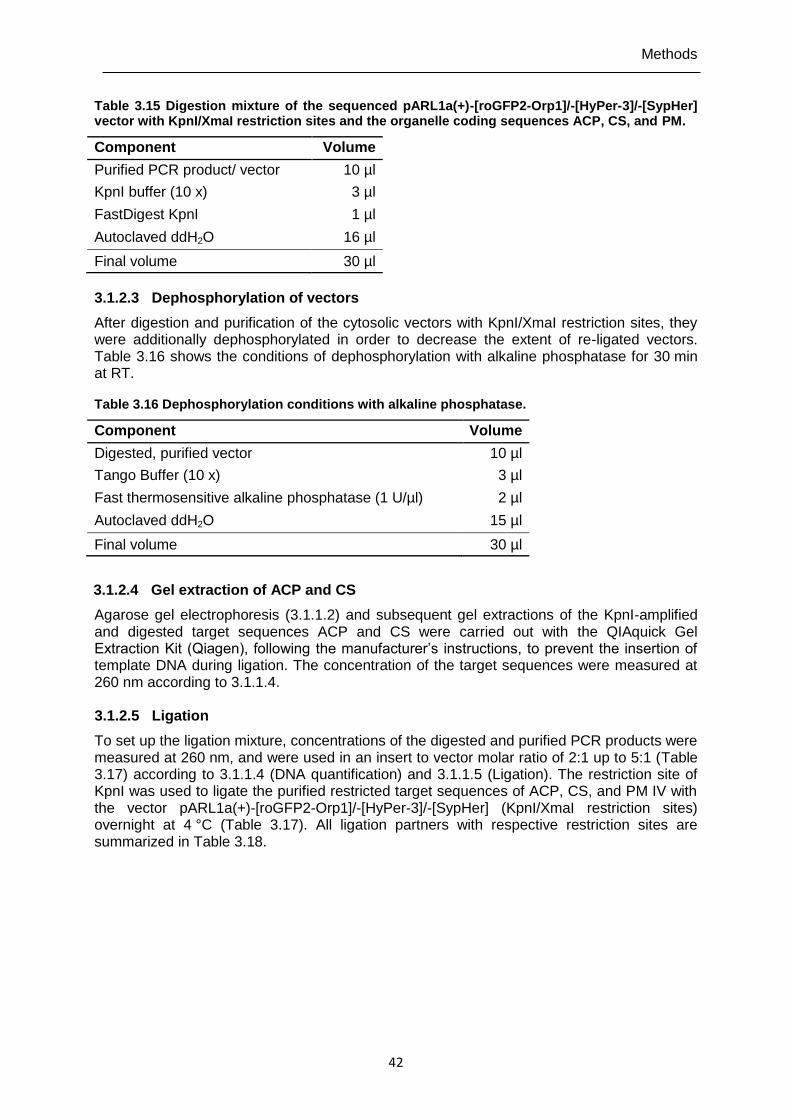
Methods
42
Table 3.15 Digestion mixture of the sequenced pARL1a(+)-[roGFP2-Orp1]/-[HyPer-3]/-[SypHer] vector with KpnI/XmaI restriction sites and the organelle coding sequences ACP, CS, and PM.
Component Volume
Purified PCR product/ vector 10 µl
KpnI buffer (10 x) 3 µl
FastDigest KpnI 1 µl
Autoclaved ddH2O 16 µl
Final volume 30 µl
3.1.2.3 Dephosphorylation of vectors
After digestion and purification of the cytosolic vectors with KpnI/XmaI restriction sites, they were additionally dephosphorylated in order to decrease the extent of re-ligated vectors. Table 3.16 shows the conditions of dephosphorylation with alkaline phosphatase for 30 min at RT. Table 3.16 Dephosphorylation conditions with alkaline phosphatase.
Component Volume
Digested, purified vector 10 µl
Tango Buffer (10 x) 3 µl
Fast thermosensitive alkaline phosphatase (1 U/µl) 2 µl
Autoclaved ddH2O 15 µl
Final volume 30 µl
3.1.2.4 Gel extraction of ACP and CS
Agarose gel electrophoresis (3.1.1.2) and subsequent gel extractions of the KpnI-amplified and digested target sequences ACP and CS were carried out with the QIAquick Gel Extraction Kit (Qiagen), following the manufacturer’s instructions, to prevent the insertion of template DNA during ligation. The concentration of the target sequences were measured at 260 nm according to 3.1.1.4. 3.1.2.5 Ligation
To set up the ligation mixture, concentrations of the digested and purified PCR products were measured at 260 nm, and were used in an insert to vector molar ratio of 2:1 up to 5:1 (Table 3.17) according to 3.1.1.4 (DNA quantification) and 3.1.1.5 (Ligation). The restriction site of KpnI was used to ligate the purified restricted target sequences of ACP, CS, and PM IV with the vector pARL1a(+)-[roGFP2-Orp1]/-[HyPer-3]/-[SypHer] (KpnI/XmaI restriction sites) overnight at 4 °C (Table 3.17). All ligation partners with respective restriction sites are summarized in Table 3.18.
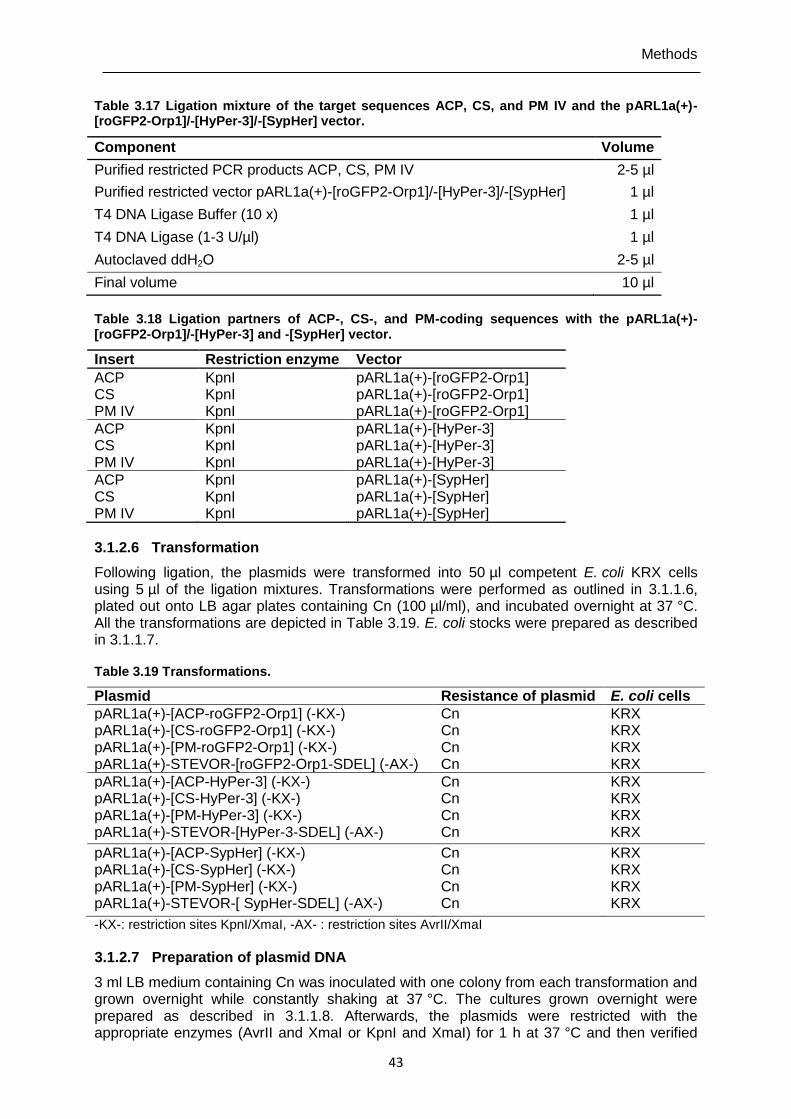
Methods
43
Table 3.17 Ligation mixture of the target sequences ACP, CS, and PM IV and the pARL1a(+)-[roGFP2-Orp1]/-[HyPer-3]/-[SypHer] vector.
Component Volume
Purified restricted PCR products ACP, CS, PM IV 2-5 µl
Purified restricted vector pARL1a(+)-[roGFP2-Orp1]/-[HyPer-3]/-[SypHer] 1 µl
T4 DNA Ligase Buffer (10 x) 1 µl
T4 DNA Ligase (1-3 U/µl) 1 µl
Autoclaved ddH2O 2-5 µl
Final volume 10 µl
Table 3.18 Ligation partners of ACP-, CS-, and PM-coding sequences with the pARL1a(+)-[roGFP2-Orp1]/-[HyPer-3] and -[SypHer] vector.
Insert Restriction enzyme Vector
ACP CS
KpnI KpnI
pARL1a(+)-[roGFP2-Orp1] pARL1a(+)-[roGFP2-Orp1]
PM IV KpnI pARL1a(+)-[roGFP2-Orp1]
ACP CS
KpnI KpnI
pARL1a(+)-[HyPer-3] pARL1a(+)-[HyPer-3]
PM IV KpnI pARL1a(+)-[HyPer-3]
ACP CS
KpnI KpnI
pARL1a(+)-[SypHer] pARL1a(+)-[SypHer]
PM IV KpnI pARL1a(+)-[SypHer]
3.1.2.6 Transformation
Following ligation, the plasmids were transformed into 50 µl competent E. coli KRX cells using 5 µl of the ligation mixtures. Transformations were performed as outlined in 3.1.1.6, plated out onto LB agar plates containing Cn (100 µl/ml), and incubated overnight at 37 °C. All the transformations are depicted in Table 3.19. E. coli stocks were prepared as described in 3.1.1.7.
Table 3.19 Transformations.
Plasmid Resistance of plasmid E. coli cells
pARL1a(+)-[ACP-roGFP2-Orp1] (-KX-) Cn KRX pARL1a(+)-[CS-roGFP2-Orp1] (-KX-) Cn KRX pARL1a(+)-[PM-roGFP2-Orp1] (-KX-) pARL1a(+)-STEVOR-[roGFP2-Orp1-SDEL] (-AX-)
Cn Cn
KRX KRX
pARL1a(+)-[ACP-HyPer-3] (-KX-) Cn KRX pARL1a(+)-[CS-HyPer-3] (-KX-) Cn KRX pARL1a(+)-[PM-HyPer-3] (-KX-) pARL1a(+)-STEVOR-[HyPer-3-SDEL] (-AX-)
Cn Cn
KRX KRX
pARL1a(+)-[ACP-SypHer] (-KX-) pARL1a(+)-[CS-SypHer] (-KX-) pARL1a(+)-[PM-SypHer] (-KX-) pARL1a(+)-STEVOR-[ SypHer-SDEL] (-AX-)
Cn Cn Cn Cn
KRX KRX KRX KRX
-KX-: restriction sites KpnI/XmaI, -AX- : restriction sites AvrII/XmaI
3.1.2.7 Preparation of plasmid DNA
3 ml LB medium containing Cn was inoculated with one colony from each transformation and grown overnight while constantly shaking at 37 °C. The cultures grown overnight were prepared as described in 3.1.1.8. Afterwards, the plasmids were restricted with the appropriate enzymes (AvrII and XmaI or KpnI and XmaI) for 1 h at 37 °C and then verified
Methods
44
using agarose gel electrophoresis (3.1.1.2). If the plasmids and inserts had the right sizes, the plasmids were sequenced in an in-house sequencing facility according to Sanger et al. (1977), and E. coli stock cultures were prepared (3.1.1.7). The Qiagen Plasmid Maxi Kit was used to generate a high concentration of the plasmids for the transfection of P. falciparum according to the manufacturer’s guidelines as described above in 3.1.1.8. 3.1.2.8 Verification of inserts
Due to the small sizes of the target sequences ACP and PM IV (180 bp and 210 bp, respectively), different methods were performed to distinguish between empty vectors and vectors with inserts. For ACP, PCR of the putative pARL1a(+)-[ACP-X] vector with the same conditions was conducted as described above (Tables 3.10 and 3.11). It was then possible via agarose gel electrophoresis to verify whether there was an amplified PCR product of an appropriate size. For PM IV, pARL1a(+)-[PM-X] with the restriction enzymes XhoI and XmaI was digested so that the restricted insert was bigger (approximately 1600 bp) and it was easier to see whether the PCR product was inserted into the vector. Plasmids with an insert of the appropriate size were sequenced.
3.1.3 Stable integration of the biosensors into the pDC2-CRT-X-attP and pDC2-CAM-X-attP vector
Cytosolic roGFP2-Orp1, HyPer-3, SypHer, hGrx1-roGFP2, and organelle-targeted ACP-roGFP2-Orp1, CS-roGFP2-Orp1, ACP-roGFP2-hGrx1 and CS-roGFP2-hGrx1 were cloned into the pDC2-CRT-X-BSD-attP (Figure 3.3) and pDC2-CAM-X-BSD-attP vector (Figure 3.4) for stable transfection into P. falciparum. The same vectors, just with different promoters, were used to check whether the CAM promoter, which is thought to be a strong promoter, has a stronger effect on the expression of the inserted constructs in comparison to the CRT promoter, a weak promoter. Moreover, cytosolic pHluorin probe was cloned into the pDC2-CAM-X-BSD-attP vector. The cytosolic glutathione redox sensor hGrx1-roGFP2 in the pARL1a(+) vector (Kasozi et al., 2013) and the targeted constructs ACP-roGFP2-hGrx1 and CS-roGFP2-hGrx1 in the pARL1a(+) vector (Mohring et al., 2017) under the CRT promoter were already present in the lab. The sensors were modified for cloning into the pDC2-CRT-X-BSD-attP and pDC2-CAM-X-BSD-attP vector. An overview of the plasmids obtained are given in Figures 3.3 and 3.4. The redox probes can be genetically integrated into P. falciparum NF54 via the attB/attP system of integrative recombination. The mycobacteriophage Bxb1 serine integrase mediates site-specific recombination between the phage attP site of the pDC2 expression plasmid and the attB site at the non-essential cg6 locus in Plasmodium NF54-attB parasites (Nkrumah et al., 2006; Adjalley et al., 2010). The pDC2-1600-CRT-[FA2a-roGFP1]-BSD-attP plasmid (AvrII/XhoI restriction sites) and pDC2-CAM-[hGrx1-roGFP2]-BSD-attP plasmid (AvrII/XhoI restriction sites) were used for cloning procedures, which were kindly provided by the laboratory of David Fidock, Columbia University, New York. Due to an XhoI restriction site within the hGrx1 gene of the hGrx1-roGFP2 glutathione redox sensor, Stanislav Gabryszewski from the lab of David Fidock mutated the XhoI restriction site in the hGrx1 gene via site-directed mutagenesis (SDM) before cloning it into the pDC2-CAM-X-BSD-attP plasmid. To enable the insertion of the cytosolic and organelle-targeted hGrx1-roGFP2 constructs into the pDC2-CRT-X-attP and pDC2-CAM-X-attP plasmids, Stanislav Gabryszewski also mutated the XhoI restriction sites of both plasmids via SDM to XmaI restriction sites.
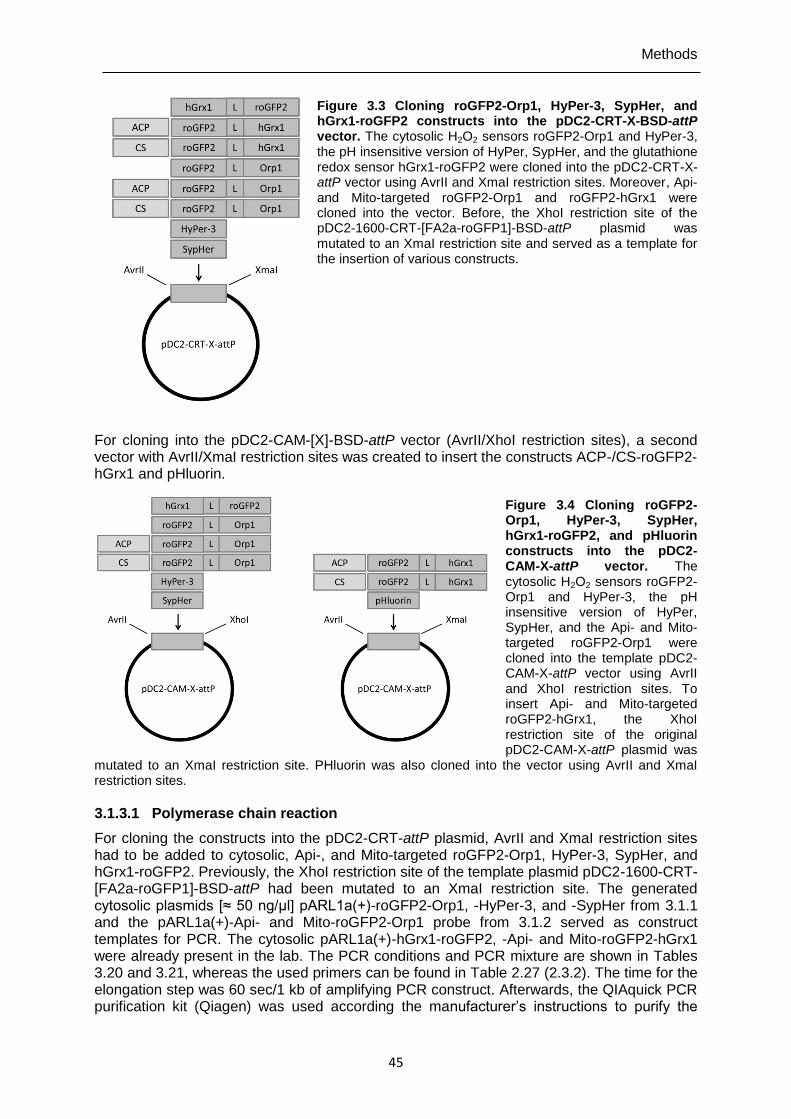
Methods
45
Figure 3.3 Cloning roGFP2-Orp1, HyPer-3, SypHer, and hGrx1-roGFP2 constructs into the pDC2-CRT-X-BSD-attP vector. The cytosolic H2O2 sensors roGFP2-Orp1 and HyPer-3, the pH insensitive version of HyPer, SypHer, and the glutathione redox sensor hGrx1-roGFP2 were cloned into the pDC2-CRT-X-attP vector using AvrII and XmaI restriction sites. Moreover, Api- and Mito-targeted roGFP2-Orp1 and roGFP2-hGrx1 were cloned into the vector. Before, the XhoI restriction site of the pDC2-1600-CRT-[FA2a-roGFP1]-BSD-attP plasmid was mutated to an XmaI restriction site and served as a template for the insertion of various constructs.
For cloning into the pDC2-CAM-[X]-BSD-attP vector (AvrII/XhoI restriction sites), a second vector with AvrII/XmaI restriction sites was created to insert the constructs ACP-/CS-roGFP2- hGrx1 and pHluorin.
Figure 3.4 Cloning roGFP2-Orp1, HyPer-3, SypHer, hGrx1-roGFP2, and pHluorin constructs into the pDC2-CAM-X-attP vector. The cytosolic H2O2 sensors roGFP2-Orp1 and HyPer-3, the pH insensitive version of HyPer, SypHer, and the Api- and Mito-targeted roGFP2-Orp1 were cloned into the template pDC2-CAM-X-attP vector using AvrII and XhoI restriction sites. To insert Api- and Mito-targeted roGFP2-hGrx1, the XhoI restriction site of the original pDC2-CAM-X-attP plasmid was
mutated to an XmaI restriction site. PHluorin was also cloned into the vector using AvrII and XmaI restriction sites.
3.1.3.1 Polymerase chain reaction
For cloning the constructs into the pDC2-CRT-attP plasmid, AvrII and XmaI restriction sites had to be added to cytosolic, Api-, and Mito-targeted roGFP2-Orp1, HyPer-3, SypHer, and hGrx1-roGFP2. Previously, the XhoI restriction site of the template plasmid pDC2-1600-CRT-[FA2a-roGFP1]-BSD-attP had been mutated to an XmaI restriction site. The generated cytosolic plasmids [≈ 50 ng/µl] pARL1a(+)-roGFP2-Orp1, -HyPer-3, and -SypHer from 3.1.1 and the pARL1a(+)-Api- and Mito-roGFP2-Orp1 probe from 3.1.2 served as construct templates for PCR. The cytosolic pARL1a(+)-hGrx1-roGFP2, -Api- and Mito-roGFP2-hGrx1 were already present in the lab. The PCR conditions and PCR mixture are shown in Tables 3.20 and 3.21, whereas the used primers can be found in Table 2.27 (2.3.2). The time for the elongation step was 60 sec/1 kb of amplifying PCR construct. Afterwards, the QIAquick PCR purification kit (Qiagen) was used according the manufacturer’s instructions to purify the
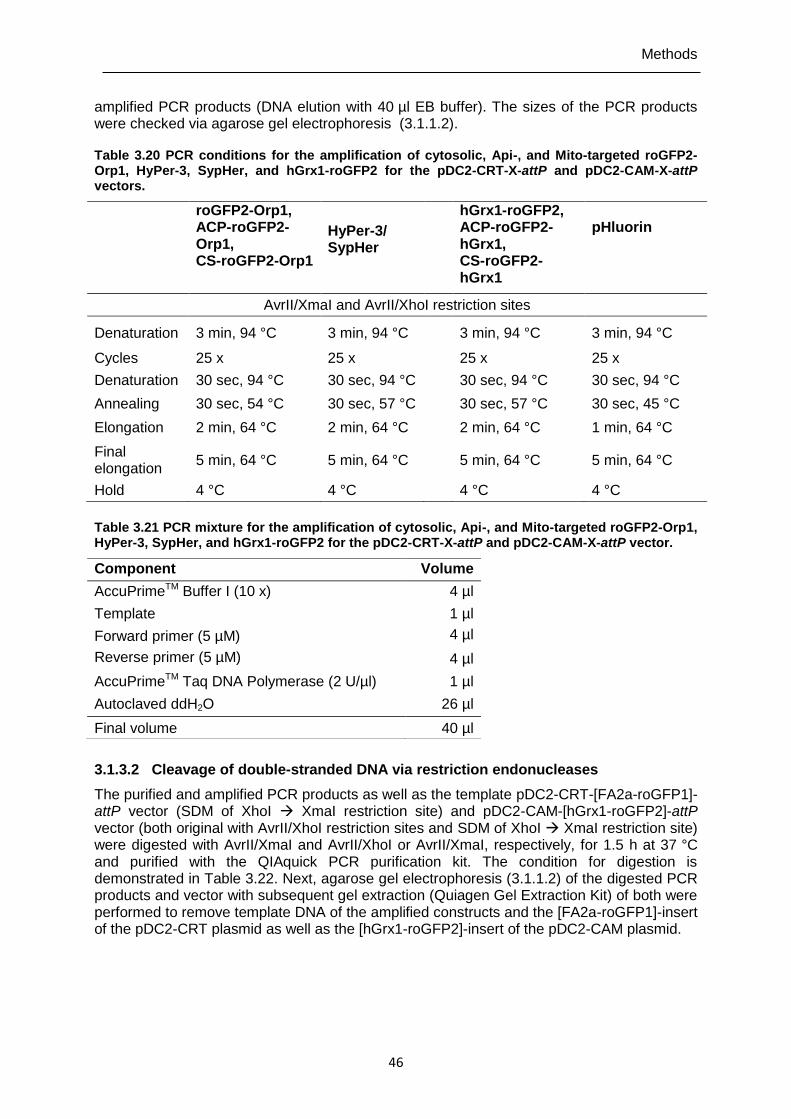
Methods
46
amplified PCR products (DNA elution with 40 µl EB buffer). The sizes of the PCR products were checked via agarose gel electrophoresis (3.1.1.2).
Table 3.20 PCR conditions for the amplification of cytosolic, Api-, and Mito-targeted roGFP2-Orp1, HyPer-3, SypHer, and hGrx1-roGFP2 for the pDC2-CRT-X-attP and pDC2-CAM-X-attP vectors.
roGFP2-Orp1, ACP-roGFP2-Orp1, CS-roGFP2-Orp1
HyPer-3/ SypHer
hGrx1-roGFP2, ACP-roGFP2-hGrx1, CS-roGFP2-hGrx1
pHluorin
AvrII/XmaI and AvrII/XhoI restriction sites
Denaturation 3 min, 94 °C 3 min, 94 °C 3 min, 94 °C 3 min, 94 °C
Cycles 25 x 25 x 25 x 25 x
Denaturation 30 sec, 94 °C 30 sec, 94 °C 30 sec, 94 °C 30 sec, 94 °C
Annealing 30 sec, 54 °C 30 sec, 57 °C 30 sec, 57 °C 30 sec, 45 °C
Elongation 2 min, 64 °C 2 min, 64 °C 2 min, 64 °C 1 min, 64 °C
Final elongation
5 min, 64 °C 5 min, 64 °C 5 min, 64 °C 5 min, 64 °C
Hold 4 °C 4 °C 4 °C 4 °C
Table 3.21 PCR mixture for the amplification of cytosolic, Api-, and Mito-targeted roGFP2-Orp1, HyPer-3, SypHer, and hGrx1-roGFP2 for the pDC2-CRT-X-attP and pDC2-CAM-X-attP vector.
3.1.3.2 Cleavage of double-stranded DNA via restriction endonucleases
The purified and amplified PCR products as well as the template pDC2-CRT-[FA2a-roGFP1]-attP vector (SDM of XhoI XmaI restriction site) and pDC2-CAM-[hGrx1-roGFP2]-attP vector (both original with AvrII/XhoI restriction sites and SDM of XhoI XmaI restriction site) were digested with AvrII/XmaI and AvrII/XhoI or AvrII/XmaI, respectively, for 1.5 h at 37 °C and purified with the QIAquick PCR purification kit. The condition for digestion is demonstrated in Table 3.22. Next, agarose gel electrophoresis (3.1.1.2) of the digested PCR products and vector with subsequent gel extraction (Quiagen Gel Extraction Kit) of both were performed to remove template DNA of the amplified constructs and the [FA2a-roGFP1]-insert of the pDC2-CRT plasmid as well as the [hGrx1-roGFP2]-insert of the pDC2-CAM plasmid.
Component Volume
AccuPrimeTM Buffer I (10 x) 4 µl
Template 1 µl
Forward primer (5 µM) 4 µl
Reverse primer (5 µM)
j
4 µl
AccuPrimeTM Taq DNA Polymerase (2 U/µl) 1 µl
Autoclaved ddH2O 26 µl
Final volume 40 µl
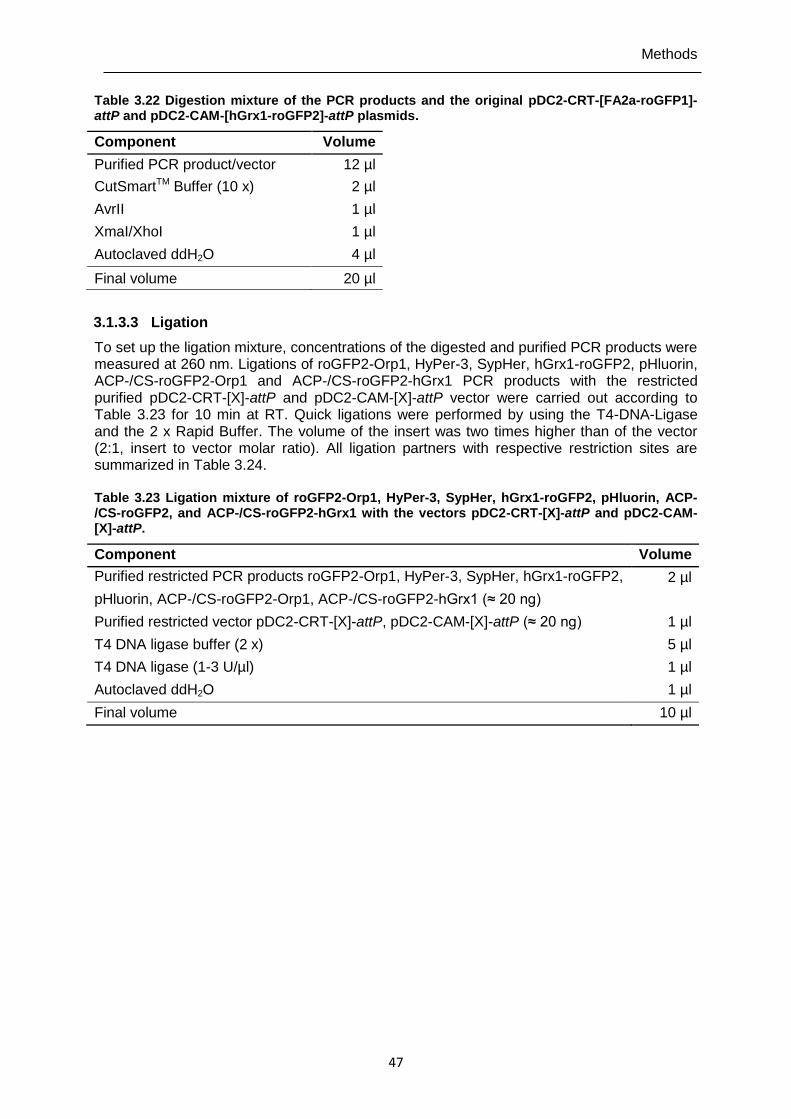
Methods
47
Table 3.22 Digestion mixture of the PCR products and the original pDC2-CRT-[FA2a-roGFP1]-attP and pDC2-CAM-[hGrx1-roGFP2]-attP plasmids.
Component Volume
Purified PCR product/vector 12 µl
CutSmartTM Buffer (10 x) 2 µl
AvrII 1 µl
XmaI/XhoI 1 µl
Autoclaved ddH2O 4 µl
Final volume 20 µl
3.1.3.3 Ligation
To set up the ligation mixture, concentrations of the digested and purified PCR products were measured at 260 nm. Ligations of roGFP2-Orp1, HyPer-3, SypHer, hGrx1-roGFP2, pHluorin, ACP-/CS-roGFP2-Orp1 and ACP-/CS-roGFP2-hGrx1 PCR products with the restricted purified pDC2-CRT-[X]-attP and pDC2-CAM-[X]-attP vector were carried out according to Table 3.23 for 10 min at RT. Quick ligations were performed by using the T4-DNA-Ligase and the 2 x Rapid Buffer. The volume of the insert was two times higher than of the vector (2:1, insert to vector molar ratio). All ligation partners with respective restriction sites are summarized in Table 3.24. Table 3.23 Ligation mixture of roGFP2-Orp1, HyPer-3, SypHer, hGrx1-roGFP2, pHluorin, ACP-/CS-roGFP2, and ACP-/CS-roGFP2-hGrx1 with the vectors pDC2-CRT-[X]-attP and pDC2-CAM-[X]-attP.
Component Volume
Purified restricted PCR products roGFP2-Orp1, HyPer-3, SypHer, hGrx1-roGFP2,
2 µl
pHluorin, ACP-/CS-roGFP2-Orp1, ACP-/CS-roGFP2-hGrx1 (≈ 20 ng)
Purified restricted vector pDC2-CRT-[X]-attP, pDC2-CAM-[X]-attP (≈ 20 ng) 1 µl
T4 DNA ligase buffer (2 x) 5 µl
T4 DNA ligase (1-3 U/µl) 1 µl
Autoclaved ddH2O 1 µl
Final volume 10 µl
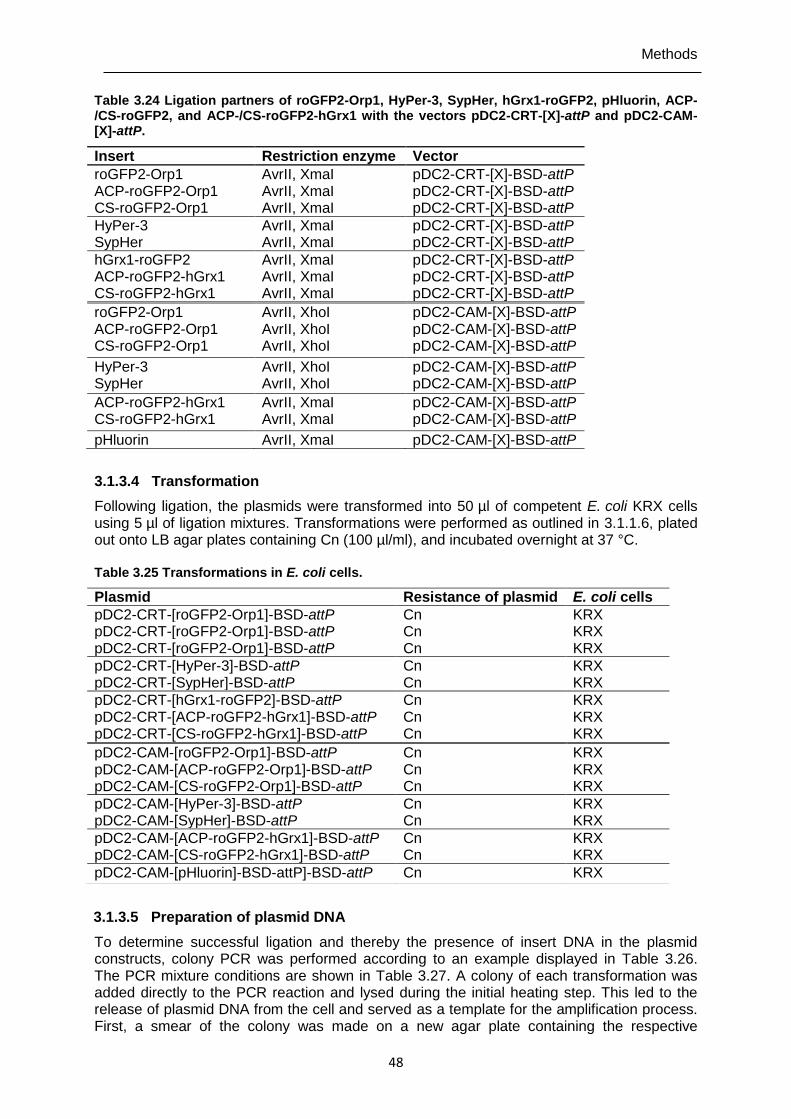
Methods
48
Table 3.24 Ligation partners of roGFP2-Orp1, HyPer-3, SypHer, hGrx1-roGFP2, pHluorin, ACP-/CS-roGFP2, and ACP-/CS-roGFP2-hGrx1 with the vectors pDC2-CRT-[X]-attP and pDC2-CAM-[X]-attP.
Insert Restriction enzyme Vector
roGFP2-Orp1 ACP-roGFP2-Orp1 CS-roGFP2-Orp1
AvrII, XmaI AvrII, XmaI AvrII, XmaI
pDC2-CRT-[X]-BSD-attP pDC2-CRT-[X]-BSD-attP pDC2-CRT-[X]-BSD-attP
HyPer-3 SypHer
AvrII, XmaI AvrII, XmaI
pDC2-CRT-[X]-BSD-attP pDC2-CRT-[X]-BSD-attP
hGrx1-roGFP2 ACP-roGFP2-hGrx1 CS-roGFP2-hGrx1
AvrII, XmaI AvrII, XmaI AvrII, XmaI
pDC2-CRT-[X]-BSD-attP pDC2-CRT-[X]-BSD-attP pDC2-CRT-[X]-BSD-attP
roGFP2-Orp1 ACP-roGFP2-Orp1 CS-roGFP2-Orp1
AvrII, XhoI AvrII, XhoI AvrII, XhoI
pDC2-CAM-[X]-BSD-attP pDC2-CAM-[X]-BSD-attP pDC2-CAM-[X]-BSD-attP
HyPer-3 SypHer
AvrII, XhoI AvrII, XhoI
pDC2-CAM-[X]-BSD-attP pDC2-CAM-[X]-BSD-attP
ACP-roGFP2-hGrx1 CS-roGFP2-hGrx1
AvrII, XmaI AvrII, XmaI
pDC2-CAM-[X]-BSD-attP pDC2-CAM-[X]-BSD-attP
pHluorin AvrII, XmaI pDC2-CAM-[X]-BSD-attP
3.1.3.4 Transformation
Following ligation, the plasmids were transformed into 50 µl of competent E. coli KRX cells using 5 µl of ligation mixtures. Transformations were performed as outlined in 3.1.1.6, plated out onto LB agar plates containing Cn (100 µl/ml), and incubated overnight at 37 °C. Table 3.25 Transformations in E. coli cells.
3.1.3.5 Preparation of plasmid DNA
To determine successful ligation and thereby the presence of insert DNA in the plasmid constructs, colony PCR was performed according to an example displayed in Table 3.26. The PCR mixture conditions are shown in Table 3.27. A colony of each transformation was added directly to the PCR reaction and lysed during the initial heating step. This led to the release of plasmid DNA from the cell and served as a template for the amplification process. First, a smear of the colony was made on a new agar plate containing the respective
Plasmid Resistance of plasmid E. coli cells
pDC2-CRT-[roGFP2-Orp1]-BSD-attP Cn KRX pDC2-CRT-[roGFP2-Orp1]-BSD-attP Cn KRX pDC2-CRT-[roGFP2-Orp1]-BSD-attP Cn KRX
pDC2-CRT-[HyPer-3]-BSD-attP pDC2-CRT-[SypHer]-BSD-attP
Cn Cn
KRX KRX
pDC2-CRT-[hGrx1-roGFP2]-BSD-attP pDC2-CRT-[ACP-roGFP2-hGrx1]-BSD-attP pDC2-CRT-[CS-roGFP2-hGrx1]-BSD-attP
Cn Cn Cn
KRX KRX KRX
pDC2-CAM-[roGFP2-Orp1]-BSD-attP pDC2-CAM-[ACP-roGFP2-Orp1]-BSD-attP pDC2-CAM-[CS-roGFP2-Orp1]-BSD-attP
Cn Cn Cn
KRX KRX KRX
pDC2-CAM-[HyPer-3]-BSD-attP pDC2-CAM-[SypHer]-BSD-attP
Cn Cn
KRX KRX
pDC2-CAM-[ACP-roGFP2-hGrx1]-BSD-attP pDC2-CAM-[CS-roGFP2-hGrx1]-BSD-attP
Cn Cn
KRX KRX
pDC2-CAM-[pHluorin]-BSD-attP]-BSD-attP Cn KRX
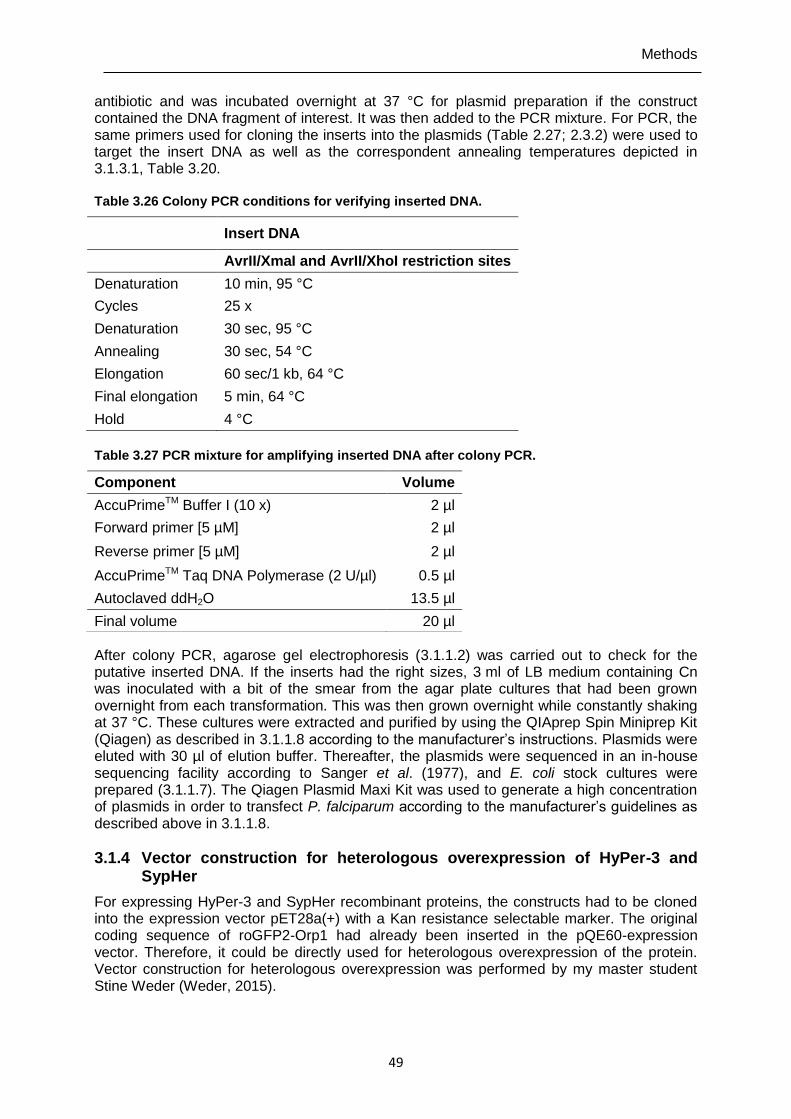
Methods
49
antibiotic and was incubated overnight at 37 °C for plasmid preparation if the construct contained the DNA fragment of interest. It was then added to the PCR mixture. For PCR, the same primers used for cloning the inserts into the plasmids (Table 2.27; 2.3.2) were used to target the insert DNA as well as the correspondent annealing temperatures depicted in 3.1.3.1, Table 3.20. Table 3.26 Colony PCR conditions for verifying inserted DNA.
Insert DNA
AvrII/XmaI and AvrII/XhoI restriction sites
Denaturation 10 min, 95 °C
Cycles 25 x
Denaturation 30 sec, 95 °C
Annealing 30 sec, 54 °C
Elongation 60 sec/1 kb, 64 °C
Final elongation 5 min, 64 °C
Hold 4 °C
Table 3.27 PCR mixture for amplifying inserted DNA after colony PCR.
After colony PCR, agarose gel electrophoresis (3.1.1.2) was carried out to check for the putative inserted DNA. If the inserts had the right sizes, 3 ml of LB medium containing Cn was inoculated with a bit of the smear from the agar plate cultures that had been grown overnight from each transformation. This was then grown overnight while constantly shaking at 37 °C. These cultures were extracted and purified by using the QIAprep Spin Miniprep Kit (Qiagen) as described in 3.1.1.8 according to the manufacturer’s instructions. Plasmids were eluted with 30 µl of elution buffer. Thereafter, the plasmids were sequenced in an in-house sequencing facility according to Sanger et al. (1977), and E. coli stock cultures were prepared (3.1.1.7). The Qiagen Plasmid Maxi Kit was used to generate a high concentration of plasmids in order to transfect P. falciparum according to the manufacturer’s guidelines as described above in 3.1.1.8.
3.1.4 Vector construction for heterologous overexpression of HyPer-3 and SypHer
For expressing HyPer-3 and SypHer recombinant proteins, the constructs had to be cloned into the expression vector pET28a(+) with a Kan resistance selectable marker. The original coding sequence of roGFP2-Orp1 had already been inserted in the pQE60-expression vector. Therefore, it could be directly used for heterologous overexpression of the protein. Vector construction for heterologous overexpression was performed by my master student Stine Weder (Weder, 2015).
Component Volume
AccuPrimeTM Buffer I (10 x) 2 µl
Forward primer [5 µM] 2 µl
Reverse primer [5 µM] 2 µl
AccuPrimeTM Taq DNA Polymerase (2 U/µl) 0.5 µl
Autoclaved ddH2O 13.5 µl
Final volume 20 µl
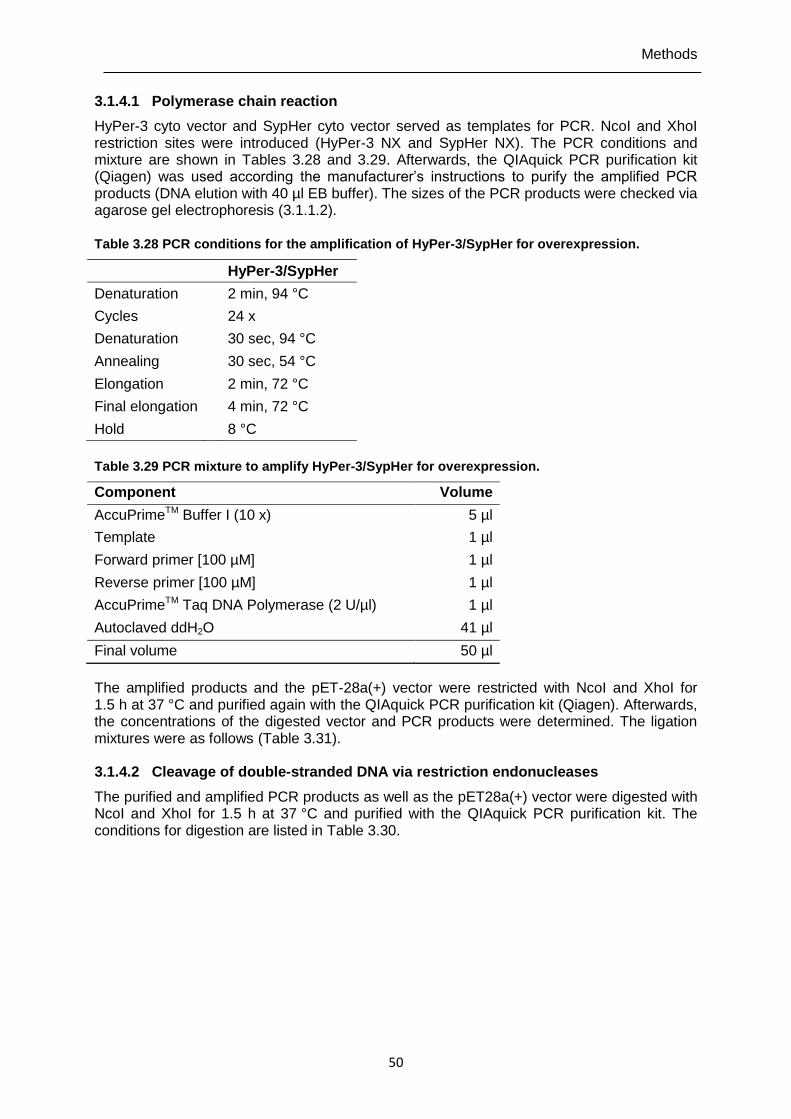
Methods
50
3.1.4.1 Polymerase chain reaction
HyPer-3 cyto vector and SypHer cyto vector served as templates for PCR. NcoI and XhoI restriction sites were introduced (HyPer-3 NX and SypHer NX). The PCR conditions and mixture are shown in Tables 3.28 and 3.29. Afterwards, the QIAquick PCR purification kit (Qiagen) was used according the manufacturer’s instructions to purify the amplified PCR products (DNA elution with 40 µl EB buffer). The sizes of the PCR products were checked via agarose gel electrophoresis (3.1.1.2). Table 3.28 PCR conditions for the amplification of HyPer-3/SypHer for overexpression.
HyPer-3/SypHer
Denaturation 2 min, 94 °C
Cycles 24 x
Denaturation 30 sec, 94 °C
Annealing 30 sec, 54 °C
Elongation 2 min, 72 °C
Final elongation 4 min, 72 °C
Hold 8 °C
Table 3.29 PCR mixture to amplify HyPer-3/SypHer for overexpression.
The amplified products and the pET-28a(+) vector were restricted with NcoI and XhoI for 1.5 h at 37 °C and purified again with the QIAquick PCR purification kit (Qiagen). Afterwards, the concentrations of the digested vector and PCR products were determined. The ligation mixtures were as follows (Table 3.31). 3.1.4.2 Cleavage of double-stranded DNA via restriction endonucleases
The purified and amplified PCR products as well as the pET28a(+) vector were digested with NcoI and XhoI for 1.5 h at 37 °C and purified with the QIAquick PCR purification kit. The conditions for digestion are listed in Table 3.30.
Component Volume
AccuPrimeTM Buffer I (10 x) 5 µl
Template 1 µl
Forward primer [100 µM] 1 µl
Reverse primer [100 µM] 1 µl
AccuPrimeTM Taq DNA Polymerase (2 U/µl) 1 µl
Autoclaved ddH2O 41 µl
Final volume 50 µl
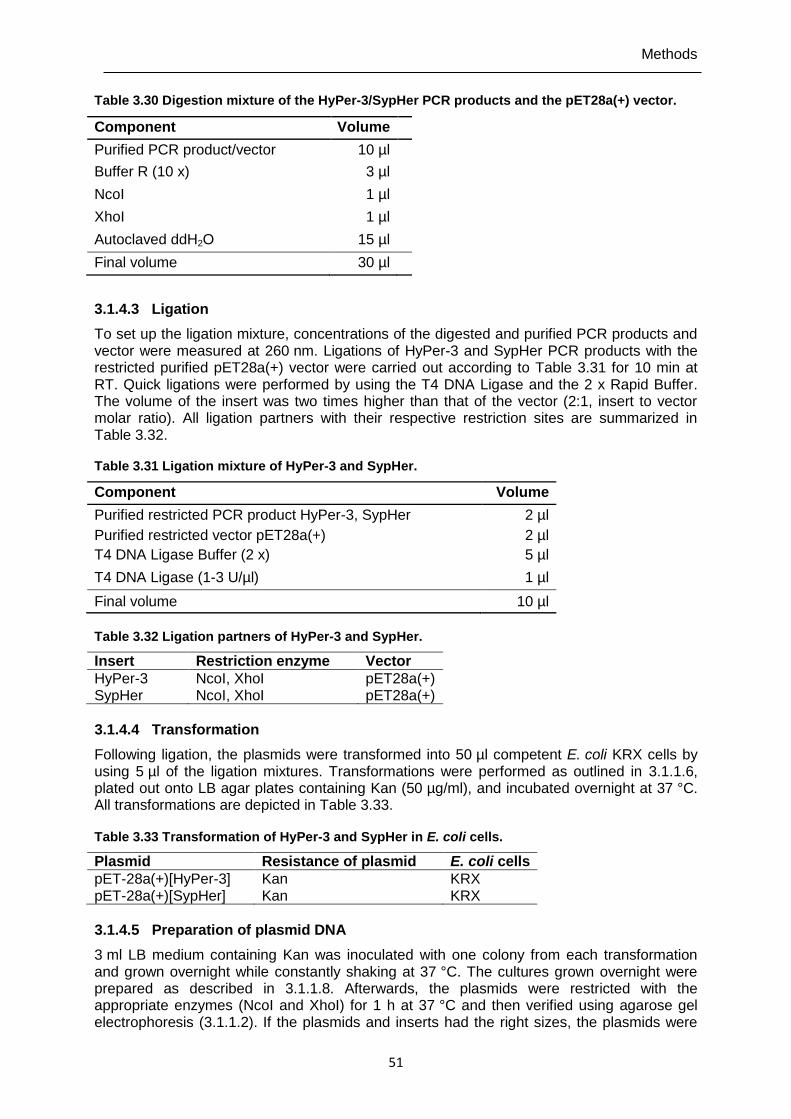
Methods
51
Table 3.30 Digestion mixture of the HyPer-3/SypHer PCR products and the pET28a(+) vector.
Component Volume
Purified PCR product/vector 10 µl
Buffer R (10 x) 3 µl
NcoI 1 µl
XhoI 1 µl
Autoclaved ddH2O 15 µl
Final volume 30 µl
3.1.4.3 Ligation
To set up the ligation mixture, concentrations of the digested and purified PCR products and vector were measured at 260 nm. Ligations of HyPer-3 and SypHer PCR products with the restricted purified pET28a(+) vector were carried out according to Table 3.31 for 10 min at RT. Quick ligations were performed by using the T4 DNA Ligase and the 2 x Rapid Buffer. The volume of the insert was two times higher than that of the vector (2:1, insert to vector molar ratio). All ligation partners with their respective restriction sites are summarized in Table 3.32. Table 3.31 Ligation mixture of HyPer-3 and SypHer.
Component Volume
Purified restricted PCR product HyPer-3, SypHer 2 µl
Purified restricted vector pET28a(+)
2 µl
T4 DNA Ligase Buffer (2 x) 5 µl
T4 DNA Ligase (1-3 U/µl) 1 µl
Final volume 10 µl
Table 3.32 Ligation partners of HyPer-3 and SypHer.
Insert Restriction enzyme Vector
HyPer-3 SypHer
NcoI, XhoI NcoI, XhoI
pET28a(+) pET28a(+)
3.1.4.4 Transformation
Following ligation, the plasmids were transformed into 50 µl competent E. coli KRX cells by using 5 µl of the ligation mixtures. Transformations were performed as outlined in 3.1.1.6, plated out onto LB agar plates containing Kan (50 µg/ml), and incubated overnight at 37 °C. All transformations are depicted in Table 3.33.
Table 3.33 Transformation of HyPer-3 and SypHer in E. coli cells.
Plasmid Resistance of plasmid E. coli cells
pET-28a(+)[HyPer-3] Kan KRX pET-28a(+)[SypHer] Kan KRX
3.1.4.5 Preparation of plasmid DNA
3 ml LB medium containing Kan was inoculated with one colony from each transformation and grown overnight while constantly shaking at 37 °C. The cultures grown overnight were prepared as described in 3.1.1.8. Afterwards, the plasmids were restricted with the appropriate enzymes (NcoI and XhoI) for 1 h at 37 °C and then verified using agarose gel electrophoresis (3.1.1.2). If the plasmids and inserts had the right sizes, the plasmids were
Methods
52
sequenced in an in-house sequencing facility according to Sanger et al. (1977), and E. coli stock cultures were prepared (3.1.1.7).
3.1.5 Production of recombinant roGFP2-Orp1, HyPer-3, and SypHer in E. coli cells
3.1.5.1 Heterologous overexpression of recombinant proteins in E. coli cells
To evaluate the in vitro interactions of drugs and redox-active compounds with the redox probes roGFP2-Orp1, HyPer-3, and SypHer, the recombinant proteins were expressed as follows. The E. coli M15[pREP4] strain (Qiagen) was transformed with roGFP2-Orp1 in the pQE60 plasmid, and E. coli KRX cells were transformed with either HyPer-3 or SypHer in pET28a(+) according to 3.1.1.6 and plated out onto agar plates containing Cn (pQE60 with CnR) and/or Kan (pREP4 and pET-28a(+) with KanR). Then, the inoculation of 3 ml LB medium (containing the relevant antibiotics) with a grown colony was carried out. After 6-7 h of incubation, this pre-culture was added to 50 ml of LB medium with antibiotics and grown overnight at 37 °C in a shaking incubator. The next day, 500 ml of LB medium containing antibiotics was inoculated with 10-15 ml of the overnight culture until an optical density at 600 nm (OD600) of 0.1 was reached. The culture was grown at 37 °C to an OD600 of 0.6, induced with either 1 mM IPTG (to express roGFP2-Orp1) or 0.1% rhamnose (to express HyPer-3 and SypHer), and incubated overnight at RT. The cells were harvested via centrifugation (8,000 rpm, 15 min, 4 °C) in a Sorvall centrifuge with an SLA 3000 rotor and resuspended (1 g pellet/4 ml buffer) in US buffer (50 mM sodium phosphate buffer, 300 mM NaCl, pH 8.0). Finally, the protease inhibitors pepstatin (0.5 µl/ml), cystatin (1 µl/ml), and PMSF (1 µl/ml) were added, and the resuspended pellets were stored at -20 °C until the recombinant proteins were purified. Heterologous overexpression and purification of the recombinant proteins were performed by my master student Stine Weder (Weder, 2015). 3.1.5.2 Purification of recombinant proteins
There are different methods of protein purification to isolate recombinant proteins from the cell mixture. Here, metal affinity chromatography using nickel-NTA agarose (Ni-NTA) was performed, which allows purification with a reversible interaction between the hexahistidyl tag (His-tag) and Ni-NTA. First, the pellet was lysed using lysozyme (16 mg/1 l LB medium), and DNaseI resuspended in US buffer was added. The suspension was stirred on ice for 30 min and sonicated three times for 30 sec. After centrifugation at 18,000 rpm for 30 min at 4 °C, the Ni-NTA column was loaded with the supernatant and washed with ten times the column volume with US buffer. The protein was eluted by using rising concentrations of imidazole (10 mM, 50 mM, 100 mM, 200 mM, and 500 mM). The eluted protein fractions were analyzed via SDS-PAGE (3.4.2). Pure protein containing fractions were pooled and concentrated using 30 kDa Vivaspin columns (Megafuge, 4,000 rpm, 4 °C). Finally, the protein concentration was measured as described in 3.4.1, and the recombinant protein was confirmed via western blot analysis (3.4.3) using an α-GFP/α-YFP antibody. The proteins were stored at -20 °C with 10% glycerol.
3.2 P. falciparum culture methods
3.2.1 P. falciparum maintenance
The strains of P. falciparum used were cultured according to Trager et al. (1976) with minor modifications. The strains were cultivated in RBCs (A+) in RPMI 1640 medium supplemented with 0.5% w/v Albumax, 9 mM glucose, 0.2 mM hypoxanthine, 2.1 mM L-glutamine, 25 mM HEPES, and 22 µg/ml gentamycin at 3.3% hematocrit (15 ml culture) and 37 °C in a gaseous mixture comprising 3% O2, 3% CO2, and 94% N2. Parasitemia was counted on Giemsa-stained blood smears. Under these conditions, each RBC multiplication cycle took 44 h for the 3D7 strain and 48 h for the NF54-attB strain and resulted in the production of 20-32 new merozoites, each capable of invading a new RBC.
Methods
53
3.2.2 Sorbitol synchronization
Sorbitol was used for synchronization of the parasites to the ring-stage. Sorbitol enters parasites with developed anion-selective channels that lead to osmotic lysis, while ring-stage parasites survive. 10 ml of Plasmodium culture was transferred to a 15 ml Falcon tube and centrifuged for 3 min at 2,100 rpm (Megafuge 1.0 R). The supernatant was discarded. 5 ml of a pre-warmed 5% (w/v) sorbitol solution (Lambros and Vanderberg, 1979) was added to the parasite pellet, mixed thoroughly, and incubated for 8 min at RT. The cells were centrifuged as described above, and the pellet was washed with 10 ml complete medium. The culture was transferred into a new culture plate and maintained as described above.
3.2.3 Purification and enrichment of trophozoite-stage parasites
Via magnet separation (Paul et al., 1981), trophozoites were isolated from non-infected RBCs and younger stages of P. falciparum. The QuadroMACS separation system was used, consisting of LC columns (containing magnetic beads) that were attached to Discofix® three-way stopcocks with hypodermic needles. The parasite culture was added to the columns, and unbound cells were washed with incomplete medium (medium without Albumax). Only hemozoin containing parasites (≈ 24 to 38 h trophozoites) bound to the columns. After removing the columns from the magnet, the bound trophozoites were eluted with complete medium and cultured as described above. The columns were washed subsequently with water and increasing concentrations of ethanol (70% and 100%) to prevent oxidation of the magnetic beads and let them dry overnight before using the columns again.
3.2.4 In vitro P. falciparum drug susceptibility assays
Parasite growth inhibition studies and half maximal effective concentration (EC50) calculation of antimalarial drugs or compounds against P. falciparum were performed using either the [3H]-hypoxanthine incorporation assay (Desjardins et al., 1979; Kasozi et al., 2013) or a SYBR Green I-based fluorescence assay for parasite nucleic acid according to Ekland et al. (2011) in 96-well format with modifications. For the [3H]-hypoxanthine assay, serial double dilutions (100 µl) of the compounds in hypoxanthine-free medium were carried out in 96-well microtiter plates. Synchronized ring-stage parasites in hypoxanthine-free complete medium (100 µl) were added to each well (0.15% parasitemia, 1.25% final hematocrit). Negative control wells contained only RBCs, while positive control wells contained iRBCs. The plate was incubated for 48 h under cell culture conditions. Afterwards, [3H]-hypoxanthine was added at a final concentration of 0.5 µCi/well, and the plate was further incubated for 24 h. The plates were frozen at -80°C for at least 1 h, thawed, and the cells were harvested on glass fiber filters. Finally, the radioactivity in counts per minute (cpm) from each well was measured after drying and was proportional to the growth of P. falciparum in comparison to RBCs and iRBCs. For SYBR Green-I assays, serial double dilutions (50 µl) of the compounds in complete medium were executed in 96-well half area microtiter plates (µClear bottom). Synchronized ring-stage parasites in complete medium (50 µl) were added to each well (0.15% parasitemia, 1.25% final hematocrit) and incubated for 48 h (NF54-attB) or 44 h (3D7) at 37 °C. Then, 20 μl of 5 x SYBR Green (10,000 x stock solution) in lysis buffer (20 mM Tris-HCl, 5 mM EDTA, 0.16% w/v saponin, and 1.6% v/v Triton X-100) were added to each well for 24 h at RT in the dark. Fluorescence was measured in the Clariostar plate reader at ex 494 nm/em 530 nm. Curve-fitting the percentage growth inhibition against log drug concentration with a variable slope sigmoidal function allowed the determination of EC50 values.
3.2.5 Preparation of parasite cell extracts with saponin
Parasites were cultured and synchronized as described above. For analysis, 10 ml of transfected P. falciparum 3D7 trophozoite-stage parasites (26-30 h) (6-8% parasitemia, 5% hematocrit) were used. The parasite culture was transferred to a Falcon® tube and centrifuged for 8 min at 2,300 rpm at RT. Pellets were resuspended with 20 volumes of saponin lysis buffer (0.02% saponin, 10 mM NaH2PO4, 10 mM Na2HPO4, 145 mM NaCl,
Methods
54
3 mM KCl, pH 7.2), incubated for 10 min at 37 °C with intermittent inverting, and centrifuged for 8 min at 2,700 rpm at RT. The supernatant was discarded, and the cells were first washed with 10 ml of saponin lysis buffer (incubation at 37 °C for 10 min with inverting) and then three times with PBS with decreasing temperature (RT, 15 °C, 4 °C). The cells were resuspended in 800 µl ice-cold PBS and centrifuged for 15 min at 3,500 rpm (4 °C). Pellets were kept at -80 °C. To prepare the parasite cell extracts, pellets were diluted in an equal volume of PBS, and complete protease inhibitor cocktail was added. Parasites were disrupted with four cycles of freezing in liquid nitrogen and thawing in a water bath at RT. After centrifugation at 50,000 rpm for 30 min at 4 °C in an ultracentrifuge, the resulting supernatant was used for western blots.
3.3 P. falciparum transfection methods
3.3.1 Transient transfection of P. falciparum
Trophozoite-stage parasites were transferred to fresh RBCs after magnet enrichment. Around 15-20 h later, 5 ml of culture (ring-stage 8-10 h, 5-8% parasitemia, 5% hematocrit) was centrifuged for 4 min at 2,100 rpm, and the supernatant was discarded. The parasite pellet (200 µL) was mixed with 150 µg of purified plasmid (Maxi prep Kit) in 400 µl cytomix and electroporated (310 V, 950 µF, capacitance ∞) in a 2 mm electroporation cuvette with the Bio-Rad Gene Pulser (Crabb et al., 2004). The resulting time constant was between 10 and 15 ms. The electroporated sample was returned to a petri dish containing 10 ml culture medium with 300 µl of RBCs, and the cuvette was washed with 2 ml of the supernatant of this culture medium. The medium was changed between 1-6 h after transfection, and culture medium was filled up to a final volume of 15 ml. To select for transfectants, 2 nM WR99210 was added to the culture of roGFP2-Orp1, HyPer-3, and SypHer 24 h post transfection. The culture medium of 3D7[roGFP2-Orp1] was changed every day for the first 5 days under constant drug pressure and after that every other day. For 3D7[HyPer-3] and 3D7[SypHer], 2 nM WR99210 was added constantly for 5 days and after that during every second medium change. The drug concentration was increased to 5 nM after the appearance of transfectants (usually after 3-4 weeks). After one week, 50 µl fresh RBCs were added to the parasites, and thereafter the culture was cut 1:2 every week until the parasites started to grow.
3.3.2 Stable transfection of P. falciparum
The redox and pH probes were genetically integrated into P. falciparum NF54-attB (a clone of the 3D7 strain, also CQ-sensitive) via the attB/attP system of integrative recombination. The mycobacteriophage Bxb1 serine integrase mediates site-specific recombination between the phage attP site and the attB site in Plasmodium. Trophozoite-stage parasites were transferred to fresh RBCs after magnet enrichment (5% hematocrit, 10 ml culture). Around 15 to 20 h later, 5 ml of culture (ring-stage 8-10 h, 5-8% parasitemia) was centrifuged at 1,500 rpm for 3 min and the supernatant was discarded. NF54-attB parasites were co-transfected with the attP plasmid (BSD, blasticidin s deaminase selection marker, confers resistance to blasticidin S) encoding the respective construct gene, e.g. roGFP2-Orp1, along with the integrase-encoding plasmid pINT (neo, neomycin selection marker, confers resistance to geneticin). Integrase-mediated attBxattP-based genomic recombination facilitates the insertion of DNA into the genomic attB locus. For each transfection, 50 µg of purified DNA with the target gene and 50 µg of purified pINT DNA were mixed and put on ice. The parasite pellet was resuspended with an equal volume of sterile cytomix and spun down at 1500 rpm, 3 min. Excess cytomix was discarded and the volume remaining was brought up with extra cytomix, so that the total volume with DNA would be ≈ 450 µl. The culture was resuspended and added to the sterile cup containing DNA (on ice). The parasites were transferred from the cup to an electroporation cuvette (2 mm) and electroporated (310 V, 950 µF, capacitance ∞) with the Bio-Rad Gene Pulser (Crabb et al., 2004). The time constant was between 10 and 15 ms. After electroporation the parasites were immediately resuspended with 1 ml complete medium and transferred to an already-prepared 15 ml conical containing 3.5 ml complete medium and RBCs (4% hematocrit). An additional 1 ml
Methods
55
complete medium was added to the cuvette to resuspend the parasites and was transferred again to the same conical. Furthermore, the 15 ml conical containing the transfected parasites was spun down at 1,500 rpm for 3 min, resuspended in new complete medium (5 ml) and plated out. The parasites were placed into the incubator for at least 1 h until the medium was removed and replaced with fresh complete medium. 24 h after transfection, the drugs blasticidin [2.5 µg/ml] and geneticin (G418) [125 µg/ml] were added to the cells to select for transfectants for six days. Culture medium was changed every day for the first six days and thereafter every other day. On day six post-transfection, 50 µl of fresh RBCs were added to the cells, and from day seven onwards only blasticidin was used for selection. Between days 10 and 13 the parasites were cut 1:2 and again cut 1:2 every week thereafter until parasites appeared. After 3-4 weeks the first transfectants appeared, and after determining the integration of the DNA of interest, the selection drug blasticidin was omitted for maintenance of the culture. Successful integration of the plasmid was confirmed via PCR (Tables 3.34 and 3.35) and agarose gel electrophoresis, and the fluorescence signal was checked via confocal laser scanning microscopy (CLSM). General primers for verifying stable integration that targeted the non-essential cg6-5´ locus (forward primer) in Plasmodium NF54-attB parasites and the bsd locus (reverse primer) of the attP plasmid were used and created a PCR product 1.6 kb (NF54-attB) in size (Table 2.7; 2.3.2). If PCR and fluorescence microscopy were positive for integration, cloning plates of the so-called bulk cultures were prepared in order to obtain a homogenous parasite culture expressing the respective construct according to 3.3.3. Table 3.34 Blood PCR for verifying genomically integrated constructs.
Construct
Denaturation 10 min, 95 °C
Cycles 35 x
Denaturation 30 sec, 95 °C
Annealing 45 sec, 54 °C
Elongation 60 sec/1 kb, 62 °C
Final elongation 6 min, 62 °C
Hold 4 °C
Table 3.35 PCR mixture for blood PCR.
An overview of the genomic integration method is depicted in Figure 3.5.
Component Volume
Kappa Blood PCR Mix B 10 µl
Blood culture 2 µl
Forward primer (5 µM) 1 µl
Reverse primer (5 µM) 1 µl
Autoclaved ddH2O 6 µl
Final volume 20 µl
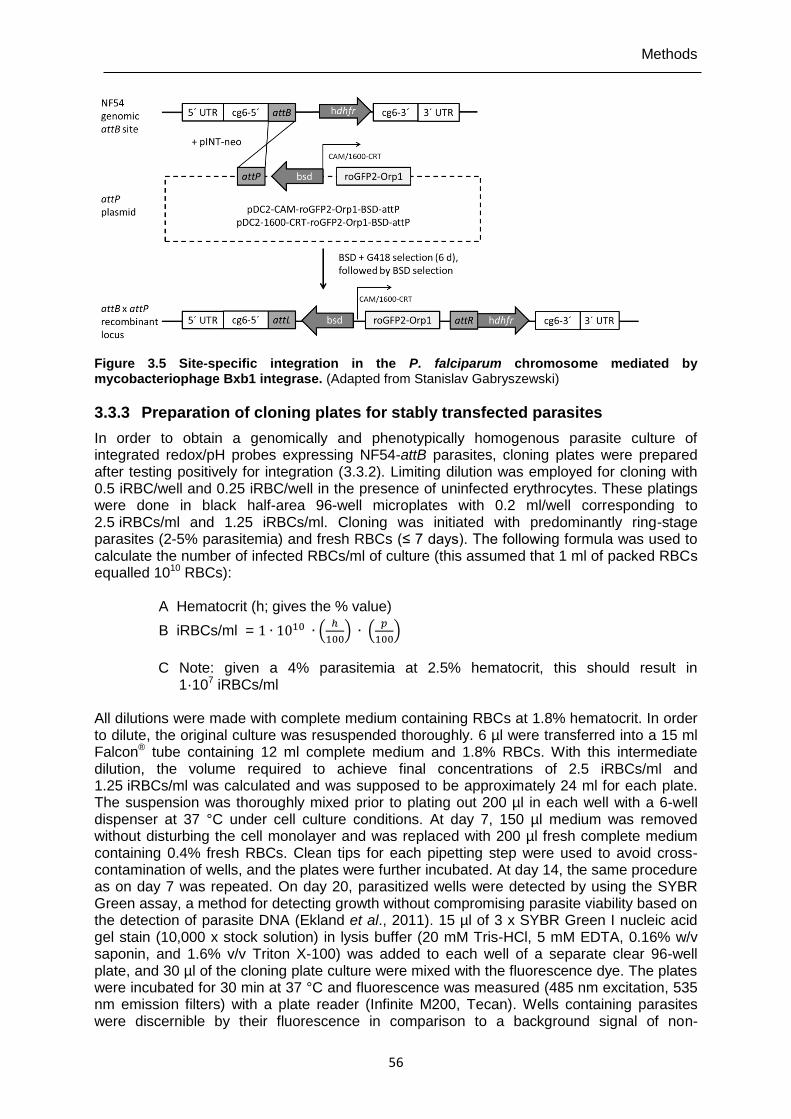
Methods
56
Figure 3.5 Site-specific integration in the P. falciparum chromosome mediated by mycobacteriophage Bxb1 integrase. (Adapted from Stanislav Gabryszewski)
3.3.3 Preparation of cloning plates for stably transfected parasites
In order to obtain a genomically and phenotypically homogenous parasite culture of integrated redox/pH probes expressing NF54-attB parasites, cloning plates were prepared after testing positively for integration (3.3.2). Limiting dilution was employed for cloning with 0.5 iRBC/well and 0.25 iRBC/well in the presence of uninfected erythrocytes. These platings were done in black half-area 96-well microplates with 0.2 ml/well corresponding to 2.5 iRBCs/ml and 1.25 iRBCs/ml. Cloning was initiated with predominantly ring-stage parasites (2-5% parasitemia) and fresh RBCs (≤ 7 days). The following formula was used to calculate the number of infected RBCs/ml of culture (this assumed that 1 ml of packed RBCs equalled 1010 RBCs):
A Hematocrit (h; gives the % value)
B iRBCs/ml = 1 ∙ 1010 ∙ (ℎ
100) ∙ (
𝑝
100)
C Note: given a 4% parasitemia at 2.5% hematocrit, this should result in 1·107 iRBCs/ml
All dilutions were made with complete medium containing RBCs at 1.8% hematocrit. In order to dilute, the original culture was resuspended thoroughly. 6 µl were transferred into a 15 ml Falcon® tube containing 12 ml complete medium and 1.8% RBCs. With this intermediate dilution, the volume required to achieve final concentrations of 2.5 iRBCs/ml and 1.25 iRBCs/ml was calculated and was supposed to be approximately 24 ml for each plate. The suspension was thoroughly mixed prior to plating out 200 µl in each well with a 6-well dispenser at 37 °C under cell culture conditions. At day 7, 150 µl medium was removed without disturbing the cell monolayer and was replaced with 200 µl fresh complete medium containing 0.4% fresh RBCs. Clean tips for each pipetting step were used to avoid cross-contamination of wells, and the plates were further incubated. At day 14, the same procedure as on day 7 was repeated. On day 20, parasitized wells were detected by using the SYBR Green assay, a method for detecting growth without compromising parasite viability based on the detection of parasite DNA (Ekland et al., 2011). 15 µl of 3 x SYBR Green I nucleic acid gel stain (10,000 x stock solution) in lysis buffer (20 mM Tris-HCl, 5 mM EDTA, 0.16% w/v saponin, and 1.6% v/v Triton X-100) was added to each well of a separate clear 96-well plate, and 30 µl of the cloning plate culture were mixed with the fluorescence dye. The plates were incubated for 30 min at 37 °C and fluorescence was measured (485 nm excitation, 535 nm emission filters) with a plate reader (Infinite M200, Tecan). Wells containing parasites were discernible by their fluorescence in comparison to a background signal of non-
Methods
57
parasitized wells. Fluorescence intensity is supposed to correlate with parasitemia; therefore, wells with high fluorescence signals were avoided as these appeared to result from initial inoculation of a multi-parasitized RBC. Subsequently, blood PCR was performed as described in Tables 3.34 and 3.35. Approximately eight positive clones from the 96-well cloning plates were picked for PCR, and genomic integration of the constructs was verified via agararose gel electrophoresis. At least four positive clones (as determined with blood PCR) were transferred into a 2 ml culture the same day at 4% hematocrit and were cultured as described above. The parasites were scaled up to 5 ml, and finally to 15 ml culture, in order to compare fluorescence signals of the different clones via CLSM. Experiments on clones with the best fluorescence signals were performed and selected clones were frozen down.
3.4 Biochemical methods
3.4.1 Protein quantification with the Bradford assay
The Bio-Rad Protein Assay Kit based on the Bradford dye-binding procedure (Bradford, 1976) was used for protein quantification. The red dye Coomassie Brilliant Blue G-250 binds to basic and aromatic amino acid residues of proteins, which changes its color to blue in response to protein concentration and can be colorimetrically measured at 595 nm. First, a standard curve was created by using bovine serum albumin (BSA) standard solutions (solved in ddH2O) with known concentrations from 0 to 20 µg/ml. To 500 µl of either these standards or the sample of interest, 125 µl of the dye was added and incubated for 15 min at RT. Absorption was then measured against a blank (500 µl ddH2O + 125 µl Bradford reagent) at 595 nm with a photometer according to Table 3.36. The standard curve was created by plotting the known concentrations of BSA against their absorbance. The concentration of the protein sample of interest was determined by interpolating the standard curve using its absorbance at 595 nm. Table 3.36 Pipetting scheme of the Bradford assay.
µl BSA [2 mg/ml] µl H2O
Concentration in cuvette [µg/ml]
µl of BSA/ sample dilution
µl H2O µl Bradford reagent
0 200 0 0 500 125 10 190 1 5 495 125 25 175 2.5 5 495 125 50 150 5 5 495 125 75 125 7.5 5 495 125 100 100 10 5 495 125 150 50 15 5 495 125 200 0 20 5 495 125 Sample - - 5 495 125
3.4.2 SDS-polyacrylamide gel electrophoresis
SDS-PAGE is a common technique to separate proteins according to their molecular weight. SDS-PAGE was performed according to Laemmli (1970). Protein samples were mixed with 1 x SDS sample buffer and heated up to 95 °C for 5 min in order to denature the proteins. The samples were loaded in pockets of a 12% SDS polyacrylamide gel and put into a Bio-Rad electrophoresis apparatus containing electrophoresis buffer. The samples were run at 200 V for 45 min in order to separate the proteins according to their molecular weight. Protein weight was confirmed by using an unstained protein marker. Afterwards, the gel was stained using the water-based Coomassie Blue staining system in order to make protein bands visible. Briefly, the gel was covered with water, heated for 40 sec in the microwave (700 mW), and incubated for 2 min at RT on a rocker. This step was repeated. Then, the gel was covered with staining solution, heated for 40 sec in the microwave, and incubated for
Methods
58
15 min at RT. The staining solution was discarded, and the gel was washed two times. The gel was covered again with water, heated for 40 sec in the microwave, and incubated 10 min at RT. For western blot analysis no gel was stained.
3.4.3 Western blot analysis
Western blot identifies proteins with labeled antibodies that bind specifically to the target protein. Semi-dry western blotting (Towbin et al., 1979) was used to confirm the production of the redox probes in living parasites, and cell lysates were obtained as described in 3.2.5. 18 µg of proteins from P. falciparum 3D7 and NF54-attB parasite lysates and 0.2 µg of recombinant proteins were separated onto 12% SDS gels as described in 3.4.2 without staining and were transferred to a polyvinylidene difluoreide (PVDF) membrane activated with methanol (Roth, Karlsruhe, Germany). Five filter papers and the SDS gel were soaked in cathode buffer, three filter papers in anode buffer I, and two filter papers along with the PVDF membrane in anode buffer II. After 5-15 min of incubation, the five filter papers (cathode buffer), the SDS gel, the PVDF membrane, and the two (anode buffer II) and three filter papers (anode buffer I) were put quickly onto a cathode graphite plate in their respective order without creating air bubbles. The proteins were blotted at 13 V for 30 min. Then, the membrane was stained with the Ponceau staining solution (30 sec) and washed with 1% acetic acid to check whether the transfer process was successful. After de-staining by repeated washing with TBST buffer, non-specific binding sites of the PVDF membrane were blocked by 5% non-fat milk in TBST (1 h at RT or overnight at 4 °C). The PVDF membrane was washed three times with TBST buffer for 5 min and incubated in TBST buffer containing the first antibody mouse α-GFP (1:1,000; Roche) for all used constructs for 1 h at RT on a rocker. After three washing steps with TBST buffer (5 min), the second antibody α-mouse (1:2,000; Dianova, Hamburg, Germany) was added, and the membrane was further incubated for 1 h at RT on a rocker. Additionally, a membrane was probed with α-YFP (1:1,000; Evrogen) for HyPer-3/SypHer identification following the secondary antibody α-rabbit (1:10,000; Dianova, Hamburg, Germany). Thereafter, the membrane was washed again three times for 5 min with TBST buffer and immunostained with the chemiluminescence mixture (see 2.2.2) for 1 min. Finally, the membrane was exposed to an X-ray film for 1 min under appropriate dark room conditions. The film was developed using an X-ray film exposure machine. No difference to the membranes probed with the α-GFP antibody could be detected in comparison to the α-YFP probed membrane. The α-YFP antibody could detect GFP proteins, and the α-GFP antibody could detect YFP proteins. All antibodies were diluted in 5% non-fat milk in TBST.
3.5 Biosensor methods
3.5.1 In vitro fluorescence measurements of recombinant proteins with a plate reader
In order to examine whether the antimalarial drugs used in cell culture interacted directly in vitro with the respective probes, fluorescence tests were carried out with the recombinant proteins roGFP2-Orp1, HyPer-3, SypHer, and hGrx1-roGFP2. For sfroGFP2, interaction studies had already been conducted in the Becker lab. The majority of compounds used for interaction studies with hGrx1-roGFP2 had already been examined in the Becker lab and presented in Kasozi et al., 2013 and Mohring et al., 2017. Stock solutions of CQ, MB, 2-DG, DIA, and DTT were dissolved in ddH2O, while ART, ATS, ATM, QN, MQ, AQ, LUM, Rot, ML304, compound 1o, compound S, CEA, and FEA were dissolved in DMSO. All drugs and compounds, DIA, DTT, and H2O2 were diluted with either a standard reaction buffer (100 mM potassium phosphate, 1 mM EDTA, pH 7.0) or a buffer with 50% v/v DMSO to a final concentration of 1 mM and equal concentrations of DMSO in every well and were used immediately. DIA (1 mM) and DTT (10 mM) served as controls in all experiments for identifying maximal oxidation and reduction, respectively. Before the experiments, the reaction buffer was degassed via ultrasound for 1 h at RT. Purified recombinant proteins were reduced with 20 mM DTT for 30 min at 4 °C, desalinated (ZebaTM Spin Desalting
Methods
59
Columns, Thermo Scientific), and diluted in reaction buffer to a final concentration of 5 µM for roGFP2-Orp1, HyPer-3, SypHer and 1.25 µM for hGrx1-roGFP2. Protein concentrations were determined according to 3.4.1. A 5-fold drug/redox-active compound dilution (10 µl) was mixed with 40 µl of respective recombinant protein concentration in a 96-well microplate (black, half-area, Greiner Bio-One, Frickenhausen). Prior to fluorescence measurements via plate reader, protein concentration and loading time was optimized. For pH measurements with recombinant SypHer and HyPer-3, pH values of the standard potassium buffer were varied by adding 2[N-morpholino]ethanesulfonic acid (MES) at 20 mM and potassium hydroxide (KOH) to 100 ml buffer in order to lower the pH value. To raise the pH value, tris(hydroxymethyl)aminomethane (Tris) at 20 mM and hydrochloric acid (HCl) were added to 100 ml buffer. The pH values (4.5-9.0) were set with a pH meter. The emission of roGFP2-Orp1 and hGrx1-roGFP2 (510 nm) after excitation at 390 nm and 480 nm and of HyPer-3 and SypHer (530 nm) after excitation at 420 nm and 500 nm were measured in a plate reader (Infinite M200, Tecan or Clariostar, BMG Labtech) with optimal read settings. Short-term time course measurements, 4 h and 24 h incubation experiments with compounds, and pH measurements were carried out at 25 °C. Between measurements, the samples were sealed with a plastic film and kept in the dark at RT. The ratios of the fluorescence signals at 390/480 nm were calculated for roGFP2-Orp1, and the ratios at 500/420 nm were calculated for HyPer-3 and SypHer and plotted against either time, concentration of antimalarial drugs/redox active compounds, H2O2, or pH values. For excitation spectrum scans, emission was measured at 510 nm for roGFP2-Orp1 and at 530 nm for HyPer-3 after excitation from 340 to 510 nm and 340 nm to 530 nm, respectively. Data from 2-3 independent experiments were analyzed. Means and standard errors of the means (SEM) were calculated with Microsoft Excel® (2010); for graphic design, linear regression calculation, and statistical purposes, GraphPad Prism 5.0 was used. The dynamic range of the probes was determined by dividing the fluorescence ratio caused by DIA by the fluorescence ratio caused by DTT. Fluorescence measurements of roGFP2-Orp1, HyPer-3, and SypHer with ART, ATM, ATS, CQ, QN, MQ, MB, FEA, CEA, H2O2, and pH were performed by my master student Stine Weder (Weder, 2015).
3.5.2 Live-cell imaging of P. falciparum via CLSM
P. falciparum-infected RBCs (trophozoite stage 26-30 h post invasion) were enriched via magnet separation as described in 3.2.3. Cells were kept for at least 1 h in standard culture conditions (37 °C, 3% O2, 3% CO2, 96% N2) to regenerate the basal redox status and were then washed with pre-warmed (37 °C) Ringer’s solution (122.5 mM NaCl, 5.4 mM KCl, 1.2 mM CaCl2, 0.8 mM MgCl2, 11 mM D-glucose, 25 mM HEPES, 1 mM NaH2PO4, pH 7.4). 50 µl of cells (1.0 x 10⁶ cells/50 µl) were seeded either onto poly-L-lysine-coated µ-Slides VI for time course experiments or onto poly-L-lysine-coated µ-Slides 18 Well (flat) (Ibidi, Martinsried, Germany) for endpoint measurements. A Leica confocal system TCS SP5 inverted microscope equipped with the objective HCX PL APO 63.0x1.30 GLYC 37 °C UV connected to a 37 °C temperature chamber was used. The argon laser power was set to 20%, and it scanned at a 400 Hz frequency with 512 x 512 pixel resolution. Smart gain and smart offset were 950 V and -0.9%, respectively. With a sequential scan, the probes were excited at 405 and 488 nm and emissions were detected at 500-550 nm. Laser intensity was adjusted to match the full dynamic range of the probes to the dynamic range of the detector (roGFP2-Orp1: 405 nm: 12%, 488 nm: 4%; HyPer-3/SypHer: 405 nm: 15%, 488 nm: 4%; hGrx1-roGFP2/sfroGFP2: 405 nm: 10%, 488 nm: 4%). For time series, images were acquired every 5 s over a time course of 3 min after 15 s of basal measurements. Autofluorescence images were simultaneously taken at ex 405 nm/em 430-450 nm and individually defined together with the background for every image, but no fluorescence signal could be detected. The Leica LAS AF Lite software for fluorescence analysis was used. The 405/488 nm or 488/405 nm ratios were calculated. The graphs were plotted using GraphPad Prism 5 software (San Diego, CA, USA). For image processing, Fiji software (Schindelin et al., 2012) was used. Only parasites showing fluorescent signals at both 405 and 488 nm excitation and an intact host cell were chosen. For endpoint analysis at least 10-15
Methods
60
microscopy images were taken. The laser settings were calibrated with 10 mM DTT for the fully reduced or 1 mM DIA for the fully oxidized state (each using 2 min incubations). Due to the fluctuations in the basal ratio of single parasites, the ratio values obtained for a time course were all normalized to the first basal ratio value, which was set to 100. For endpoint experiments, the ratio values were normalized to the control value, which was set to 100. All experiments included non-treated parasites as controls, and endpoint experiments both fully reduced (10 mM DTT) and fully oxidized (1 mM DIA) parasites (each using 2 min incubations prior to measurements). To measure potential effects of the lasers on the redox state of the cells, trophozoites were monitored over 3 min without treatment under the same experimental conditions and served as a control. In order to investigate the short-term effects of compounds on the probes, 50 µl of cells (1.0 x 10⁶ trophozoites) were exposed to the respective compound, and the fluorescence signals were monitored over a time course of 3 min. All experiments with P. falciparum 3D7 parasites (transient transfection) were carried out within six to eight weeks after the appearance of transfectants. Each incubation time and drug concentration treatment was carried out three times. For each time course, at least three parasites were assessed, resulting in at least nine experimental values per data point. Endpoint experiments comprise at least 10 parasites, resulting in at least 30 experimental values per incubation. A one-way ANOVA test with 95% confidence intervals with the Dunnett’s multiple comparison test (GraphPad Prism 5.0) was applied for statistical analysis of significance (*, p < 0.05; **, p < 0.01; ***, p < 0.001).
3.5.3 Live-cell imaging of P. falciparum with a fluorescence plate reader
For 4 h and 24 h experiments, NF54-attB parasites stably expressing the respective probes were washed and resuspended after incubation in pre-warmed Ringer’s solution to a concentration of 2.0 x 10⁵ iRBCs/µl. 10 µl of cells (1 x 10⁶ iRBCs) were transferred to each well of a 384-well plate (black, flat bottom, Greiner Bio-One, Frickenhausen) and were measured with the plate reader Clariostar (BMG labtech) with excitation wavelengths at 405 nm and 475 nm (emission 510 nm). In order to investigate the short-term effects of DIA and DTT, 10 µl of cells (1.0 x 10⁶ trophozoites) were exposed to 1 mM of DIA for 2 min to fully oxidize the redox probes and subsequently to 10 mM of DTT for 2 min to fully reduce the probes. For endpoint measurements, 10 µl of cells (1.0 x 10⁶ trophozoites) were transferred to the 384-well plate. The gain of the 405 nm and 475 nm excitation wavelengths was adjusted to match the full dynamic range of the redox probes. The 405/475 nm ratio was then calculated. The graphs were plotted using the GraphPad Prism 5 software (San Diego, CA, USA). A one-way ANOVA test with 95% confidence intervals with the Dunnett’s multiple comparison test (GraphPad Prism 5.0) was applied for statistical analysis of significance (*, p < 0.05; **, p < 0.01; ***, p < 0.001).
3.5.4 Localization studies using fluorescence methods
The localization of fluorescence sensor signals in P. falciparum subcellular compartments was confirmed by employing immunofluorescence assays (IFAs) according to Tonkin et al. (2008) and optimized by Jude Przyborski, Marburg University. 4 ml of cell culture was transferred to a 15 ml Falcon® tube and centrifuged for 3 min at 2,100 rpm to harvest 200 µl of packed cells. The supernatant was discarded; the pellet was resuspended in 1 ml fixation buffer to crosslink protein components and was incubated for 30 min at 37 °C with shaking (300 rpm, light exposure). The cells were again centrifuged as described above and were resuspended in 1 ml permeabilization/quench buffer to allow antibodies to cross membranes and to block free reactive aldehyde groups. After 15 min of incubation at RT (shaking at 300 rpm), cells were centrifuged and resuspended in 1 ml blocking buffer to block non-specific interactions. After 1 h of incubation (shaking at 300 rpm) the cells were centrifuged for 3 min at 2,100 rpm. The first antibody (α-rabbit PfACP, α-rabbit CDC48, α-rabbit PfCRT or α-rabbit PfERC) was diluted 1:500 in blocking buffer and incubated overnight at 4 °C. The roGFP2/YFP signal was enhanced by using a GFP antibody (α-chicken) 1:200 in blocking buffer. Unbound antibodies were removed by washing three times in PBS for 15 min at RT. The second antibody (Cy3 α-rabbit, Cy2 α-chicken) was diluted 1:2,000 in blocking buffer
Methods
61
and incubated for 1 h at RT. The cells were washed three times including Hoechst 33258 1:50,000 in the final wash step. To fixate the parasites, 1% paraformaldehyde was used for 10 min at RT. The samples were kept at 4 °C under rotation until analysis. For the mitochondrial localization study, the parasites were incubated with MitoTracker Orange 1:100,000 for 10-15 min in RPMI and then washed once with RPMI. Images were taken in the lab of Jude Przyborski, Marburg University, with a Zeiss Epi-fluorescence microscope.
3.6 Determining H2O2, drug and pH susceptibility of roGFP2-Orp1, HyPer-3 and SypHer in P. falciparum via CLSM
3.6.1 H2O2 susceptibility of roGFP2-Orp1 and HyPer-3 expressing Pf3D7 parasites with intact and saponin-lysed RBCs
H2O2 concentrations of 20 µM, 50 µM, 100 µM, 200 µM, 500 µM, and 1 mM were added to 3D7[roGFP2-Orp1]- and 3D7[HyPer-3]-transfected parasites in short-term (3 min) time course experiments. In the experiment with intact iRBCs, trophozoite-stage parasites (26-30 h) were magnetically enriched (Miltenyi Biotec, Germany), counted by using an improved Neubauer hemocytometer (Brand GmbH, Germany), and returned to cell culture for at least 1 h to recover. The cells were washed once with pre-warmed Ringer’s solution and were resuspended in Ringer’s solution with a final parasite concentration of 2.0 x 10⁴ trophozoites/µl. For every H2O2 concentration, three parasites from three independent experiments were analyzed per data point. For experiments with lysed erythrocytes, saponin lysis was applied. Briefly, trophozoite-stage parasites (26-30 h) were centrifuged in a 15 ml Falcon® tube (5 min, 2,100 rpm, RT). 10 ml of pre-warmed saponin lysis buffer was added to the cells and incubated for 10 min in a water bath (37 °C), inverting the tube now and then. The parasites were again centrifuged (5 min, 2,100 rpm, RT), resuspended with 5 ml saponin lysis buffer, and incubated for 5 min at RT. After another centrifugation step as described above, the cells were washed once with pre-warmed Ringer’s solution and resuspended in Ringer’s solution with a final parasite concentration of 2.0 x 10⁴ trophozoites/µl. The cells were returned to the incubator for 10-15 min to regenerate basal redox state, and experiments were performed within 2 h after the end of saponin lysis. All experiments included non-treated, fully reduced, and fully oxidized parasites as controls and were carried out within six to eight weeks after the appearance of transfectants. For dynamic range time courses with DIA and DTT, data from three independent experiments of at least three parasites each were analyzed per data point. Means and standard errors of the means (SEM) are shown. A one-way ANOVA test with 95% confidence intervals with the Dunnett’s multiple comparison test (GraphPad Prism 5.0) was applied for statistical analysis of significance (*, p < 0.05; **, p < 0.01; ***, p < 0.001).
3.6.2 Drug susceptibility of redox probes
The EC50 of antimalarial drugs or compounds on P. falciparum 3D7 asexual blood stages was determined either with the [3H]-incorporation assay (Kasozi et al., 2010) or the SYBR Green I fluorescence assay according to 3.2.4. For short-term and 4 h experiments, trophozoite-stage parasites (26-30 h) of 3D7[roGFP2-Orp1] (6-8% parasitemia) were magnetically enriched (Miltenyi Biotec, Germany), counted using the improved Neubauer hemocytometer (Brand GmbH, Germany), and returned to cell culture (at 2.0 x 10⁴ trophozoites/µl) for at least 1 h to recover. 1.0 x 10⁶ cells in 100 µl cell culture medium were placed into LoBind tubes (Eppendorf) for 4 h incubation experiments. The parasites were treated with antimalarial drugs at 1 x, 25 x, 50 x, and 100 x EC50 and with the redox-active compounds DIA (1 mM) and H2O2 (1 mM) for 4 h under cell culture conditions. Subsequently, free thiol groups were blocked with 2 mM N-ethylmaleimide (NEM) for 15 min at 37 °C. For 24 h experiments, a 5 ml culture (5% hematocrit, 6-8% parasitemia) of ring-stage parasites (6-10 h post invasion) was treated with antimalarial drugs at 4 x EC50, DIA (100 µM) and H2O2 (100 µM). Prior to magnetic enrichment, cysteines were blocked with 2 mM NEM. For short-term, 4 h, and 24 h experiments, cells were washed after incubation, resuspended in Ringer’s solution, and measured in the Leica confocal system TCS SP5 with excitation
Methods
62
wavelengths at 405 nm and 488 nm. In order to investigate the short-term effects of antimalarial drugs and DIA on 3D7[roGFP2-Orp1]-infected parasites, 50 µl of cells (1.0 x 10⁶ trophozoites) were challenged with 100 µM of each drug or 1 mM of DIA, and the fluorescence signals were monitored over a time course of 3 min. All experiments included non-treated parasites as controls as well as both fully reduced and fully oxidized parasites. Each incubation time and drug concentration treatment was carried out three times. At least nine microscopy images were taken. All experiments were carried out within six weeks after the appearance of transfectants.
3.6.3 Determining pH susceptibility of SypHer, HyPer-3, and pHluorin in P. falciparum
For cytosolic pH measurements, Pf3D7 parasites expressing SypHer, HyPer-3, and pHluorin were used. Single-cell pH measurements of P. falciparum cytosol were carried out according to Kuhn et al. (2007). An in-cell fluorescence calibration curve was generated by using sodium-free high potassium buffer (calibration buffer) (160 mM KCl, 1.2 mM CaCl2, 0.8 mM MgCl2, 11 mM D-glucose, 25 mM HEPES) of varying pH (4.5-9.0). 200 ml of buffer was prepared and 100 ml was acidified or alkalized by adding 4-morpholineethanesulfonic acid (MES) or 2-amino-2-hydroxymethyl-propane-1,3-diol (TRIS base). The buffers were merged to yield pH calibration buffers ranging from pH 4.5 to 9. After magnet enrichment of trophozoites, cells were kept under standard culture conditions for at least 1 h. The parasites were washed in Ringer’s solution and centrifuged for 4 min at 3,000 rpm in 1.5 ml LoBind tubes. The cell pellets were resuspended in 100 µl of the different potassium-rich calibration buffers (1.0 x 10⁶ cells), including one with Ringer’s solution serving as the control. A stock solution of 1 mM nigericin in 100% ethanol was prepared and stored at -20 °C. Nigericin is an ionophore and leads to rapid equilibration of external and internal pH through an exchange of internal K+ for external H+ (Thomas et al., 1979). The cells were incubated with 1 µl nigericin (cytosol: final concentration of 4 µM, compartments: final concentration of 10 µM) for 20 min at RT, and 488/405 nm ratios for SypHer/HyPer-3 and 405/488 nm ratios for pHluorin were subsequently measured via CLSM. The ratios were plotted against pH by using GraphPad Prism 5. A trend line was created via exponential (SypHer, HyPer-3) and linear regression (pHluorin), and the pH for the respective 488/405 nm or 405/488 nm ratio of the non-nigericin-treated cells was calculated.
3.6.4 Determining H2O2 susceptibility of P. falciparum 3D7 transfected with roGFP2-Orp1 after priming with stress factors
To determine whether a pre-incubation with antimalarial drugs and heat shock would increase the H2O2 susceptibility of P. falciparum, priming experiments were performed for 4 h. Trophozoite stages (26-30 h) of 3D7[roGFP2-Orp1]-transfected parasites (6-8% parasitemia) were magnetically enriched (Miltenyi Biotec, Germany), counted using the improved Neubauer hemocytometer (Brand GmbH, Germany), and returned to cell culture (at 2.0 x 10⁴ trophozoites/µl) for at least 1 h to recover. 1.0 x 10⁶ cells in 100 µl cell culture medium were placed into LoBind tubes (Eppendorf) and were treated in four separate experiments with either 50 x EC50 of ART, CQ, and QN or as an additional stress factor with heat shock at 42 °C for 4 h. After incubation, 50 µl of cells (5.0 x 10⁵ trophozoites) were exposed to varying H2O2 concentrations of 20 µM, 50 µM, 100 µM, 200 µM, 500 µM, and 1 mM, and the fluorescence signals were monitored over a time course of 3 min. All experiments included pre-incubated, non-H2O2-treated parasites as controls. Each experiment and H2O2 concentration treatment was carried out three times.
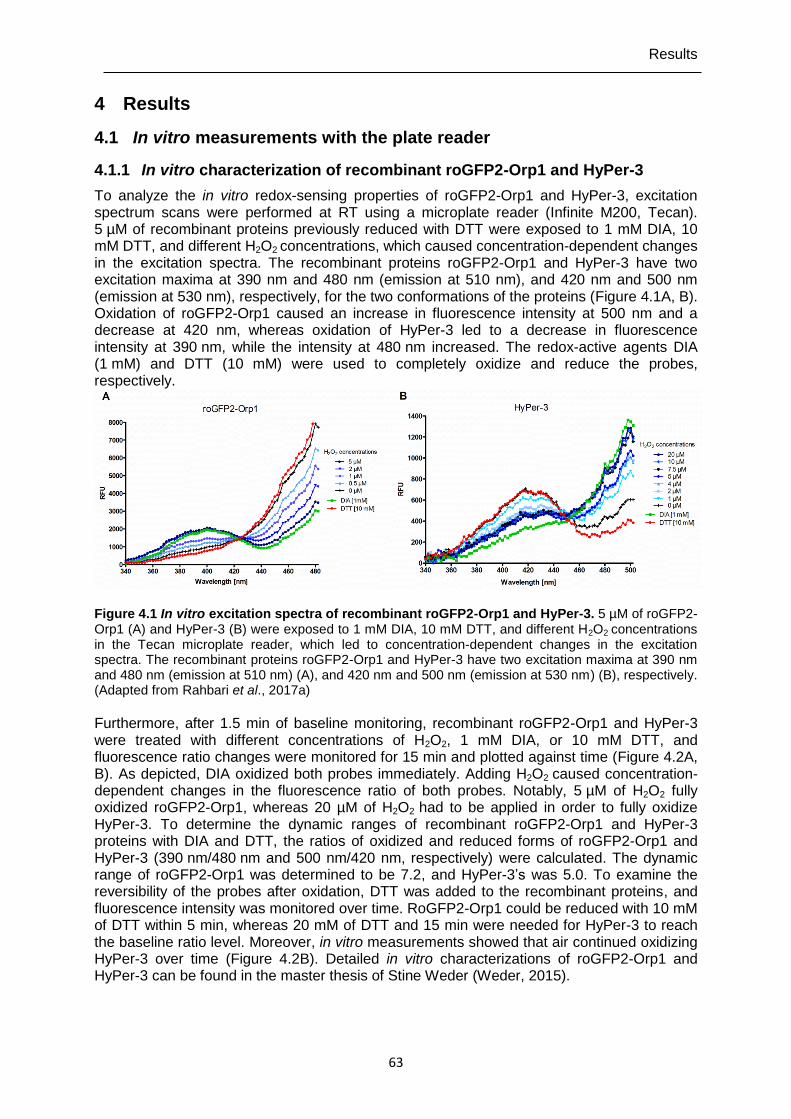
Results
63
4 Results
4.1 In vitro measurements with the plate reader
4.1.1 In vitro characterization of recombinant roGFP2-Orp1 and HyPer-3
To analyze the in vitro redox-sensing properties of roGFP2-Orp1 and HyPer-3, excitation spectrum scans were performed at RT using a microplate reader (Infinite M200, Tecan). 5 µM of recombinant proteins previously reduced with DTT were exposed to 1 mM DIA, 10 mM DTT, and different H2O2 concentrations, which caused concentration-dependent changes in the excitation spectra. The recombinant proteins roGFP2-Orp1 and HyPer-3 have two excitation maxima at 390 nm and 480 nm (emission at 510 nm), and 420 nm and 500 nm (emission at 530 nm), respectively, for the two conformations of the proteins (Figure 4.1A, B). Oxidation of roGFP2-Orp1 caused an increase in fluorescence intensity at 500 nm and a decrease at 420 nm, whereas oxidation of HyPer-3 led to a decrease in fluorescence intensity at 390 nm, while the intensity at 480 nm increased. The redox-active agents DIA (1 mM) and DTT (10 mM) were used to completely oxidize and reduce the probes, respectively.
Figure 4.1 In vitro excitation spectra of recombinant roGFP2-Orp1 and HyPer-3. 5 µM of roGFP2-Orp1 (A) and HyPer-3 (B) were exposed to 1 mM DIA, 10 mM DTT, and different H2O2 concentrations in the Tecan microplate reader, which led to concentration-dependent changes in the excitation spectra. The recombinant proteins roGFP2-Orp1 and HyPer-3 have two excitation maxima at 390 nm and 480 nm (emission at 510 nm) (A), and 420 nm and 500 nm (emission at 530 nm) (B), respectively. (Adapted from Rahbari et al., 2017a)
Furthermore, after 1.5 min of baseline monitoring, recombinant roGFP2-Orp1 and HyPer-3 were treated with different concentrations of H2O2, 1 mM DIA, or 10 mM DTT, and fluorescence ratio changes were monitored for 15 min and plotted against time (Figure 4.2A, B). As depicted, DIA oxidized both probes immediately. Adding H2O2 caused concentration-dependent changes in the fluorescence ratio of both probes. Notably, 5 µM of H2O2 fully oxidized roGFP2-Orp1, whereas 20 µM of H2O2 had to be applied in order to fully oxidize HyPer-3. To determine the dynamic ranges of recombinant roGFP2-Orp1 and HyPer-3 proteins with DIA and DTT, the ratios of oxidized and reduced forms of roGFP2-Orp1 and HyPer-3 (390 nm/480 nm and 500 nm/420 nm, respectively) were calculated. The dynamic range of roGFP2-Orp1 was determined to be 7.2, and HyPer-3’s was 5.0. To examine the reversibility of the probes after oxidation, DTT was added to the recombinant proteins, and fluorescence intensity was monitored over time. RoGFP2-Orp1 could be reduced with 10 mM of DTT within 5 min, whereas 20 mM of DTT and 15 min were needed for HyPer-3 to reach the baseline ratio level. Moreover, in vitro measurements showed that air continued oxidizing HyPer-3 over time (Figure 4.2B). Detailed in vitro characterizations of roGFP2-Orp1 and HyPer-3 can be found in the master thesis of Stine Weder (Weder, 2015).
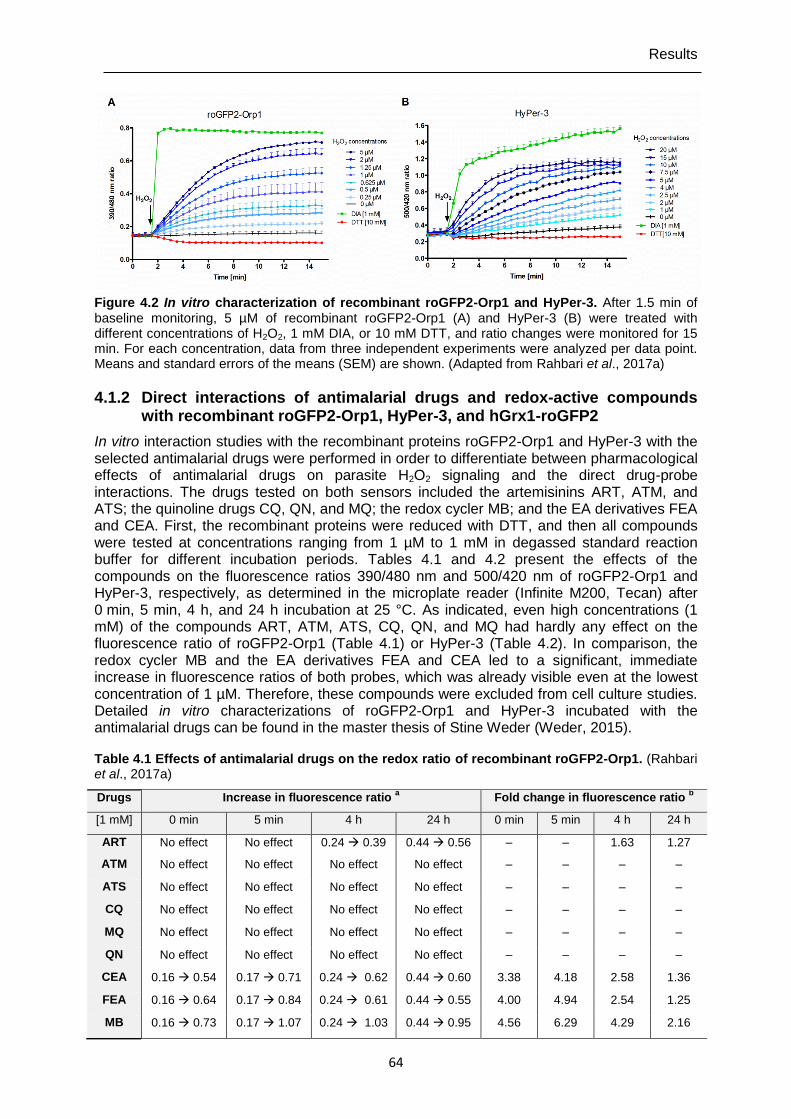
Results
64
Figure 4.2 In vitro characterization of recombinant roGFP2-Orp1 and HyPer-3. After 1.5 min of baseline monitoring, 5 µM of recombinant roGFP2-Orp1 (A) and HyPer-3 (B) were treated with different concentrations of H2O2, 1 mM DIA, or 10 mM DTT, and ratio changes were monitored for 15 min. For each concentration, data from three independent experiments were analyzed per data point. Means and standard errors of the means (SEM) are shown. (Adapted from Rahbari et al., 2017a)
4.1.2 Direct interactions of antimalarial drugs and redox-active compounds with recombinant roGFP2-Orp1, HyPer-3, and hGrx1-roGFP2
In vitro interaction studies with the recombinant proteins roGFP2-Orp1 and HyPer-3 with the selected antimalarial drugs were performed in order to differentiate between pharmacological effects of antimalarial drugs on parasite H2O2 signaling and the direct drug-probe interactions. The drugs tested on both sensors included the artemisinins ART, ATM, and ATS; the quinoline drugs CQ, QN, and MQ; the redox cycler MB; and the EA derivatives FEA and CEA. First, the recombinant proteins were reduced with DTT, and then all compounds were tested at concentrations ranging from 1 µM to 1 mM in degassed standard reaction buffer for different incubation periods. Tables 4.1 and 4.2 present the effects of the compounds on the fluorescence ratios 390/480 nm and 500/420 nm of roGFP2-Orp1 and HyPer-3, respectively, as determined in the microplate reader (Infinite M200, Tecan) after 0 min, 5 min, 4 h, and 24 h incubation at 25 °C. As indicated, even high concentrations (1 mM) of the compounds ART, ATM, ATS, CQ, QN, and MQ had hardly any effect on the fluorescence ratio of roGFP2-Orp1 (Table 4.1) or HyPer-3 (Table 4.2). In comparison, the redox cycler MB and the EA derivatives FEA and CEA led to a significant, immediate increase in fluorescence ratios of both probes, which was already visible even at the lowest concentration of 1 µM. Therefore, these compounds were excluded from cell culture studies. Detailed in vitro characterizations of roGFP2-Orp1 and HyPer-3 incubated with the antimalarial drugs can be found in the master thesis of Stine Weder (Weder, 2015). Table 4.1 Effects of antimalarial drugs on the redox ratio of recombinant roGFP2-Orp1. (Rahbari et al., 2017a)
Drugs Increase in fluorescence ratio a
Fold change in fluorescence ratio b
[1 mM] 0 min 5 min 4 h 24 h 0 min 5 min 4 h 24 h
ART No effect No effect 0.24 0.39 0.44 0.56 – – 1.63 1.27
ATM No effect No effect No effect No effect – – – –
ATS No effect No effect No effect No effect – – – –
CQ No effect No effect No effect No effect – – – –
MQ No effect No effect No effect No effect – – – –
QN No effect No effect No effect No effect – – – –
CEA 0.16 0.54 0.17 0.71 0.24 0.62 0.44 0.60 3.38 4.18 2.58 1.36
FEA 0.16 0.64 0.17 0.84 0.24 0.61 0.44 0.55 4.00 4.94 2.54 1.25
MB 0.16 0.73 0.17 1.07 0.24 1.03 0.44 0.95 4.56 6.29 4.29 2.16
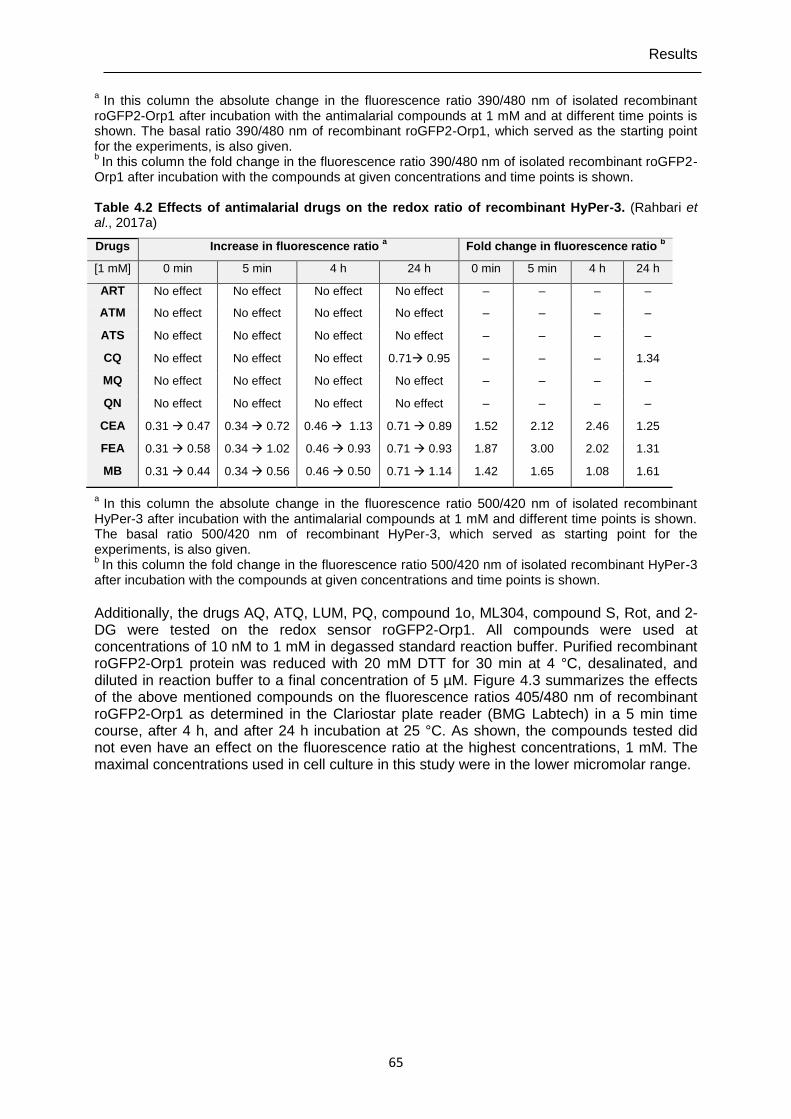
Results
65
a In this column the absolute change in the fluorescence ratio 390/480 nm of isolated recombinant
roGFP2-Orp1 after incubation with the antimalarial compounds at 1 mM and at different time points is shown. The basal ratio 390/480 nm of recombinant roGFP2-Orp1, which served as the starting point for the experiments, is also given. b
In this column the fold change in the fluorescence ratio 390/480 nm of isolated recombinant roGFP2-Orp1 after incubation with the compounds at given concentrations and time points is shown. Table 4.2 Effects of antimalarial drugs on the redox ratio of recombinant HyPer-3. (Rahbari et al., 2017a)
Drugs Increase in fluorescence ratio a
Fold change in fluorescence ratio b
[1 mM] 0 min 5 min 4 h 24 h 0 min 5 min 4 h 24 h
ART No effect No effect No effect No effect – – – –
ATM No effect No effect No effect No effect – – – –
ATS No effect No effect No effect No effect – – – –
CQ No effect No effect No effect 0.71 0.95 – – – 1.34
MQ No effect No effect No effect No effect – – – –
QN No effect No effect No effect No effect – – – –
CEA 0.31 0.47 0.34 0.72 0.46 1.13 0.71 0.89 1.52 2.12 2.46 1.25
FEA 0.31 0.58 0.34 1.02 0.46 0.93 0.71 0.93 1.87 3.00 2.02 1.31
MB 0.31 0.44 0.34 0.56 0.46 0.50 0.71 1.14 1.42 1.65 1.08 1.61
a In this column the absolute change in the fluorescence ratio 500/420 nm of isolated recombinant
HyPer-3 after incubation with the antimalarial compounds at 1 mM and different time points is shown. The basal ratio 500/420 nm of recombinant HyPer-3, which served as starting point for the experiments, is also given. b
In this column the fold change in the fluorescence ratio 500/420 nm of isolated recombinant HyPer-3 after incubation with the compounds at given concentrations and time points is shown.
Additionally, the drugs AQ, ATQ, LUM, PQ, compound 1o, ML304, compound S, Rot, and 2-DG were tested on the redox sensor roGFP2-Orp1. All compounds were used at concentrations of 10 nM to 1 mM in degassed standard reaction buffer. Purified recombinant roGFP2-Orp1 protein was reduced with 20 mM DTT for 30 min at 4 °C, desalinated, and diluted in reaction buffer to a final concentration of 5 µM. Figure 4.3 summarizes the effects of the above mentioned compounds on the fluorescence ratios 405/480 nm of recombinant roGFP2-Orp1 as determined in the Clariostar plate reader (BMG Labtech) in a 5 min time course, after 4 h, and after 24 h incubation at 25 °C. As shown, the compounds tested did not even have an effect on the fluorescence ratio at the highest concentrations, 1 mM. The maximal concentrations used in cell culture in this study were in the lower micromolar range.
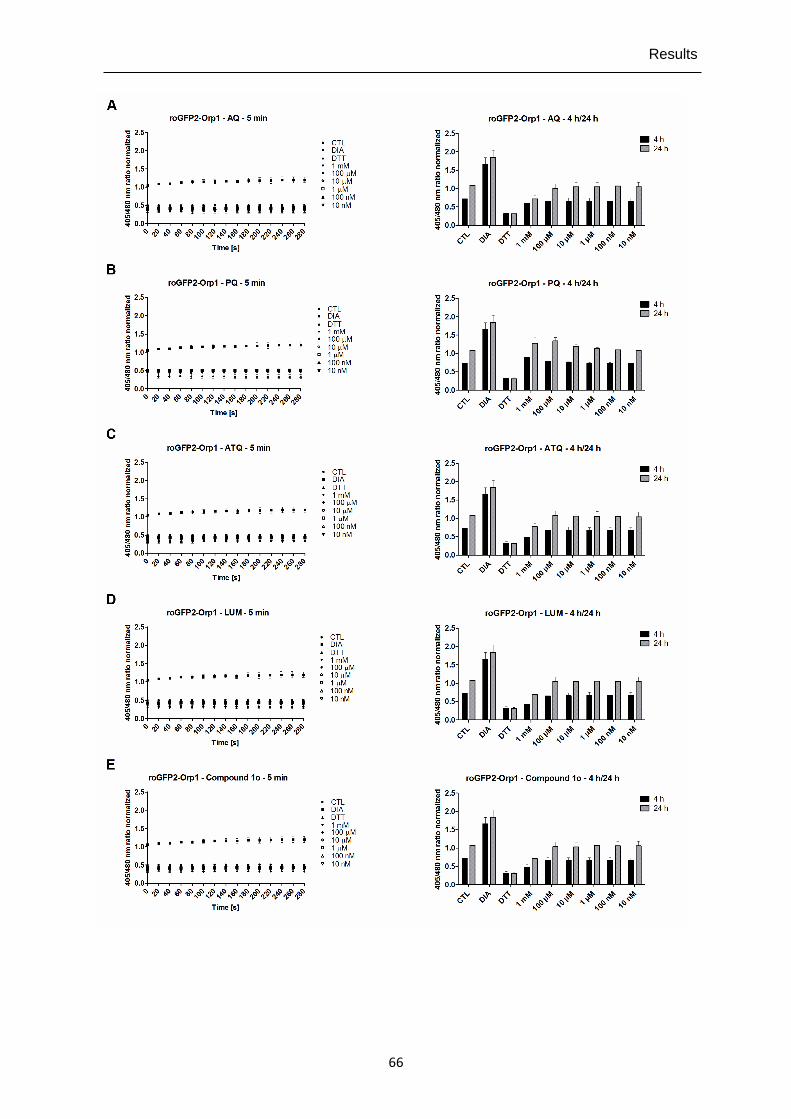
Results
66
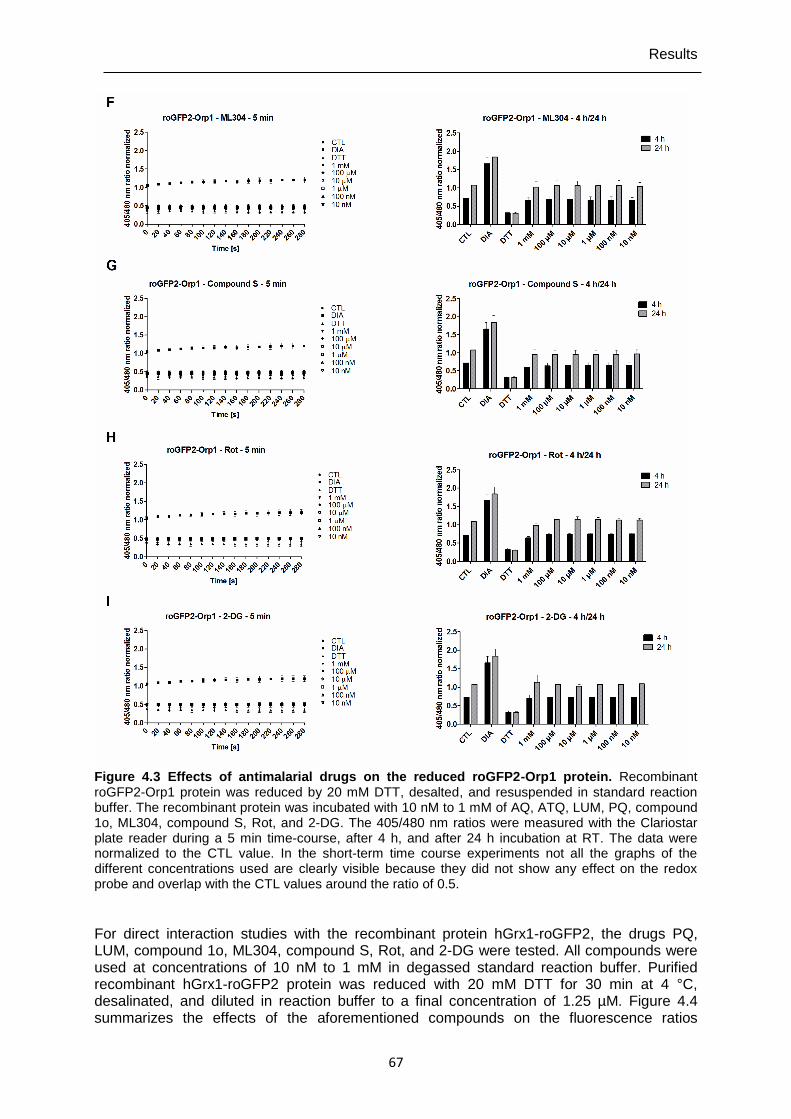
Results
67
Figure 4.3 Effects of antimalarial drugs on the reduced roGFP2-Orp1 protein. Recombinant roGFP2-Orp1 protein was reduced by 20 mM DTT, desalted, and resuspended in standard reaction buffer. The recombinant protein was incubated with 10 nM to 1 mM of AQ, ATQ, LUM, PQ, compound 1o, ML304, compound S, Rot, and 2-DG. The 405/480 nm ratios were measured with the Clariostar plate reader during a 5 min time-course, after 4 h, and after 24 h incubation at RT. The data were normalized to the CTL value. In the short-term time course experiments not all the graphs of the different concentrations used are clearly visible because they did not show any effect on the redox probe and overlap with the CTL values around the ratio of 0.5.
For direct interaction studies with the recombinant protein hGrx1-roGFP2, the drugs PQ, LUM, compound 1o, ML304, compound S, Rot, and 2-DG were tested. All compounds were used at concentrations of 10 nM to 1 mM in degassed standard reaction buffer. Purified recombinant hGrx1-roGFP2 protein was reduced with 20 mM DTT for 30 min at 4 °C, desalinated, and diluted in reaction buffer to a final concentration of 1.25 µM. Figure 4.4 summarizes the effects of the aforementioned compounds on the fluorescence ratios
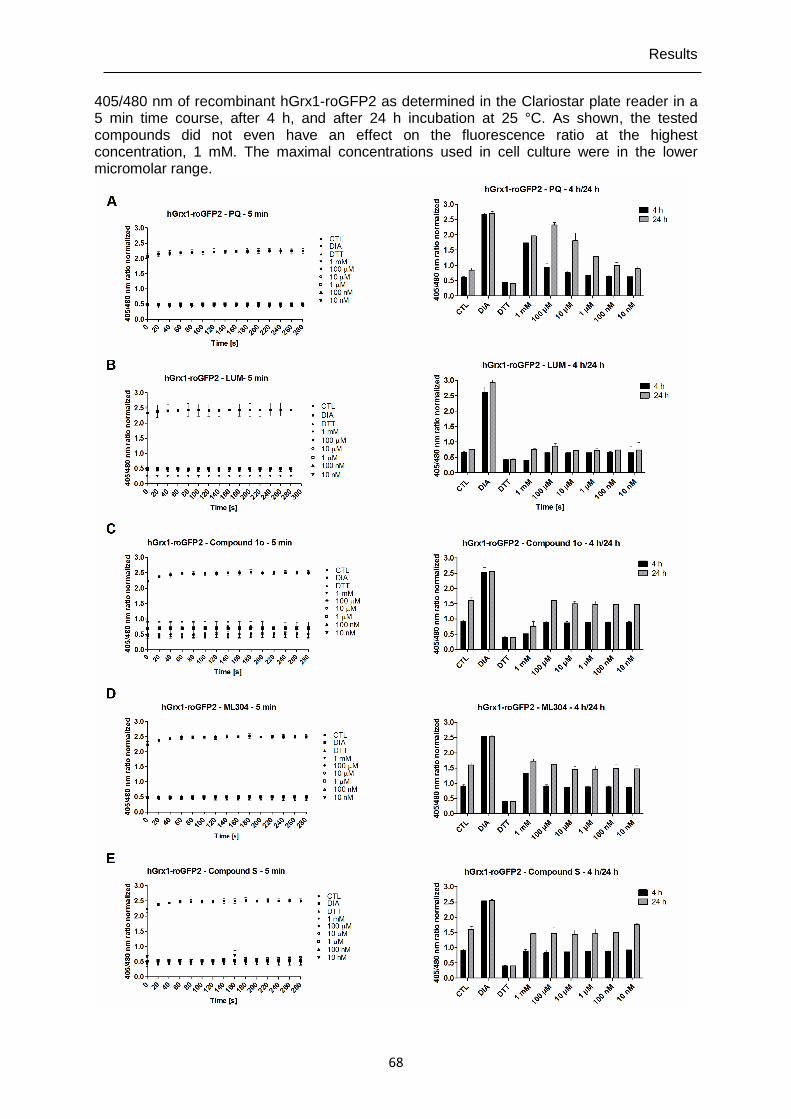
Results
68
405/480 nm of recombinant hGrx1-roGFP2 as determined in the Clariostar plate reader in a 5 min time course, after 4 h, and after 24 h incubation at 25 °C. As shown, the tested compounds did not even have an effect on the fluorescence ratio at the highest concentration, 1 mM. The maximal concentrations used in cell culture were in the lower micromolar range.
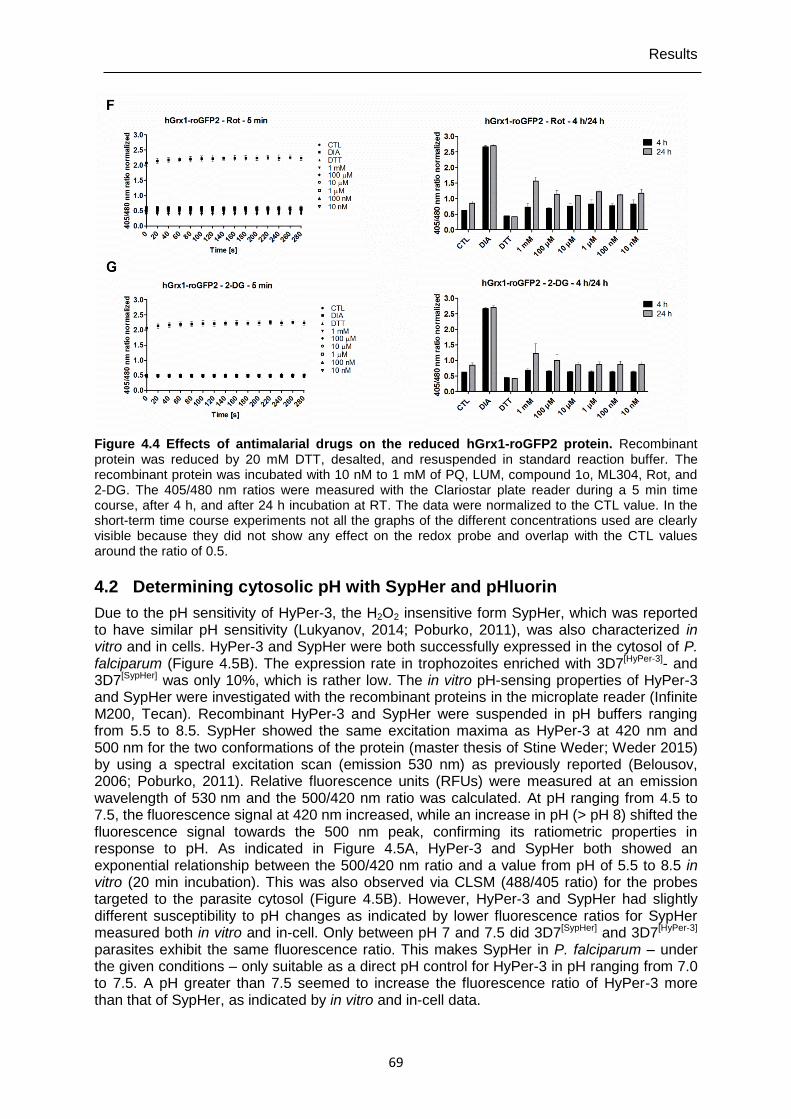
Results
69
Figure 4.4 Effects of antimalarial drugs on the reduced hGrx1-roGFP2 protein. Recombinant protein was reduced by 20 mM DTT, desalted, and resuspended in standard reaction buffer. The recombinant protein was incubated with 10 nM to 1 mM of PQ, LUM, compound 1o, ML304, Rot, and 2-DG. The 405/480 nm ratios were measured with the Clariostar plate reader during a 5 min time course, after 4 h, and after 24 h incubation at RT. The data were normalized to the CTL value. In the short-term time course experiments not all the graphs of the different concentrations used are clearly visible because they did not show any effect on the redox probe and overlap with the CTL values around the ratio of 0.5.
4.2 Determining cytosolic pH with SypHer and pHluorin
Due to the pH sensitivity of HyPer-3, the H2O2 insensitive form SypHer, which was reported to have similar pH sensitivity (Lukyanov, 2014; Poburko, 2011), was also characterized in vitro and in cells. HyPer-3 and SypHer were both successfully expressed in the cytosol of P. falciparum (Figure 4.5B). The expression rate in trophozoites enriched with 3D7[HyPer-3]- and 3D7[SypHer] was only 10%, which is rather low. The in vitro pH-sensing properties of HyPer-3 and SypHer were investigated with the recombinant proteins in the microplate reader (Infinite M200, Tecan). Recombinant HyPer-3 and SypHer were suspended in pH buffers ranging from 5.5 to 8.5. SypHer showed the same excitation maxima as HyPer-3 at 420 nm and 500 nm for the two conformations of the protein (master thesis of Stine Weder; Weder 2015) by using a spectral excitation scan (emission 530 nm) as previously reported (Belousov, 2006; Poburko, 2011). Relative fluorescence units (RFUs) were measured at an emission wavelength of 530 nm and the 500/420 nm ratio was calculated. At pH ranging from 4.5 to 7.5, the fluorescence signal at 420 nm increased, while an increase in pH (> pH 8) shifted the fluorescence signal towards the 500 nm peak, confirming its ratiometric properties in response to pH. As indicated in Figure 4.5A, HyPer-3 and SypHer both showed an exponential relationship between the 500/420 nm ratio and a value from pH of 5.5 to 8.5 in vitro (20 min incubation). This was also observed via CLSM (488/405 ratio) for the probes targeted to the parasite cytosol (Figure 4.5B). However, HyPer-3 and SypHer had slightly different susceptibility to pH changes as indicated by lower fluorescence ratios for SypHer measured both in vitro and in-cell. Only between pH 7 and 7.5 did 3D7[SypHer] and 3D7[HyPer-3]
parasites exhibit the same fluorescence ratio. This makes SypHer in P. falciparum – under the given conditions – only suitable as a direct pH control for HyPer-3 in pH ranging from 7.0 to 7.5. A pH greater than 7.5 seemed to increase the fluorescence ratio of HyPer-3 more than that of SypHer, as indicated by in vitro and in-cell data.
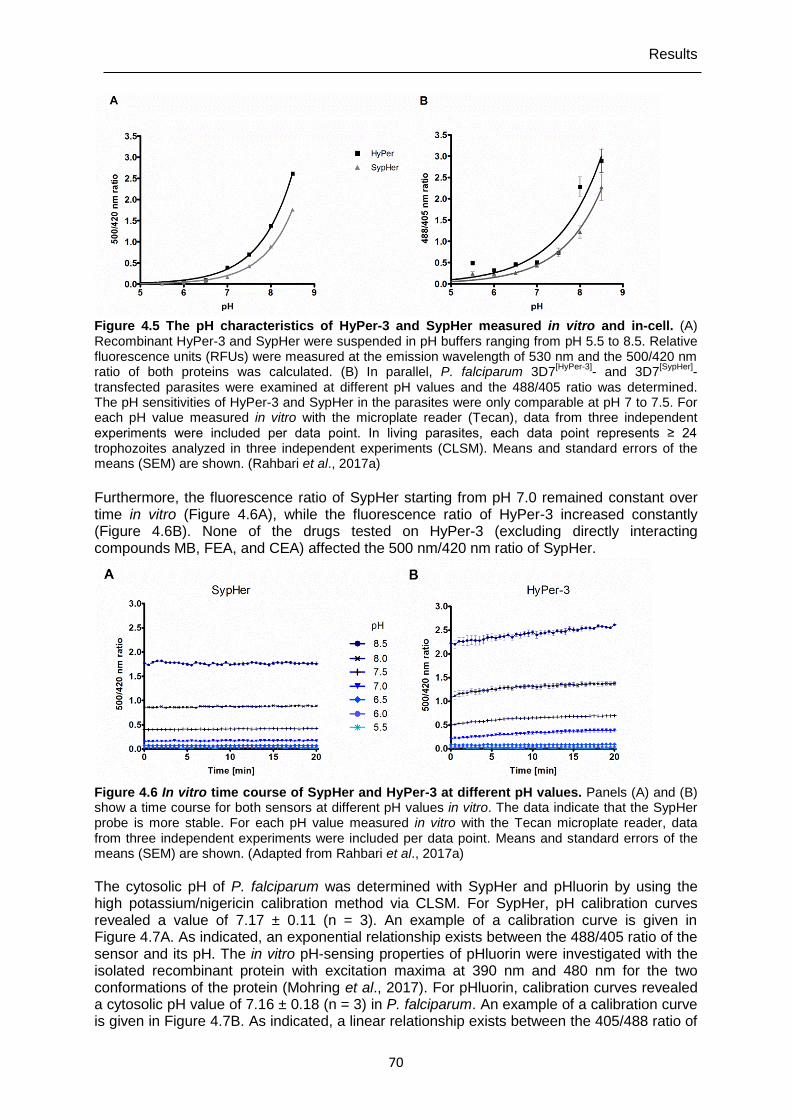
Results
70
Figure 4.5 The pH characteristics of HyPer-3 and SypHer measured in vitro and in-cell. (A) Recombinant HyPer-3 and SypHer were suspended in pH buffers ranging from pH 5.5 to 8.5. Relative fluorescence units (RFUs) were measured at the emission wavelength of 530 nm and the 500/420 nm ratio of both proteins was calculated. (B) In parallel, P. falciparum 3D7
[HyPer-3]- and 3D7
[SypHer]-
transfected parasites were examined at different pH values and the 488/405 ratio was determined. The pH sensitivities of HyPer-3 and SypHer in the parasites were only comparable at pH 7 to 7.5. For each pH value measured in vitro with the microplate reader (Tecan), data from three independent experiments were included per data point. In living parasites, each data point represents ≥ 24 trophozoites analyzed in three independent experiments (CLSM). Means and standard errors of the means (SEM) are shown. (Rahbari et al., 2017a)
Furthermore, the fluorescence ratio of SypHer starting from pH 7.0 remained constant over time in vitro (Figure 4.6A), while the fluorescence ratio of HyPer-3 increased constantly (Figure 4.6B). None of the drugs tested on HyPer-3 (excluding directly interacting compounds MB, FEA, and CEA) affected the 500 nm/420 nm ratio of SypHer.
Figure 4.6 In vitro time course of SypHer and HyPer-3 at different pH values. Panels (A) and (B) show a time course for both sensors at different pH values in vitro. The data indicate that the SypHer probe is more stable. For each pH value measured in vitro with the Tecan microplate reader, data from three independent experiments were included per data point. Means and standard errors of the means (SEM) are shown. (Adapted from Rahbari et al., 2017a)
The cytosolic pH of P. falciparum was determined with SypHer and pHluorin by using the high potassium/nigericin calibration method via CLSM. For SypHer, pH calibration curves revealed a value of 7.17 ± 0.11 (n = 3). An example of a calibration curve is given in Figure 4.7A. As indicated, an exponential relationship exists between the 488/405 ratio of the sensor and its pH. The in vitro pH-sensing properties of pHluorin were investigated with the isolated recombinant protein with excitation maxima at 390 nm and 480 nm for the two conformations of the protein (Mohring et al., 2017). For pHluorin, calibration curves revealed a cytosolic pH value of 7.16 ± 0.18 (n = 3) in P. falciparum. An example of a calibration curve is given in Figure 4.7B. As indicated, a linear relationship exists between the 405/488 ratio of
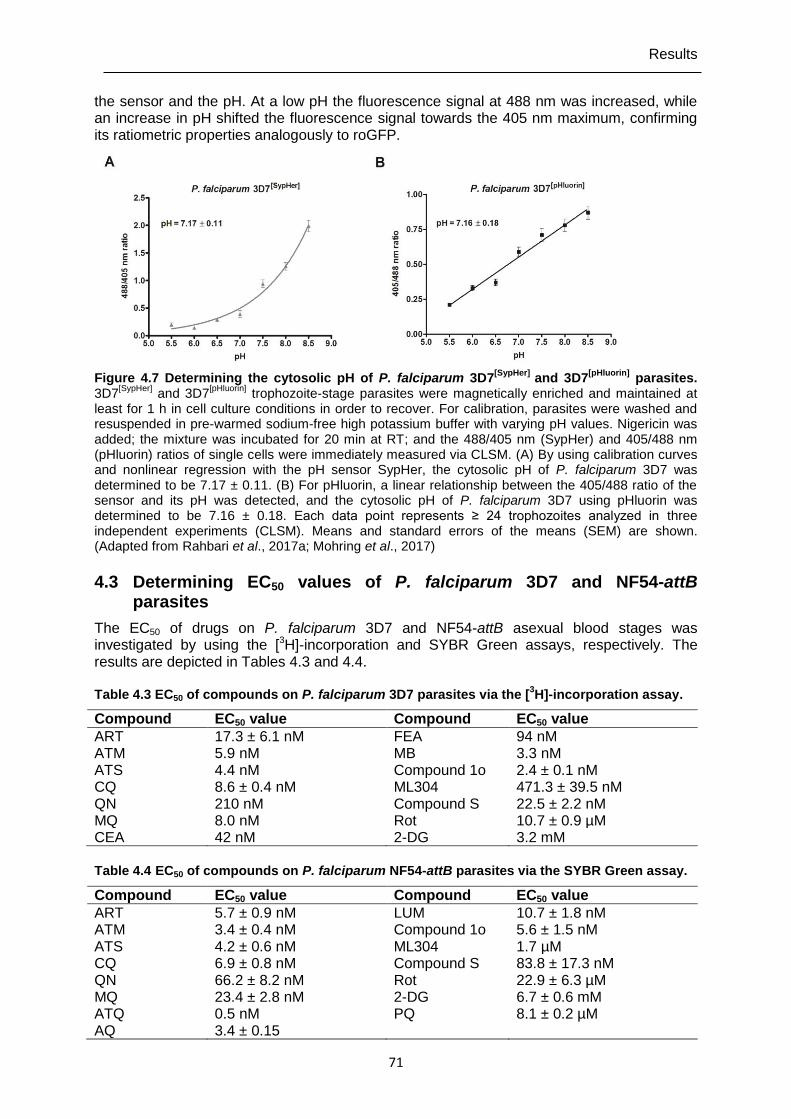
Results
71
the sensor and the pH. At a low pH the fluorescence signal at 488 nm was increased, while an increase in pH shifted the fluorescence signal towards the 405 nm maximum, confirming its ratiometric properties analogously to roGFP.
Figure 4.7 Determining the cytosolic pH of P. falciparum 3D7[SypHer]
and 3D7[pHluorin]
parasites. 3D7
[SypHer] and 3D7
[pHluorin] trophozoite-stage parasites were magnetically enriched and maintained at
least for 1 h in cell culture conditions in order to recover. For calibration, parasites were washed and resuspended in pre-warmed sodium-free high potassium buffer with varying pH values. Nigericin was added; the mixture was incubated for 20 min at RT; and the 488/405 nm (SypHer) and 405/488 nm (pHluorin) ratios of single cells were immediately measured via CLSM. (A) By using calibration curves and nonlinear regression with the pH sensor SypHer, the cytosolic pH of P. falciparum 3D7 was determined to be 7.17 ± 0.11. (B) For pHluorin, a linear relationship between the 405/488 ratio of the sensor and its pH was detected, and the cytosolic pH of P. falciparum 3D7 using pHluorin was determined to be 7.16 ± 0.18. Each data point represents ≥ 24 trophozoites analyzed in three independent experiments (CLSM). Means and standard errors of the means (SEM) are shown. (Adapted from Rahbari et al., 2017a; Mohring et al., 2017)
4.3 Determining EC50 values of P. falciparum 3D7 and NF54-attB parasites
The EC50 of drugs on P. falciparum 3D7 and NF54-attB asexual blood stages was investigated by using the [3H]-incorporation and SYBR Green assays, respectively. The results are depicted in Tables 4.3 and 4.4. Table 4.3 EC50 of compounds on P. falciparum 3D7 parasites via the [
3H]-incorporation assay.
Compound EC50 value Compound EC50 value
ART 17.3 ± 6.1 nM FEA 94 nM ATM 5.9 nM MB 3.3 nM ATS 4.4 nM Compound 1o 2.4 ± 0.1 nM CQ 8.6 ± 0.4 nM ML304 471.3 ± 39.5 nM QN 210 nM Compound S 22.5 ± 2.2 nM MQ 8.0 nM Rot 10.7 ± 0.9 µM CEA 42 nM 2-DG 3.2 mM
Table 4.4 EC50 of compounds on P. falciparum NF54-attB parasites via the SYBR Green assay.
Compound EC50 value Compound EC50 value
ART 5.7 ± 0.9 nM LUM 10.7 ± 1.8 nM ATM 3.4 ± 0.4 nM Compound 1o 5.6 ± 1.5 nM ATS 4.2 ± 0.6 nM ML304 1.7 µM CQ 6.9 ± 0.8 nM Compound S 83.8 ± 17.3 nM QN 66.2 ± 8.2 nM Rot 22.9 ± 6.3 µM MQ 23.4 ± 2.8 nM 2-DG 6.7 ± 0.6 mM ATQ AQ
0.5 nM 3.4 ± 0.15
PQ 8.1 ± 0.2 µM
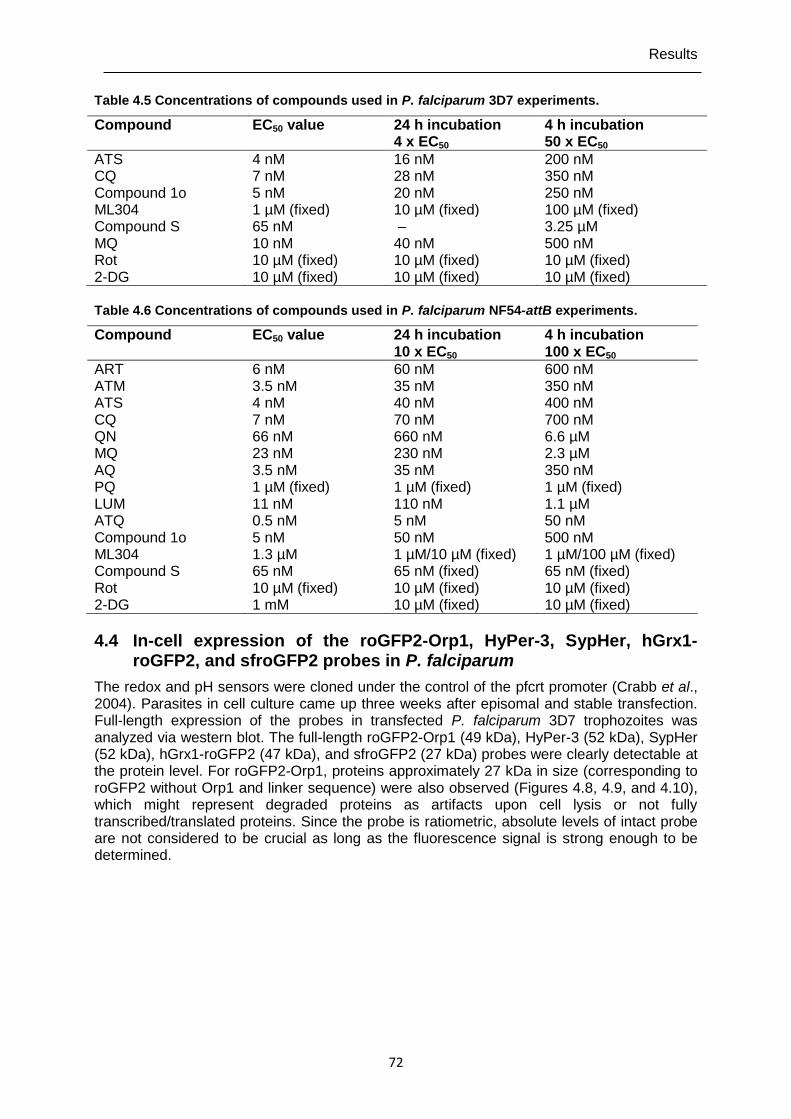
Results
72
Table 4.5 Concentrations of compounds used in P. falciparum 3D7 experiments.
Compound EC50 value 24 h incubation 4 x EC50
4 h incubation 50 x EC50
ATS 4 nM 16 nM 200 nM CQ 7 nM 28 nM 350 nM Compound 1o 5 nM 20 nM 250 nM ML304 1 µM (fixed) 10 µM (fixed) 100 µM (fixed) Compound S 65 nM – 3.25 µM MQ 10 nM 40 nM 500 nM Rot 10 µM (fixed) 10 µM (fixed) 10 µM (fixed) 2-DG 10 µM (fixed) 10 µM (fixed) 10 µM (fixed)
Table 4.6 Concentrations of compounds used in P. falciparum NF54-attB experiments.
Compound EC50 value 24 h incubation 10 x EC50
4 h incubation 100 x EC50
ART 6 nM 60 nM 600 nM ATM 3.5 nM 35 nM 350 nM ATS 4 nM 40 nM 400 nM CQ 7 nM 70 nM 700 nM QN 66 nM 660 nM 6.6 µM MQ 23 nM 230 nM 2.3 µM AQ 3.5 nM 35 nM 350 nM PQ 1 µM (fixed) 1 µM (fixed) 1 µM (fixed) LUM 11 nM 110 nM 1.1 µM ATQ 0.5 nM 5 nM 50 nM Compound 1o 5 nM 50 nM 500 nM ML304 1.3 µM 1 µM/10 µM (fixed) 1 µM/100 µM (fixed) Compound S 65 nM 65 nM (fixed) 65 nM (fixed) Rot 10 µM (fixed) 10 µM (fixed) 10 µM (fixed) 2-DG 1 mM 10 µM (fixed) 10 µM (fixed)
4.4 In-cell expression of the roGFP2-Orp1, HyPer-3, SypHer, hGrx1-roGFP2, and sfroGFP2 probes in P. falciparum
The redox and pH sensors were cloned under the control of the pfcrt promoter (Crabb et al., 2004). Parasites in cell culture came up three weeks after episomal and stable transfection. Full-length expression of the probes in transfected P. falciparum 3D7 trophozoites was analyzed via western blot. The full-length roGFP2-Orp1 (49 kDa), HyPer-3 (52 kDa), SypHer (52 kDa), hGrx1-roGFP2 (47 kDa), and sfroGFP2 (27 kDa) probes were clearly detectable at the protein level. For roGFP2-Orp1, proteins approximately 27 kDa in size (corresponding to roGFP2 without Orp1 and linker sequence) were also observed (Figures 4.8, 4.9, and 4.10), which might represent degraded proteins as artifacts upon cell lysis or not fully transcribed/translated proteins. Since the probe is ratiometric, absolute levels of intact probe are not considered to be crucial as long as the fluorescence signal is strong enough to be determined.
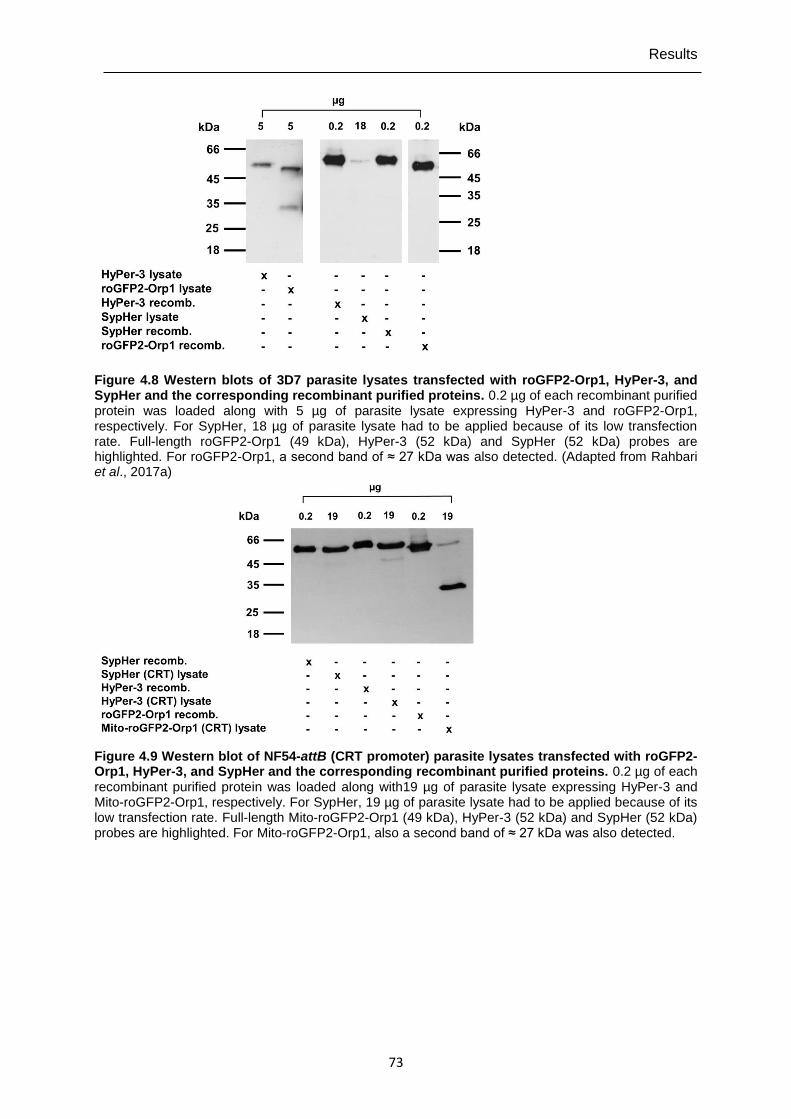
Results
73
Figure 4.8 Western blots of 3D7 parasite lysates transfected with roGFP2-Orp1, HyPer-3, and SypHer and the corresponding recombinant purified proteins. 0.2 µg of each recombinant purified protein was loaded along with 5 µg of parasite lysate expressing HyPer-3 and roGFP2-Orp1, respectively. For SypHer, 18 µg of parasite lysate had to be applied because of its low transfection rate. Full-length roGFP2-Orp1 (49 kDa), HyPer-3 (52 kDa) and SypHer (52 kDa) probes are highlighted. For roGFP2-Orp1, a second band of ≈ 27 kDa was also detected. (Adapted from Rahbari et al., 2017a)
Figure 4.9 Western blot of NF54-attB (CRT promoter) parasite lysates transfected with roGFP2-Orp1, HyPer-3, and SypHer and the corresponding recombinant purified proteins. 0.2 µg of each recombinant purified protein was loaded along with19 µg of parasite lysate expressing HyPer-3 and Mito-roGFP2-Orp1, respectively. For SypHer, 19 µg of parasite lysate had to be applied because of its low transfection rate. Full-length Mito-roGFP2-Orp1 (49 kDa), HyPer-3 (52 kDa) and SypHer (52 kDa) probes are highlighted. For Mito-roGFP2-Orp1, also a second band of ≈ 27 kDa was also detected.
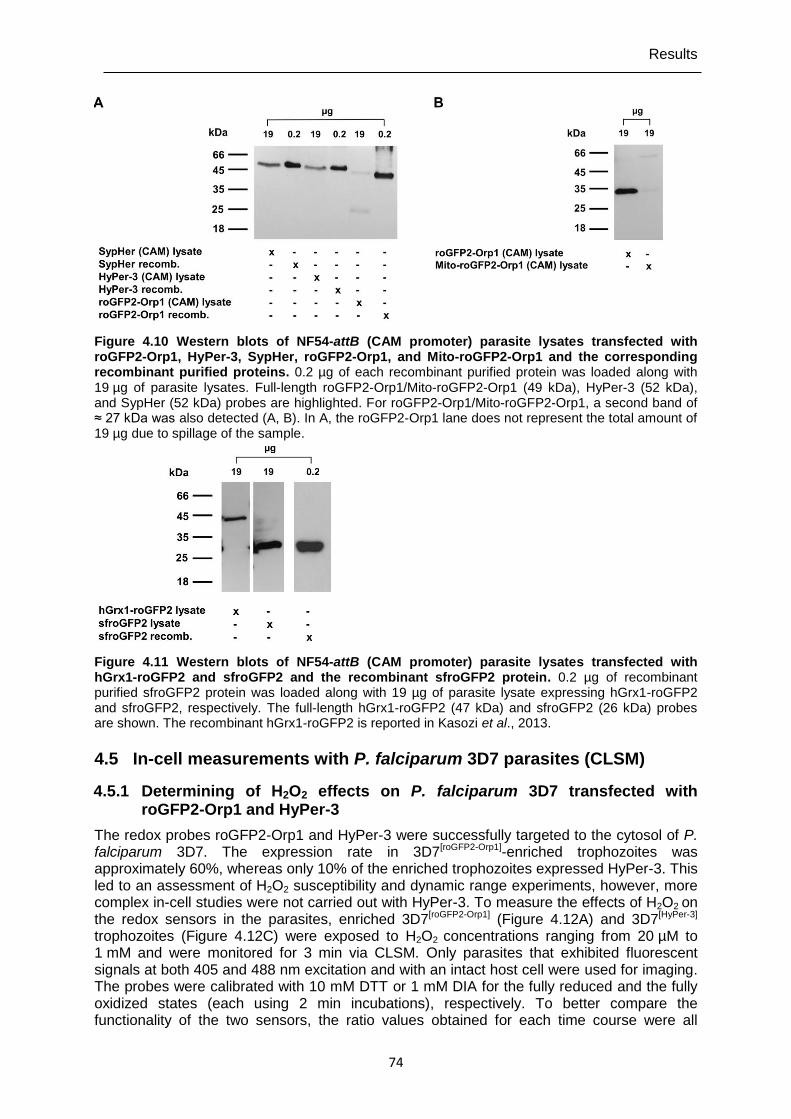
Results
74
Figure 4.10 Western blots of NF54-attB (CAM promoter) parasite lysates transfected with roGFP2-Orp1, HyPer-3, SypHer, roGFP2-Orp1, and Mito-roGFP2-Orp1 and the corresponding recombinant purified proteins. 0.2 µg of each recombinant purified protein was loaded along with 19 µg of parasite lysates. Full-length roGFP2-Orp1/Mito-roGFP2-Orp1 (49 kDa), HyPer-3 (52 kDa), and SypHer (52 kDa) probes are highlighted. For roGFP2-Orp1/Mito-roGFP2-Orp1, a second band of ≈ 27 kDa was also detected (A, B). In A, the roGFP2-Orp1 lane does not represent the total amount of 19 µg due to spillage of the sample.
Figure 4.11 Western blots of NF54-attB (CAM promoter) parasite lysates transfected with hGrx1-roGFP2 and sfroGFP2 and the recombinant sfroGFP2 protein. 0.2 µg of recombinant purified sfroGFP2 protein was loaded along with 19 µg of parasite lysate expressing hGrx1-roGFP2 and sfroGFP2, respectively. The full-length hGrx1-roGFP2 (47 kDa) and sfroGFP2 (26 kDa) probes are shown. The recombinant hGrx1-roGFP2 is reported in Kasozi et al., 2013.
4.5 In-cell measurements with P. falciparum 3D7 parasites (CLSM)
4.5.1 Determining of H2O2 effects on P. falciparum 3D7 transfected with roGFP2-Orp1 and HyPer-3
The redox probes roGFP2-Orp1 and HyPer-3 were successfully targeted to the cytosol of P. falciparum 3D7. The expression rate in 3D7[roGFP2-Orp1]-enriched trophozoites was approximately 60%, whereas only 10% of the enriched trophozoites expressed HyPer-3. This led to an assessment of H2O2 susceptibility and dynamic range experiments, however, more complex in-cell studies were not carried out with HyPer-3. To measure the effects of H2O2 on the redox sensors in the parasites, enriched 3D7[roGFP2-Orp1] (Figure 4.12A) and 3D7[HyPer-3] trophozoites (Figure 4.12C) were exposed to H2O2 concentrations ranging from 20 µM to 1 mM and were monitored for 3 min via CLSM. Only parasites that exhibited fluorescent signals at both 405 and 488 nm excitation and with an intact host cell were used for imaging. The probes were calibrated with 10 mM DTT or 1 mM DIA for the fully reduced and the fully oxidized states (each using 2 min incubations), respectively. To better compare the functionality of the two sensors, the ratio values obtained for each time course were all
Results
75
calibrated to the first basal ratio value, which was set to 100. To monitor potential effects of the excitation light on the redox state of the cells, trophozoites were imaged for 3 min under the same experimental conditions, only without any treatment, and served as controls. Upon adding H2O2, both 3D7[roGFP2-Orp1]- and 3D7[HyPer-3]-transfectants showed a concentration-dependent increase in the 405/488 nm and 488/405 nm ratios, respectively (Figure 4.12A, C), in which 3D7[HyPer-3] exhibited higher H2O2 susceptibility and faster oxidation (within seconds) and reduction rates than 3D7[roGFP2-Orp1]. Oxidation of 3D7[roGFP2-Orp1] at 100 µM to 1 mM H2O2 remained rather constant over time. As determined via microscopy, both probes were present only in the parasites’ cytosol. However, after short-term treatment with high
H2O2 concentrations (≥ 100 μM), the roGFP2-Orp1 and HyPer-3 probes were found to be leaking into the erythrocyte cytosol. Additional experiments with isolated parasites (directly after saponin lysis of the iRBCs) were carried out (Figure 4.12B, D; Figure 4.13) in order to determine the influence of the erythrocyte, which surrounds the parasite and might quench H2O2 before it reaches the redox probes. Expsoure of 3D7[roGFP2-Orp1] iRBCs lysed with saponin to different concentrations of H2O2 again showed time- and dose-dependent responses in fluorescence ratio measurements (Figure 4.12B); however, 1 mM H2O2 led to a faster oxidation of the probe than in parasites within intact RBCs (Figure 4.12A). Interestingly, a constant decrease of the fluorescence ratio occurred over time in controls and treated parasites, which is most likely due to an H2O2- and light-induced bleaching of the probe (Figure 4.12B) (Hoebe et al., 2007). In contrast, 3D7[HyPer-3] parasites after RBC lysis exhibited a constant control but in comparison to parasites in intact RBCs (Figure 4.12C) a more pronounced increase (1.4 to 1.6-fold) in the 488/405 nm ratio upon addition of 50 µM to 1 mM H2O2 (Figure 4.12D). Both experimental setups (Figure 4.12B, D) indeed indicate that the parasites are more susceptible to H2O2 after removal of the host cell, however, the two redox sensors respond differently to the oxidative challenge imposed on host cell-deprived parasites.
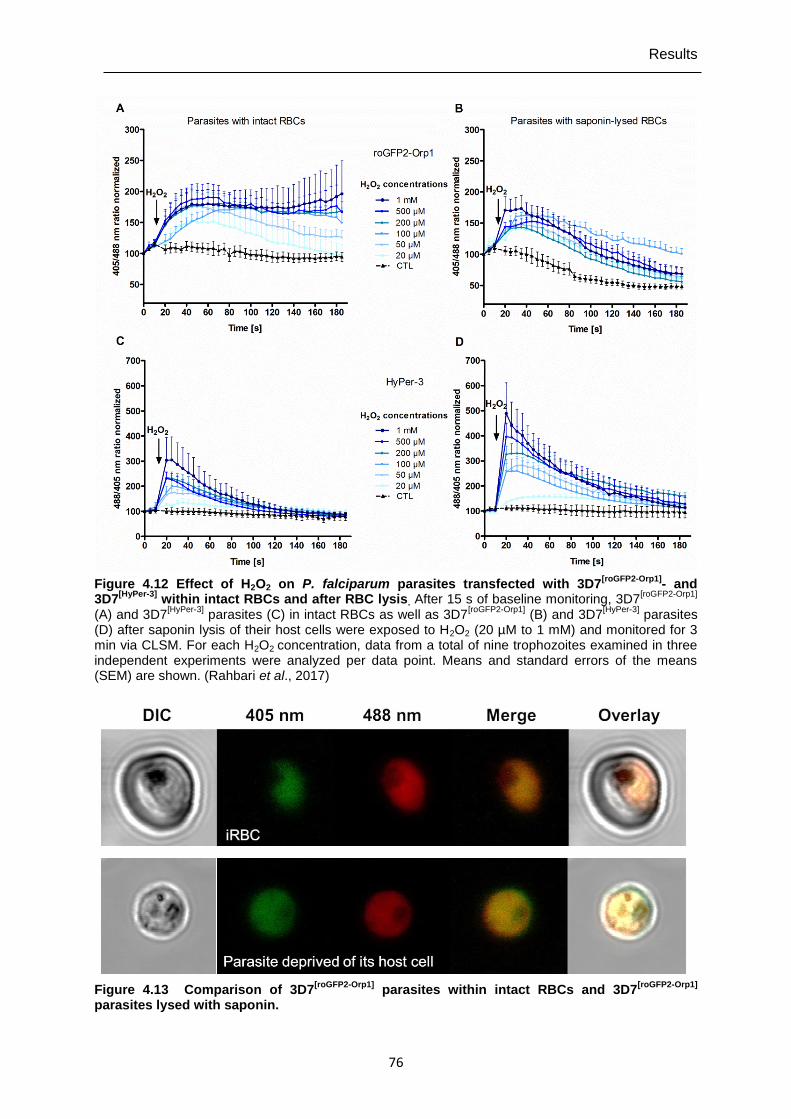
Results
76
Figure 4.12 Effect of H2O2 on P. falciparum parasites transfected with 3D7[roGFP2-Orp1]
- and 3D7
[HyPer-3] within intact RBCs and after RBC lysis. After 15 s of baseline monitoring, 3D7
[roGFP2-Orp1]
(A) and 3D7[HyPer-3]
parasites (C) in intact RBCs as well as 3D7[roGFP2-Orp1]
(B) and 3D7[HyPer-3]
parasites (D) after saponin lysis of their host cells were exposed to H2O2 (20 µM to 1 mM) and monitored for 3 min via CLSM. For each H2O2 concentration, data from a total of nine trophozoites examined in three independent experiments were analyzed per data point. Means and standard errors of the means (SEM) are shown. (Rahbari et al., 2017)
Figure 4.13 Comparison of 3D7[roGFP2-Orp1]
parasites within intact RBCs and 3D7[roGFP2-Orp1]
parasites lysed with saponin.
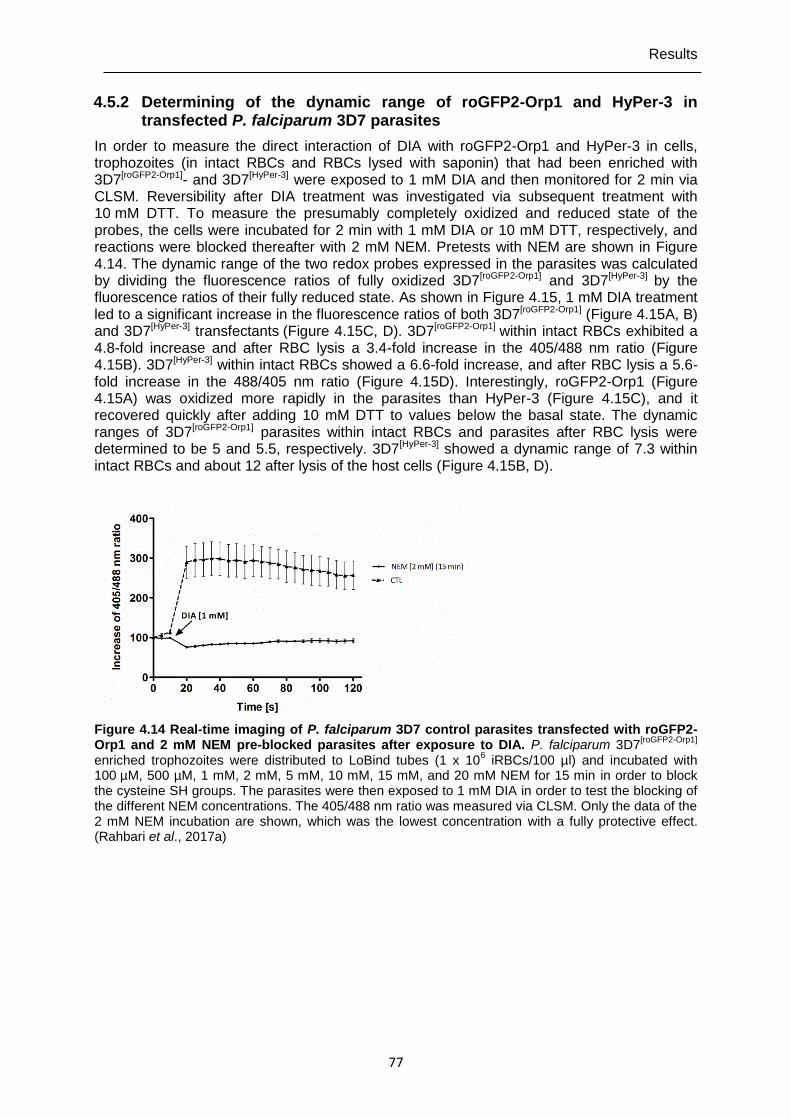
Results
77
4.5.2 Determining of the dynamic range of roGFP2-Orp1 and HyPer-3 in transfected P. falciparum 3D7 parasites
In order to measure the direct interaction of DIA with roGFP2-Orp1 and HyPer-3 in cells, trophozoites (in intact RBCs and RBCs lysed with saponin) that had been enriched with 3D7[roGFP2-Orp1]- and 3D7[HyPer-3] were exposed to 1 mM DIA and then monitored for 2 min via CLSM. Reversibility after DIA treatment was investigated via subsequent treatment with 10 mM DTT. To measure the presumably completely oxidized and reduced state of the probes, the cells were incubated for 2 min with 1 mM DIA or 10 mM DTT, respectively, and reactions were blocked thereafter with 2 mM NEM. Pretests with NEM are shown in Figure 4.14. The dynamic range of the two redox probes expressed in the parasites was calculated by dividing the fluorescence ratios of fully oxidized 3D7[roGFP2-Orp1] and 3D7[HyPer-3] by the fluorescence ratios of their fully reduced state. As shown in Figure 4.15, 1 mM DIA treatment led to a significant increase in the fluorescence ratios of both 3D7[roGFP2-Orp1] (Figure 4.15A, B) and 3D7[HyPer-3] transfectants (Figure 4.15C, D). 3D7[roGFP2-Orp1] within intact RBCs exhibited a 4.8-fold increase and after RBC lysis a 3.4-fold increase in the 405/488 nm ratio (Figure 4.15B). 3D7[HyPer-3] within intact RBCs showed a 6.6-fold increase, and after RBC lysis a 5.6-fold increase in the 488/405 nm ratio (Figure 4.15D). Interestingly, roGFP2-Orp1 (Figure 4.15A) was oxidized more rapidly in the parasites than HyPer-3 (Figure 4.15C), and it recovered quickly after adding 10 mM DTT to values below the basal state. The dynamic ranges of 3D7[roGFP2-Orp1] parasites within intact RBCs and parasites after RBC lysis were determined to be 5 and 5.5, respectively. 3D7[HyPer-3] showed a dynamic range of 7.3 within intact RBCs and about 12 after lysis of the host cells (Figure 4.15B, D).
Figure 4.14 Real-time imaging of P. falciparum 3D7 control parasites transfected with roGFP2-Orp1 and 2 mM NEM pre-blocked parasites after exposure to DIA. P. falciparum 3D7
[roGFP2-Orp1]
enriched trophozoites were distributed to LoBind tubes (1 x 10⁶ iRBCs/100 µl) and incubated with
100 µM, 500 µM, 1 mM, 2 mM, 5 mM, 10 mM, 15 mM, and 20 mM NEM for 15 min in order to block the cysteine SH groups. The parasites were then exposed to 1 mM DIA in order to test the blocking of the different NEM concentrations. The 405/488 nm ratio was measured via CLSM. Only the data of the 2 mM NEM incubation are shown, which was the lowest concentration with a fully protective effect. (Rahbari et al., 2017a)
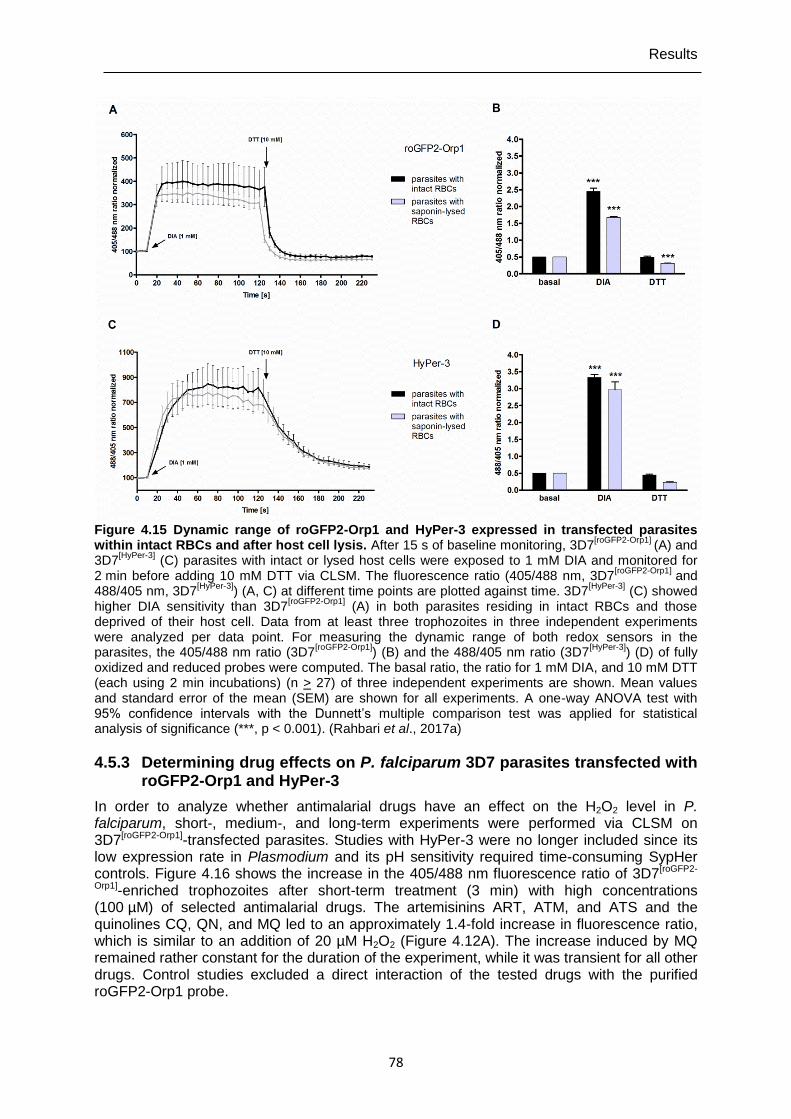
Results
78
Figure 4.15 Dynamic range of roGFP2-Orp1 and HyPer-3 expressed in transfected parasites within intact RBCs and after host cell lysis. After 15 s of baseline monitoring, 3D7
[roGFP2-Orp1] (A) and
3D7[HyPer-3]
(C) parasites with intact or lysed host cells were exposed to 1 mM DIA and monitored for 2 min before adding 10 mM DTT via CLSM. The fluorescence ratio (405/488 nm, 3D7
[roGFP2-Orp1] and
488/405 nm, 3D7[HyPer-3]
) (A, C) at different time points are plotted against time. 3D7[HyPer-3]
(C) showed higher DIA sensitivity than 3D7
[roGFP2-Orp1] (A) in both parasites residing in intact RBCs and those
deprived of their host cell. Data from at least three trophozoites in three independent experiments were analyzed per data point. For measuring the dynamic range of both redox sensors in the parasites, the 405/488 nm ratio (3D7
[roGFP2-Orp1]) (B) and the 488/405 nm ratio (3D7
[HyPer-3]) (D) of fully
oxidized and reduced probes were computed. The basal ratio, the ratio for 1 mM DIA, and 10 mM DTT (each using 2 min incubations) (n > 27) of three independent experiments are shown. Mean values and standard error of the mean (SEM) are shown for all experiments. A one-way ANOVA test with 95% confidence intervals with the Dunnett’s multiple comparison test was applied for statistical analysis of significance (***, p < 0.001). (Rahbari et al., 2017a)
4.5.3 Determining drug effects on P. falciparum 3D7 parasites transfected with roGFP2-Orp1 and HyPer-3
In order to analyze whether antimalarial drugs have an effect on the H2O2 level in P. falciparum, short-, medium-, and long-term experiments were performed via CLSM on 3D7[roGFP2-Orp1]-transfected parasites. Studies with HyPer-3 were no longer included since its low expression rate in Plasmodium and its pH sensitivity required time-consuming SypHer controls. Figure 4.16 shows the increase in the 405/488 nm fluorescence ratio of 3D7[roGFP2-
Orp1]-enriched trophozoites after short-term treatment (3 min) with high concentrations (100 µM) of selected antimalarial drugs. The artemisinins ART, ATM, and ATS and the quinolines CQ, QN, and MQ led to an approximately 1.4-fold increase in fluorescence ratio, which is similar to an addition of 20 µM H2O2 (Figure 4.12A). The increase induced by MQ remained rather constant for the duration of the experiment, while it was transient for all other drugs. Control studies excluded a direct interaction of the tested drugs with the purified roGFP2-Orp1 probe.
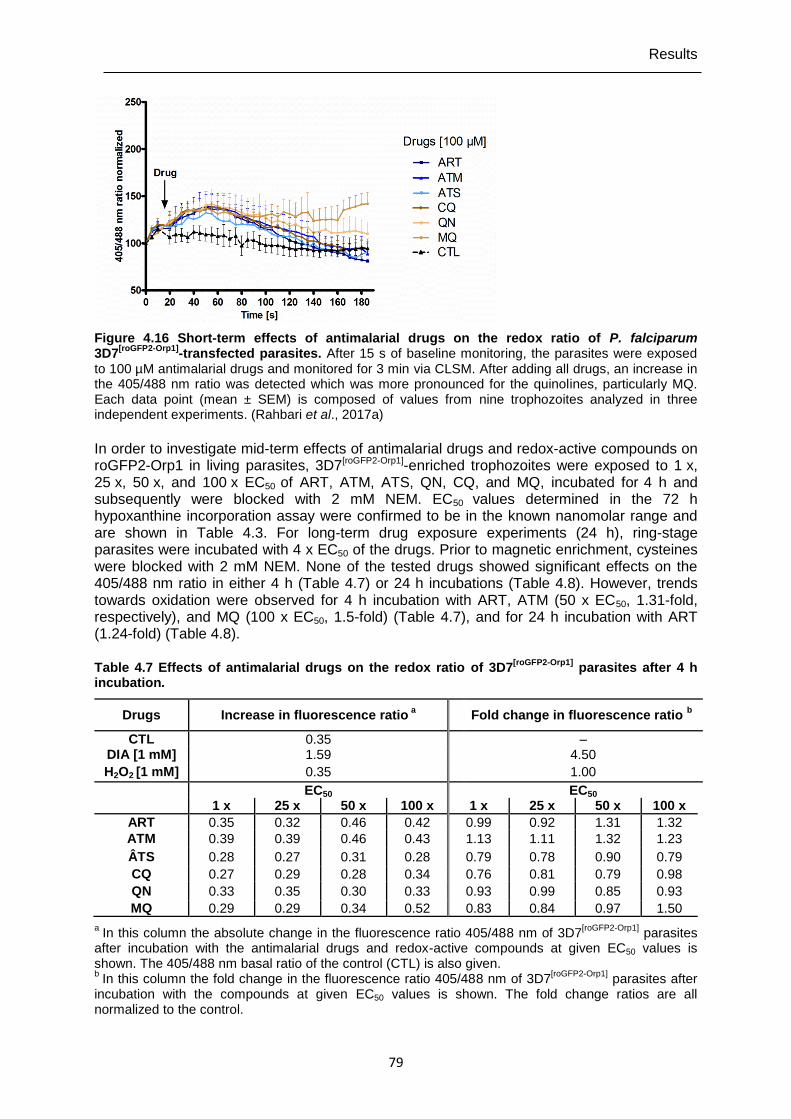
Results
79
Figure 4.16 Short-term effects of antimalarial drugs on the redox ratio of P. falciparum 3D7
[roGFP2-Orp1]-transfected parasites. After 15 s of baseline monitoring, the parasites were exposed
to 100 µM antimalarial drugs and monitored for 3 min via CLSM. After adding all drugs, an increase in the 405/488 nm ratio was detected which was more pronounced for the quinolines, particularly MQ. Each data point (mean ± SEM) is composed of values from nine trophozoites analyzed in three independent experiments. (Rahbari et al., 2017a)
In order to investigate mid-term effects of antimalarial drugs and redox-active compounds on roGFP2-Orp1 in living parasites, 3D7[roGFP2-Orp1]-enriched trophozoites were exposed to 1 x, 25 x, 50 x, and 100 x EC50 of ART, ATM, ATS, QN, CQ, and MQ, incubated for 4 h and subsequently were blocked with 2 mM NEM. EC50 values determined in the 72 h hypoxanthine incorporation assay were confirmed to be in the known nanomolar range and are shown in Table 4.3. For long-term drug exposure experiments (24 h), ring-stage parasites were incubated with 4 x EC50 of the drugs. Prior to magnetic enrichment, cysteines were blocked with 2 mM NEM. None of the tested drugs showed significant effects on the 405/488 nm ratio in either 4 h (Table 4.7) or 24 h incubations (Table 4.8). However, trends towards oxidation were observed for 4 h incubation with ART, ATM (50 x EC50, 1.31-fold, respectively), and MQ (100 x EC50, 1.5-fold) (Table 4.7), and for 24 h incubation with ART (1.24-fold) (Table 4.8). Table 4.7 Effects of antimalarial drugs on the redox ratio of 3D7
[roGFP2-Orp1] parasites after 4 h
incubation.
Drugs Increase in fluorescence ratio a Fold change in fluorescence ratio
b
CTL 0.35 – DIA [1 mM] 1.59 4.50
H2O2 [1 mM] 0.35 1.00
EC50 EC50 1 x 25 x 50 x 100 x 1 x 25 x 50 x 100 x
ART 0.35 0.32 0.46 0.42 0.99 0.92 1.31 1.32
ATM 0.39 0.39 0.46 0.43 1.13 1.11 1.32 1.23
ÂTS 0.28 0.27 0.31 0.28 0.79 0.78 0.90 0.79
CQ 0.27 0.29 0.28 0.34 0.76 0.81 0.79 0.98
QN 0.33 0.35 0.30 0.33 0.93 0.99 0.85 0.93
MQ 0.29 0.29 0.34 0.52 0.83 0.84 0.97 1.50
a In this column the absolute change in the fluorescence ratio 405/488 nm of 3D7
[roGFP2-Orp1] parasites
after incubation with the antimalarial drugs and redox-active compounds at given EC50 values is shown. The 405/488 nm basal ratio of the control (CTL) is also given. b
In this column the fold change in the fluorescence ratio 405/488 nm of 3D7[roGFP2-Orp1]
parasites after incubation with the compounds at given EC50 values is shown. The fold change ratios are all normalized to the control.
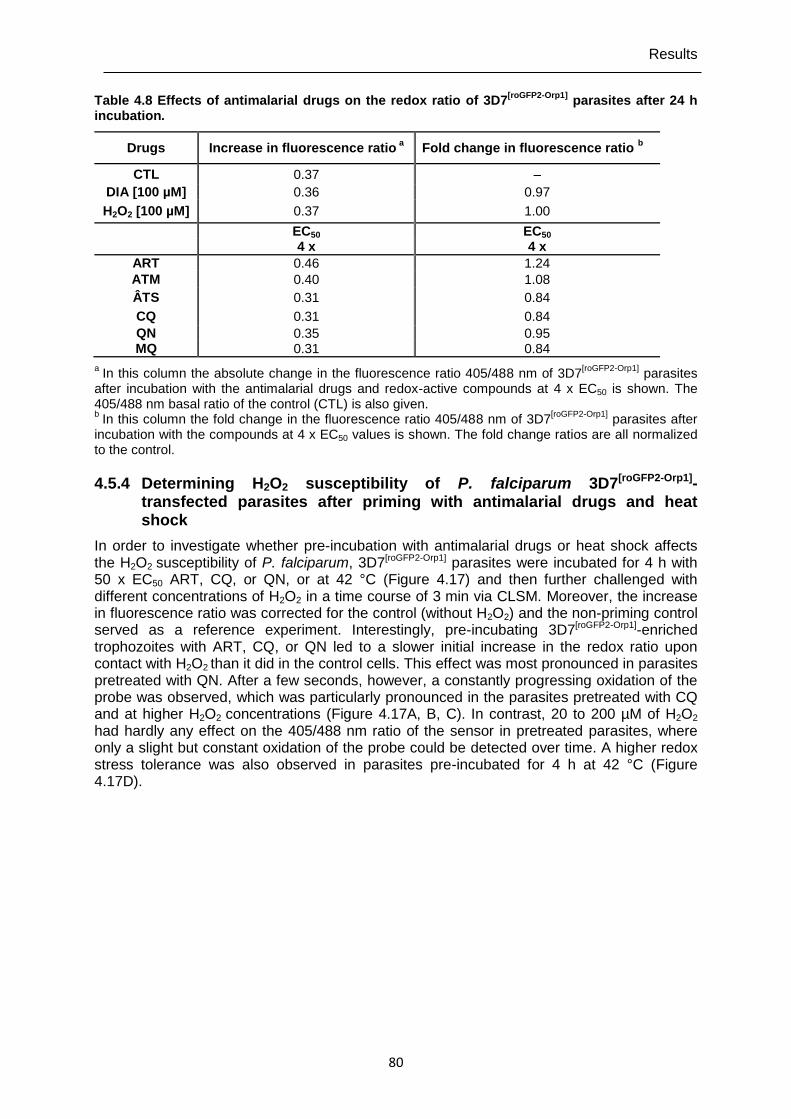
Results
80
Table 4.8 Effects of antimalarial drugs on the redox ratio of 3D7[roGFP2-Orp1]
parasites after 24 h incubation.
Drugs Increase in fluorescence ratio a Fold change in fluorescence ratio
b
CTL 0.37 –
DIA [100 µM] 0.36 0.97
H2O2 [100 µM] 0.37 1.00
EC50 EC50 4 x 4 x
ART 0.46 1.24
ATM 0.40 1.08
ÂTS 0.31 0.84
CQ 0.31 0.84
QN 0.35 0.95 MQ 0.31 0.84
a In this column the absolute change in the fluorescence ratio 405/488 nm of 3D7
[roGFP2-Orp1] parasites
after incubation with the antimalarial drugs and redox-active compounds at 4 x EC50 is shown. The 405/488 nm basal ratio of the control (CTL) is also given. b
In this column the fold change in the fluorescence ratio 405/488 nm of 3D7[roGFP2-Orp1]
parasites after incubation with the compounds at 4 x EC50 values is shown. The fold change ratios are all normalized to the control.
4.5.4 Determining H2O2 susceptibility of P. falciparum 3D7[roGFP2-Orp1]-transfected parasites after priming with antimalarial drugs and heat shock
In order to investigate whether pre-incubation with antimalarial drugs or heat shock affects the H2O2 susceptibility of P. falciparum, 3D7[roGFP2-Orp1] parasites were incubated for 4 h with 50 x EC50 ART, CQ, or QN, or at 42 °C (Figure 4.17) and then further challenged with different concentrations of H2O2 in a time course of 3 min via CLSM. Moreover, the increase in fluorescence ratio was corrected for the control (without H2O2) and the non-priming control served as a reference experiment. Interestingly, pre-incubating 3D7[roGFP2-Orp1]-enriched trophozoites with ART, CQ, or QN led to a slower initial increase in the redox ratio upon contact with H2O2 than it did in the control cells. This effect was most pronounced in parasites pretreated with QN. After a few seconds, however, a constantly progressing oxidation of the probe was observed, which was particularly pronounced in the parasites pretreated with CQ and at higher H2O2 concentrations (Figure 4.17A, B, C). In contrast, 20 to 200 µM of H2O2
had hardly any effect on the 405/488 nm ratio of the sensor in pretreated parasites, where only a slight but constant oxidation of the probe could be detected over time. A higher redox stress tolerance was also observed in parasites pre-incubated for 4 h at 42 °C (Figure 4.17D).
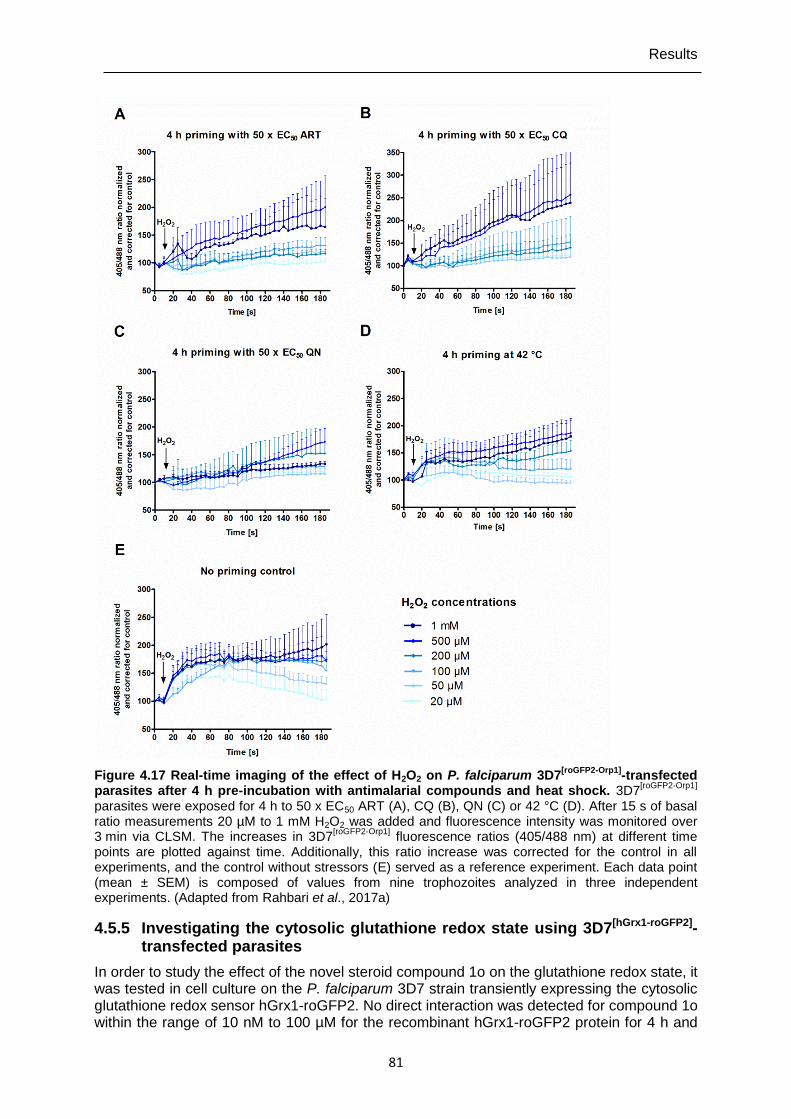
Results
81
Figure 4.17 Real-time imaging of the effect of H2O2 on P. falciparum 3D7[roGFP2-Orp1]
-transfected parasites after 4 h pre-incubation with antimalarial compounds and heat shock. 3D7
[roGFP2-Orp1]
parasites were exposed for 4 h to 50 x EC50 ART (A), CQ (B), QN (C) or 42 °C (D). After 15 s of basal ratio measurements 20 µM to 1 mM H2O2 was added and fluorescence intensity was monitored over 3 min via CLSM. The increases in 3D7
[roGFP2-Orp1] fluorescence ratios (405/488 nm) at different time
points are plotted against time. Additionally, this ratio increase was corrected for the control in all experiments, and the control without stressors (E) served as a reference experiment. Each data point (mean ± SEM) is composed of values from nine trophozoites analyzed in three independent experiments. (Adapted from Rahbari et al., 2017a)
4.5.5 Investigating the cytosolic glutathione redox state using 3D7[hGrx1-roGFP2]-transfected parasites
In order to study the effect of the novel steroid compound 1o on the glutathione redox state, it was tested in cell culture on the P. falciparum 3D7 strain transiently expressing the cytosolic glutathione redox sensor hGrx1-roGFP2. No direct interaction was detected for compound 1o within the range of 10 nM to 100 µM for the recombinant hGrx1-roGFP2 protein for 4 h and
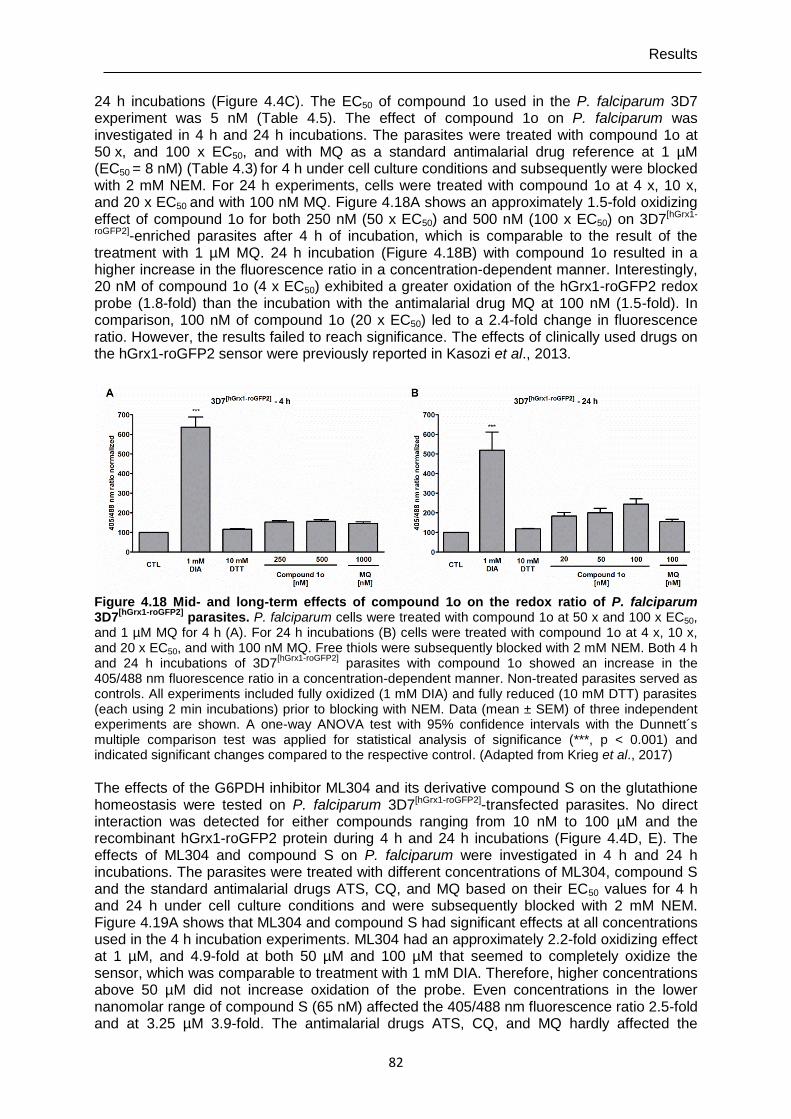
Results
82
24 h incubations (Figure 4.4C). The EC50 of compound 1o used in the P. falciparum 3D7 experiment was 5 nM (Table 4.5). The effect of compound 1o on P. falciparum was investigated in 4 h and 24 h incubations. The parasites were treated with compound 1o at 50 x, and 100 x EC50, and with MQ as a standard antimalarial drug reference at 1 µM (EC50 = 8 nM) (Table 4.3) for 4 h under cell culture conditions and subsequently were blocked with 2 mM NEM. For 24 h experiments, cells were treated with compound 1o at 4 x, 10 x, and 20 x EC50 and with 100 nM MQ. Figure 4.18A shows an approximately 1.5-fold oxidizing effect of compound 1o for both 250 nM (50 x EC50) and 500 nM (100 x EC50) on 3D7[hGrx1-
roGFP2]-enriched parasites after 4 h of incubation, which is comparable to the result of the treatment with 1 µM MQ. 24 h incubation (Figure 4.18B) with compound 1o resulted in a higher increase in the fluorescence ratio in a concentration-dependent manner. Interestingly, 20 nM of compound 1o (4 x EC50) exhibited a greater oxidation of the hGrx1-roGFP2 redox probe (1.8-fold) than the incubation with the antimalarial drug MQ at 100 nM (1.5-fold). In comparison, 100 nM of compound 1o (20 x EC50) led to a 2.4-fold change in fluorescence ratio. However, the results failed to reach significance. The effects of clinically used drugs on the hGrx1-roGFP2 sensor were previously reported in Kasozi et al., 2013.
Figure 4.18 Mid- and long-term effects of compound 1o on the redox ratio of P. falciparum 3D7
[hGrx1-roGFP2] parasites. P. falciparum cells were treated with compound 1o at 50 x and 100 x EC50,
and 1 µM MQ for 4 h (A). For 24 h incubations (B) cells were treated with compound 1o at 4 x, 10 x, and 20 x EC50, and with 100 nM MQ. Free thiols were subsequently blocked with 2 mM NEM. Both 4 h and 24 h incubations of 3D7
[hGrx1-roGFP2] parasites with compound 1o showed an increase in the
405/488 nm fluorescence ratio in a concentration-dependent manner. Non-treated parasites served as controls. All experiments included fully oxidized (1 mM DIA) and fully reduced (10 mM DTT) parasites (each using 2 min incubations) prior to blocking with NEM. Data (mean ± SEM) of three independent experiments are shown. A one-way ANOVA test with 95% confidence intervals with the Dunnett´s multiple comparison test was applied for statistical analysis of significance (***, p < 0.001) and indicated significant changes compared to the respective control. (Adapted from Krieg et al., 2017)
The effects of the G6PDH inhibitor ML304 and its derivative compound S on the glutathione homeostasis were tested on P. falciparum 3D7[hGrx1-roGFP2]-transfected parasites. No direct interaction was detected for either compounds ranging from 10 nM to 100 µM and the recombinant hGrx1-roGFP2 protein during 4 h and 24 h incubations (Figure 4.4D, E). The effects of ML304 and compound S on P. falciparum were investigated in 4 h and 24 h incubations. The parasites were treated with different concentrations of ML304, compound S and the standard antimalarial drugs ATS, CQ, and MQ based on their EC50 values for 4 h and 24 h under cell culture conditions and were subsequently blocked with 2 mM NEM. Figure 4.19A shows that ML304 and compound S had significant effects at all concentrations used in the 4 h incubation experiments. ML304 had an approximately 2.2-fold oxidizing effect at 1 µM, and 4.9-fold at both 50 µM and 100 µM that seemed to completely oxidize the sensor, which was comparable to treatment with 1 mM DIA. Therefore, higher concentrations above 50 µM did not increase oxidation of the probe. Even concentrations in the lower nanomolar range of compound S (65 nM) affected the 405/488 nm fluorescence ratio 2.5-fold and at 3.25 µM 3.9-fold. The antimalarial drugs ATS, CQ, and MQ hardly affected the
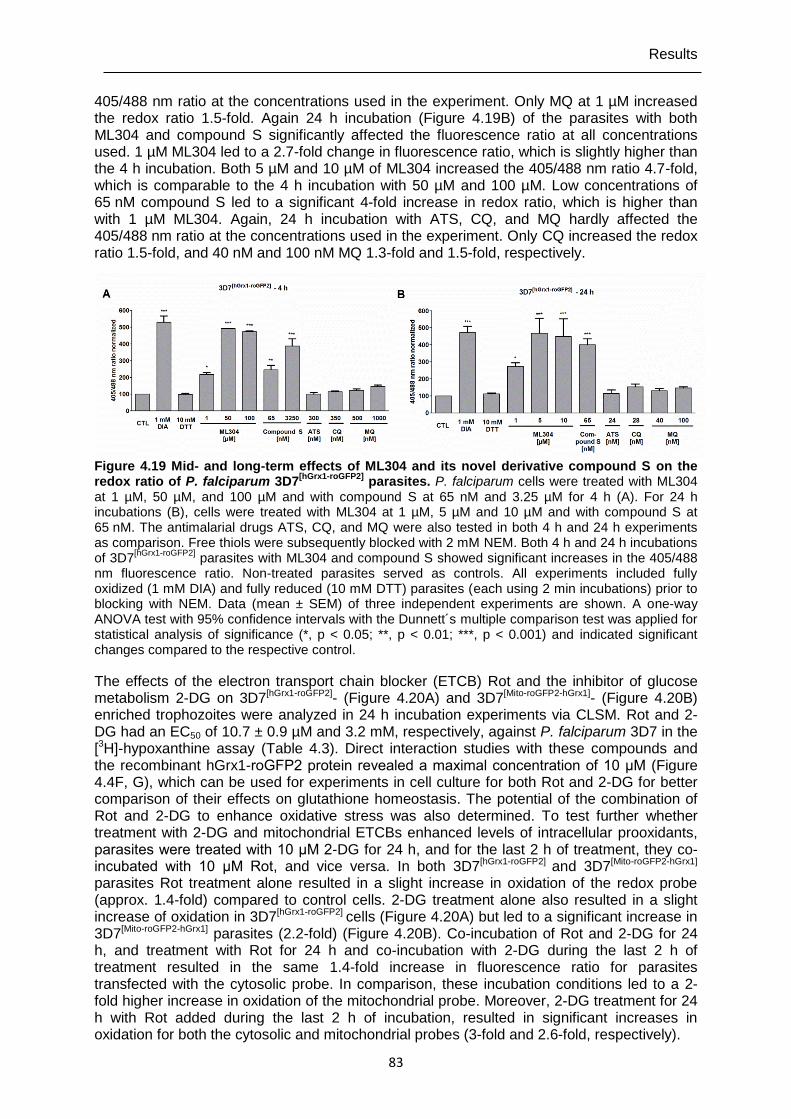
Results
83
405/488 nm ratio at the concentrations used in the experiment. Only MQ at 1 µM increased the redox ratio 1.5-fold. Again 24 h incubation (Figure 4.19B) of the parasites with both ML304 and compound S significantly affected the fluorescence ratio at all concentrations used. 1 µM ML304 led to a 2.7-fold change in fluorescence ratio, which is slightly higher than the 4 h incubation. Both 5 µM and 10 µM of ML304 increased the 405/488 nm ratio 4.7-fold, which is comparable to the 4 h incubation with 50 µM and 100 µM. Low concentrations of 65 nM compound S led to a significant 4-fold increase in redox ratio, which is higher than with 1 µM ML304. Again, 24 h incubation with ATS, CQ, and MQ hardly affected the 405/488 nm ratio at the concentrations used in the experiment. Only CQ increased the redox ratio 1.5-fold, and 40 nM and 100 nM MQ 1.3-fold and 1.5-fold, respectively.
Figure 4.19 Mid- and long-term effects of ML304 and its novel derivative compound S on the redox ratio of P. falciparum 3D7
[hGrx1-roGFP2] parasites. P. falciparum cells were treated with ML304
at 1 µM, 50 µM, and 100 µM and with compound S at 65 nM and 3.25 µM for 4 h (A). For 24 h incubations (B), cells were treated with ML304 at 1 µM, 5 µM and 10 µM and with compound S at 65 nM. The antimalarial drugs ATS, CQ, and MQ were also tested in both 4 h and 24 h experiments as comparison. Free thiols were subsequently blocked with 2 mM NEM. Both 4 h and 24 h incubations of 3D7
[hGrx1-roGFP2] parasites with ML304 and compound S showed significant increases in the 405/488
nm fluorescence ratio. Non-treated parasites served as controls. All experiments included fully oxidized (1 mM DIA) and fully reduced (10 mM DTT) parasites (each using 2 min incubations) prior to blocking with NEM. Data (mean ± SEM) of three independent experiments are shown. A one-way ANOVA test with 95% confidence intervals with the Dunnett´s multiple comparison test was applied for statistical analysis of significance (*, p < 0.05; **, p < 0.01; ***, p < 0.001) and indicated significant changes compared to the respective control.
The effects of the electron transport chain blocker (ETCB) Rot and the inhibitor of glucose metabolism 2-DG on 3D7[hGrx1-roGFP2]- (Figure 4.20A) and 3D7[Mito-roGFP2-hGrx1]- (Figure 4.20B) enriched trophozoites were analyzed in 24 h incubation experiments via CLSM. Rot and 2-DG had an EC50 of 10.7 ± 0.9 µM and 3.2 mM, respectively, against P. falciparum 3D7 in the [3H]-hypoxanthine assay (Table 4.3). Direct interaction studies with these compounds and the recombinant hGrx1-roGFP2 protein revealed a maximal concentration of 10 μM (Figure 4.4F, G), which can be used for experiments in cell culture for both Rot and 2-DG for better comparison of their effects on glutathione homeostasis. The potential of the combination of Rot and 2-DG to enhance oxidative stress was also determined. To test further whether treatment with 2-DG and mitochondrial ETCBs enhanced levels of intracellular prooxidants, parasites were treated with 10 μM 2-DG for 24 h, and for the last 2 h of treatment, they co-incubated with 10 μM Rot, and vice versa. In both 3D7[hGrx1-roGFP2] and 3D7[Mito-roGFP2-hGrx1] parasites Rot treatment alone resulted in a slight increase in oxidation of the redox probe (approx. 1.4-fold) compared to control cells. 2-DG treatment alone also resulted in a slight increase of oxidation in 3D7[hGrx1-roGFP2] cells (Figure 4.20A) but led to a significant increase in 3D7[Mito-roGFP2-hGrx1] parasites (2.2-fold) (Figure 4.20B). Co-incubation of Rot and 2-DG for 24 h, and treatment with Rot for 24 h and co-incubation with 2-DG during the last 2 h of treatment resulted in the same 1.4-fold increase in fluorescence ratio for parasites transfected with the cytosolic probe. In comparison, these incubation conditions led to a 2-fold higher increase in oxidation of the mitochondrial probe. Moreover, 2-DG treatment for 24 h with Rot added during the last 2 h of incubation, resulted in significant increases in oxidation for both the cytosolic and mitochondrial probes (3-fold and 2.6-fold, respectively).
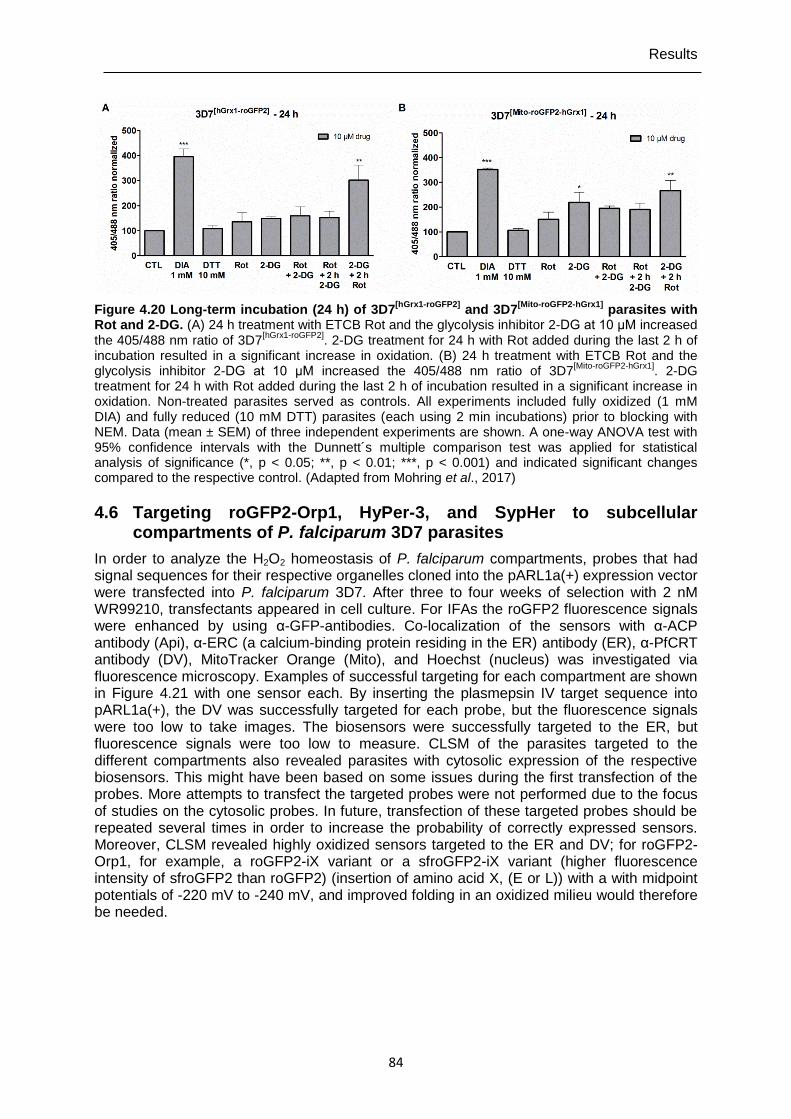
Results
84
Figure 4.20 Long-term incubation (24 h) of 3D7[hGrx1-roGFP2]
and 3D7[Mito-roGFP2-hGrx1]
parasites with Rot and 2-DG. (A) 24 h treatment with ETCB Rot and the glycolysis inhibitor 2-DG at 10 μM increased the 405/488 nm ratio of 3D7
[hGrx1-roGFP2]. 2-DG treatment for 24 h with Rot added during the last 2 h of
incubation resulted in a significant increase in oxidation. (B) 24 h treatment with ETCB Rot and the glycolysis inhibitor 2-DG at 10 μM increased the 405/488 nm ratio of 3D7
[Mito-roGFP2-hGrx1]. 2-DG
treatment for 24 h with Rot added during the last 2 h of incubation resulted in a significant increase in oxidation. Non-treated parasites served as controls. All experiments included fully oxidized (1 mM DIA) and fully reduced (10 mM DTT) parasites (each using 2 min incubations) prior to blocking with NEM. Data (mean ± SEM) of three independent experiments are shown. A one-way ANOVA test with 95% confidence intervals with the Dunnett´s multiple comparison test was applied for statistical analysis of significance (*, p < 0.05; **, p < 0.01; ***, p < 0.001) and indicated significant changes compared to the respective control. (Adapted from Mohring et al., 2017)
4.6 Targeting roGFP2-Orp1, HyPer-3, and SypHer to subcellular compartments of P. falciparum 3D7 parasites
In order to analyze the H2O2 homeostasis of P. falciparum compartments, probes that had signal sequences for their respective organelles cloned into the pARL1a(+) expression vector were transfected into P. falciparum 3D7. After three to four weeks of selection with 2 nM WR99210, transfectants appeared in cell culture. For IFAs the roGFP2 fluorescence signals were enhanced by using α-GFP-antibodies. Co-localization of the sensors with α-ACP antibody (Api), α-ERC (a calcium-binding protein residing in the ER) antibody (ER), α-PfCRT antibody (DV), MitoTracker Orange (Mito), and Hoechst (nucleus) was investigated via fluorescence microscopy. Examples of successful targeting for each compartment are shown in Figure 4.21 with one sensor each. By inserting the plasmepsin IV target sequence into pARL1a(+), the DV was successfully targeted for each probe, but the fluorescence signals were too low to take images. The biosensors were successfully targeted to the ER, but fluorescence signals were too low to measure. CLSM of the parasites targeted to the different compartments also revealed parasites with cytosolic expression of the respective biosensors. This might have been based on some issues during the first transfection of the probes. More attempts to transfect the targeted probes were not performed due to the focus of studies on the cytosolic probes. In future, transfection of these targeted probes should be repeated several times in order to increase the probability of correctly expressed sensors. Moreover, CLSM revealed highly oxidized sensors targeted to the ER and DV; for roGFP2-Orp1, for example, a roGFP2-iX variant or a sfroGFP2-iX variant (higher fluorescence intensity of sfroGFP2 than roGFP2) (insertion of amino acid X, (E or L)) with a with midpoint potentials of -220 mV to -240 mV, and improved folding in an oxidized milieu would therefore be needed.
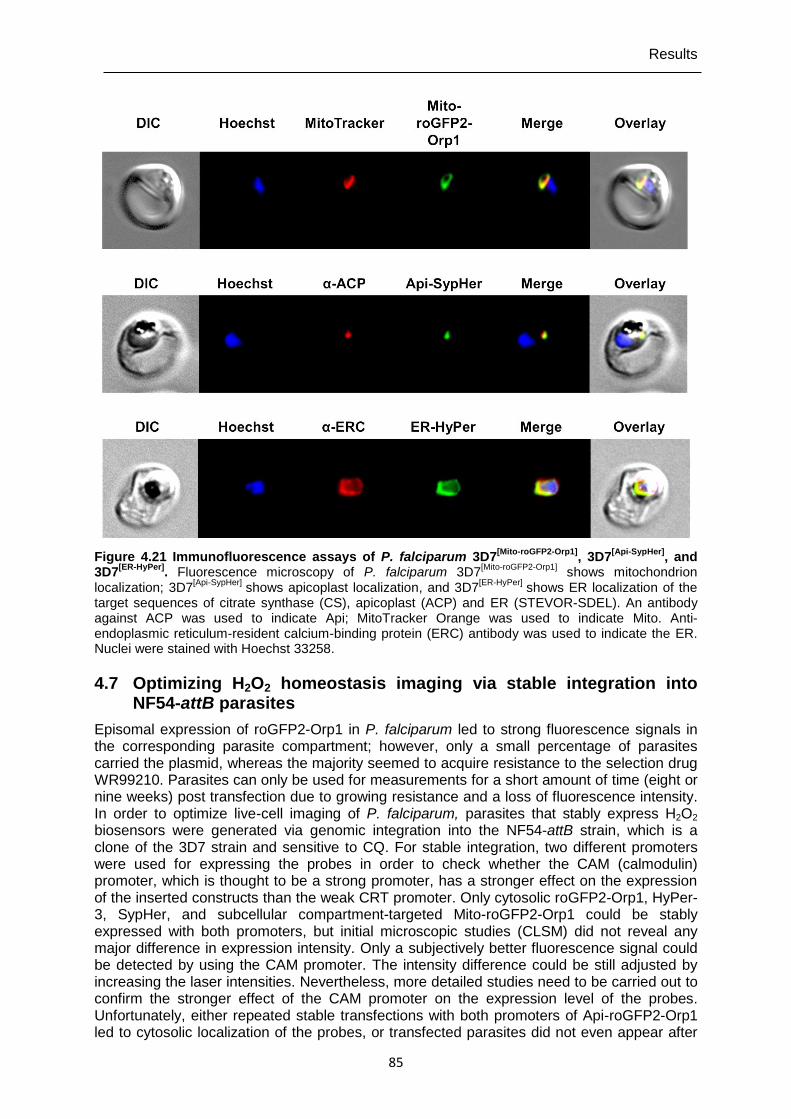
Results
85
Figure 4.21 Immunofluorescence assays of P. falciparum 3D7[Mito-roGFP2-Orp1]
, 3D7[Api-SypHer]
, and 3D7
[ER-HyPer]. Fluorescence microscopy of P. falciparum 3D7
[Mito-roGFP2-Orp1] shows mitochondrion
localization; 3D7[Api-SypHer]
shows apicoplast localization, and 3D7[ER-HyPer]
shows ER localization of the target sequences of citrate synthase (CS), apicoplast (ACP) and ER (STEVOR-SDEL). An antibody against ACP was used to indicate Api; MitoTracker Orange was used to indicate Mito. Anti-endoplasmic reticulum-resident calcium-binding protein (ERC) antibody was used to indicate the ER. Nuclei were stained with Hoechst 33258.
4.7 Optimizing H2O2 homeostasis imaging via stable integration into NF54-attB parasites
Episomal expression of roGFP2-Orp1 in P. falciparum led to strong fluorescence signals in the corresponding parasite compartment; however, only a small percentage of parasites carried the plasmid, whereas the majority seemed to acquire resistance to the selection drug WR99210. Parasites can only be used for measurements for a short amount of time (eight or nine weeks) post transfection due to growing resistance and a loss of fluorescence intensity. In order to optimize live-cell imaging of P. falciparum, parasites that stably express H2O2 biosensors were generated via genomic integration into the NF54-attB strain, which is a clone of the 3D7 strain and sensitive to CQ. For stable integration, two different promoters were used for expressing the probes in order to check whether the CAM (calmodulin) promoter, which is thought to be a strong promoter, has a stronger effect on the expression of the inserted constructs than the weak CRT promoter. Only cytosolic roGFP2-Orp1, HyPer-3, SypHer, and subcellular compartment-targeted Mito-roGFP2-Orp1 could be stably expressed with both promoters, but initial microscopic studies (CLSM) did not reveal any major difference in expression intensity. Only a subjectively better fluorescence signal could be detected by using the CAM promoter. The intensity difference could be still adjusted by increasing the laser intensities. Nevertheless, more detailed studies need to be carried out to confirm the stronger effect of the CAM promoter on the expression level of the probes. Unfortunately, either repeated stable transfections with both promoters of Api-roGFP2-Orp1 led to cytosolic localization of the probes, or transfected parasites did not even appear after
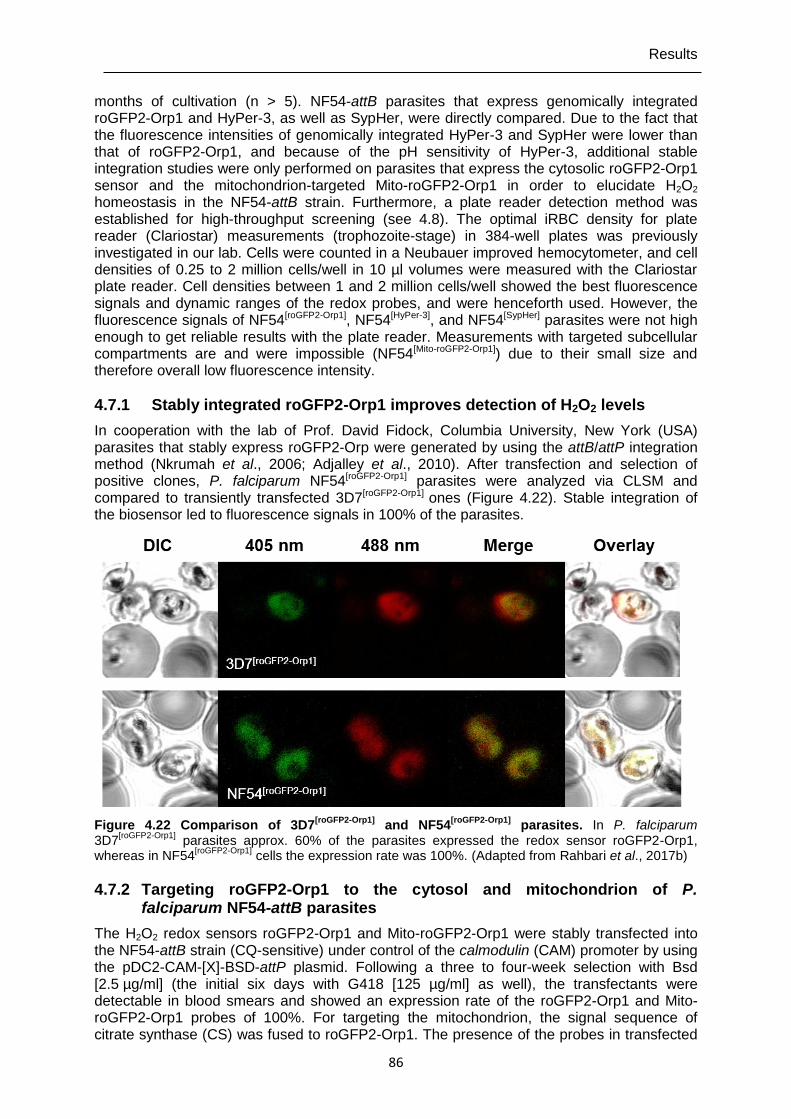
Results
86
months of cultivation (n > 5). NF54-attB parasites that express genomically integrated roGFP2-Orp1 and HyPer-3, as well as SypHer, were directly compared. Due to the fact that the fluorescence intensities of genomically integrated HyPer-3 and SypHer were lower than that of roGFP2-Orp1, and because of the pH sensitivity of HyPer-3, additional stable integration studies were only performed on parasites that express the cytosolic roGFP2-Orp1 sensor and the mitochondrion-targeted Mito-roGFP2-Orp1 in order to elucidate H2O2 homeostasis in the NF54-attB strain. Furthermore, a plate reader detection method was established for high-throughput screening (see 4.8). The optimal iRBC density for plate reader (Clariostar) measurements (trophozoite-stage) in 384-well plates was previously investigated in our lab. Cells were counted in a Neubauer improved hemocytometer, and cell densities of 0.25 to 2 million cells/well in 10 µl volumes were measured with the Clariostar plate reader. Cell densities between 1 and 2 million cells/well showed the best fluorescence signals and dynamic ranges of the redox probes, and were henceforth used. However, the fluorescence signals of NF54[roGFP2-Orp1], NF54[HyPer-3], and NF54[SypHer] parasites were not high enough to get reliable results with the plate reader. Measurements with targeted subcellular compartments are and were impossible (NF54[Mito-roGFP2-Orp1]) due to their small size and therefore overall low fluorescence intensity.
4.7.1 Stably integrated roGFP2-Orp1 improves detection of H2O2 levels
In cooperation with the lab of Prof. David Fidock, Columbia University, New York (USA) parasites that stably express roGFP2-Orp were generated by using the attB/attP integration method (Nkrumah et al., 2006; Adjalley et al., 2010). After transfection and selection of positive clones, P. falciparum NF54[roGFP2-Orp1] parasites were analyzed via CLSM and compared to transiently transfected 3D7[roGFP2-Orp1] ones (Figure 4.22). Stable integration of the biosensor led to fluorescence signals in 100% of the parasites.
Figure 4.22 Comparison of 3D7[roGFP2-Orp1]
and NF54[roGFP2-Orp1]
parasites. In P. falciparum 3D7
[roGFP2-Orp1] parasites approx. 60% of the parasites expressed the redox sensor roGFP2-Orp1,
whereas in NF54[roGFP2-Orp1]
cells the expression rate was 100%. (Adapted from Rahbari et al., 2017b)
4.7.2 Targeting roGFP2-Orp1 to the cytosol and mitochondrion of P. falciparum NF54-attB parasites
The H2O2 redox sensors roGFP2-Orp1 and Mito-roGFP2-Orp1 were stably transfected into the NF54-attB strain (CQ-sensitive) under control of the calmodulin (CAM) promoter by using the pDC2-CAM-[X]-BSD-attP plasmid. Following a three to four-week selection with Bsd [2.5 µg/ml] (the initial six days with G418 [125 µg/ml] as well), the transfectants were detectable in blood smears and showed an expression rate of the roGFP2-Orp1 and Mito-roGFP2-Orp1 probes of 100%. For targeting the mitochondrion, the signal sequence of citrate synthase (CS) was fused to roGFP2-Orp1. The presence of the probes in transfected
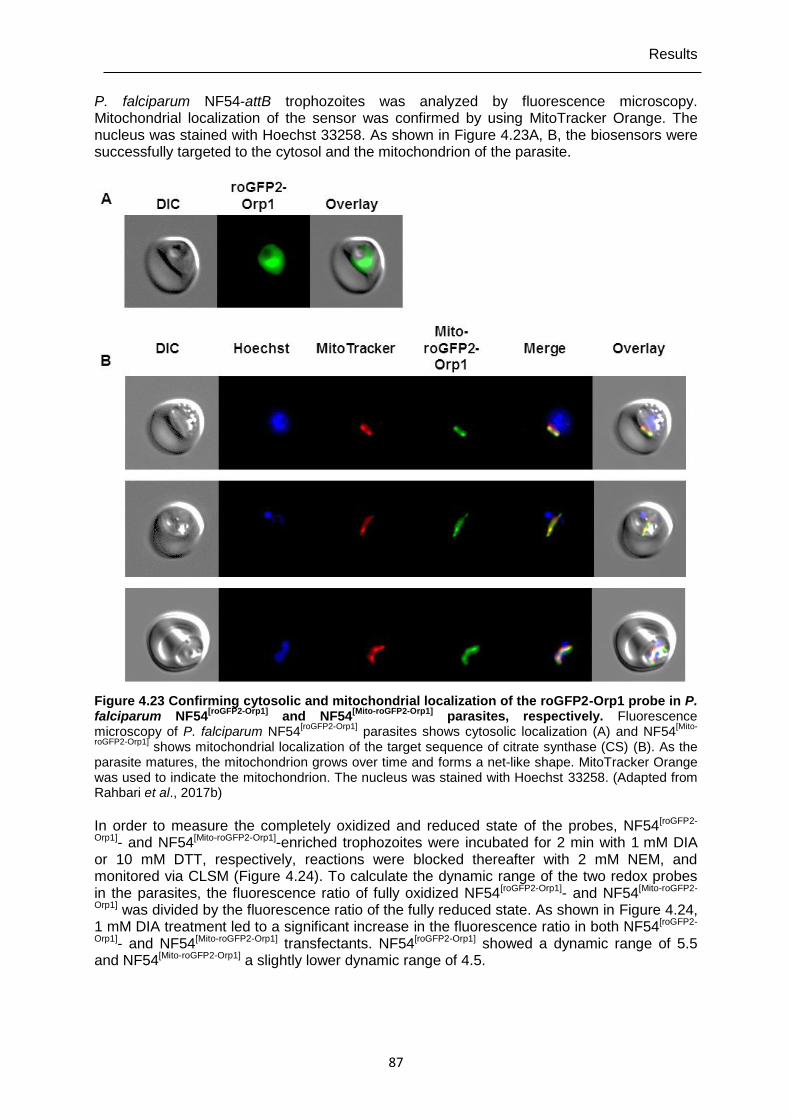
Results
87
P. falciparum NF54-attB trophozoites was analyzed by fluorescence microscopy. Mitochondrial localization of the sensor was confirmed by using MitoTracker Orange. The nucleus was stained with Hoechst 33258. As shown in Figure 4.23A, B, the biosensors were successfully targeted to the cytosol and the mitochondrion of the parasite.
Figure 4.23 Confirming cytosolic and mitochondrial localization of the roGFP2-Orp1 probe in P. falciparum NF54
[roGFP2-Orp1] and NF54
[Mito-roGFP2-Orp1] parasites, respectively. Fluorescence
microscopy of P. falciparum NF54[roGFP2-Orp1]
parasites shows cytosolic localization (A) and NF54[Mito-
roGFP2-Orp1] shows mitochondrial localization of the target sequence of citrate synthase (CS) (B). As the
parasite matures, the mitochondrion grows over time and forms a net-like shape. MitoTracker Orange was used to indicate the mitochondrion. The nucleus was stained with Hoechst 33258. (Adapted from Rahbari et al., 2017b)
In order to measure the completely oxidized and reduced state of the probes, NF54[roGFP2-
Orp1]- and NF54[Mito-roGFP2-Orp1]-enriched trophozoites were incubated for 2 min with 1 mM DIA or 10 mM DTT, respectively, reactions were blocked thereafter with 2 mM NEM, and monitored via CLSM (Figure 4.24). To calculate the dynamic range of the two redox probes in the parasites, the fluorescence ratio of fully oxidized NF54[roGFP2-Orp1]- and NF54[Mito-roGFP2-
Orp1] was divided by the fluorescence ratio of the fully reduced state. As shown in Figure 4.24, 1 mM DIA treatment led to a significant increase in the fluorescence ratio in both NF54[roGFP2-
Orp1]- and NF54[Mito-roGFP2-Orp1] transfectants. NF54[roGFP2-Orp1] showed a dynamic range of 5.5 and NF54[Mito-roGFP2-Orp1] a slightly lower dynamic range of 4.5.
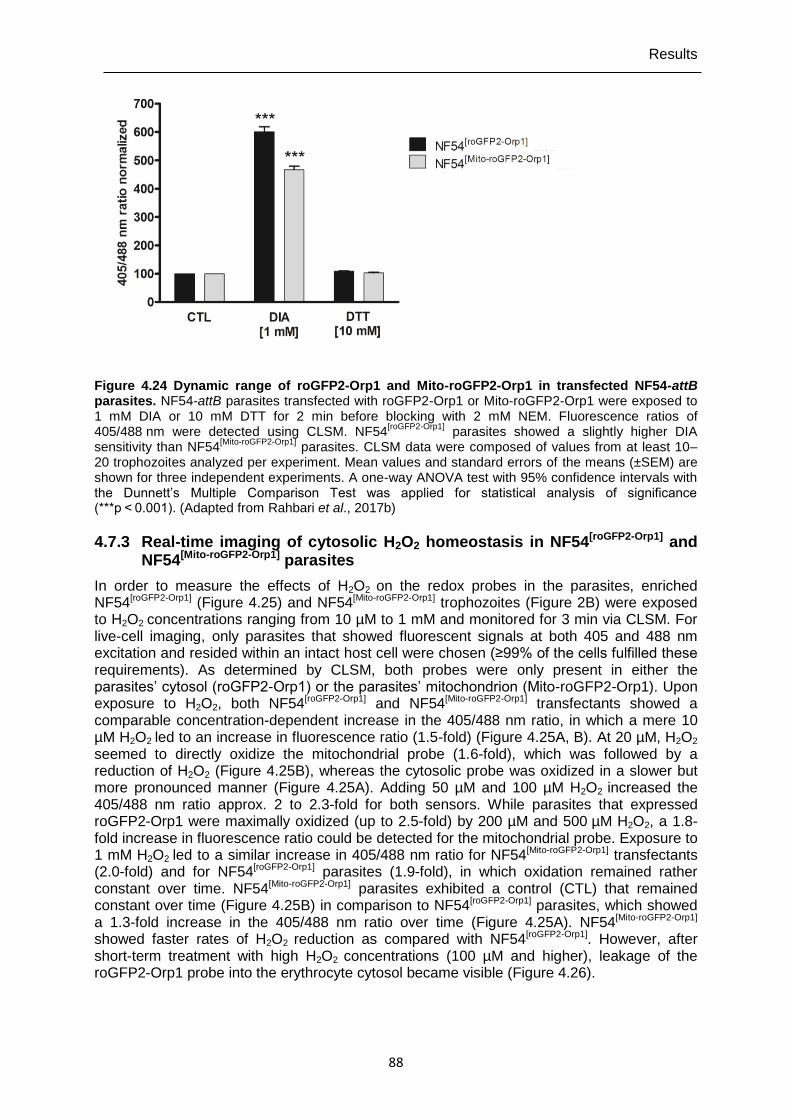
Results
88
Figure 4.24 Dynamic range of roGFP2-Orp1 and Mito-roGFP2-Orp1 in transfected NF54-attB parasites. NF54-attB parasites transfected with roGFP2-Orp1 or Mito-roGFP2-Orp1 were exposed to 1 mM DIA or 10 mM DTT for 2 min before blocking with 2 mM NEM. Fluorescence ratios of 405/488 nm were detected using CLSM. NF54
[roGFP2-Orp1] parasites showed a slightly higher DIA
sensitivity than NF54[Mito-roGFP2-Orp1]
parasites. CLSM data were composed of values from at least 10–20 trophozoites analyzed per experiment. Mean values and standard errors of the means (±SEM) are shown for three independent experiments. A one-way ANOVA test with 95% confidence intervals with the Dunnett’s Multiple Comparison Test was applied for statistical analysis of significance (***p < 0.001). (Adapted from Rahbari et al., 2017b)
4.7.3 Real-time imaging of cytosolic H2O2 homeostasis in NF54[roGFP2-Orp1] and NF54[Mito-roGFP2-Orp1] parasites
In order to measure the effects of H2O2 on the redox probes in the parasites, enriched NF54[roGFP2-Orp1] (Figure 4.25) and NF54[Mito-roGFP2-Orp1] trophozoites (Figure 2B) were exposed to H2O2 concentrations ranging from 10 µM to 1 mM and monitored for 3 min via CLSM. For live-cell imaging, only parasites that showed fluorescent signals at both 405 and 488 nm excitation and resided within an intact host cell were chosen (≥99% of the cells fulfilled these requirements). As determined by CLSM, both probes were only present in either the parasites’ cytosol (roGFP2-Orp1) or the parasites’ mitochondrion (Mito-roGFP2-Orp1). Upon exposure to H2O2, both NF54[roGFP2-Orp1] and NF54[Mito-roGFP2-Orp1] transfectants showed a comparable concentration-dependent increase in the 405/488 nm ratio, in which a mere 10 µM H2O2 led to an increase in fluorescence ratio (1.5-fold) (Figure 4.25A, B). At 20 µM, H2O2
seemed to directly oxidize the mitochondrial probe (1.6-fold), which was followed by a reduction of H2O2 (Figure 4.25B), whereas the cytosolic probe was oxidized in a slower but more pronounced manner (Figure 4.25A). Adding 50 µM and 100 µM H2O2 increased the 405/488 nm ratio approx. 2 to 2.3-fold for both sensors. While parasites that expressed roGFP2-Orp1 were maximally oxidized (up to 2.5-fold) by 200 µM and 500 µM H2O2, a 1.8-fold increase in fluorescence ratio could be detected for the mitochondrial probe. Exposure to 1 mM H2O2 led to a similar increase in 405/488 nm ratio for NF54[Mito-roGFP2-Orp1] transfectants (2.0-fold) and for NF54[roGFP2-Orp1] parasites (1.9-fold), in which oxidation remained rather constant over time. NF54[Mito-roGFP2-Orp1] parasites exhibited a control (CTL) that remained constant over time (Figure 4.25B) in comparison to NF54[roGFP2-Orp1] parasites, which showed a 1.3-fold increase in the 405/488 nm ratio over time (Figure 4.25A). NF54[Mito-roGFP2-Orp1] showed faster rates of H2O2 reduction as compared with NF54[roGFP2-Orp1]. However, after short-term treatment with high H2O2 concentrations (100 µM and higher), leakage of the roGFP2-Orp1 probe into the erythrocyte cytosol became visible (Figure 4.26).
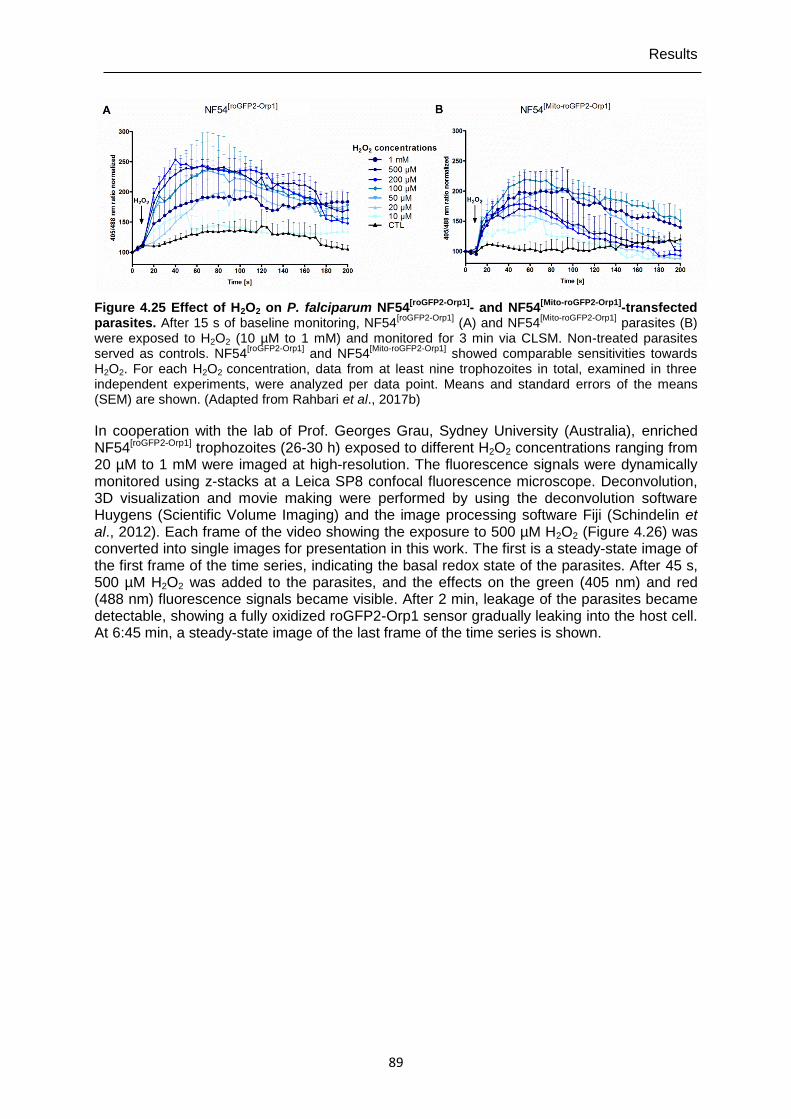
Results
89
Figure 4.25 Effect of H2O2 on P. falciparum NF54[roGFP2-Orp1]
- and NF54[Mito-roGFP2-Orp1]
-transfected parasites. After 15 s of baseline monitoring, NF54
[roGFP2-Orp1] (A) and NF54
[Mito-roGFP2-Orp1] parasites (B)
were exposed to H2O2 (10 µM to 1 mM) and monitored for 3 min via CLSM. Non-treated parasites served as controls. NF54
[roGFP2-Orp1] and NF54
[Mito-roGFP2-Orp1] showed comparable sensitivities towards
H2O2. For each H2O2 concentration, data from at least nine trophozoites in total, examined in three independent experiments, were analyzed per data point. Means and standard errors of the means (SEM) are shown. (Adapted from Rahbari et al., 2017b)
In cooperation with the lab of Prof. Georges Grau, Sydney University (Australia), enriched NF54[roGFP2-Orp1] trophozoites (26-30 h) exposed to different H2O2 concentrations ranging from 20 µM to 1 mM were imaged at high-resolution. The fluorescence signals were dynamically monitored using z-stacks at a Leica SP8 confocal fluorescence microscope. Deconvolution, 3D visualization and movie making were performed by using the deconvolution software Huygens (Scientific Volume Imaging) and the image processing software Fiji (Schindelin et al., 2012). Each frame of the video showing the exposure to 500 µM H2O2 (Figure 4.26) was converted into single images for presentation in this work. The first is a steady-state image of the first frame of the time series, indicating the basal redox state of the parasites. After 45 s, 500 µM H2O2 was added to the parasites, and the effects on the green (405 nm) and red (488 nm) fluorescence signals became visible. After 2 min, leakage of the parasites became detectable, showing a fully oxidized roGFP2-Orp1 sensor gradually leaking into the host cell. At 6:45 min, a steady-state image of the last frame of the time series is shown.
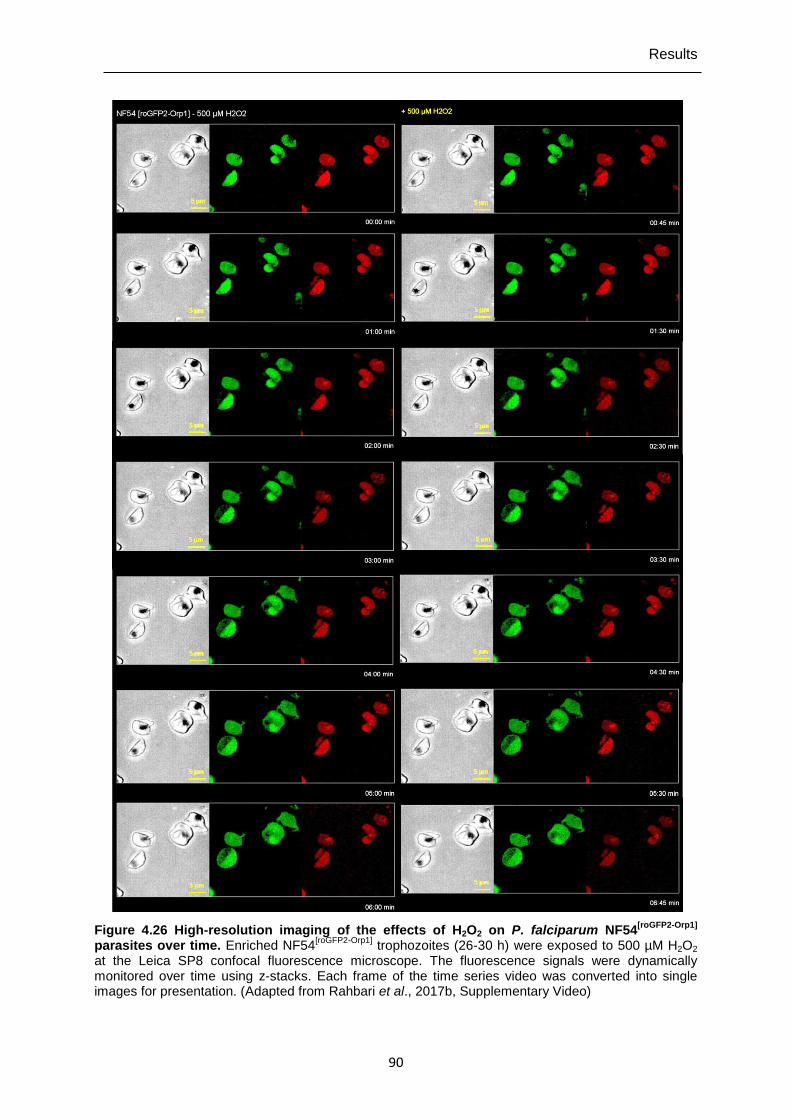
Results
90
Figure 4.26 High-resolution imaging of the effects of H2O2 on P. falciparum NF54[roGFP2-Orp1]
parasites over time. Enriched NF54
[roGFP2-Orp1] trophozoites (26-30 h) were exposed to 500 µM H2O2
at the Leica SP8 confocal fluorescence microscope. The fluorescence signals were dynamically monitored over time using z-stacks. Each frame of the time series video was converted into single images for presentation. (Adapted from Rahbari et al., 2017b, Supplementary Video)
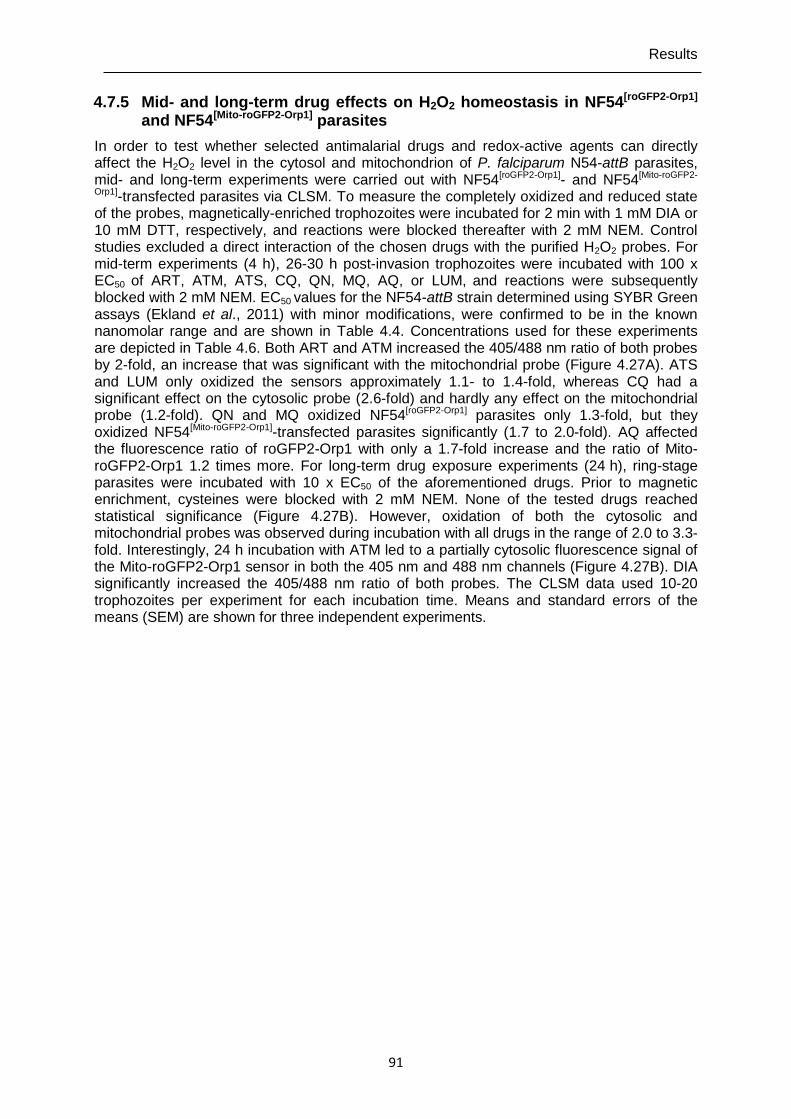
Results
91
4.7.5 Mid- and long-term drug effects on H2O2 homeostasis in NF54[roGFP2-Orp1] and NF54[Mito-roGFP2-Orp1] parasites
In order to test whether selected antimalarial drugs and redox-active agents can directly affect the H2O2 level in the cytosol and mitochondrion of P. falciparum N54-attB parasites, mid- and long-term experiments were carried out with NF54[roGFP2-Orp1]- and NF54[Mito-roGFP2-
Orp1]-transfected parasites via CLSM. To measure the completely oxidized and reduced state of the probes, magnetically-enriched trophozoites were incubated for 2 min with 1 mM DIA or 10 mM DTT, respectively, and reactions were blocked thereafter with 2 mM NEM. Control studies excluded a direct interaction of the chosen drugs with the purified H2O2 probes. For mid-term experiments (4 h), 26-30 h post-invasion trophozoites were incubated with 100 x EC50 of ART, ATM, ATS, CQ, QN, MQ, AQ, or LUM, and reactions were subsequently blocked with 2 mM NEM. EC50 values for the NF54-attB strain determined using SYBR Green assays (Ekland et al., 2011) with minor modifications, were confirmed to be in the known nanomolar range and are shown in Table 4.4. Concentrations used for these experiments are depicted in Table 4.6. Both ART and ATM increased the 405/488 nm ratio of both probes by 2-fold, an increase that was significant with the mitochondrial probe (Figure 4.27A). ATS and LUM only oxidized the sensors approximately 1.1- to 1.4-fold, whereas CQ had a significant effect on the cytosolic probe (2.6-fold) and hardly any effect on the mitochondrial probe (1.2-fold). QN and MQ oxidized NF54[roGFP2-Orp1] parasites only 1.3-fold, but they oxidized NF54[Mito-roGFP2-Orp1]-transfected parasites significantly (1.7 to 2.0-fold). AQ affected the fluorescence ratio of roGFP2-Orp1 with only a 1.7-fold increase and the ratio of Mito-roGFP2-Orp1 1.2 times more. For long-term drug exposure experiments (24 h), ring-stage parasites were incubated with 10 x EC50 of the aforementioned drugs. Prior to magnetic enrichment, cysteines were blocked with 2 mM NEM. None of the tested drugs reached statistical significance (Figure 4.27B). However, oxidation of both the cytosolic and mitochondrial probes was observed during incubation with all drugs in the range of 2.0 to 3.3-fold. Interestingly, 24 h incubation with ATM led to a partially cytosolic fluorescence signal of the Mito-roGFP2-Orp1 sensor in both the 405 nm and 488 nm channels (Figure 4.27B). DIA significantly increased the 405/488 nm ratio of both probes. The CLSM data used 10-20 trophozoites per experiment for each incubation time. Means and standard errors of the means (SEM) are shown for three independent experiments.
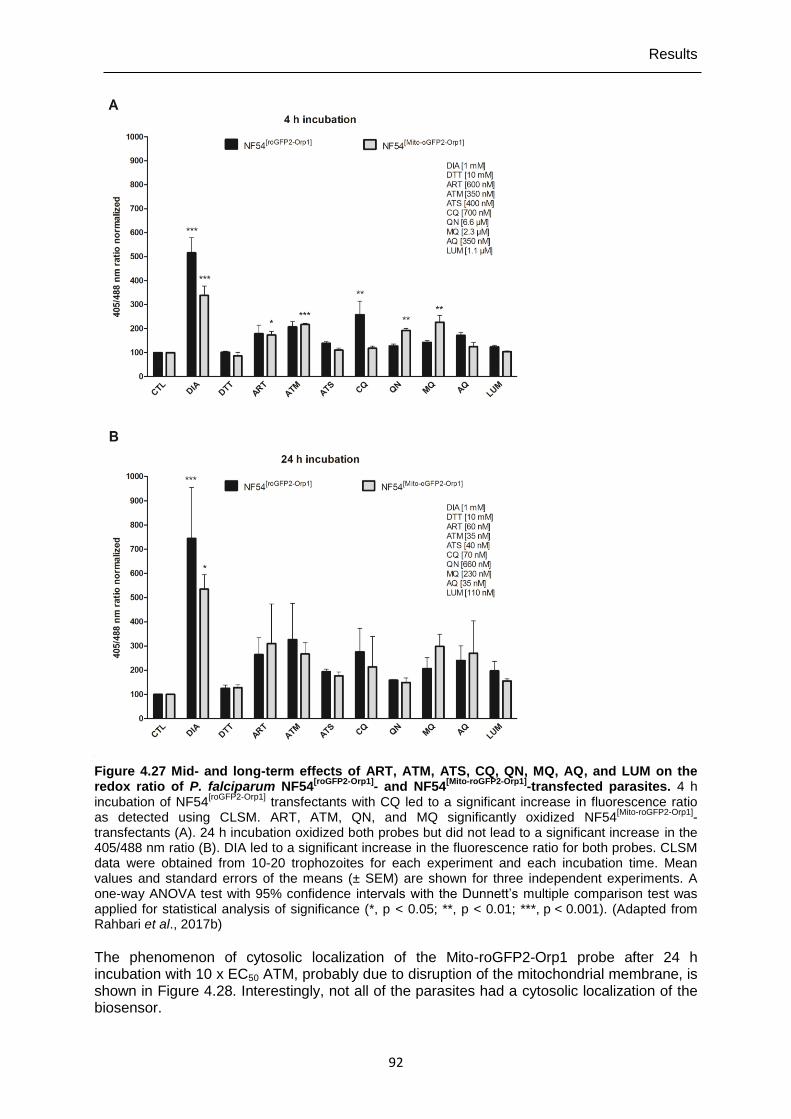
Results
92
Figure 4.27 Mid- and long-term effects of ART, ATM, ATS, CQ, QN, MQ, AQ, and LUM on the redox ratio of P. falciparum NF54
[roGFP2-Orp1]- and NF54
[Mito-roGFP2-Orp1]-transfected parasites. 4 h
incubation of NF54[roGFP2-Orp1]
transfectants with CQ led to a significant increase in fluorescence ratio as detected using CLSM. ART, ATM, QN, and MQ significantly oxidized NF54
[Mito-roGFP2-Orp1]-
transfectants (A). 24 h incubation oxidized both probes but did not lead to a significant increase in the 405/488 nm ratio (B). DIA led to a significant increase in the fluorescence ratio for both probes. CLSM data were obtained from 10-20 trophozoites for each experiment and each incubation time. Mean values and standard errors of the means (± SEM) are shown for three independent experiments. A one-way ANOVA test with 95% confidence intervals with the Dunnett’s multiple comparison test was applied for statistical analysis of significance (*, p < 0.05; **, p < 0.01; ***, p < 0.001). (Adapted from Rahbari et al., 2017b)
The phenomenon of cytosolic localization of the Mito-roGFP2-Orp1 probe after 24 h incubation with 10 x EC50 ATM, probably due to disruption of the mitochondrial membrane, is shown in Figure 4.28. Interestingly, not all of the parasites had a cytosolic localization of the biosensor.
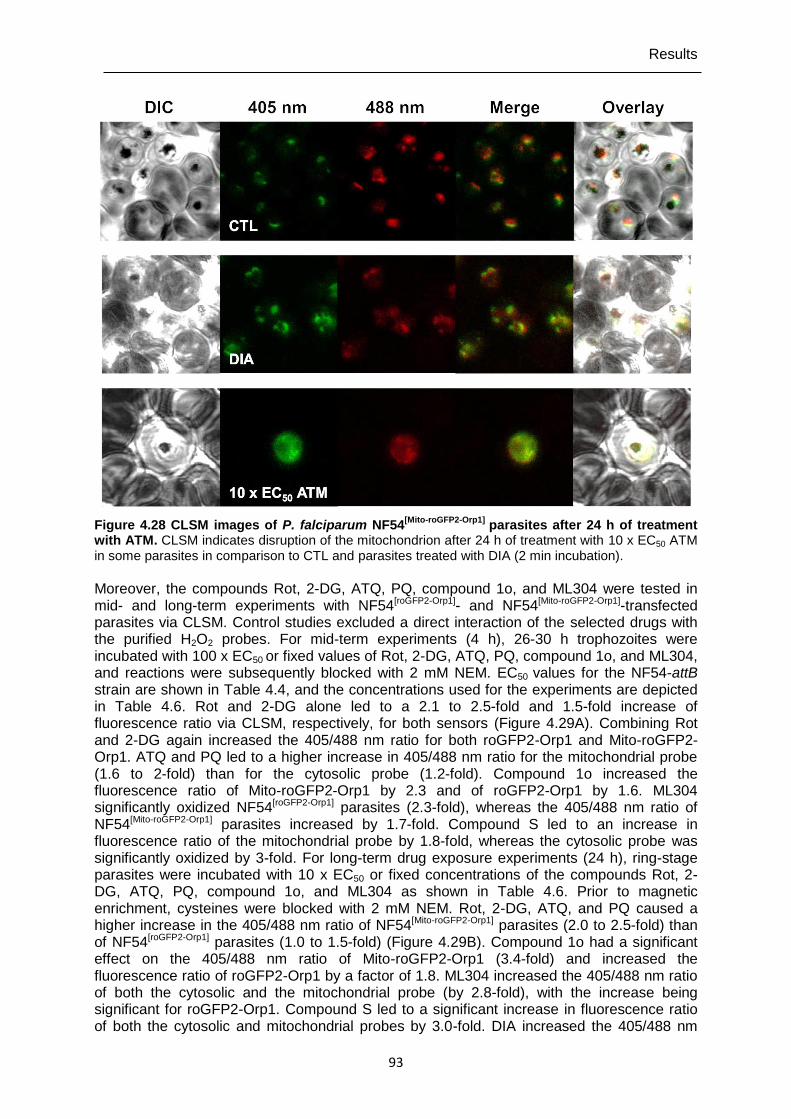
Results
93
Figure 4.28 CLSM images of P. falciparum NF54[Mito-roGFP2-Orp1]
parasites after 24 h of treatment with ATM. CLSM indicates disruption of the mitochondrion after 24 h of treatment with 10 x EC50 ATM in some parasites in comparison to CTL and parasites treated with DIA (2 min incubation).
Moreover, the compounds Rot, 2-DG, ATQ, PQ, compound 1o, and ML304 were tested in mid- and long-term experiments with NF54[roGFP2-Orp1]- and NF54[Mito-roGFP2-Orp1]-transfected parasites via CLSM. Control studies excluded a direct interaction of the selected drugs with the purified H2O2 probes. For mid-term experiments (4 h), 26-30 h trophozoites were incubated with 100 x EC50 or fixed values of Rot, 2-DG, ATQ, PQ, compound 1o, and ML304, and reactions were subsequently blocked with 2 mM NEM. EC50 values for the NF54-attB strain are shown in Table 4.4, and the concentrations used for the experiments are depicted in Table 4.6. Rot and 2-DG alone led to a 2.1 to 2.5-fold and 1.5-fold increase of fluorescence ratio via CLSM, respectively, for both sensors (Figure 4.29A). Combining Rot and 2-DG again increased the 405/488 nm ratio for both roGFP2-Orp1 and Mito-roGFP2-Orp1. ATQ and PQ led to a higher increase in 405/488 nm ratio for the mitochondrial probe (1.6 to 2-fold) than for the cytosolic probe (1.2-fold). Compound 1o increased the fluorescence ratio of Mito-roGFP2-Orp1 by 2.3 and of roGFP2-Orp1 by 1.6. ML304 significantly oxidized NF54[roGFP2-Orp1] parasites (2.3-fold), whereas the 405/488 nm ratio of NF54[Mito-roGFP2-Orp1] parasites increased by 1.7-fold. Compound S led to an increase in fluorescence ratio of the mitochondrial probe by 1.8-fold, whereas the cytosolic probe was significantly oxidized by 3-fold. For long-term drug exposure experiments (24 h), ring-stage parasites were incubated with 10 x EC50 or fixed concentrations of the compounds Rot, 2-DG, ATQ, PQ, compound 1o, and ML304 as shown in Table 4.6. Prior to magnetic enrichment, cysteines were blocked with 2 mM NEM. Rot, 2-DG, ATQ, and PQ caused a higher increase in the 405/488 nm ratio of NF54[Mito-roGFP2-Orp1] parasites (2.0 to 2.5-fold) than of NF54[roGFP2-Orp1] parasites (1.0 to 1.5-fold) (Figure 4.29B). Compound 1o had a significant effect on the 405/488 nm ratio of Mito-roGFP2-Orp1 (3.4-fold) and increased the fluorescence ratio of roGFP2-Orp1 by a factor of 1.8. ML304 increased the 405/488 nm ratio of both the cytosolic and the mitochondrial probe (by 2.8-fold), with the increase being significant for roGFP2-Orp1. Compound S led to a significant increase in fluorescence ratio of both the cytosolic and mitochondrial probes by 3.0-fold. DIA increased the 405/488 nm
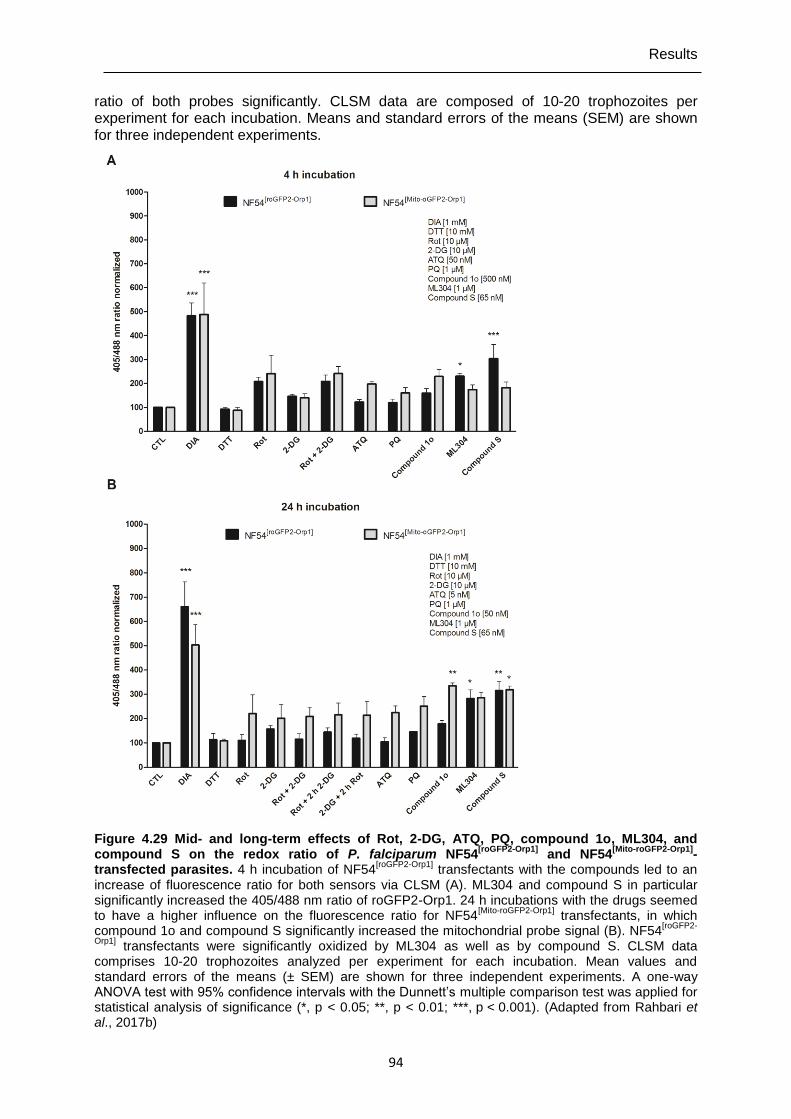
Results
94
ratio of both probes significantly. CLSM data are composed of 10-20 trophozoites per experiment for each incubation. Means and standard errors of the means (SEM) are shown for three independent experiments.
Figure 4.29 Mid- and long-term effects of Rot, 2-DG, ATQ, PQ, compound 1o, ML304, and compound S on the redox ratio of P. falciparum NF54
[roGFP2-Orp1] and NF54
[Mito-roGFP2-Orp1]-
transfected parasites. 4 h incubation of NF54[roGFP2-Orp1]
transfectants with the compounds led to an increase of fluorescence ratio for both sensors via CLSM (A). ML304 and compound S in particular significantly increased the 405/488 nm ratio of roGFP2-Orp1. 24 h incubations with the drugs seemed to have a higher influence on the fluorescence ratio for NF54
[Mito-roGFP2-Orp1] transfectants, in which
compound 1o and compound S significantly increased the mitochondrial probe signal (B). NF54[roGFP2-
Orp1] transfectants were significantly oxidized by ML304 as well as by compound S. CLSM data
comprises 10-20 trophozoites analyzed per experiment for each incubation. Mean values and standard errors of the means (± SEM) are shown for three independent experiments. A one-way ANOVA test with 95% confidence intervals with the Dunnett’s multiple comparison test was applied for statistical analysis of significance (*, p < 0.05; **, p < 0.01; ***, p < 0.001). (Adapted from Rahbari et al., 2017b)
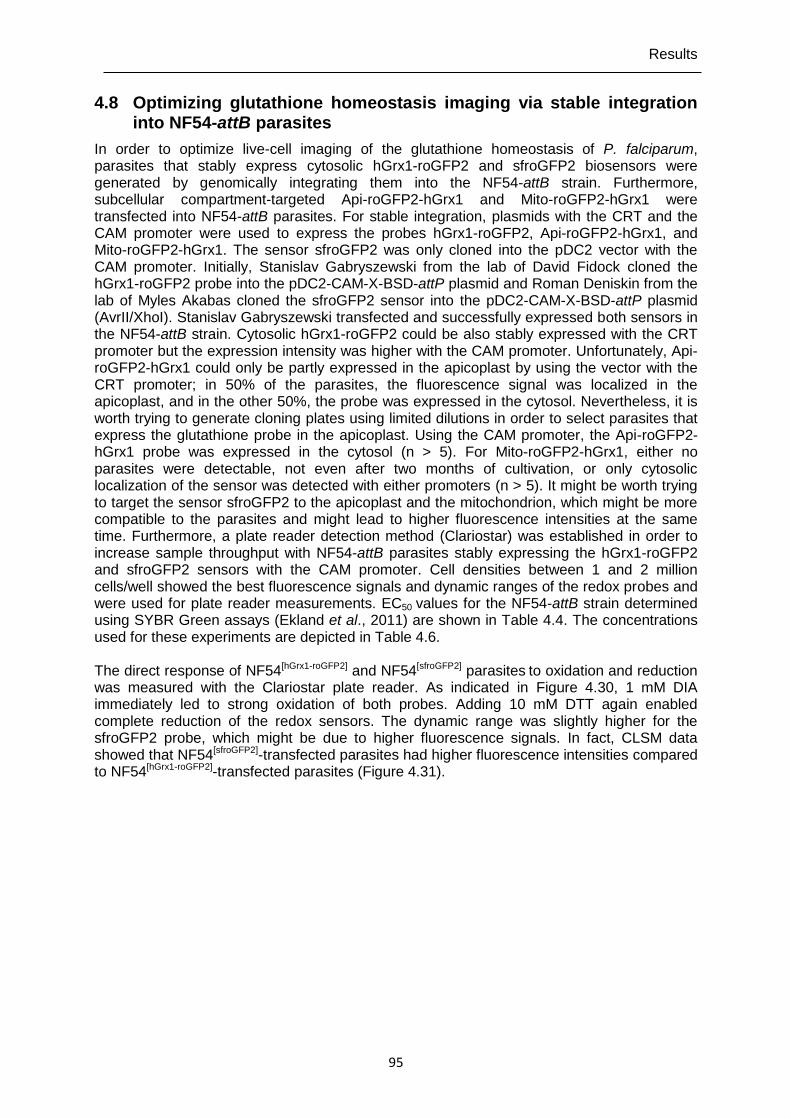
Results
95
4.8 Optimizing glutathione homeostasis imaging via stable integration into NF54-attB parasites
In order to optimize live-cell imaging of the glutathione homeostasis of P. falciparum, parasites that stably express cytosolic hGrx1-roGFP2 and sfroGFP2 biosensors were generated by genomically integrating them into the NF54-attB strain. Furthermore, subcellular compartment-targeted Api-roGFP2-hGrx1 and Mito-roGFP2-hGrx1 were transfected into NF54-attB parasites. For stable integration, plasmids with the CRT and the CAM promoter were used to express the probes hGrx1-roGFP2, Api-roGFP2-hGrx1, and Mito-roGFP2-hGrx1. The sensor sfroGFP2 was only cloned into the pDC2 vector with the CAM promoter. Initially, Stanislav Gabryszewski from the lab of David Fidock cloned the hGrx1-roGFP2 probe into the pDC2-CAM-X-BSD-attP plasmid and Roman Deniskin from the lab of Myles Akabas cloned the sfroGFP2 sensor into the pDC2-CAM-X-BSD-attP plasmid (AvrII/XhoI). Stanislav Gabryszewski transfected and successfully expressed both sensors in the NF54-attB strain. Cytosolic hGrx1-roGFP2 could be also stably expressed with the CRT promoter but the expression intensity was higher with the CAM promoter. Unfortunately, Api-roGFP2-hGrx1 could only be partly expressed in the apicoplast by using the vector with the CRT promoter; in 50% of the parasites, the fluorescence signal was localized in the apicoplast, and in the other 50%, the probe was expressed in the cytosol. Nevertheless, it is worth trying to generate cloning plates using limited dilutions in order to select parasites that express the glutathione probe in the apicoplast. Using the CAM promoter, the Api-roGFP2-hGrx1 probe was expressed in the cytosol (n > 5). For Mito-roGFP2-hGrx1, either no parasites were detectable, not even after two months of cultivation, or only cytosolic localization of the sensor was detected with either promoters (n > 5). It might be worth trying to target the sensor sfroGFP2 to the apicoplast and the mitochondrion, which might be more compatible to the parasites and might lead to higher fluorescence intensities at the same time. Furthermore, a plate reader detection method (Clariostar) was established in order to increase sample throughput with NF54-attB parasites stably expressing the hGrx1-roGFP2 and sfroGFP2 sensors with the CAM promoter. Cell densities between 1 and 2 million cells/well showed the best fluorescence signals and dynamic ranges of the redox probes and were used for plate reader measurements. EC50 values for the NF54-attB strain determined using SYBR Green assays (Ekland et al., 2011) are shown in Table 4.4. The concentrations used for these experiments are depicted in Table 4.6. The direct response of NF54[hGrx1-roGFP2] and NF54[sfroGFP2] parasites to oxidation and reduction was measured with the Clariostar plate reader. As indicated in Figure 4.30, 1 mM DIA immediately led to strong oxidation of both probes. Adding 10 mM DTT again enabled complete reduction of the redox sensors. The dynamic range was slightly higher for the sfroGFP2 probe, which might be due to higher fluorescence signals. In fact, CLSM data showed that NF54[sfroGFP2]-transfected parasites had higher fluorescence intensities compared to NF54[hGrx1-roGFP2]-transfected parasites (Figure 4.31).
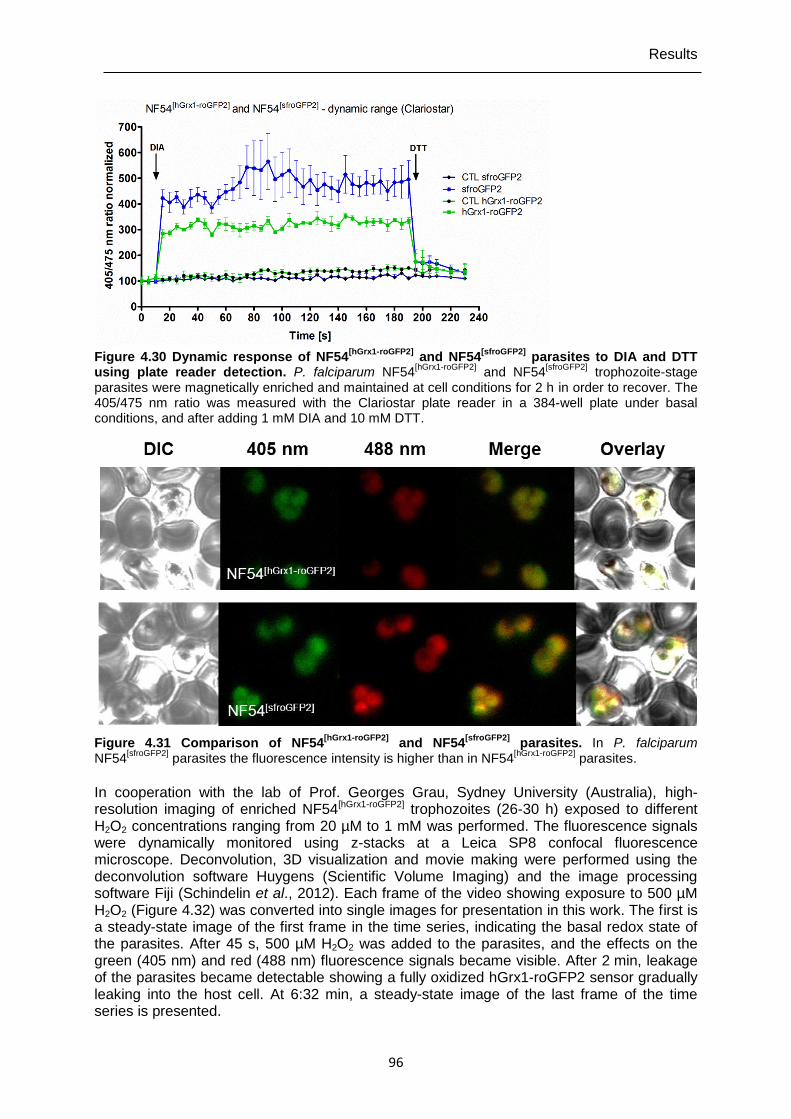
Results
96
Figure 4.30 Dynamic response of NF54[hGrx1-roGFP2]
and NF54[sfroGFP2]
parasites to DIA and DTT using plate reader detection. P. falciparum NF54
[hGrx1-roGFP2] and NF54
[sfroGFP2] trophozoite-stage
parasites were magnetically enriched and maintained at cell conditions for 2 h in order to recover. The 405/475 nm ratio was measured with the Clariostar plate reader in a 384-well plate under basal conditions, and after adding 1 mM DIA and 10 mM DTT.
Figure 4.31 Comparison of NF54[hGrx1-roGFP2]
and NF54[sfroGFP2]
parasites. In P. falciparum NF54
[sfroGFP2] parasites the fluorescence intensity is higher than in NF54
[hGrx1-roGFP2] parasites.
In cooperation with the lab of Prof. Georges Grau, Sydney University (Australia), high-resolution imaging of enriched NF54[hGrx1-roGFP2] trophozoites (26-30 h) exposed to different H2O2 concentrations ranging from 20 µM to 1 mM was performed. The fluorescence signals were dynamically monitored using z-stacks at a Leica SP8 confocal fluorescence microscope. Deconvolution, 3D visualization and movie making were performed using the deconvolution software Huygens (Scientific Volume Imaging) and the image processing software Fiji (Schindelin et al., 2012). Each frame of the video showing exposure to 500 µM H2O2 (Figure 4.32) was converted into single images for presentation in this work. The first is a steady-state image of the first frame in the time series, indicating the basal redox state of the parasites. After 45 s, 500 µM H2O2 was added to the parasites, and the effects on the green (405 nm) and red (488 nm) fluorescence signals became visible. After 2 min, leakage of the parasites became detectable showing a fully oxidized hGrx1-roGFP2 sensor gradually leaking into the host cell. At 6:32 min, a steady-state image of the last frame of the time series is presented.
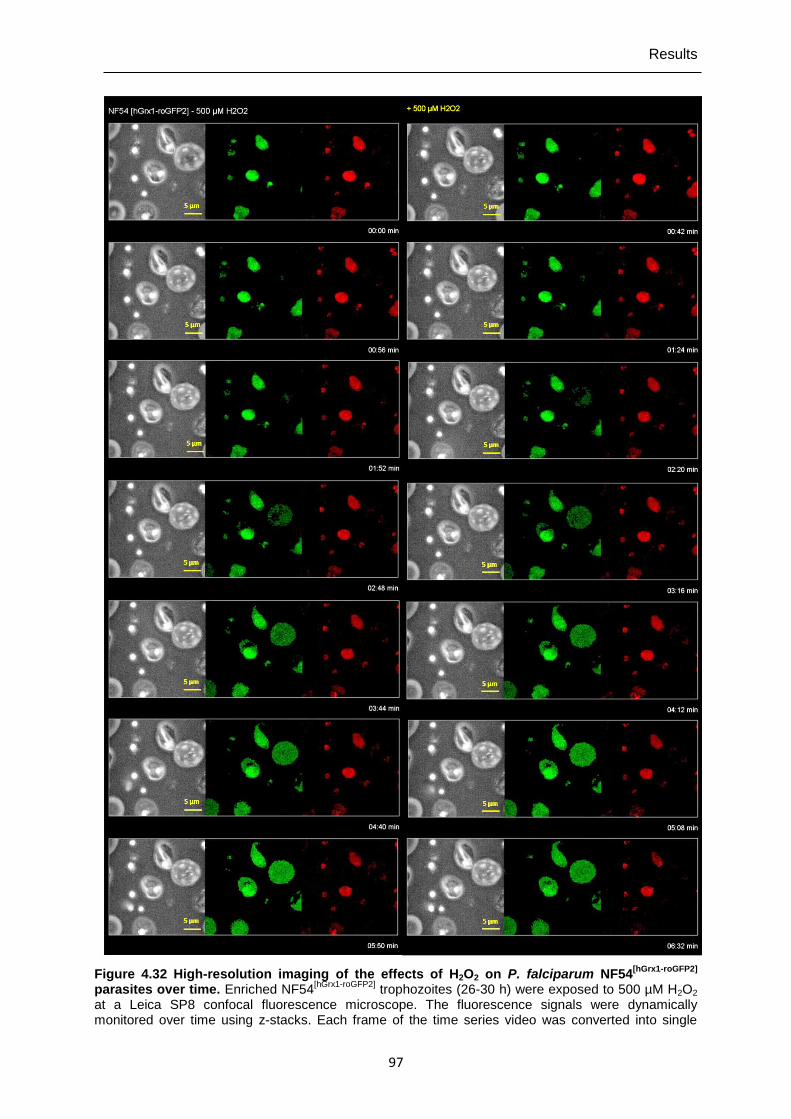
Results
97
Figure 4.32 High-resolution imaging of the effects of H2O2 on P. falciparum NF54[hGrx1-roGFP2]
parasites over time. Enriched NF54
[hGrx1-roGFP2] trophozoites (26-30 h) were exposed to 500 µM H2O2
at a Leica SP8 confocal fluorescence microscope. The fluorescence signals were dynamically monitored over time using z-stacks. Each frame of the time series video was converted into single
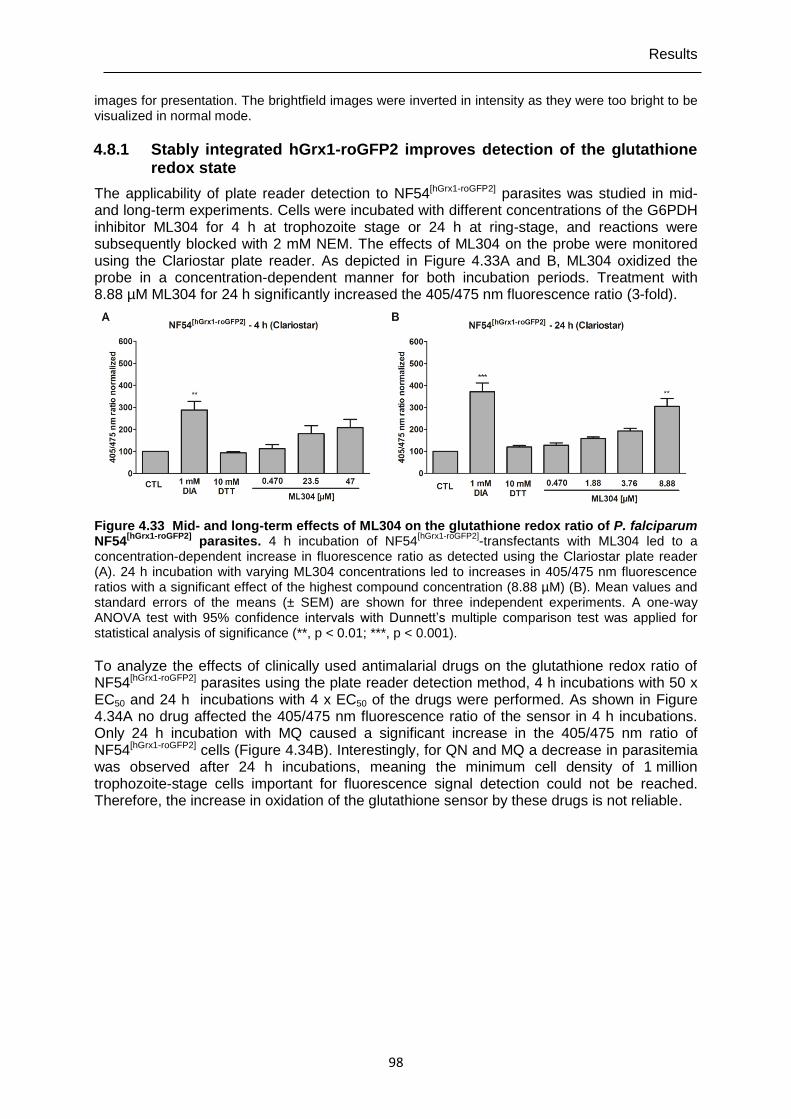
Results
98
images for presentation. The brightfield images were inverted in intensity as they were too bright to be visualized in normal mode.
4.8.1 Stably integrated hGrx1-roGFP2 improves detection of the glutathione redox state
The applicability of plate reader detection to NF54[hGrx1-roGFP2] parasites was studied in mid- and long-term experiments. Cells were incubated with different concentrations of the G6PDH inhibitor ML304 for 4 h at trophozoite stage or 24 h at ring-stage, and reactions were subsequently blocked with 2 mM NEM. The effects of ML304 on the probe were monitored using the Clariostar plate reader. As depicted in Figure 4.33A and B, ML304 oxidized the probe in a concentration-dependent manner for both incubation periods. Treatment with 8.88 µM ML304 for 24 h significantly increased the 405/475 nm fluorescence ratio (3-fold).
Figure 4.33 Mid- and long-term effects of ML304 on the glutathione redox ratio of P. falciparum NF54
[hGrx1-roGFP2] parasites. 4 h incubation of NF54
[hGrx1-roGFP2]-transfectants with ML304 led to a
concentration-dependent increase in fluorescence ratio as detected using the Clariostar plate reader (A). 24 h incubation with varying ML304 concentrations led to increases in 405/475 nm fluorescence ratios with a significant effect of the highest compound concentration (8.88 µM) (B). Mean values and standard errors of the means (± SEM) are shown for three independent experiments. A one-way ANOVA test with 95% confidence intervals with Dunnett’s multiple comparison test was applied for statistical analysis of significance (**, p < 0.01; ***, p < 0.001).
To analyze the effects of clinically used antimalarial drugs on the glutathione redox ratio of NF54[hGrx1-roGFP2] parasites using the plate reader detection method, 4 h incubations with 50 x EC50 and 24 h incubations with 4 x EC50 of the drugs were performed. As shown in Figure 4.34A no drug affected the 405/475 nm fluorescence ratio of the sensor in 4 h incubations. Only 24 h incubation with MQ caused a significant increase in the 405/475 nm ratio of NF54[hGrx1-roGFP2] cells (Figure 4.34B). Interestingly, for QN and MQ a decrease in parasitemia was observed after 24 h incubations, meaning the minimum cell density of 1 million trophozoite-stage cells important for fluorescence signal detection could not be reached. Therefore, the increase in oxidation of the glutathione sensor by these drugs is not reliable.
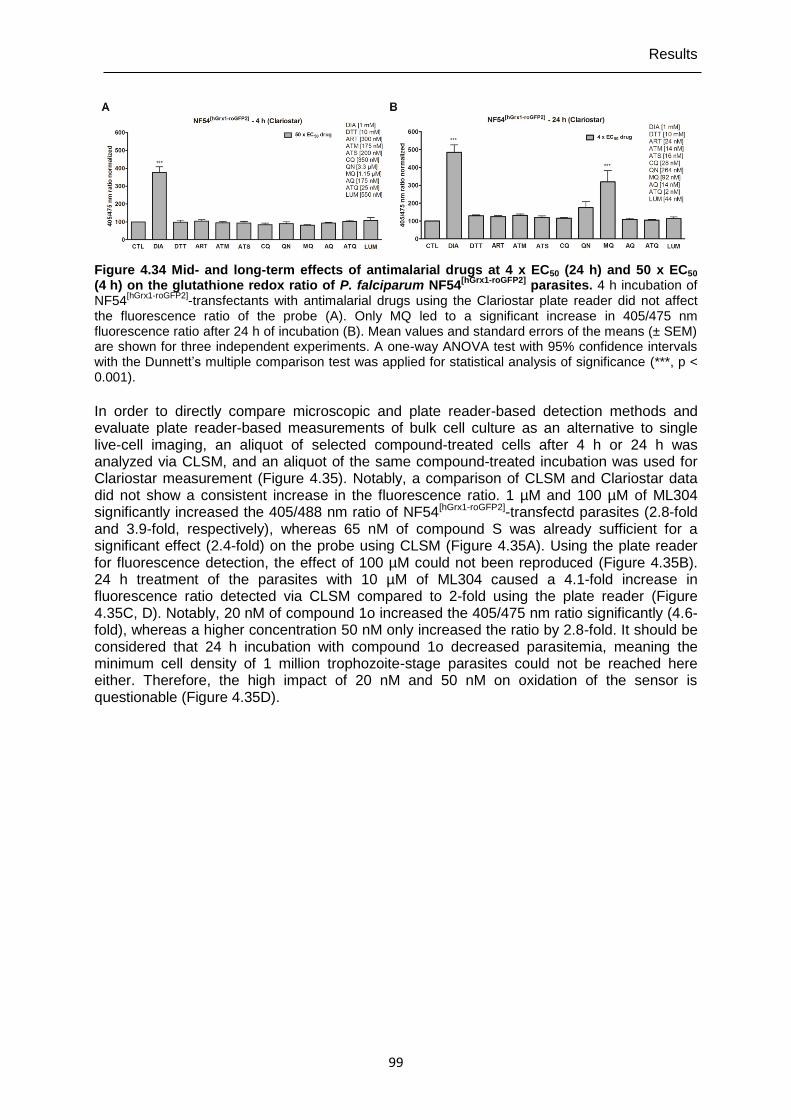
Results
99
Figure 4.34 Mid- and long-term effects of antimalarial drugs at 4 x EC50 (24 h) and 50 x EC50 (4 h) on the glutathione redox ratio of P. falciparum NF54
[hGrx1-roGFP2] parasites. 4 h incubation of
NF54[hGrx1-roGFP2]
-transfectants with antimalarial drugs using the Clariostar plate reader did not affect the fluorescence ratio of the probe (A). Only MQ led to a significant increase in 405/475 nm fluorescence ratio after 24 h of incubation (B). Mean values and standard errors of the means (± SEM) are shown for three independent experiments. A one-way ANOVA test with 95% confidence intervals with the Dunnett’s multiple comparison test was applied for statistical analysis of significance (***, p < 0.001).
In order to directly compare microscopic and plate reader-based detection methods and evaluate plate reader-based measurements of bulk cell culture as an alternative to single live-cell imaging, an aliquot of selected compound-treated cells after 4 h or 24 h was analyzed via CLSM, and an aliquot of the same compound-treated incubation was used for Clariostar measurement (Figure 4.35). Notably, a comparison of CLSM and Clariostar data did not show a consistent increase in the fluorescence ratio. 1 µM and 100 µM of ML304 significantly increased the 405/488 nm ratio of NF54[hGrx1-roGFP2]-transfectd parasites (2.8-fold and 3.9-fold, respectively), whereas 65 nM of compound S was already sufficient for a significant effect (2.4-fold) on the probe using CLSM (Figure 4.35A). Using the plate reader for fluorescence detection, the effect of 100 µM could not been reproduced (Figure 4.35B). 24 h treatment of the parasites with 10 µM of ML304 caused a 4.1-fold increase in fluorescence ratio detected via CLSM compared to 2-fold using the plate reader (Figure 4.35C, D). Notably, 20 nM of compound 1o increased the 405/475 nm ratio significantly (4.6-fold), whereas a higher concentration 50 nM only increased the ratio by 2.8-fold. It should be considered that 24 h incubation with compound 1o decreased parasitemia, meaning the minimum cell density of 1 million trophozoite-stage parasites could not be reached here either. Therefore, the high impact of 20 nM and 50 nM on oxidation of the sensor is questionable (Figure 4.35D).
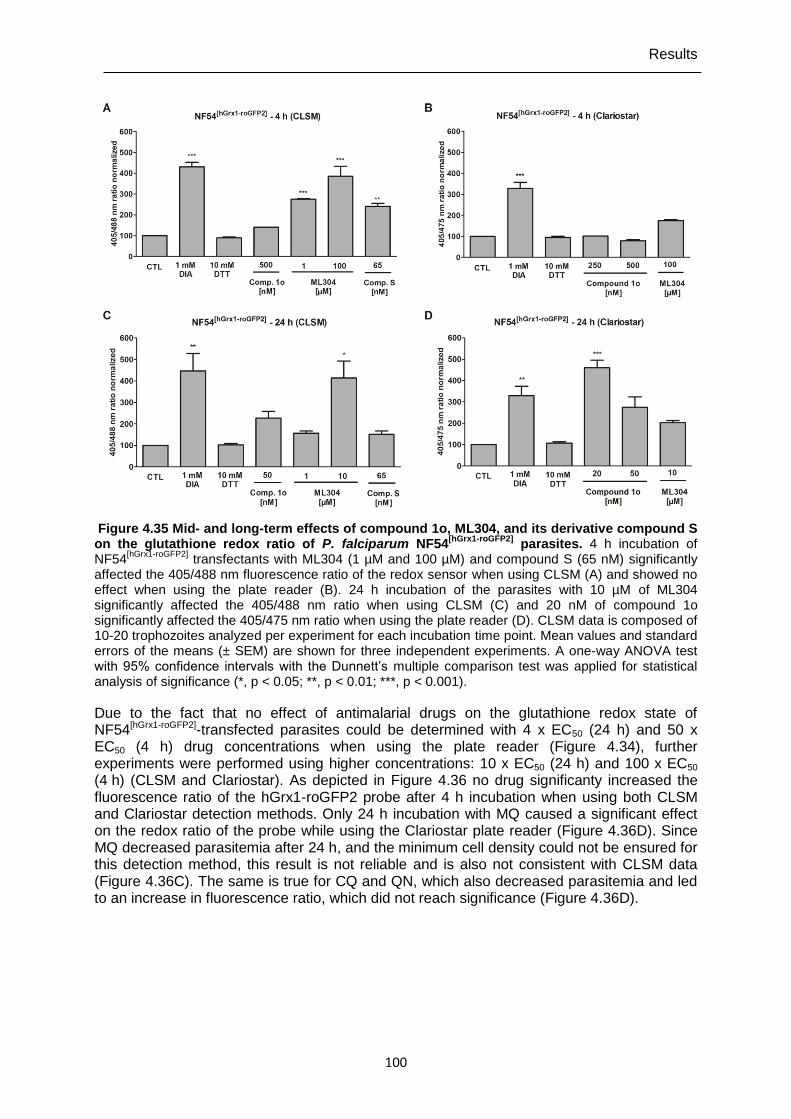
Results
100
Figure 4.35 Mid- and long-term effects of compound 1o, ML304, and its derivative compound S on the glutathione redox ratio of P. falciparum NF54
[hGrx1-roGFP2] parasites. 4 h incubation of
NF54[hGrx1-roGFP2]
transfectants with ML304 (1 µM and 100 µM) and compound S (65 nM) significantly affected the 405/488 nm fluorescence ratio of the redox sensor when using CLSM (A) and showed no effect when using the plate reader (B). 24 h incubation of the parasites with 10 µM of ML304 significantly affected the 405/488 nm ratio when using CLSM (C) and 20 nM of compound 1o significantly affected the 405/475 nm ratio when using the plate reader (D). CLSM data is composed of 10-20 trophozoites analyzed per experiment for each incubation time point. Mean values and standard errors of the means (± SEM) are shown for three independent experiments. A one-way ANOVA test with 95% confidence intervals with the Dunnett’s multiple comparison test was applied for statistical analysis of significance (*, p < 0.05; **, p < 0.01; ***, p < 0.001).
Due to the fact that no effect of antimalarial drugs on the glutathione redox state of NF54[hGrx1-roGFP2]-transfected parasites could be determined with 4 x EC50 (24 h) and 50 x EC50 (4 h) drug concentrations when using the plate reader (Figure 4.34), further experiments were performed using higher concentrations: 10 x EC50 (24 h) and 100 x EC50 (4 h) (CLSM and Clariostar). As depicted in Figure 4.36 no drug significanty increased the fluorescence ratio of the hGrx1-roGFP2 probe after 4 h incubation when using both CLSM and Clariostar detection methods. Only 24 h incubation with MQ caused a significant effect on the redox ratio of the probe while using the Clariostar plate reader (Figure 4.36D). Since MQ decreased parasitemia after 24 h, and the minimum cell density could not be ensured for this detection method, this result is not reliable and is also not consistent with CLSM data (Figure 4.36C). The same is true for CQ and QN, which also decreased parasitemia and led to an increase in fluorescence ratio, which did not reach significance (Figure 4.36D).
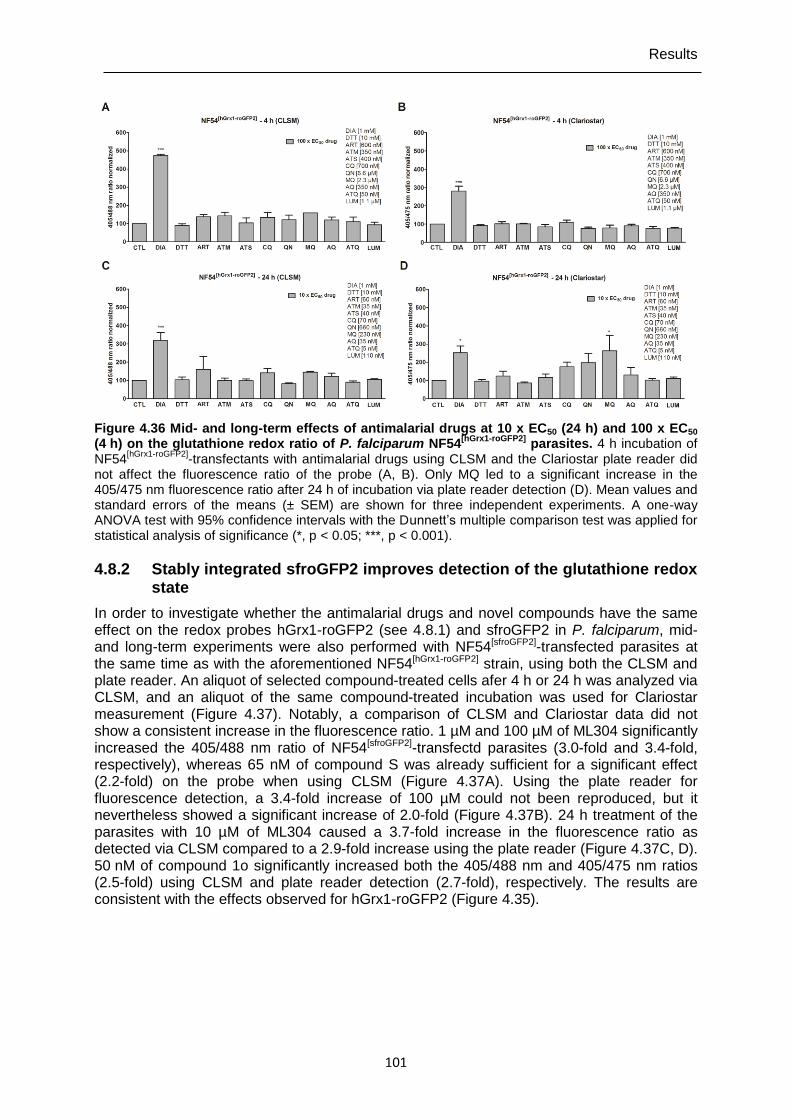
Results
101
Figure 4.36 Mid- and long-term effects of antimalarial drugs at 10 x EC50 (24 h) and 100 x EC50 (4 h) on the glutathione redox ratio of P. falciparum NF54
[hGrx1-roGFP2] parasites. 4 h incubation of
NF54[hGrx1-roGFP2]
-transfectants with antimalarial drugs using CLSM and the Clariostar plate reader did not affect the fluorescence ratio of the probe (A, B). Only MQ led to a significant increase in the 405/475 nm fluorescence ratio after 24 h of incubation via plate reader detection (D). Mean values and standard errors of the means (± SEM) are shown for three independent experiments. A one-way ANOVA test with 95% confidence intervals with the Dunnett’s multiple comparison test was applied for statistical analysis of significance (*, p < 0.05; ***, p < 0.001).
4.8.2 Stably integrated sfroGFP2 improves detection of the glutathione redox state
In order to investigate whether the antimalarial drugs and novel compounds have the same effect on the redox probes hGrx1-roGFP2 (see 4.8.1) and sfroGFP2 in P. falciparum, mid- and long-term experiments were also performed with NF54[sfroGFP2]-transfected parasites at the same time as with the aforementioned NF54[hGrx1-roGFP2] strain, using both the CLSM and plate reader. An aliquot of selected compound-treated cells afer 4 h or 24 h was analyzed via CLSM, and an aliquot of the same compound-treated incubation was used for Clariostar measurement (Figure 4.37). Notably, a comparison of CLSM and Clariostar data did not show a consistent increase in the fluorescence ratio. 1 µM and 100 µM of ML304 significantly increased the 405/488 nm ratio of NF54[sfroGFP2]-transfectd parasites (3.0-fold and 3.4-fold, respectively), whereas 65 nM of compound S was already sufficient for a significant effect (2.2-fold) on the probe when using CLSM (Figure 4.37A). Using the plate reader for fluorescence detection, a 3.4-fold increase of 100 µM could not been reproduced, but it nevertheless showed a significant increase of 2.0-fold (Figure 4.37B). 24 h treatment of the parasites with 10 µM of ML304 caused a 3.7-fold increase in the fluorescence ratio as detected via CLSM compared to a 2.9-fold increase using the plate reader (Figure 4.37C, D). 50 nM of compound 1o significantly increased both the 405/488 nm and 405/475 nm ratios (2.5-fold) using CLSM and plate reader detection (2.7-fold), respectively. The results are consistent with the effects observed for hGrx1-roGFP2 (Figure 4.35).
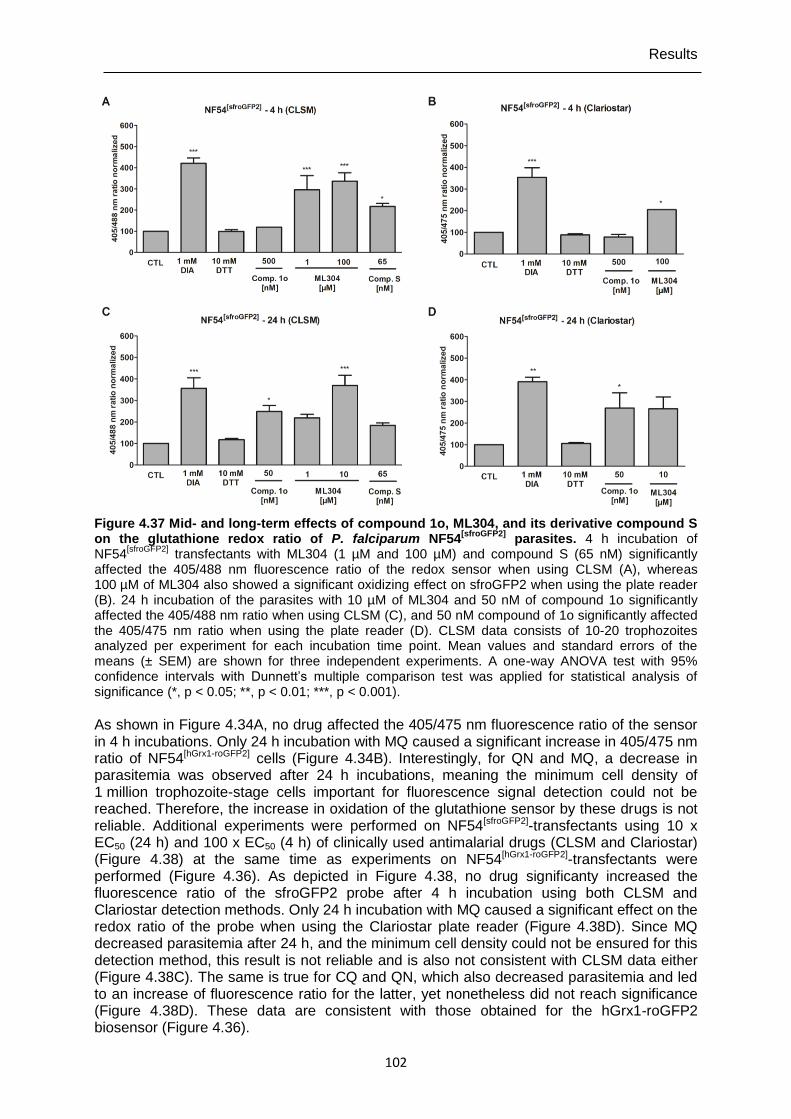
Results
102
Figure 4.37 Mid- and long-term effects of compound 1o, ML304, and its derivative compound S on the glutathione redox ratio of P. falciparum NF54
[sfroGFP2] parasites. 4 h incubation of
NF54[sfroGFP2]
transfectants with ML304 (1 µM and 100 µM) and compound S (65 nM) significantly affected the 405/488 nm fluorescence ratio of the redox sensor when using CLSM (A), whereas 100 µM of ML304 also showed a significant oxidizing effect on sfroGFP2 when using the plate reader (B). 24 h incubation of the parasites with 10 µM of ML304 and 50 nM of compound 1o significantly affected the 405/488 nm ratio when using CLSM (C), and 50 nM compound of 1o significantly affected the 405/475 nm ratio when using the plate reader (D). CLSM data consists of 10-20 trophozoites analyzed per experiment for each incubation time point. Mean values and standard errors of the means (± SEM) are shown for three independent experiments. A one-way ANOVA test with 95% confidence intervals with Dunnett’s multiple comparison test was applied for statistical analysis of significance (*, p < 0.05; **, p < 0.01; ***, p < 0.001).
As shown in Figure 4.34A, no drug affected the 405/475 nm fluorescence ratio of the sensor in 4 h incubations. Only 24 h incubation with MQ caused a significant increase in 405/475 nm ratio of NF54[hGrx1-roGFP2] cells (Figure 4.34B). Interestingly, for QN and MQ, a decrease in parasitemia was observed after 24 h incubations, meaning the minimum cell density of 1 million trophozoite-stage cells important for fluorescence signal detection could not be reached. Therefore, the increase in oxidation of the glutathione sensor by these drugs is not reliable. Additional experiments were performed on NF54[sfroGFP2]-transfectants using 10 x EC50 (24 h) and 100 x EC50 (4 h) of clinically used antimalarial drugs (CLSM and Clariostar) (Figure 4.38) at the same time as experiments on NF54[hGrx1-roGFP2]-transfectants were performed (Figure 4.36). As depicted in Figure 4.38, no drug significanty increased the fluorescence ratio of the sfroGFP2 probe after 4 h incubation using both CLSM and Clariostar detection methods. Only 24 h incubation with MQ caused a significant effect on the redox ratio of the probe when using the Clariostar plate reader (Figure 4.38D). Since MQ decreased parasitemia after 24 h, and the minimum cell density could not be ensured for this detection method, this result is not reliable and is also not consistent with CLSM data either (Figure 4.38C). The same is true for CQ and QN, which also decreased parasitemia and led to an increase of fluorescence ratio for the latter, yet nonetheless did not reach significance (Figure 4.38D). These data are consistent with those obtained for the hGrx1-roGFP2 biosensor (Figure 4.36).
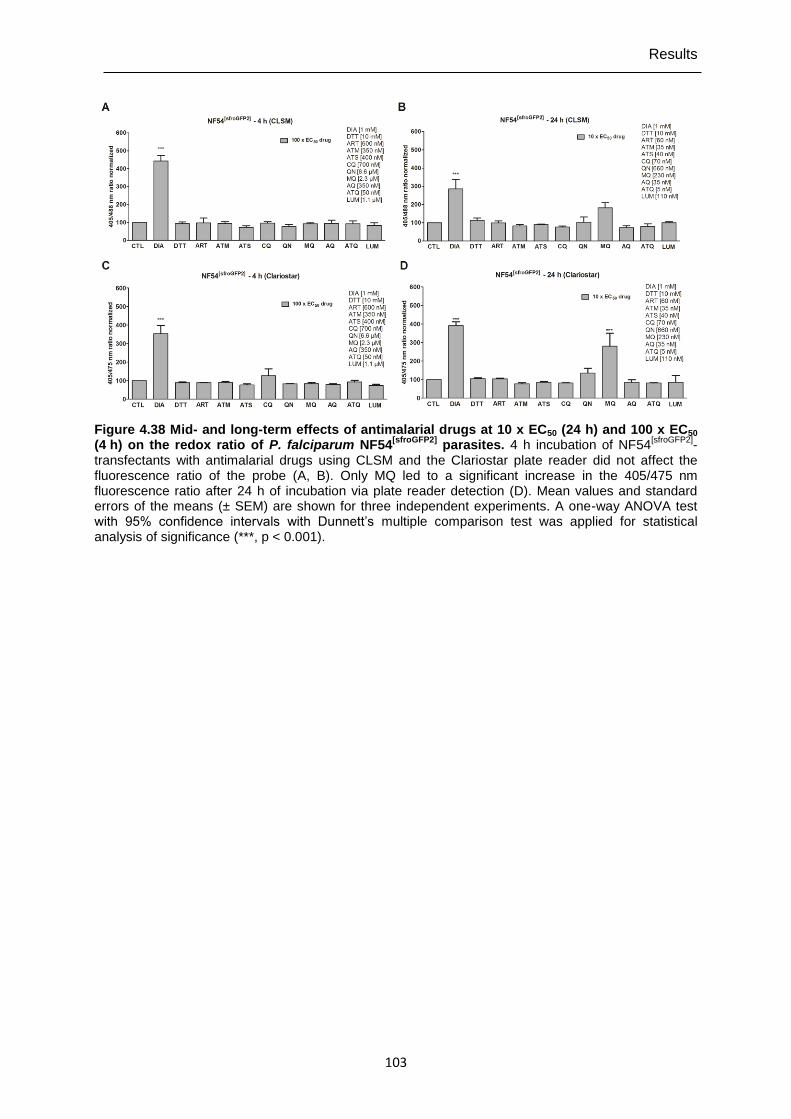
Results
103
Figure 4.38 Mid- and long-term effects of antimalarial drugs at 10 x EC50 (24 h) and 100 x EC50 (4 h) on the redox ratio of P. falciparum NF54
[sfroGFP2] parasites. 4 h incubation of NF54
[sfroGFP2]-
transfectants with antimalarial drugs using CLSM and the Clariostar plate reader did not affect the fluorescence ratio of the probe (A, B). Only MQ led to a significant increase in the 405/475 nm fluorescence ratio after 24 h of incubation via plate reader detection (D). Mean values and standard errors of the means (± SEM) are shown for three independent experiments. A one-way ANOVA test with 95% confidence intervals with Dunnett’s multiple comparison test was applied for statistical analysis of significance (***, p < 0.001).
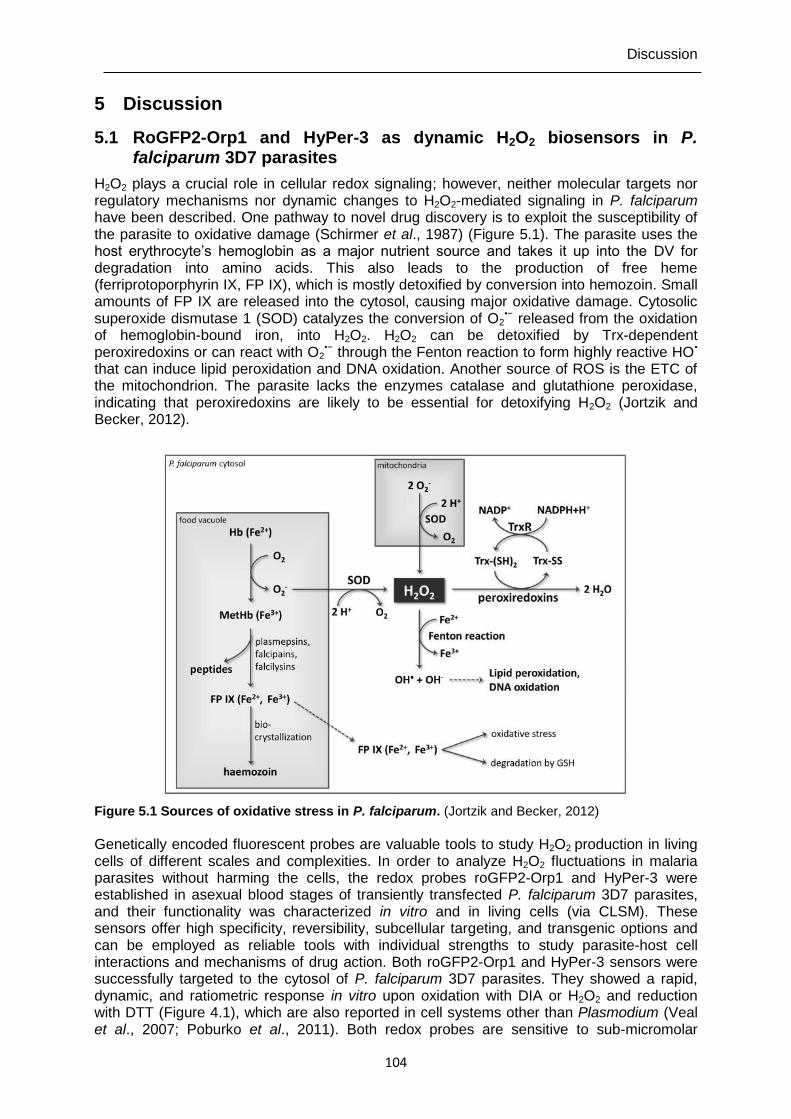
Discussion
104
5 Discussion
5.1 RoGFP2-Orp1 and HyPer-3 as dynamic H2O2 biosensors in P. falciparum 3D7 parasites
H2O2 plays a crucial role in cellular redox signaling; however, neither molecular targets nor regulatory mechanisms nor dynamic changes to H2O2-mediated signaling in P. falciparum have been described. One pathway to novel drug discovery is to exploit the susceptibility of the parasite to oxidative damage (Schirmer et al., 1987) (Figure 5.1). The parasite uses the host erythrocyte’s hemoglobin as a major nutrient source and takes it up into the DV for degradation into amino acids. This also leads to the production of free heme (ferriprotoporphyrin IX, FP IX), which is mostly detoxified by conversion into hemozoin. Small amounts of FP IX are released into the cytosol, causing major oxidative damage. Cytosolic superoxide dismutase 1 (SOD) catalyzes the conversion of O2
•− released from the oxidation of hemoglobin-bound iron, into H2O2. H2O2 can be detoxified by Trx-dependent peroxiredoxins or can react with O2
•− through the Fenton reaction to form highly reactive HO• that can induce lipid peroxidation and DNA oxidation. Another source of ROS is the ETC of the mitochondrion. The parasite lacks the enzymes catalase and glutathione peroxidase, indicating that peroxiredoxins are likely to be essential for detoxifying H2O2 (Jortzik and Becker, 2012).
Figure 5.1 Sources of oxidative stress in P. falciparum. (Jortzik and Becker, 2012)
Genetically encoded fluorescent probes are valuable tools to study H2O2 production in living cells of different scales and complexities. In order to analyze H2O2 fluctuations in malaria parasites without harming the cells, the redox probes roGFP2-Orp1 and HyPer-3 were established in asexual blood stages of transiently transfected P. falciparum 3D7 parasites, and their functionality was characterized in vitro and in living cells (via CLSM). These sensors offer high specificity, reversibility, subcellular targeting, and transgenic options and can be employed as reliable tools with individual strengths to study parasite-host cell interactions and mechanisms of drug action. Both roGFP2-Orp1 and HyPer-3 sensors were successfully targeted to the cytosol of P. falciparum 3D7 parasites. They showed a rapid, dynamic, and ratiometric response in vitro upon oxidation with DIA or H2O2 and reduction with DTT (Figure 4.1), which are also reported in cell systems other than Plasmodium (Veal et al., 2007; Poburko et al., 2011). Both redox probes are sensitive to sub-micromolar
Discussion
105
concentrations of H2O2, in vitro and in cells (Gutscher et al., 2009; Belousov et al., 2006). Equimolar concentrations of H2O2 oxidized roGFP2-Orp1 (5 µM) (4.7-fold ratio increase), whereas 20 µM of H2O2 had to be applied in order to fully oxidize HyPer-3 (5 µM) (3.8-fold ratio increase). Both probes were suitable for monitoring low H2O2 concentrations in vitro and in cells; however, HyPer-3 seemed better suited for monitoring higher H2O2 concentrations in the parasites. The in vitro dynamic range of roGFP2-Orp1 was determined to be 7.2 (Figure 4.2), which is comparable to a value of 8 reported by Gutscher et al. (2009) but it was only 5 in cells. A dynamic range of approximately 6 was reported in Drosophila (Albrecht et al., 2011). For HyPer-3 the in vitro dynamic range (5.0) was similar to the in-cells value (5.5). In zebrafish a dynamic range of only 2.5 was reported for HyPer-3 (Bilan et al., 2013). RoGFP2-Orp1 could be reduced with 10 mM of DTT within 5 min, whereas 20 mM of DTT and 15 min were needed for HyPer-3 to reach the baseline ratio level. The in vitro proceeding oxidation of HyPer-3 by air over time showed in Figure 4.2B was also previously seen for roGFP2 by Dooley et al. (2004). Therefore, inclusion of controls and/or measurements under anaerobic conditions should be considered for further in vitro experiments. Under cell culture conditions the sensors are not affected by air due to the well-buffered cellular environment. Not even high percentages of oxygen (100%) could oxidize roGFP2 in the cytoplasm of different cell types (Dooley et al., 2004). In P. falciparum 3D7 parasites, the biosensor HyPer-3 responded more quickly than roGFP2-Orp1, which is most likely due to the decelerated reaction between the thiol-disulfide exchange of two protein domains in roGFP2-Orp1 compared to the one disulfide bridge formation within HyPer-3. The difference in the minimal amount of H2O2 required to fully oxidize roGFP2-Orp1 and HyPer-3 in vitro (5 µM and 20 µM, respectively) (Figure 4.2) and in living malaria parasites (1 mM) (Figure 4.12) (is likely due to the antioxidant capacity of the parasite-host cell unit, including catalase and peroxiredoxins (Fourquet et al., 2008). Interestingly, HyPer-3 showed a faster and higher oxidation-reduction rate towards H2O2 than roGFP2-Orp1 in Plasmodium 3D7 parasites (Figure 4.1). The Orp1 intramolecular disulfide is reduced naturally by the thioredoxin system (TrxS) (consisting of Trx1, Trx reductase, and NADPH) (Gutscher et al., 2009). TrxS had been identified to enzymatically reduce OxyR under oxidative stress (Wei et al., 2012), although glutaredoxin 1 seems to be the preferred reductant of OxyR in cells (Aslund et al., 1999). The oxidation of both probes is also reversible in cells, which was shown by adding DTT, which decreased the ratio to the baseline redox state by reducing the disulfide bonds (Figure 4.15). This reversibility indicates the suitability of both sensors to measure dynamic redox changes in living cells. To analyze the extent to which the erythrocytes quench H2O2 before it reaches the parasite, experiments were performed after RBC lysis (Figure 4.12). HyPer-3 exhibited a higher dynamic range in cells for parasites both with (7.3) and without (12.6) intact RBCs than roGFP2-Orp1 did (5 and 5.5) (Figure 4.15), which might imply a higher in-cell sensitivity of HyPer-3 to oxidation and/or a higher reduction of roGFP2-Orp1 by the efficient TrxS in Plasmodium. Interestingly, after short-term treatment with high H2O2 concentrations (≥ 100 μM), leakage of the roGFP2-Orp1 and HyPer-3 probes into the erythrocyte cytosol could be detected. Due to the pH sensitivity of HyPer-3, SypHer has been proposed as a pH control (Lukyanov and Belousov, 2014). Alkaline pH increased and acidic pH decreased the redox ratio of both probes (Figure 4.5), which is in line with the results of Poburko et al. (2011). Furthermore, SypHer was shown to be insensitive to even 10 mM of H2O2. When monitoring HyPer-3 in vitro over time, a slight but constant increase in the fluorescence ratio could be observed at pH > 7.0, which questions the use of SypHer as a direct control for certain pH ranges (Figure 4.6). To analyze whether pH variations can be determined via SypHer in cells, the probe was successfully targeted to the cytosol of P. falciparum 3D7 parasites. PH calibration curves were generated for both probes in cells, indicating that only in a pH range of 7.0-7.5 were the ratio responses of SypHer and HyPer-3 identical (Figure 4.5). Therefore, SypHer can only be used as a direct pH control for HyPer-3 in this pH range. Furthermore, the cytosolic pH of P. falciparum 3D7 was determined to be 7.17 ± 0.11 using SypHer and 7.16 ± 0.18 using pHluorin as a pH probe (Figure 4.7). These values are highly comparable and previous studies by Kuhn et al. (2007) using pHluorin for the cytosol in CQ-resistant and -sensitive P.
Discussion
106
falciparum parasites support them. In yeast, cytosolic pH determined via pHluorin was 7.5 (Orij et al., 2009). For HeLa cells the cytosolic pH was determined to be 7.19 by using SypHer (Poburko et al., 2011).
5.2 Effects of antimalarial drugs on cytosolic roGFP2-Orp1 and HyPer-3 in Plasmodium 3D7 parasites
Live-cell imaging of the episomally expressed H2O2 sensors after short-, mid- and long-term antimalarial drug incubations showed that the mode of action of ART, ATM, ATS, CQ, QN, and MQ may not be linked to an increase in H2O2 levels. Interestingly, quinolines, especially MQ, showed a longer-lasting effect on the redox sensor – a phenomenon that might be worth studying in more detail. The tested drugs should be considered not to directly act at the cytosol level but mainly at organelle sites such as the DV, which most likely explains the results. When using a peroxidase-probe, it is also not possible to differentiate between a lack of H2O2 increase and rapid H2O2 reduction by endogenous peroxiredoxins or other electron donors. Due to HyPer-3 pH sensitivity and its low transfection rate, complex in-cell drug studies were not carried out with this probe. A pH-insensitive version of HyPer-3 would be very beneficial for future studies. Pre-incubation with the antimalarial drugs ART, CQ, and QN or heat shock at 42 °C for 4 h affected the H2O2 susceptibility of P. falciparum 3D7[roGFP2-
Orp1] parasites (Figure 4.17). Under all conditions a slower initial increase of the redox ratio was observed after H2O2 treatment, which was most pronounced in parasites pretreated with QN. The higher tolerance towards exogenous H2O2 after priming with drugs pointing towards upregulation of the peroxide defense system (Fourquet et al., 2008; Cox et al., 2010), which rapidly reduces H2O2 (Cox et al., 2009; Parsonage et al., 2010; Peskin et al., 2007). As the same effect was seen upon heat stress, this might represent a rather general stress-induced upregulation of primary defense systems. In bacteria and unicellular eukaryotes, the induced expression of detoxifying enzymes in response to H2O2 plays an important role in protecting the cell against oxidative damage (Chen et al., 2003; Gasch et al., 2000; Smith et al., 2004; Zheng et al., 1998). In yeast cells, induction of antioxidant gene expression in response to non-lethal doses of H2O2 allows adaptation and survival after following exposure to usually lethal doses of H2O2 (Collinson and Dawes, 1992; Davies et al., 1995; Jamieson, 1998). H2O2 can be seen as a sensor and alarm preparing the cell to fight against oxidative stress. In Plasmodium, the glutathione and thioredoxin system contribute to redox homoeostasis (Jortzik and Becker, 2012). So far, no drug with strong effects on the cytosolic H2O2 redox state could be found, but many drugs that might be interesting candidates have not been investigated yet. The probes used in this study were also targeted to different organelles in the parasite in order to determine compartment-specific drug effects, but experimental studies could not be carried out due to low transfection rates and weak fluorescence intensities of the targeted sensors. Stable integration of redox probes into the genome of P. falciparum NF54-attB parasites considerably improved their fluorescence intensities and transfection rates, which is discussed in the following sections.
5.3 Optimizing detection of H2O2 levels in P. falciparum
So far, measurements of the H2O2 level in cytosol and subcellular compartments of P. falciparum have been very time consuming since single-+cell microscopy needs to be applied and the transfection rate is not really high, varying among the parasites transfected with different constructs. Moreover, for subcellular compartments, only a small portion of parasites express the redox sensors at a level high enough for detection, which also varies among the parasites transfected with different constructs. This amount decreases over time due to resistance against the selection drug WR99210. The stable genomic integration of the cytosolically expressed roGFP2-Orp1 and the mitochondrially expressed Mito-roGFP2-Orp1 sensors in asexual blood-stages of P. falciparum NF54-attB parasites drastically improved measurements and paved the way for measuring dynamic redox changes induced by H2O2 in living Plasmodium parasites in subcellular compartments, while preserving cell integrity. This is an advantage over other currently available imaging agents such as Amplex Red (Zhou et
Discussion
107
al., 1997) or CM-H2DCFDA (Fu et al., 2010), which have serious pitfalls, are prone to artefacts, and preclude compartment-specific monitoring of H2O2 dynamics (reviewed in Rahbari et al., 2015). Live-cell imaging experiments with the stably expressed sensors (using CLSM) showed that they can be employed as reliable tools for studying H2O2 oxidation and reduction. The advantages over single-cell imaging via CLSM are the detection of a bulk cell population, fast, simultaneous measurements of various drug treatments, and the high reproducibility of data. The disadvantages of plate reader detection are the need to determine cell densities prior to measurements, the need for large amounts of cells, and the inability to physically inspect their condition. In line with a previous study using transiently expressed roGFP2-Orp1 in P. falciparum (Rahbari et al., 2017a), a rapid, dynamic, and ratiometric response of stably transfected roGFP2-Orp1 and Mito-roGFP2-Orp1 upon oxidation with DIA or H2O2 and reduction with DTT could be observed (Figures 4.24 and 4.25). The dynamic ranges of roGFP2-Orp1 and Mito-roGFP2-Orp1 (DIA/DTT) were determined to be 5.5 and 4.5, respectively, which is comparable to earlier reports of 5 and 6 in P. falciparum and Drosophila, respectively (Rahbari et al., 2017a; Albrecht et al, 2011). Notably, NF54[roGFP2-Orp1] transfectants were susceptible to phototoxicity as confirmed via short-term time courses presented as CTL (Figure 4.25A) and exhibited an approximately 1.3-fold increase in the 405/488 nm fluorescence ratio over time. In contrast, the fluorescence ratio of NF54[Mito-roGFP2-Orp1] transfectants remained rather constant over time (Figure 4.25B). Phototoxicity is one of the major problems in live-cell imaging, occurring upon illumination of fluorescently labelled cells (Kaludercic et al., 2014). This leads to the production of free radicals (Kaludercic et al., 2014) and ROS (Dailey et al., 2006) that damage cells. Interestingly, P. falciparum 3D7 parasites transiently expressing the cytosolic roGFP2-Orp1 sensor showed a constant control regarding the 405/488 nm fluorescence ratio over time. Only parasites deprived of their host cell were susceptible to phototoxicity but with the opposite outcome, i.e. the reduction of the fluorescence signal (light-induced bleaching) (Figure 4.12B). The mitochondrial inner membrane is permeable to H2O2 as the externally added oxidant was able to induce immediate changes in the 405/488 nm fluorescence ratio (Figure 4.25B). Notably, already low H2O2 concentrations of 10 µM affected both the roGFP2-Orp1 and Mito-roGFP2-Orp1 probes to the same extent. The leakage phenomenon of the roGFP2-Orp1 sensor into the host cell upon adding 500 µM H2O2, as monitored in a high-resolution video, is illustrated here in single images (Figure 4.26). The results of live-cell imaging with the cytosolically and mitochondrially expressed H2O2
biosensors roGFP2-Orp1 and Mito-roGFP2-Orp1, respectively, in asexual blood-stages of stably transfected P. falciparum NF54-attB parasites indicated that the mode of action of some antimalarial drugs and some of the novel compounds may be linked to a disturbance of H2O2 homeostasis. The overall oxidizing effects of the antimalarial drugs ART, ATM, ATS, CQ, QN, MQ, AQ, and LUM depicted in Figure 4.27 appeared to be more pronounced (although with higher variability between single cells) after 24 h of incubation (10 x EC50) than after 4 h (100 x EC50), indicating that long exposure to a drug increases its impact on the H2O2 level. ART and ATM led to significant increases (2-fold) in the 405/488 nm fluorescence ratio of the mitochondrial Mito-roGFP2-Orp1 probe after 4 h incubation (Figure 4.27A). Longer (24 h) incubations of these drugs led to more pronounced increases in the ratio (3-fold), but these did not reach significance (Figure 4.27B). Notably, after 24 h incubation with ATM, a partially cytosolic expression of the mitochondrial probe was observed in the 405 nm and 488 nm channels, indicating putative disruption of the mitochondrion and leakage of the probe into the cytosol of the parasite (Figure 4.28). This phenomenon was also observed recently with the mitochondrial glutathione probe Mito-roGFP2-hGrx1 and ART in P. falciparum 3D7 parasites (Mohring et al., 2017) (Franziska Mohring, pers. comm.) and might be worth studying in more detail. These data are consistent with the leakage of the cytosolic probe roGFP2-Orp1 in P. falciparum 3D7 transfectants into the host cell upon exposure to high H2O2 concentrations (100 µM to 1 mM). Among the quinolines CQ, QN, MQ, and AQ, only CQ significantly increased the ratio of roGFP2-Orp1 during a 4 h treatment, whereas a
Discussion
108
significant ratio increase of Mito-roGFP2-Orp1 was detected with QN and MQ (Figure 4.27A). Rot and 2-DG increased intracellular H2O2 levels; however, the effects failed to be statistically significant. Similar studies with these compounds have already been performed on P. falciparum 3D7 parasites transiently expressing the glutathione redox sensors hGrx1-roGFP2 and Mito-roGFP2-hGrx1 in the cytosol and the mitochondrion, respectively. Significant disruption of intercellular thiol metabolism by 2-DG in the mitochondrion and by the combination of 2-DG and Rot using both cytosolic and mitochondrial probes was determined (Mohring et al., 2017). ATQ and PQ hardly affected cytosolic H2O2 levels in 4 h incubations but increased mitochondrial H2O2 levels 2-fold and 1.8-fold, respectively (Figure 4.29A). Longer (24 h) treatments with ATQ and PQ again affected roGFP2-Orp1 only slightly but increased the fluorescence ratio of Mito-roGFP2-Orp1 2.5-fold and 8-fold, respectively. These results are consistent with the putative mechanisms of action of both ATQ and PQ through targeting the mitochondrion and thereby increasing oxidative stress. The steroid compound 1o increased both cytosolic and mitochondrial H2O2 levels in 4 h and 24 h incubation experiments, with a significant effect on Mito-roGFP2-Orp1 after 24 h (Figure 4.29A, B). These findings suggest a putative impact of compound 1o on mitochondrial metabolism, leading to increasing H2O2 levels, a phenomenon that merits further analysis. G6PD is a novel target for antimalarial drug design, based on observations that G6PD deficiency in humans protects the carrier from malaria infections (Cappellini and Fiorelli, 2008). In this study, inhibiting cytosolic PfGluPho by 1 µM ML304 led to a signifcant increase in the fluorescence ratio (2.3-fold) of the cytosolic roGFP2-Orp1 sensor in 4 h experiments (Figure 4.29), indicating its impact on H2O2 homeostasis in the cytosol. Following 24 h treatment the effect of ML304 on the 405/488 nm ratio of cytosolic roGFP2-Orp1 is more pronounced (2.8-fold) and reached significance (Figure 4.29B). In comparison, ML304 affected the fluorescence ratio of the mitochondrial probe only by 1.8-fold in 4 h experiments. In 24 h incubations, ML304 also increased the 405/488 nm ratio of the Mito-roGFP2-Orp1 by 2.8-fold, to the same extent as the cytosolic probe, but this change failed to reach significance. Compound S, a derivative of ML304 led to significant increases in fluorescence ratio of both the cytosolic and mitochondrial probe already at 65 nM in 24 h incubations and of the cytosolic probe in 4 h incubations, which makes it a potent novel agent for killing Plasmodium. Overall, all the drugs tested here affected H2O2 efflux either in the cytosol, the mitochondrion, or both compartments of P. falciparum NF54-attB parasites in 4 h and 24 h incubation experiments. It should be, however, also considered that not all of the tested drugs directly act at the cytosol or mitochondrion levels that might account for the obtained non-significant effects.
5.4 Effects of novel compounds on hGrx1-roGFP2 expressing P. falciparum 3D7 parasites
Studies employing the cytosolic glutathione redox sensor hGrx1-roGFP2 transiently expressed in P. falciparum 3D7 parasites supported the antiparasitic effect of compound 1o (Krieg et al., 2017). Incubation with subnanomolar concentrations of compound 1o led to a dose-dependent increase in the redox ratio indicating oxidation and alterations in the intracellular redox potential (Figure 4.18). Although the results failed to reach significance, they indicate a trend towards oxidation. Therefore, the influence of compound 1o on glutathione redox homeostasis should be studied in more detail. The effects of the G6PDH inhibitor ML304 (Preuss et al., 2012) and its derivative compound S on glutathione homeostasis reached significance at all concentrations used in 4 h and 24 h incubation experiments (Figure 4.19A). As little as 1 µM of ML304 oxidized the sensor significantly, 50 µM completely (compared to DIA). However, it should be considered that concentrations < 50 µM might also have oxidized the sensor completely since 100 µM of ML304 did not lead to a further increase in oxidation. Long-term treatment with 5 µM of ML304 completely oxidized the sensor. The derivative compound S improved the oxidative effect of ML304 by increasing oxidative stress starting at subnanomolar concentrations (65 nM) in 4 h and 24 h incubations, whereas the clinically used drugs ATS, CQ, and MQ hardly affected the 405/488 nm ratio at the concentrations used in the experiment (Figure 4.19A, B). Therefore,
Discussion
109
compound S seemed to be a potent novel agent for killing Plasmodium and should be studied in more detail. Long-term incubations of 3D7[hGrx1-roGFP2] and 3D7[Mito-roGFP2-hGrx1] with the experimental agent Rot significantly enhanced the oxidizing effect of 2-DG (Figure 4.20). In line with a previous report for human cancer cells using higher compound concentrations, the parasites were more susceptible to inhibition of glucose metabolism in the presence of Rot (Fath et al., 2009). Therefore, ETCBs can significantly enhance 2-DG-induced oxidative stress in cells. A combination of 2-DG and Rot led to significant oxidations in both parasites, disrupting intracellular thiol metabolism, which indicates changes in redox status consistent with cells undergoing oxidative stress. 2-DG treatment alone resulted in a significant increase in probe oxidation in 3D7[Mito-roGFP2-hGrx1]-transfected cells. Overall, all the novel compounds and experimental agents tested here affected the glutathione redox state in the cytosol and when tested, in the mitochondrion as well. For ML304 and compound S, disruption of GSH homeostasis plays a major role in their mode of action in parasites since their effects on increasing oxidative stress were highly significant, which is consistent with the role of the G6PD target of the drugs. However, it should also be considered that the other tested compounds and experimental agents might not directly act at only the cytosolic or mitochondrial level but also at organelle sites such as the DV or apicoplast.
5.5 Optimizing glutathione redox potential detection in P. falciparum
By using two genetically encoded fluorescent redox sensors, the glutathione redox probe hGrx1-roGFP2 and sfroGFP2, their characteristics could be directly investigated in parallel regarding their sensitivity to changes in GSH/GSSG ratios in stably transfected strains of P. falciparum. Previous methods evaluating intracellular redox state have employed fluorescence microscopy. To improve glutathione redox state determination in P. falciparum, plate reader detection was used for real-time imaging of fast events as well as of fixed redox states after mid- and long-term incubations. Advantages and disadvantages over the commonly used microscopic analyses have already been discussed in 5.3. Only parasites that express genomically integrated biosensors give signals that are strong enough for plate reader detection. Overall, it is a very useful tool for quickly analyzing the effects of a broad range of drugs on the glutathione redox state of P. falciparum, but at the same time, the parasites should also be monitored using CLSM in order to follow morphological changes in the parasites due to the effect of different drugs. Moreover, due to the dependancy of the plate reader on specific cell densities that cannot be ensured for all drug treatments because of their possible decreasing effect on parasitemia, CLSM measurements should also be directly performed in order to prevent false positive readouts. The sensor sfroGFP2 showed much higher fluorescence intensity (Figure 4.31), which might be useful for fusing specific proteins to sfroGFP2 for better future monitoring. Since targeting the sensor hGrx1-roGFP2 to the apicoplast and mitochondrion of NF54-attB parasites failed, the sensor sfroGFP2 could be targeted to these organelles, which might be more compatible for the parasites and at the same time will lead to higher fluorescence intensities. The oxidation of both probes was reversible and was demonstrated by adding DTT, which decreased the ratio to the baseline redox state by reducing the disulfide bonds (Figure 4.30). This reversibility also showed the suitability of both sensors for measuring dynamic redox changes in living cells. The leakage phenomenon of the hGrx1-roGFP2 probe in P. falciparum NF54-attB transfectants into the host cell upon exposure to high H2O2 concentrations (e.g. 500 µM) (Figure 4.32) is consistent with the observation using the roGFP2-Orp1 probe (Figure 4.26) under the same conditions (high-resolution microscopy). This might suggest that the parasite’s membrane becomes poriferous due to high H2O2 concentrations and intracellular molecules spread out in the host cell. In the cytosol, sfroGFP2 is just as suitable for detecting changes in the glutathione redox state as hGrx1-roGFP2; however, in subcellular organelles without Grx or in Grx knockdown mutants, sfroGFP2 fused to hGrx1 needs to be used in order to ensure sensitivity to GSSG. For highly oxidized compartments, e.g. the DV or the ER, hGrx1-sfroGFP2-iX (insertion of amino acid X, (E or L)) might be more advantageous. The results of live-cell imaging with the cytosolically expressed hGrx1-roGFP2 and sfroGFP2 biosensors in asexual blood-stages of stably transfected P. falciparum NF54-attB parasites indicated that the mode of action of some novel compounds (compound 1o, ML304, and compound S) may be linked to a
Discussion
110
disturbance of the GSH redox state (Figures 4.33, 4.35, and 4.37) due to significantly increasing the fluorescence ratio in either 4 h or 24 h incubations using CLSM detection. Among the antimalarial drugs tested here using CLSM (ART, ATM, ATS, CQ, QN, MQ, AQ, ATQ, LUM), none significantly increased the fluorescence ratio of both NF54[hGrx1-roGFP2] and NF54[sfroGFP2] parasites (Figures 4.34, 4.36, and 4.38). Therefore, increased oxidative stress does not play a role in their mode of action in parasites. These results are not comparable to the results of Kasozi et al. (2013), where drug effects of antimalarials on P. falciparum 3D7 parasites that had been episomally transfected with hGrx1-roGFP2 were observed via CLSM. This might be due to strain-specific characteristics. However, both hGrx1-roGFP2 and sfroGFP2 sensors responded to the same extent upon exposure to the different drugs, which indicates that the probes are both sensitive and suitable tools for studying GSH redox homeostasis in the cytosol of P. falciparum. The significant effects MQ had on the fluorescence ratio using plate reader detection was most likely a false positive readout derived from a low density of parasites due to its antiparasitic effect, which did not lead to reliable fluorescence signals. This is why CLSM detection always needs to be used in parallel in order to confirm the results of plate reader detection.
5.6 Future perspectives
5.6.1 Malaria control
There is a broad spectrum of interventions to control malaria: eradication of transmitting Anopheles mosquitoes, inhibition of gametocyte formation in the human host, and protection against infection by using insecticides and vaccination. Insecticidal bed nets and spraying insecticide for indoor use are major interventions for malaria control. In fact, insecticide-treated nets have helped reduce child mortality and episodes of clinical malaria (Lengeler, 2004); however, mosquitos have built up resistance to some of these insecticides. Repellants also provide useful protection against malaria. Current research activities include genetically modified mosquitoes to suppress mosquito species that function as vectors for parasite transmission, i.e. releasing sexually active but genetically sterile male mosquitoes that produce no viable progeny into the wild (Catteruccia et al., 2007; Paton et al., 2013). To date, an effective vaccine for malaria, which could intervene at one stage or a combination of stages in the parasite’s life cycle, still remains elusive. Malaria vaccines could be directed at the sporozoite stage in order to prevent infection against the asexual stages in human blood and prevent clinical disease or at the sexual stage in order to prevent transmission. Although more than 30 P. falciparum vaccine candidates are at either advanced preclinical or clinical stages of evaluation, only the RTS,S/AS01 vaccine, which targets the circumsporozoite protein and is dispensed with an adjuvant system, has completed pivotal Phase 3 trials. It showed a protection rate of 35% against severe malaria in children and infants in a Phase 3 clinical study over a 3-4 year period. The efficacy of the vaccine could be increased with a booster dose (Agnandji et al., 2011; WHO 2016). Discovering and implementing a safe and effective vaccine against malaria is a major priority in controlling the disease. A new approach is aimed at probiotic vaccines (Ngwa et al., 2015). Yilmaz et al. (2014) showed that Plasmodium and the human gut pathobiont E.coli O86:B7 both exhibit the glycan Galα1-3Galβ1-4GlcNAc-R (α-gal) on their surfaces in contrast to humans. This enables the expression of anti-α-gal-antibodies in humans, which confers protection against malaria transmission in both humans and mice (Yilmaz et al., 2014). Understanding the biology and behavior of Anopheles mosquitoes can help researchers understand how malaria is transmitted when designing appropriate control strategies.
5.6.2 Genetic markers of resistance
Generating various redox probes as part of this dissertation has paved the way for more detailed antimalarial drug discovery studies in the future. Novel compounds can now be tested with regard to their ability to increase H2O2 levels or disturb GSH homeostasis in the cytosol or subcellular compartments within the malaria parasite. Based on this, the structures of the compounds can be further altered in order to increase the oxidative burden on
Discussion
111
Plasmodium and efficiently kill the parasite. The emergence of drug-resistant Plasmodium strains demands the development of new antimalarial drugs or drug combinations in order to improve their antiparasitic activity. Now, 30 years after the first observation of CQ resistance, 80% of the field isolates worldwide carry resistance (Ginsburg, 2005). A mutation in the first transmembrane domain of the P. falciparum CQ resistance transporter (PfCRT) in the DV, K76T, has been correlated with CQ resistance (CQR) (Fidock et al., 2000; Lakshmanan et al., 2005). Glutathione metabolism has been associated with CQ resistance (Becker et al., 2004; Ginsburg et al., 1998), in which GSH levels were observed to be lower in the cytosol of CQ-resistant parasite lines (Patzewitz et al., 2012). GSH forms a complex with heme in the DV of the parasite in order to prevent oxidative damage, whereas the CQ-heme complex is toxic (Nayyar et al., 2012). Ginsburg and Golenser (2003) reported an increase in glutathione-S-transferase (GST) activity and a reduction in hemozoin levels within the parasite compartment. PfCRT is also able to transport glutathione (Patzewitz et al., 2012). Single point mutations in the DV transporter gene PfMDR1, a parasite homolog of the mammalian multidrug resistance gene 1 (MDR1), also confer resistance to this class of drugs. PfMDR1 encodes a 12-transmembrane domain protein, which is a DV importer (Ferreira et al., 2011). Other known drug resistance genes and mechanisms include the multidrug resistance-associated protein (PfMRP), and P. falciparum Na+/H+ exchanger (Pfnhe) (Petersen et al., 2011). None of these resistance markers have been associated with GSH. Drug resistance, in particular CQ resistance, is a major public health problem in malaria control. The natural protective immunity against malaria in adults living in malaria-endemic zones provides hope that a vaccine against malaria could be developed. ACTs have replaced CQ as the gold standard treatment against uncomplicated malaria in all areas where the WHO deems malaria to be endemic (Dondorp et al., 2009). However, this treatment is also threatened by newly emergent and spreading resistance to ART, which is the key compound in effective antimalarial medicine. Recently, mutations in the propeller domain of the Kelch protein K13 of P. falciparum were detected as markers of ART resistance, in which K13 is putatively linked to oxidative stress as one possible functional role in parasites (Ariey et al., 2014; Straimer et al., 2014; Adams et al., 2000; Mohon et al., 2014; Mbengue et al., 2015; Tilley et al., 2016). Very recently, it was proposed that after iron (Fe2+) activation of ART, the drug causes oxidative stress and cellular damage, indicated by an increase in ubiquitination, while ART-resistant parasites with K13 mutations show lower levels of ubiquitinated proteins due to an increase in stress response (Dogovski et al., 2015). The role of glutathione in this stress response needs to be further investigated. Plasmodium strains with mutations in the propeller domain of the K13 protein can be used, for example, to stably integrate H2O2 or GSH redox sensors into the genome in order to investigate the effects of antimalarial drugs and novel compounds on the resistant strain in comparison to the strain complemented with the wild type version of the protein. These data can be then used to elucidate whether that mutation confers resistance to specific antimalarial drugs or compounds that would increase H2O2 levels or would lead to GSH disturbance in the wild type strain. Acquiring this information will lead to a better understanding of resistance mechanisms in the malaria parasite.
5.6.3 Further development of redox sensor methodology
The future understanding of interlinked processes of organisms will depend on the ability to acquire data with high resolution in time and space. While the redox sensors roGFP2-Orp1, HyPer-3, and roGFP2-Orp1 have already shown their ability to deliver dynamic data, additional improvements and extensions can still be performed. There are different options for further improvement of current redox sensors and for the development of novel redox probes with altered properties and specificities. Current ratiometric redox probes based on roGFPs all emit green light of the same wavelength. Therefore, monitoring redox changes in multiple compartments is technically difficult. Comparison of H2O2 levels or the glutathione potential in different compartments and investigation of redox communication between organelles often requires separate measurements for each compartment. The creation of
Discussion
112
additional color-compatible redox probes would be necessary for simultaneous measurements in two or more subcellular compartments. The development of a ratiometric redox-sensitive fluorescent protein with emission peaks shifted far more towards the red end of the visible spectrum would be favorable to avoid interference with roGFP fluorescence. Ro-GFP2-Orp1, HyPer-3, and hGrx1-roGFP2 are already highly responsive to changes in H2O2 or GSH levels and equilibrate on a second-to-minute timescale. Nevertheless, the response time of roGFP and YFP-based probes could be further shortened in order to allow the detection of highly transient events on even shorter timescales. Furthermore, the influence of linker length on redox relay efficiency has not yet been systematically investigated. The catalytic efficiency of two fusion domains such as roGFP2-Orp1 and hGrx1-roGFP2 might also be affected by the length of the linker between the two fusion proteins. The generation of probes with modified midpoint potentials especially for targeting the ER lumen of cells or the DV of Plasmodium is also important, which would allow redox studies in highly oxidized compartments. A range of novel roGFP versions with modified redox potentials have been generated (Lohman and Remington, 2008), but it remains to be seen whether these midpoint potentials are high enough to dynamically resolve the actual glutathione redox potential in organelles such as the ER lumen. Redox probes can be specifically targeted to subcellular compartments, e.g. the mitochondrion or apicoplast of Plasmodium, by using appropriate N-terminal targeting sequences. HGrx1-roGFP2 was successfully targeted to mitochondria in HeLa cells (Gutscher et al., 2008). However, the same hGrx1-roGFP2 fusion protein was not imported into mitochondria of P. falciparum (Mohring et al., 2017). This might indicate that human Grx1 prevents correct mitochondrial targeting of the probe when expressed in heterologous systems. This might be overcome either by using species-specific Grxs for the fusion protein or by inverting the order of domains and fusing hGrx1 C-terminally to roGFP2. Indeed, recent results demonstrated that the inverted probe with human Grx1 fused to the C-terminus of roGFP2 (roGFP2-Grx1) is successfully targeted to mitochondria in P. falciparum (Mohring et al., 2017). Another possible goal is the development of a Trx-specific redox biosensor. Future work is needed in order to further expand the toolbox of redox probes to other important reactive species such as HO•, NO•, or superoxide radical. This could provide more information about the interconversion and interplay of ROS/RNS and, regarding malaria, about the mechanisms of the antimalarial drugs on the plasmodial redox system. Regarding the biosensor HyPer-3, pH-stable versions of HyPer are necessary for imaging in cells. Until now, redox-sensitive fluorescent proteins have proven to be valuable tools for providing new insights into cellular redox biology.
References
113
6 References
Abad MF, Di Benedetto G, Magalhaes PJ, Filippin L, and Pozzan T (2004) Mitochondrial pH monitored by a new engineered green fluorescent protein mutant. J Biol Chem 279: 11521-11529.
Adams J, Kelso R, and Cooley L (2000) The kelch repeat superfamily of proteins: propellers of cell function. Trends Cell Biol 10: 17-24.
Adjalley SH, Lee Marcus CS, and Fidock DA (2010) A method for rapid genetic integration into Plasmodium falciparum utilizing mycobacteriophage Bxb1 integrase. Methods Mol Biol 634: 87-100.
Agnandji ST, Lell B, Soulanoudjingar SS, Fernandes JF, Abossolo BP, Conzelmann C, et al. (2011) First results of phase 3 trial of RTS,S/AS01 malaria vaccine in African children. N Engl J Med 365: 1863-1875.
Akhoon BA, Singh KP, Varshney M, Gupta SK, and Shukla Y (2014) Understanding the mechanism of atovaquone drug resistance in Plasmodium falciparum cytochrome b mutation Y268S using computational methods. PLoS One 9: e110041.
Akoachere M, Buchholz K, Fischer E, Burhenne J, Haefeli WE, Schirmer RH, and Becker K (2005) In vitro assessment of methylene blue on chloroquine-sensitive and -resistant Plasmodium falciparum strains reveals synergistic action with artemisinins. Antimicrob Agents Chemother 49: 4592-4597.
Albrecht SC, Barata AG, Grosshans J, Teleman AA, and Dick TP (2011) In vivo mapping of hydrogen peroxide and oxidized glutathione reveals chemical and regional specificity of redox homeostasis. Cell Metab 14: 819-829.
Antoine T, Fisher N, Amewu R, O'Neill PM, Ward SA, and Biagini GA (2014) Rapid kill of malaria parasites by artemisinin and semi-synthetic endoperoxides involves ROS-dependent depolarization of the membrane potential. J Antimicrob Chemother 69: 1005-1016.
Ariey F, Witkowski B, Amaratunga C, Beghain J, Langlois AC, Khim N, et al. (2014) A molecular marker of artemisinin-resistant Plasmodium falciparum malaria. Nature 505: 50-55.
Aslund F, Zheng M, Beckwith J, and Storz G (1999) Regulation of the OxyR transcription factor by hydrogen peroxide and the cellular thiol - disulfide status. Proc Nat Acad Sci USA 96: 6161-6165.
Atamna H and Ginsburg H (1993) Origin of reactive oxygen species in erythrocytes infected with Plasmodium falciparum. Mol Biochem Parasitol 61: 231-241.
Atamna H and Ginsburg H (1995) Heme degradation in the presence of glutathione – a proposed mechanism to account for the high-levels of nonheme iron found in the membranes of hemoglobinopathic red blood cells. J Biol Chem 270: 24876-24883.
Atamna H and Ginsburg H (1997) The malaria parasite supplies glutathione to its host cell – Investigation of glutathione transport and metabolism in human erythrocytes infected with Plasmodium falciparum. Eur J Biochem 250: 670-679.
Baggish AL and Hill DR (2002) Antiparasitic agent atovaquone. Antimicrob Agents Chemother 46: 1163-1173.
Bannister LH, Hopkins JM, Fowler RE, Krishna S, and Mitchell GH (2000) A brief illustrated guide to the ultrastructure of Plasmodium falciparum asexual blood stages. Parasitol Today 16: 427-433.
Banzouzi J, Prado R, Menan H, Valentin A, Roumestan C, Mallie M, Pelissier Y, and Blache Y (2002) In vitro antiplasmodial activity of extracts of Alchornea cordifolia and identification of an active constituent: ellagic acid. J Ethnopharmacol 81: 399-401.
Becker K, Gui M, Traxler A, Kirsten C, and Schirmer RH (1994) Redox processes in malaria and other parasitic diseases. Determination of intracellular glutathione. Histochemistry 102: 389-395.
Becker K, Gromer S, Schirmer RH, and Müller S (2000) Thioredoxin reductase as a pathophysiological factor and drug target. Eur J Biochem 267: 6118-6125.
References
114
Becker K, Rahlfs S, Nickel C, and Schirmer RH (2003a) Glutathione – Functions and metabolism in the malarial parasite Plasmodium falciparum. Biol Chem 384: 551-566.
Becker K, Kanzok SM, Iozef R, Fischer M, Schirmer RH, and Rahlfs S (2003b) Plasmoredoxin, a novel redox-active protein unique for malarial parasites. Eur J Biochem 270: 1057-1064.
Becker K, Tilley L, Vennerstrom JL, Roberts D, Rogerson S, and Ginsburg H (2004) Oxidative stress in malaria parasite-infected erythrocytes: host-parasite interactions. Int J Parasitol 34: 163-189.
Beinert H (2000) Iron-sulfur proteins: ancient structures, still full of surprises. J Biol Inorg Chem 5: 2-15.
Belousov VV, Fradkov AF, Lukyanov KA, Staroverov DB, Shakhbazov KS, Terskikh AV, et al. (2006) Genetically encoded fluorescent indicator for intracellular hydrogen peroxide. Nat Methods 3: 281-286.
Bilan DS, Pase L, Joosen L, Gorokhovatsky AY, Ermakova YG, Gadella TW, et al. (2013) HyPer-3: a genetically encoded H2O2 probe with improved performance for ratiometric and fluorescence lifetime imaging. ACS Chem Biol 8: 535-542.
Boddey JA, Moritz RL, Simpson RJ, and Cowman AF (2009) Role of the Plasmodium export element in trafficking parasite proteins to the infected erythrocyte. Traffic 10: 285-299.
Bonini MG, Rota C, Tomasi A, Mason RP (2006) The oxidation of 2’,7’-dichlorofluorescin to reactive oxygen species: a self-fulfilling prophesy? Free Radic Biol Med 40: 968-975.
Bousema T, Okell L, Shekalaghe S, Griffin JT, Omar S, Sawa P, et al. (2010) Revisiting the circulation time of Plasmodium falciparum gametocytes: molecular detection methods to estimate the duration of gametocyte carriage and the effect of gametocytocidal drugs. Malar J 9: 136.
Boveris A (1977) Mitochondrial production of superoxide radical and hydrogen peroxide. Adv Exp Med Biol 78: 67-82.
Bradford MM (1976) A rapid and sensitive method for the quantification of microgram quantities of protein utilizing the principle of protein-dye binding. Analyt Biochem 72: 258-254.
Bray PG, Janneh O, Raynes KJ, Mungthin M, Ginsburg H, and Ward SA (1999) Cellular uptake of chloroquine is dependent on binding to ferriprotoporphyrin IX and is independent of NHE activity in Plasmodium falciparum. J Cell Biol 145: 363-376.
Brzoska K, Meczynska S, and Kruszewski M (2006) Iron-sulfur cluster proteins: electron transfer and beyond. Acta Biochim Pol 53: 685-691.
Buchholz K, Schirmer RH, Eubel JK, Akoachere MB, Dandekar T, Becker K, and Gromer S (2008) Interactions of methylene blue with human disulfide reductases and their orthologues from Plasmodium falciparum. Antimicrob Agents Chemother 52: 183-191.
Cappellini MD and Fiorelli G (2008) Glucose-6-phosphate dehydrogenase deficiency. Lancet 371: 64-74.
Catteruccia F (2007) Malaria vector control in the third millennium: progress and perspectives of molecular approaches. Pest Manag Sci 63: 634-640.
CDC (2015a) Malaria disease. http://www.cdc.gov/malaria/about/disease.html. (03.05.2016) CDC (2015b) Malaria mosquitoes. http://www.cdc.gov/malaria/about/biology/mosquitoes/
index.html. (05.05.2016) CDC (2016) Impact of Malaria. http://www.cdc.gov/malaria/malaria_worldwide/impact.html.
(03.05.2016) Chen D, Toone WM, Mata J, Lyne R, Burns G, Kivinen K, et al. (2003) Global transcriptional
responses of fission yeast to environmental stress. Mol Biol Cell 14: 214-229. Chernin E (1988) Sir Ronald Ross, malaria, and the rewards of research. Med Hist 32: 119-
141. Choi H, Kim S, Mukhopadhyay P, Cho S, Woo J, Storz G, and Ryu S (2001) Structural basis
of the redox switch in the OxyR transcription factor. Cell 105: 103-113.
References
115
Christman MF, Storz G, and Ames BN (1989) OxyR, a positive regulator of hydrogen peroxide-inducible genes in Escherichia coli and Salmonella typhimurium, is homologous to a family of bacterial regulatory proteins. Proc Natl Acad Sci U S A 86: 3484-3488.
Chu J, Zhang Z, Zheng Y, Yang J, Qin L, Lu J, et al. (2009) A novel far-red bimolecular fluorescence complementation systemthat allows for efficient visualization of protein interactions under physiological conditions. Biosens Bioelectron 25: 234-239.
Collinson LP and Dawes IW (1992) Inducibility of the response of yeast cells to peroxide stress. J General Microbiol 138: 329-335.
Costa A, Drago I, Behera S, Zottini M, Pizzo P, Schroeder JI, et al. (2010) H2O2 in plant peroxisomes: an in vivo analysis uncovers a Ca(2+)-dependent scavenging system. Plant J 62: 760-772.
Coulibaly B, Zoungrana A, Mockenhaupt FP, Schirmer RH, Klose C, Mansmann U, et al. (2009) Strong gametocytocidal effect of methylene blue-based combination therapy against falciparum malaria: a randomised controlled trial. PLoS One 4: e5318.
Cowman AF, Berry D, and Baum J (2012) The cellular and molecular basis for malaria parasite invasion of the human red blood cell. J Cell Biol 198: 961-971.
Cox AG, Winterbourn CC, and Hampton MB (2010) Mitochondrial peroxiredoxin involvement in antioxidant defence and redox signalling. Biochem J 425: 313-325.
Cox AG, Peskin AV, Paton LN, Winterbourn CC, and Hampton MB (2009) Redox potential and peroxide reactivity of human peroxiredoxin 3. Biochemistry 48: 6495-6501.
Cox FE (2010) History of the discovery of the malaria parasites and their vectors. Parasit Vectors 3: 5.
Crabb BS, Rug M, Gilberger TW, Thompson JK, Triglia T, Maier AG, et al. (2004) Transfection of the human malaria parasite Plasmodium falciparum. Methods Mol Biol 270: 263-276.
Dagert M and Ehrlich SD (1979) Prolonged incubation in calcium chloride improves the competence of Escherichia coli cells. Gene 6: 23-28.
Dailey ME, Manders E, Soll DR, and Terasaki M (2006) Confocal microscopy of live cells, in Handbook of biological confocal microscopy (ed. Pawley, J. B.) 381-403 (Springer Science+Business Media LLC).
D’Autréaux B and Toledano MB (2007) ROS as signalling molecules: mechanisms that generate specificity in ROS homeostasis. Nat Rev Mol Cell Biol 8: 813-824.
Davies JMS, Lowry CV, and Davies KJA (1995) Transient adaptation to oxidative stress in yeast. Arch Biochem Biophys 317: 1-6.
Delaunay A, Pflieger D, Barrault MB, Vinh J, and Toledano MB (2002) A thiol peroxidase is an H2O2 receptor and redox-transducer in gene activation. Cell 111: 471-481.
Delves M, Plouffe D, Scheurer C, Meister S, Wittlin S, Winzeler EA, et al. (2012) The activities of current antimalarial drugs on the life cycle stages of Plasmodium: A comparative study with human and rodent parasites. PLoS Med 9: p. e1001169.
Dembele L, Gego A, Zeeman AM, Franetich JF, Silvie O, Rametti A, et al. (2011) Towards an in vitro model of Plasmodium hypnozoites suitable for drug discovery. PLoS One 6: p. e18162.
Desjardins RE, Canfield CJ, Haynes JD, and Chulay JD (1979) Quantitative assessment of antimalarial activity in vitro by a semiautomated microdilution technique. Antimicrob Agents Chemother 16: 710-718.
Dogovski C, Xie SC, Burgio G, Bridgford J, Mok S, McCaw JM, et al. (2015) Targeting the cell stress response of Plasmodium falciparum to overcome artemisinin resistance. PLoS Biol 13: e1002132.
Dondorp, AM, Nosten F, Yi P, Das D, Phyo AP, Tarning J, et al. (2009) Artemisinin resistance in Plasmodium falciparum malaria. N Engl J Med 361: 455-467.
Dooley CT, Dore TM, Hanson GT, Jackson WC, Remington SJ, Tsien RY (2004) Imaging dynamic redox changes in mammalian cells with green fluorescent protein indicators. J Biol Chem 279: 22284-22293.
Egan, TJ and Kaschula CH (2007) Strategies to reverse drug resistance in malaria. Curr Opin Infect Dis 20: 598-604.
References
116
Elsner M, Gehrmann W, and Lenzen S (2011) Peroxisome-generated hydrogen peroxide as important mediator of lipotoxicity in insulin-producing cells. Diabetes 60: 200-208.
Enyedi B, Varnai P, and Geiszt M (2010) Redox state of the endoplasmic reticulum is controlled by Ero1L-alpha and intraluminal calcium. Antioxid Redox Signal 13: 721-729.
Ekland EH, Schneider J, and Fidock DA (2011) Identifying apicoplast-targeting antimalarials using high-throughput compatible approaches. FASEB J 25: 3583-3593.
Färber PM, Arscott LD, Williams CH, Becker K, and Schirmer RH (1998) Recombinant Plasmodium falciparum glutathione reductase is inhibited by the antimalarial dye methylene blue. FEBS Lett 422: 311-314.
Fath MA, Diers AR, Aykin-Burns N, Simons AL, Hua L, Spitz DR (2009) Mitochondrial electron transport chain blockers enhance 2-deoxy-D-glucose induced oxidative stress and cell killing in human colon carcinoma cells. Cancer Biol Ther 13: 1228-1236.
Ferreira PE, Holmgren G, Veiga, MI Uhlen P, Kaneko A, and Gil JP (2011) PfMDR1: mechanisms of transport modulation by functional polymorphisms. PLoS One 6: e23875.
Fidock DA, Nomura T, Talley AK, Cooper RA, Dzekunov SM, Ferdig MT, et al. (2000) Mutations in the P. falciparum digestive vacuole transmembrane protein PfCRT and evidence for their role in chloroquine resistance. Mol Cell 6: 861-671.
Fitch, CD (2004) Ferriprotoporphyrin IX, phospholipids, and the antimalarial actions of quinoline drugs. Life Sci 74: 1957-1972.
Fourquet S, Huang ME, D'Autreaux B, and Toledano MB (2008) The dual functions of thiol-based peroxidases in H2O2 scavenging and signaling. Antioxid Redox Signal 10: 1565-1576.
Francis, SE, Sullivan DJ, and Goldberg Jr DE (1997) Hemoglobin metabolism in the malaria parasite Plasmodium falciparum. Annu Rev Microbiol 51: 97-123.
Fry M and Pudney M (1992) Site of action of the antimalarial hydroxynaphthoquinone, 2-[trans-4-(4'-chlorophenyl) cyclohexyl]-3-hydroxy-1,4-naphthoquinone (566C80). Biochem Pharmacol 43: 1545-1553.
Fu Y, Tilley L, Kenny S, and Klonis N (2010) Dual labeling with a far red probe permits analysis of growth and oxidative stress in P. falciparum-infected erythrocytes. Cytometry A 77: 253-263.
Ganesan S, Chaurasiya ND, Sahu R, Walker LA, and Tekwani BL (2012) Understanding the mechanisms for metabolism-linked hemolytic toxicity of primaquine against glucose 6-phosphate dehydrogenase deficient human erythrocytes: Evaluation of eryptotic pathway. Toxicology 294: 54-60.
Gasch AP, Spellman PT, Kao CM, Carmel-Harel O, Eisen MB, Storz G, et al. (2000) Genomic expression programs in the response of yeast cells to environmental changes. Mol Biol Cell 11: 4241-4257.
Ginsburg H, Famin O, Zhang J, and Krugliak M (1998) Inhibition of glutathione-dependent degradation of heme by chloroquine and amodiaquine as a possible basis for their antimalarial mode of action. Biochem Pharmacol 56: 1305-1313.
Ginsburg H and Golenser J (2003) Glutathione is involved in the antimalarial action of chloroquine and its modulation affects drug sensitivity of human and murine species of Plasmodium. Redox Rep 8: 276-279.
Ginsburg H (2005) Should chloroquine be laid to rest? Acta Trop 96: 16-23. Gisselberg JE, Dellibovi-Ragheb TA, Matthews KA, Bosch G, and Prigge ST (2013) The suf
iron-sulfur cluster synthesis pathway is required for apicoplast maintenance in malaria parasites. PLoS Pathog 9: e1003655.
Goldberg DE, Slater AF, Cerami A, and Henderson GB (1990) Hemoglobin degradation in the malaria parasite Plasmodium falciparum: an ordered process in a unique organelle. Proc Natl Acad Sci U S A 87: 2931-2935.
Gorka AP, Dios A de, and Roepe PD (2013) Quinoline drug-heme interactions and implications for antimalarial cytostatic versus cytocidal activities. J Med Chem 56: 5231-5246.
References
117
Gregson A and Plowe CV (2005) Mechanisms of resistance of malaria parasites to antifolates. Pharmacol Rev 57: 117-145.
Gretes, MC, Poole LB, and Karplus PA (2012) Peroxiredoxins in parasites. Antioxid Redox Signal 17: 608-633.
Guillemin J (2002) Choosing scientific patrimony: Sir Ronald Ross, Alphonse Laveran, and the mosquito vector hypothesis for malaria. J Hist Med Allied Sci 57: 385-409.
Gutscher M, Pauleau AL, Marty L, Brach T, Wabnitz GH, Samstag Y, et al. (2008) Real-time imaging of the intracellular glutathione redox potential. Nat Methods 5: 553-559.
Gutscher M, Sobotta MC, Wabnitz GH, Ballikaya S, Meyer AJ, Samstag Y, and Dick TP (2009) Proximity-based protein thiol oxidation by H2O2-scavenging peroxidases. J Biol Chem 284: 31532-31540.
Hafalla JC, Silvie O, and Matuschewski K (2011) Cell biology and immunology of malaria. Immunol Rev 240: 297-316.
Hanson GT, Aggeler R, Oglesbee D, Cannon M, Capaldi RA, Tsien RY, et al. (2004) Investigating mitochondrial redox potential with redox-sensitive green fluorescent protein indicators. J Biol Chem 279: 13044-13053.
Hartwig CL, Rosenthal AS, D'Angelo J, Griffin CE, Posner GH, and Cooper RA (2009) Accumulation of artemisinin trioxane derivatives within neutral lipids of Plasmodium falciparum malaria parasites is endoperoxide-dependent. Biochem Pharmacol 77: 322-336.
Haynes RK, Cheu K, Tang MM, Chen M, Guo Z, Guo Z, et al. (2011) Reactions of antimalarial peroxides with each of leucomethylene blue and dihydroflavins: flavin reductase and the cofactor model exemplified. Chem Med Chem 6: 279-291.
Hill DR, Baird JK, Parise ME, Lewis LS, Ryan ET, and Magill AJ (2006) Primaquine: report from CDC expert meeting on malaria chemoprophylaxis I. Am J Trop Med Hyg 75: 402-415.
Holmgren A (2000) Antioxidant function of thioredoxin and glutaredoxin systems. Antioxid Redox Signal 2: 811-820.
Idro R, Marsh K, John CC, and Newton CR (2010) Cerebral malaria: mechanisms of brain injury and strategies for improved neurocognitive outcome. Pediatric Research 68: 267-274.
Ismail HM, Barton V, Phanchana M, Charoensutthivarakul S, Wong MHL, Hemingway J, et al. (2016) Artemisinin activity-based probes identify multiple molecular targets within the asexual stage of the malaria parasites Plasmodium falciparum 3D7. Proc Natl Acad Sci USA 113: 2080-2085.
Jamieson DJ (1998) Oxidative stress responses of the yeast Saccharomyces cerevisiae. Yeast 14: 1511-1527.
Jensen MD, Conley M, and Helstowski LD (1983) Culture of Plasmodium falciparum: the role of pH, glucose, and lactate. J Parasitol 69: 1060-1067.
Jomaa H, Wiesner J, Sanderbrand S, Altincicek B, Weidemeyer C, et al. (1999) Inhibitors of the nonmevalonate pathway of isoprenoid biosynthesis as antimalarial drugs. Science 285: 1573-1576.
Jones DP and Go YM (2010) Redox compartmentalization and cellular stress. Diabetes Obes Metab 12: 116-125.
Jortzik E, Mallu BM, Preuss J, Fischer M, Bode L, Rahlfs S, et al. (2011) Glucose 6-phosphate dehydrogenase 6-phosphogluconolactonase: a unique bifunctional enzyme from Plasmodium falciparum. Biochem J Energy 436: 641-650.
Jortzik E and Becker K (2012) Thioredoxin and glutathione systems in Plasmodium falciparum. Int J Med Microbiol 302: 187-194.
Jortzik E, Wang L, and Becker K (2012) Thiol-based posttranslational modifications in parasites. Antioxid Redox Signal 17: 657-673.
Kaludercic N, Deshwal S, and Di Lisa F (2014) Reactive oxygen species and redox compartmentalization. Front Physiol 5: 285.
References
118
Kanzok SM, Rahlfs S, Becker K, and Schirmer RH (2002) Thioredoxin, thioredoxin reductase, and thioredoxin peroxidase of malaria parasite Plasmodium falciparum. Methods Enzymol 347: 370-381.
Kappe SH, Vaughan AM, Boddey JA, and Cowman AF (2010) That was then but this is now: malaria research in the time of an eradication agenda. Science 328: 862-866.
Kasozi D, Mohring F, Rahlfs S, Meyer AJ, and Becker K (2013) Real-time imaging of the intracellular glutathione redox potential in the malaria parasite Plasmodium falciparum. PLoS Pathog 9: e1003782.
Kehr S, Sturm N, Rahlfs S, Przyborski JM, and Becker K (2010) Compartmentation of redox metabolism in malaria parasites. PLoS Pathog 6: e1001242.
Kirk K, Horner HA, and Kirk J (1996) Glucose uptake in Plasmodium falciparum-infected erythrocytes is an equilibrative not an active process. Mol Biochem Parasitol 82: 195-205.
Klonis N, Crespo-Ortiz MP, Bottova I, Abu-Bakar N, Kenny S, Rosenthal PJ, et al. (2011) Artemisinin activity against Plasmodium falciparum requires hemoglobin uptake and digestion. Proc Natl Acad Sci U S A 108: 11405-11410.
Koolmann J and Röhm K, Eds. (2003) Taschenatlas der Biochemie. Stuttgart, Georg Thieme Verlag.
Krafts K, Hempelmann E, and Skórska-Stania A (2012) From methylene blue to chloroquine: a brief review of the development of an antimalarial therapy. Parasitol Res 111: 1-6.
Krieg R, Jortzik E, Goetz AA, Blandin S, Wittlin S, Mourad E, et al. (2017) Arylmethylamino steroids as novel antiparasitic agents. Nat Commun 8: 14478.
Krnajski Z, Gilberger TW, Walter RD, Cowman AF, and Müller S (2002) Thioredoxin reductase is essential for the survival of Plasmodium falciparum erythrocytic stages. J Biol Chem 277: 25970-25975.
Kuhn Y, Rohrbach P, and Lanzer M (2007) Quantitative pH measurements in Plasmodium falciparum-infected erythrocytes using pHluorin. Cell Microbiol 9: 1004-1013.
Laemmli UK (1970) Cleavage of structural proteins during the assembly of the head of bacteriophage T4. Nature 227: 680-685.
Lakshmanan V, Bray PG, Verdier-Pinard D, Johnson DJ, Horrocks P, Muhle RA, et al. (2005) A critical role for PfCRT K76T in Plasmodium falciparum verapamil-reversible chloroquine resistance. EMBO J 24: 2294-2305.
Lalève A, Vallières C, Golinelli-Cohen MP, Bouton C, Song Z, Pawlik G, et al. (2016) The antimalarial drug primaquine targets Fe-S cluster proteins and yeast respiratory growth. Redox Biol 7: 21-29.
Lambros C and Vanderberg JP (1979) Synchronization of Plasmodium falciparum erythrocytic stages in culture. J Parasitol 65: 418-420.
Lee KS, Divis PCS, Zakaria SK, Matusop A, Julin RA, Conway DJ, et al. (2011) Plasmodium knowlesi: Reservoir Hosts and Tracking the in Humans and Macaques. PLoS Pathog 7: p. e1002015.
Lell B and Kremsner PG (2002) Clindamycin as an antimalarial drug: review of clinical trials. Antimicrob Agents Chemother 46: 2315-2320.
Lengeler C (2004) Insecticides treated bednets and curtains for preventing malaria. Cochrane Database Syst Rev 2: CD000363.
Li N, Ragheb K, Lawler G, Sturgis J, Rajwa B, Melendez JA, et al. (2003) Mitochondrial complex I inhibitor rotenone induces apoptosis through enhancing mitochondrial reactive oxygenspecies production. J Biol Chem 278: 8516-8525.
Lim L and McFadden GI (2010) The evolution, metabolism and functions of the apicoplast. Philos Trans R Soc Lond B Biol Sci 365: 749-763.
Lingelbach K and Joiner KA (1998) The parasitophorous vacuole membrane surrounding Plasmodium and Toxoplasma: an unusual compartment in infected cells. J Cell Sci 111: 1467-1475.
Lohman JR and Remington SJ (2008) Development of a family of redox-sensitive green fluorescent protein indicators for use in relatively oxidizing sub-cellular environments. Biochemistry 47: 8678-8688.
References
119
Looareesuwan S, Chulay JD, Canfield CJ, and Hutchinson DB (1999) Malarone (atovaquone and proguanil hydrochloride): a review of its clinical development for treatment of malaria. Malarone Clinical Trials Study Group. Am J Trop Med Hyg 60: 533-541.
Loria P, Miller S, Foley M, and Tilley L (1999) Inhibition of the peroxidative degradation of heme as the basis of action of chloroquine and other quinoline antimalarials. Biochem J 339: 363-370.
Lukyanov KA and Belousov VV (2014) Genetically encoded fluorescent redox sensors. Biochim Biophys Acta 1840: 745-756.
MacPherson GG, Warrell MJ, White NJ, Looareesuwan S, and Warrell DA (1985) Human cerebral malaria. A quantitative ultrastructural analysis of parasitized erythrocyte sequestration. Am J Pathol 119: 385-401.
MacRae JI, Dixon MW, Dearnley MK, Chua HH, Chambers JM, Kenny S, et al. (2013) Mitochondrial metabolism of sexual and asexual blood stages of the malaria parasite Plasmodium falciparum. BMC Biol 11: 67.
Malinouski M, Zhou Y, Belousov VV, Hatfield DL, and Gladyshev VN (2011) Hydrogen peroxide probes directed to different cellular compartments. PLoS One 6: p. e14564.
Maloney P, Hedrick M, Peddibhotla S, Hershberger P, Milewski M, Gosalia P, et al. (2012) A 2nd Selective inhibitor of Plasmodium falciparum Glucose-6-Phosphate Dehydrogenase (PfG6PDH). NIH Probe Report, 2nd Probe, updated 2013.
Marks M, Gupta-Wright A, Doherty JF, Singer M, and Walker D (2014) Managing malaria in the intensive care unit. Br J Anaesth 113: 910-921.
Markvicheva KN, Bilan DS, Mishina NM, Gorokhovatsky AY, Vinokurov LM, Lukyanov S, et al. (2011) A genetically encoded sensor for H2O2 with expanded dynamic range. Bioorg Med Chem 19: 1079-1084.
Mbengue A, Bhattacharjee S, Pandharkar T, Liu H, Estiu G, Stahelin RV, et al. (2015) A molecular mechanism of artemisinin resistance in Plasmodium falciparum malaria. Nature 520: 683-687.
Meyer AJ and Dick TP (2010) Fluorescent protein-based redox probes. Antioxid Redox Signal 13: 621-650.
Mohon AN, Alam MS, Bayih AG, Folefoc A, Shahinas D, Haque R, et al. (2014) Mutations in Plasmodium falciparum K13 propeller gene from Bangladesh. Malar J 13: 431.
Mohring F, Pretzel J, Jortzik E, and Becker K (2014) The redox systems of Plasmodium falciparum and Plasmodium vivax: comparison, in silico analyses and inhibitor studies. Curr Med Chem 21: 1728-1756.
Mohring F, Rahbari M, Zechmann B, Rahlfs S, Przyborski JM, Meyer AJ, et al. (2017) Determination of glutathione redox potential and pH value in subcellular compartments of malaria parasites. Free Radic Biol Med 104: 104-117.
Morgan B, Sobotta MC, and Dick TP (2011) Measuring E(GSH) and H2O2 with roGFP2-based redox probes. Free Radic Biol Med 51: 19431951.
Moura PA, Dame JB, and Fidock DA (2009) Role of Plasmodium falciparum digestive vacuole plasmepsins in the specificity and antimalarial mode of action of cysteine and aspartic protease inhibitors. Antimicrob Agents Chemother 53: 4968-4978.
Müller IB, Knockel J, Eschbach ML, Bergmann B, Walter RD, and Wrenger C (2010) Secretion of an acid phosphatase provides a possible mechanism to acquire host nutrients by Plasmodium falciparum. Cell Microbiol 12: 677-691.
Müller S (2003) Thioredoxin reductase and glutathione synthesis in Plasmodium falciparum. Redox Rep 8: 251-255.
Müller S (2004) Redox and antioxidant systems of the malaria parasite Plasmodium falciparum. Mol Microbiol 53: 1291-1305.
Mullis KB and Faloona FA (1987) Specific synthesis of DNA in vitro via a polymerase-catalyzed chain reaction. Methods Enzymol 155: 335-350.
Nayyar GM, Breman JG, Newton PN, and Herrington J (2012) Poor-quality antimalarial drugs in southeast Asia and Sub-Saharan Africa. Lancet Infect Dis 12: 488-496.
Neill SJ, Desikan R, Clarke A, Hurst RD, and Hancock JT (2002) Hydrogen peroxide and nitric oxide as signalling molecules in plants. J Exp Bot 53: 1237-1247.
References
120
Neumann E, Schaefer-Ridder M, Wang Y, and Hofschneider PH (1982) Gene transfer into mouse lyoma cells by electroporation in high electric fields. EMBO J 1: 841-845.
Ngwa CJ and Pradel G (2015) Coming soon: probiotics-based malaria vaccines. Trends Parasitol 31: 2-4.
Nkrumah LJ, Muhle RA, Moura PA, Ghosh P, Hatfull GF, Jacobs Jr WR, et al. (2006) Efficient site-specific integration in Plasmodium falciparum chromosomes mediated by mycobacteriophage Bxb1 integrase. Nat Methods 3: 615-621.
Nzila A (2006) The past, present and future of antifolates in the treatment of Plasmodium falciparum infection. J Antimicrob Chemother 57: 1043-1054.
Olszewski KL, Mather MW, Morrisey JM, Garcia BA, Vaidya AB, Rabinowitz JD, et al. (2010) Branched tricarboxylic acid metabolism in Plasmodium falciparum. Nature 466: 774-778.
Orij R, Postmus J, Ter Beek A, Brul S, and Smits GJ (2009) In vivo measurement of cytosolic and mitochondrial pH using a pH-sensitive GFP derivative in Saccharomyces cerevisiae reveals a relation between intracellular pH and growth. Microbiology 155: 268-278.
Painter HJ, Morrisey JM, Mather MW, and Vaidya AB (2007) Specific role of mitochondrial electron transport in blood-stage Plasmodium falciparum. Nature 446: 88-91.
Painter HJ, Morrisey JM, and Vaidya AB (2010) Mitochondrial electron transport inhibition and viability of intraerythrocytic Plasmodium falciparum. Antimicrob Agents Chemother 54: 5281-5287.
Parsonage D, Desrosiers DC, Hazlett KRO, Sun YC, Nelson KJ, Cox DL, et al. (2010) Broad specificity AhpC-like peroxiredoxin and its thioredoxin reductant in the sparse antioxidant defense system of Treponema pallidum. Proc Nat Acad Sci USA 107: 6240-6245.
Pastore A and Piemonte F (2012) S-Glutathionylation signaling in cell biology: progress and prospects. Eur J Pharm Sci 46: 279-292.
Paton D, Underhill A, Meredith J, Eggleston P, and Tripet F (2013) Contrasted fitness costs of docking and antibacterial constructs in the EE and EVida3 strains validates two-phase genetic transformation system. PLoS One 8: e67364.
Patzewitz EM, Wong EH, and Müller S (2012) Dissecting the role of glutathione biosynthesis in Plasmodium falciparum. Mol Microbiol 83: 304-318.
Paul F, Roath S, Melville D, Warhurst DC, and Osisanya JO (1981) Separation of malaria-infected erythrocytes from whole blood: use of a selective high-gradient magnetic separation technique. Lancet 2: 70-71.
Pedelacq JD, Cabantous S, Tran T, Terwilliger TC, and Waldo GS (2006) Engineering and characterization of a superfolder green fluorescent protein. Nat Biotechnol 24: 79-88.
Percario S, Moreira DR, Gomes BA, Ferreira ME, Goncalves AC, Laurindo PS, et al. (2012) Oxidative stress in malaria. Int J Mol Sci 13: 16346-16372.
Peskin AV, Low FM, Paton LN, Maghzal GJ, Hampton MB, and Winterbourn CC (2007) The high reactivity of peroxiredoxin 2 with H2O2 is not reflected in its reaction with other oxidants and thiol reagents. J Biol Chem 282: 11885-11892.
Petersen I, Eastman R, and Lanzer M (2011) Drug-resistant malaria: molecular mechanisms and implications for public health. FEBS Lett 585: 1551-1162.
Platel DF, Mangou F, and Tribouley-Duret J (1998) High-level chloroquine resistance of Plasmodium berghei is associated with multiple drug resistance and loss of reversal by calcium antagonists. Int J Parasitol 28: 641-651.
Poburko D, Santo-Domingo J, and Demaurex N (2011) Dynamic regulation of the mitochondrial proton gradient during cytosolic calcium elevations. J Biol Chem 286: 11672-11684.
Powis G and Montfort WR (2001) Properties and biological activities of thioredoxins. Annu Rev Biophys Biomol Struct 30: 421-455.
Prasher DC, Eckenrode VK, Ward WW, Prendergast FG, and Cormier MJ (1992) Primary structure of the Aequorea victoria green fluorescent protein. Gene 111: 229-233.
References
121
Preuss J, Hedrick M, Sergienko E, Pinkerton A, Mangravita-Novo A, Smith L, et al. (2012) High-throughput screening for small-molecule inhibitors of Plasmodium falciparum glucose-6-phosphate dehydrogenase 6-phosphogluconolactonase. J Biomol Screen 17 : 738-751.
Rahbari M, Diederich K, Becker K, Krauth-Siegel L, and Jortzik E (2015) Detection of thiol-based redox switch processes in parasites – facts and future. Biol Chem 396: 445-463.
Rahbari M, Rahlfs S, Jortzik E, Bogeski I, Becker K (2017a) H2O2 dynamics in the malaria parasite Plasmodium falciparum. PLoS One 12: e0174837.
Rahbari M, Rahlfs S, Przyborski JM, Schuh AK, Hunt NH, Fidock DA, Grau G, and Becker K (2017b) Hydrogen peroxide dynamics in subcellular compartments of malaria parasites using genetically encoded redox probes. Sci Rep 7: 10449.
Ralph SA, van Dooren GG, Waller RF, Crawford MJ, Fraunholz MJ, Foth BJ, et al. (2004) Tropical infectious diseases: Metabolic maps and functions of the Plasmodium falciparum apicoplast. Nat Rev Microbiol 2: 203-216.
Reddie KG and Carroll KS (2008) Expanding the functional diversity of proteins through cysteine oxidation. Curr Opin Chem Biol 12: 746-754.
Rengelshausen J, Burhenne J, Fröhlich M, Tayrouz Y, Singh SK, Riedel K, et al. (2004) Pharmacokinetic interaction of chloroquine and methylene blue combination against malaria. Eur J Clin Pharmacol 60: 709-715.
Rhee SG, Chang T, Jeong W, and Kang D (2010) Methods for detection and measurement of hydrogen peroxide inside and outside of cells. Mol Cells 29: 539-549.
Röseler A, Prieto JH, Iozef R, Hecker B, Schirmer RH, Kulzer S, et al. (2012) Insight into the selenoproteome of the malaria parasite Plasmodium falciparum. Antioxid Redox Signal 17: 534-543.
Roth E Jr (1990) Plasmodium falciparum carbohydrate metabolism: a connection between host cell and parasite. Blood Cells 16: 453-460. discussion 461-466.
Ruwende C and Hill A (1998) Glucose-6-phosphate dehydrogenase deficiency and malaria. J Mol Med 76: 581-588.
Sambrook J, Fritsch E, and Maniatis T, Eds. (1989) Molecular cloning: a laboratory manual. New York, Cold Spring Harbor Laboratory Press.
Sanger F, Nicklen S, and Coulson AR (1977) DNA sequencing with chain-terminating inhibitors. Proc Natl Acad Sci U S A 74: 5463-5467.
Schindelin J, Arganda-Carreras I, Frise E, Kaynig V, Longair M, Pietzsch T, et al. (2012) Fiji: an open-source platform for biological-image analysis. Nat methods 9: 676-682.
Schirmer RH, Schöllhammer T, Eisenbrand G, and Krauth-Siegel RL (1987) Oxidative stress as a defense mechanism against parasitic infections. Free Radic Res Commun 3: 3-12.
Schlitzer M (2008) Antimalarial drugs - what is in use and what is in the pipeline. Arch Pharm 341: 149-163.
Shekalaghe S, Drakeley C, Gosling R, Ndaro A, van Meegeren M, Enevold A, et al. (2007) Primaquine clears submicroscopic Plasmodium falciparum gametocytes that persist after treatment with sulphadoxine-pyrimethamine and artesunate. PLoS One 2: p. e1023.
Shimomura O, Johnson FH, and Saiga Y (1962) Extraction, purification and properties of aequorin, a bioluminescent protein from the luminous hydromedusan, Aequorea. J Cell Comp Physiol 59: 223-239.
Simoes AP, Van Den Berg JJ, Roelofsen B, and Op den Kamp JA (1992) Lipid peroxidation in Plasmodium falciparum-parasitized human erythrocytes. Arch Biochem Biophys 298: 651-657.
Slavic K, Straschil U, Reininger L, Doerig C, Morin C, Tewari R, et al. (2010) Life cycle studies of the hexose transporter of Plasmodium species and genetic validation of their essentiality. Mol Microbiol 75: 1402-1413.
References
122
Smith DA, Nicholls S, Morgan BA, Brown AJ, and Quinn J (2004) A conserved stress-activated protein kinase regulates a core stress response in the human pathogen Candida albicans. Mol Biol Cell 15: 4179-4190.
Snow RW, Guerra CA, Noor AM, Myint HY, and Hay SI (2005) The global distribution of clinical episodes of Plasmodium falciparum malaria. Nature 434: 214-217.
Srivastava IK, Rottenberg H, and Vaidya AB (1997) Atovaquone, a broad spectrum antiparasitic drug, collapses mitochondrial membrane potential in a malarial parasite. J Biol Chem 272: 3961-3966.
Stocker R, Hunt NH, Buffinton GD, Weidemann MJ, Lewis-Hughes PH, and Clark IA (1985) Oxidative stress and protective mechanisms in erythrocytes in relation to Plasmodium vinckei load. Proc Natl Acad Sci U S A 82: 548-551.
Straimer J, Gnädig NF, Witkowski B, Amaratunga C, Duru V, Ramadani AP, et al. (2014) K13-propeller mutations confer artemisinin resistance in Plasmodium falciparum clinical isolates. Science 347: 428-431.
Sturm N, Hu Y, Zimmermann H, Fritz-Wolf K, Wittlin S, Rahlfs S, et al. (2009) Compounds structurally related to ellagic acid show improved antiplasmodial activity. Antimicrob Agents Chemother 53: 622-630.
Sullivan DJ (2013) Plasmodium drug targets outside the genetic control of the parasite. Curr Pharm Des 19: 282-289.
Sztajer J, Gamain B, Aumann KD, Slominanny C, Becker K, Brigelius-Flohé R, et al. (2001) The putative glutathione peroxidase gene of Plasmodium falciparum codes for a thioredoxin peroxidase. J Biol Chem 276: 7397-7403.
Tan KR, Magill AJ, Parise ME, and Arguin PM (2011) Doxycycline for malaria chemoprophylaxis and treatment: report from the CDC expert meeting on malaria chemoprophylaxis. Am J Trop Med Hyg 84: 517-531.
Tarpey MM, Wink Da, and Grisham MB (2004) Methods for detection of reactive metabolites of oxygen and nitrogen: in vitro and in vivo considerations. Am J Physiol Regul
Integr Comp Physiol 286: R431‐444 Tarun AS, Vaughan AM, and Kappe SH (2009) Redefining the role of de novo fatty acid
synthesis in Plasmodium parasites. Trends Parasitol 25: 545-550. Taylor TE (2009) Caring for children with cerebral malaria: insights gleaned from 20 years on
a research ward in Malawi. Trans R Soc Trop Med Hyg 103: Suppl 1: S6-10. Tilley L, Straimer J, Gnädig NF, Ralph SA, and Fidock DA (2016) Artemisinin action and
resistance in Plasmodium falciparum. Trends Parasitol 32: 682-696. Thomas JA, Buchsbaum RN, Zimniak A, and Racker E (1979) Intracellular pH
measurements in Ehrlich ascites tumor cells utilizing spectroscopic probes generated in situ. Biochem 18: 2210-2218.
Tonkin CJ, Kalanon M, and McFadden GI (2008) Protein targeting to the malaria parasite plastid. Traffic 9: 166-175.
Topell S, Hennecke J, and Glockshuber R (1999) Circularly permuted variants of the green fluorescent protein. FEBS Lett 457: 283-289.
Torrentino-Madamet M, Desplans J, Travaille C, James Y, and Parzy D (2010) Microaerophilic respiratory metabolism of Plasmodium falciparum mitochondrion as a drug target. Curr Mol Med 10: 29-46.
Towbin H, Staehelin T, and Gordon J (1979) Electrophoretic transfer of proteins from polyacrylamide gels to nitrocellulose sheets: procedure and some applications. Proc Natl Acad Sci U S A 76: 4350-4354.
Trager W and Jensen JB (1976) Human malaria parasites in continuous culture. Science 193: 673-675.
Trampuz A, Jereb M, Muzlovic I, and Prabhu RM (2003) Clinical review: Severe malaria. Crit Care 7: 315-323.
Trape JF (2001) The public health impact of chloroquine resistance in Africa. Am J Trop Med Hyg 64: 12-17.
Triglia T, Thompson J, Caruana SR, Delorenzi M, Speed T, and Cowman AF (2001) Identification of proteins from Plasmodium falciparum that are homologous to reticulocyte binding proteins in Plasmodium vivax. Infect Immun 69: 1084-1092.
References
123
Tu Y (2011) The discovery of artemisinin (qinghaosu) and gifts from Chinese medicine. Nat Med 17: 1217-1220.
Turrens JF (2003) Mitochondrial formation of reactive oxygen species. J Physiol 552: 335-344.
Tuteja R (2007) Malaria - an overview. FEBS J 274: 4670-4679. Udeinya IJ and Van Dyke K (1981) 2-Deoxyglucose: inhibition of parasitemia and of
glucosamine incorporation into glycosylated macromolecules, in malarial parasites (Plasmodium falciparum). Pharmacology 23:171-175.
Uneke CJ (2007) Impact of placental Plasmodium falciparum malaria on pregnancy and perinatal outcome in sub-saharan Africa I: introduction to placental malaria. Yale J Biol Med 80: 39-50.
Vaidya AB and Mather MW (2009) Mitochondrial evolution and functions in malaria parasites. Annu Rev Microbiol 63: 249-267.
Van Dooren GG, Stimmler LM, and McFadden GI (2006) Metabolic maps and functions of the Plasmodium mitochondrion. FEMS Microbiol Rev 30: 596-630.
Van Schalkwyk DA, Priebe W, and Saliba KJ (2008) The inhibitory effect of 2-halo derivatives of D-glucose on glycolysis and on the proliferation of the human malaria parasite Plasmodium falciparum. J Pharmacol Exp Ther 327: 511-517.
Varadharajan S, Dhanasekaran S, Bonday ZQ, Rangarajan PN, and Padmanaban G (2002) Involvement of δ-aminolaevulinate synthase encoded by the parasite gene in de novo haem synthesis by Plasmodium falciparum. Biochem J 367: 321-327.
Vaughan AM, O’Neill MT, Tarun AS, Camargo N, Phuong TM, Aly AS, et al. (2009) Type II fatty acid synthesis is essential only for malaria parasite late liver stage development. Cell Microbiol 11: 506-520.
Veal EA, Day AM, and Morgan BA (2007) Hydrogen peroxide sensing and signaling. Mol Cell 26: 1-14.
Wainwright M and Amaral L (2005) The phenothiazinium chromophore and the evolution of antimalarial drugs. Trop Med Int Health 10: 501-511.
Wang J, Huang LY, Li J, Fan QW, Long YC, Li Y, et al. (2010) Artemisinin directly targets malarial mitochondria through its specific mitochondrial activation. PLoS One 5: e9582.
Weder, S (2015) Masterthesis (Stine Müller): Contribution to the establishment of a genetically encoded biosensor of hydrogen peroxide in Plasmodium falciparum. Biochemistry and Molecular Biology, Interdisciplinary Research Center, Justus Liebig University Giessen.
Wei Q, Phu NLM, Dotsch A, Hildebrand F, Panmanee W, Elfarash A, et al. (2012) Global regulation of gene expression by OxyR in an important human opportunistic pathogen. Nucleic Acids Res 40: 4320-4333.
White NJ, van Vugt, M, and Ezzet FD (1999) Clinical Pharmacokinetics and Pharmacodynamics of Artemether-Lumefantrine. Clin Pharmacokinet 37: 105-125.
WHO (2015a) World Malaria Report. Geneva, Switzerland, World Health Organization. WHO (2015b) World Malaria Mapper. (03.05.2016). WHO (2015c) Global Technical Strategy for Malaria 2016-2030. Geneva, Switzerland, World
Health Organization. WHO (2016) Malaria vaccine: WHO position paper on malaria, 2016, weekly epidemiological
record. Wilson RJM, Denny PW, Preiser PR, Rangachari K, Roberts K, Roy A, et al. (1996)
Complete gene map of the plastid-like DNA of the malaria parasite Plasmodium falciparum. J Mol Biol 261: 155-172.
Winterbourn CC (2008) Reconciling the chemistry and biology of reactive oxygen species. Nat Chem Biol 4: 278-286.
Wu RF, Ma Z, Liu Z, and Terada LS (2010) Nox4-derived H2O2 mediates endoplasmic reticulum signaling through local Ras activation. Mol Cell Biol 30: 3553-3568.
Yeh E and DeRisi JL (2011) Chemical rescue of malaria parasites lacking an apicoplast defines organelle function in blood-stage Plasmodium falciparum. PLoS Biol 9: e1001138.
References
124
Yilmaz B, Portugal S, Tran TM, Gozzelino R, Ramos S, Gomes J, et al. (2014) Gut microbiota elicits a protective immune response against malaria transmission. Cell 159: 1277-1289.
Zhao Y, Araki S, Wu J, Teramoto T, Chang YF, Nakano M, et al. (2011) An expanded palette of genetically encoded Ca2+ indicators. Science 333: 1888-1891.
Zheng M, Aslund F, and Storz G (1998) Activation of the OxyR transcription factor by reversible disulfide bond formation. Science 279: 1718-1721.
Zhou MJ, Diwu ZJ, Panchuk-Voloshina N, and Haugland RP (1997) A stable nonfluorescent derivative of resorufin for the fluorometric determination of trace hydrogen peroxide: Applications in detecting the activity of phagocyte NADPH oxidase and other oxidases. Anal Biochem 253: 162-168.
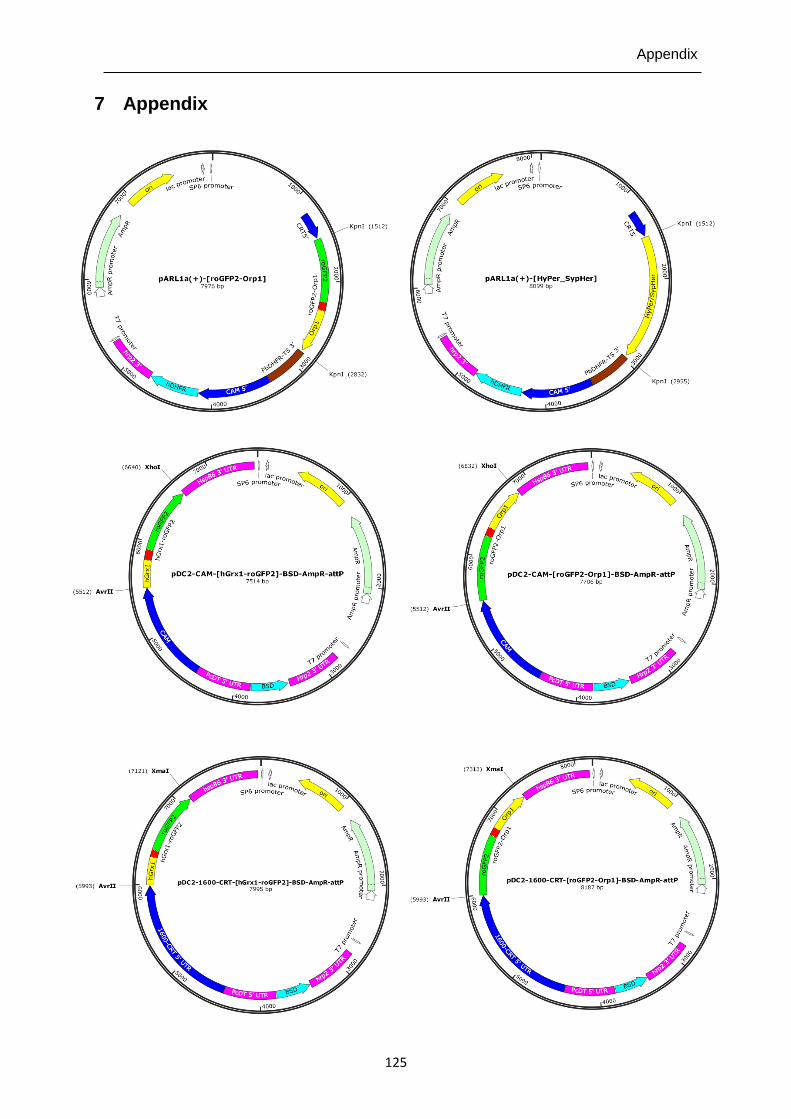
Appendix
125
7 Appendix
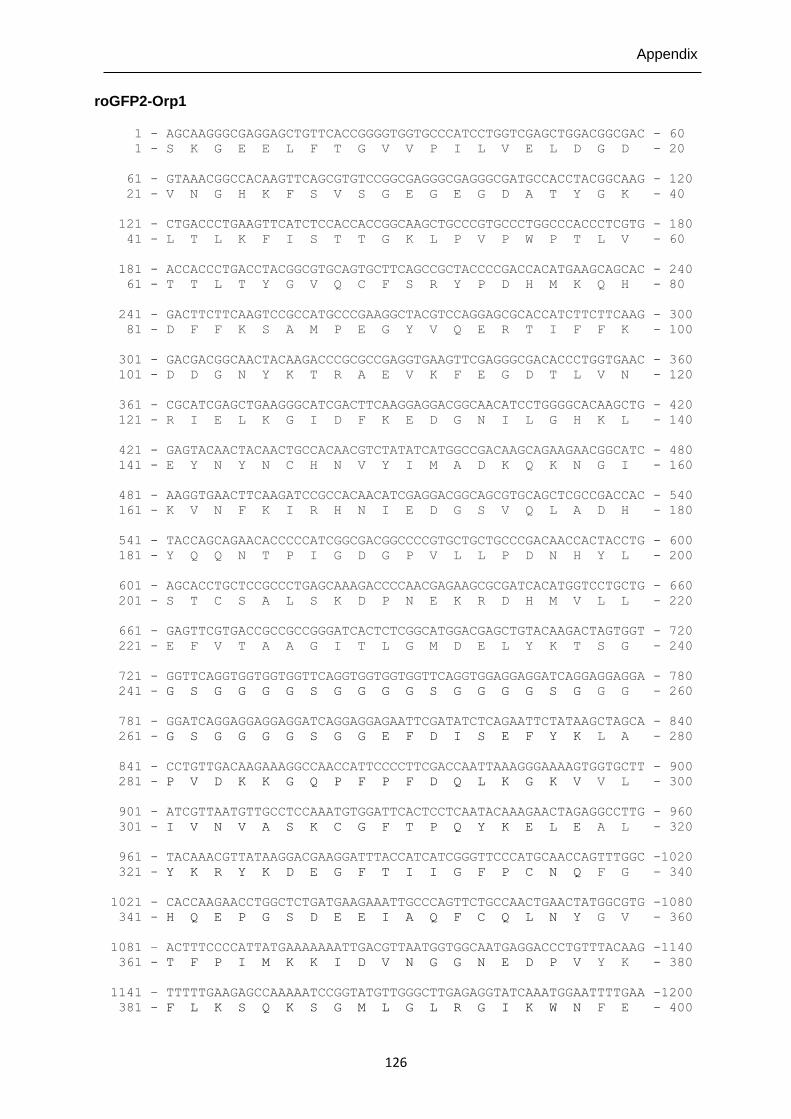
Appendix
126
roGFP2-Orp1
1 - AGCAAGGGCGAGGAGCTGTTCACCGGGGTGGTGCCCATCCTGGTCGAGCTGGACGGCGAC - 60
1 - S K G E E L F T G V V P I L V E L D G D - 20
61 - GTAAACGGCCACAAGTTCAGCGTGTCCGGCGAGGGCGAGGGCGATGCCACCTACGGCAAG - 120
21 - V N G H K F S V S G E G E G D A T Y G K - 40
121 - CTGACCCTGAAGTTCATCTCCACCACCGGCAAGCTGCCCGTGCCCTGGCCCACCCTCGTG - 180
41 - L T L K F I S T T G K L P V P W P T L V - 60
181 - ACCACCCTGACCTACGGCGTGCAGTGCTTCAGCCGCTACCCCGACCACATGAAGCAGCAC - 240
61 - T T L T Y G V Q C F S R Y P D H M K Q H - 80
241 - GACTTCTTCAAGTCCGCCATGCCCGAAGGCTACGTCCAGGAGCGCACCATCTTCTTCAAG - 300
81 - D F F K S A M P E G Y V Q E R T I F F K - 100
301 - GACGACGGCAACTACAAGACCCGCGCCGAGGTGAAGTTCGAGGGCGACACCCTGGTGAAC - 360
101 - D D G N Y K T R A E V K F E G D T L V N - 120
361 - CGCATCGAGCTGAAGGGCATCGACTTCAAGGAGGACGGCAACATCCTGGGGCACAAGCTG - 420
121 - R I E L K G I D F K E D G N I L G H K L - 140
421 - GAGTACAACTACAACTGCCACAACGTCTATATCATGGCCGACAAGCAGAAGAACGGCATC - 480
141 - E Y N Y N C H N V Y I M A D K Q K N G I - 160
481 - AAGGTGAACTTCAAGATCCGCCACAACATCGAGGACGGCAGCGTGCAGCTCGCCGACCAC - 540
161 - K V N F K I R H N I E D G S V Q L A D H - 180
541 - TACCAGCAGAACACCCCCATCGGCGACGGCCCCGTGCTGCTGCCCGACAACCACTACCTG - 600
181 - Y Q Q N T P I G D G P V L L P D N H Y L - 200
601 - AGCACCTGCTCCGCCCTGAGCAAAGACCCCAACGAGAAGCGCGATCACATGGTCCTGCTG - 660
201 - S T C S A L S K D P N E K R D H M V L L - 220
661 - GAGTTCGTGACCGCCGCCGGGATCACTCTCGGCATGGACGAGCTGTACAAGACTAGTGGT - 720
221 - E F V T A A G I T L G M D E L Y K T S G - 240
721 - GGTTCAGGTGGTGGTGGTTCAGGTGGTGGTGGTTCAGGTGGAGGAGGATCAGGAGGAGGA - 780
241 - G S G G G G S G G G G S G G G G S G G G - 260
781 - GGATCAGGAGGAGGAGGATCAGGAGGAGAATTCGATATCTCAGAATTCTATAAGCTAGCA - 840
261 - G S G G G G S G G E F D I S E F Y K L A - 280
841 - CCTGTTGACAAGAAAGGCCAACCATTCCCCTTCGACCAATTAAAGGGAAAAGTGGTGCTT - 900
281 - P V D K K G Q P F P F D Q L K G K V V L - 300
901 - ATCGTTAATGTTGCCTCCAAATGTGGATTCACTCCTCAATACAAAGAACTAGAGGCCTTG - 960
301 - I V N V A S K C G F T P Q Y K E L E A L - 320
961 - TACAAACGTTATAAGGACGAAGGATTTACCATCATCGGGTTCCCATGCAACCAGTTTGGC -1020
321 - Y K R Y K D E G F T I I G F P C N Q F G - 340
1021 - CACCAAGAACCTGGCTCTGATGAAGAAATTGCCCAGTTCTGCCAACTGAACTATGGCGTG -1080
341 - H Q E P G S D E E I A Q F C Q L N Y G V - 360
1081 – ACTTTCCCCATTATGAAAAAAATTGACGTTAATGGTGGCAATGAGGACCCTGTTTACAAG -1140
361 - T F P I M K K I D V N G G N E D P V Y K - 380
1141 – TTTTTGAAGAGCCAAAAATCCGGTATGTTGGGCTTGAGAGGTATCAAATGGAATTTTGAA -1200
381 - F L K S Q K S G M L G L R G I K W N F E - 400
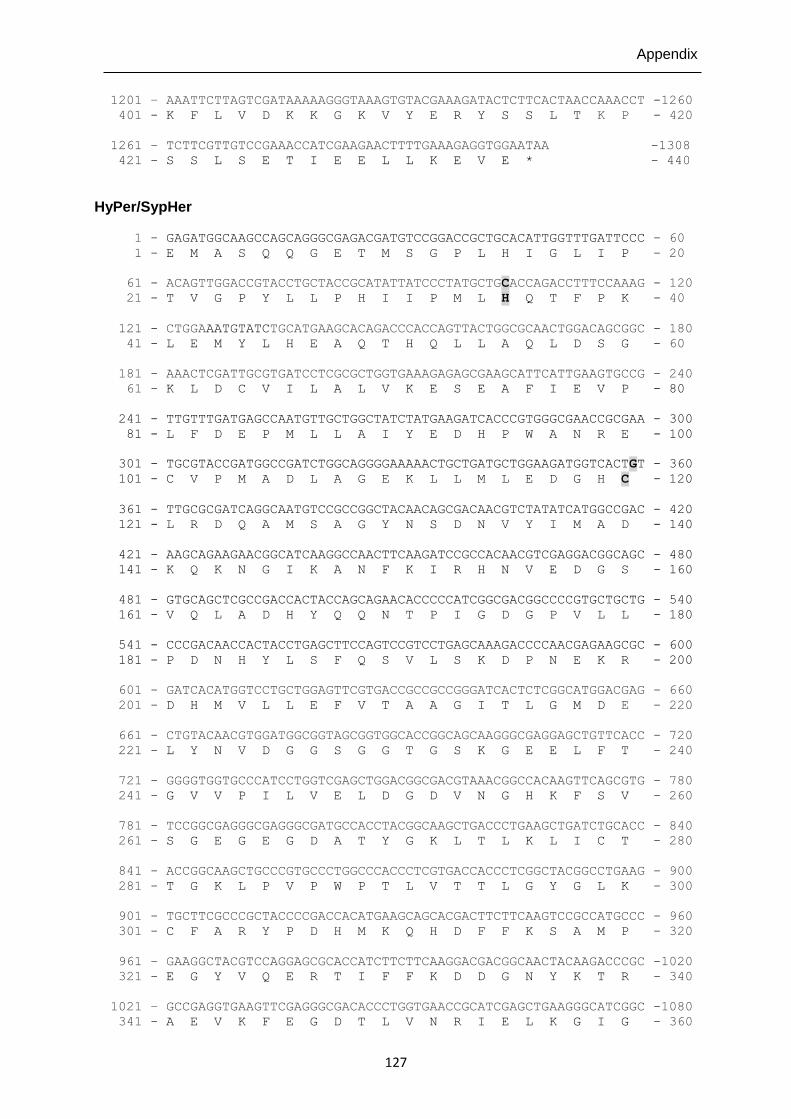
Appendix
127
1201 – AAATTCTTAGTCGATAAAAAGGGTAAAGTGTACGAAAGATACTCTTCACTAACCAAACCT -1260
401 - K F L V D K K G K V Y E R Y S S L T K P - 420
1261 – TCTTCGTTGTCCGAAACCATCGAAGAACTTTTGAAAGAGGTGGAATAA -1308
421 - S S L S E T I E E L L K E V E * - 440
HyPer/SypHer 1 - GAGATGGCAAGCCAGCAGGGCGAGACGATGTCCGGACCGCTGCACATTGGTTTGATTCCC - 60
1 - E M A S Q Q G E T M S G P L H I G L I P - 20
61 - ACAGTTGGACCGTACCTGCTACCGCATATTATCCCTATGCTGCACCAGACCTTTCCAAAG - 120
21 - T V G P Y L L P H I I P M L H Q T F P K - 40
121 - CTGGAAATGTATCTGCATGAAGCACAGACCCACCAGTTACTGGCGCAACTGGACAGCGGC - 180
41 - L E M Y L H E A Q T H Q L L A Q L D S G - 60
181 - AAACTCGATTGCGTGATCCTCGCGCTGGTGAAAGAGAGCGAAGCATTCATTGAAGTGCCG - 240
61 - K L D C V I L A L V K E S E A F I E V P - 80
241 - TTGTTTGATGAGCCAATGTTGCTGGCTATCTATGAAGATCACCCGTGGGCGAACCGCGAA - 300
81 - L F D E P M L L A I Y E D H P W A N R E - 100
301 - TGCGTACCGATGGCCGATCTGGCAGGGGAAAAACTGCTGATGCTGGAAGATGGTCACTGT - 360
101 - C V P M A D L A G E K L L M L E D G H C - 120
361 - TTGCGCGATCAGGCAATGTCCGCCGGCTACAACAGCGACAACGTCTATATCATGGCCGAC - 420
121 - L R D Q A M S A G Y N S D N V Y I M A D - 140
421 - AAGCAGAAGAACGGCATCAAGGCCAACTTCAAGATCCGCCACAACGTCGAGGACGGCAGC - 480
141 - K Q K N G I K A N F K I R H N V E D G S - 160
481 - GTGCAGCTCGCCGACCACTACCAGCAGAACACCCCCATCGGCGACGGCCCCGTGCTGCTG - 540
161 - V Q L A D H Y Q Q N T P I G D G P V L L - 180
541 - CCCGACAACCACTACCTGAGCTTCCAGTCCGTCCTGAGCAAAGACCCCAACGAGAAGCGC - 600
181 - P D N H Y L S F Q S V L S K D P N E K R - 200
601 - GATCACATGGTCCTGCTGGAGTTCGTGACCGCCGCCGGGATCACTCTCGGCATGGACGAG - 660
201 - D H M V L L E F V T A A G I T L G M D E - 220
661 - CTGTACAACGTGGATGGCGGTAGCGGTGGCACCGGCAGCAAGGGCGAGGAGCTGTTCACC - 720
221 - L Y N V D G G S G G T G S K G E E L F T - 240
721 - GGGGTGGTGCCCATCCTGGTCGAGCTGGACGGCGACGTAAACGGCCACAAGTTCAGCGTG - 780
241 - G V V P I L V E L D G D V N G H K F S V - 260
781 - TCCGGCGAGGGCGAGGGCGATGCCACCTACGGCAAGCTGACCCTGAAGCTGATCTGCACC - 840
261 - S G E G E G D A T Y G K L T L K L I C T - 280
841 - ACCGGCAAGCTGCCCGTGCCCTGGCCCACCCTCGTGACCACCCTCGGCTACGGCCTGAAG - 900
281 - T G K L P V P W P T L V T T L G Y G L K - 300
901 - TGCTTCGCCCGCTACCCCGACCACATGAAGCAGCACGACTTCTTCAAGTCCGCCATGCCC - 960
301 - C F A R Y P D H M K Q H D F F K S A M P - 320
961 – GAAGGCTACGTCCAGGAGCGCACCATCTTCTTCAAGGACGACGGCAACTACAAGACCCGC -1020
321 - E G Y V Q E R T I F F K D D G N Y K T R - 340
1021 – GCCGAGGTGAAGTTCGAGGGCGACACCCTGGTGAACCGCATCGAGCTGAAGGGCATCGGC -1080
341 - A E V K F E G D T L V N R I E L K G I G - 360
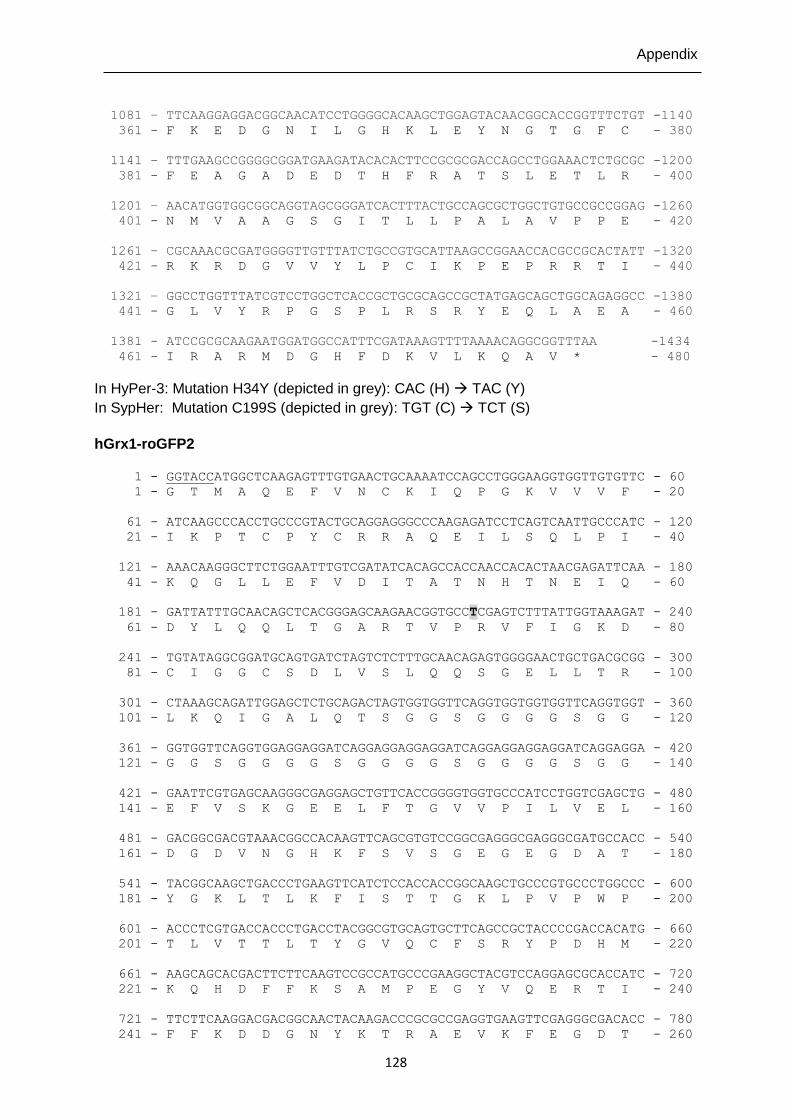
Appendix
128
1081 – TTCAAGGAGGACGGCAACATCCTGGGGCACAAGCTGGAGTACAACGGCACCGGTTTCTGT -1140
361 - F K E D G N I L G H K L E Y N G T G F C - 380
1141 – TTTGAAGCCGGGGCGGATGAAGATACACACTTCCGCGCGACCAGCCTGGAAACTCTGCGC -1200
381 - F E A G A D E D T H F R A T S L E T L R - 400
1201 – AACATGGTGGCGGCAGGTAGCGGGATCACTTTACTGCCAGCGCTGGCTGTGCCGCCGGAG -1260
401 - N M V A A G S G I T L L P A L A V P P E - 420
1261 – CGCAAACGCGATGGGGTTGTTTATCTGCCGTGCATTAAGCCGGAACCACGCCGCACTATT -1320
421 - R K R D G V V Y L P C I K P E P R R T I - 440
1321 – GGCCTGGTTTATCGTCCTGGCTCACCGCTGCGCAGCCGCTATGAGCAGCTGGCAGAGGCC -1380
441 - G L V Y R P G S P L R S R Y E Q L A E A - 460
1381 - ATCCGCGCAAGAATGGATGGCCATTTCGATAAAGTTTTAAAACAGGCGGTTTAA -1434
461 - I R A R M D G H F D K V L K Q A V * - 480
In HyPer-3: Mutation H34Y (depicted in grey): CAC (H) TAC (Y)
In SypHer: Mutation C199S (depicted in grey): TGT (C) TCT (S)
hGrx1-roGFP2 1 - GGTACCATGGCTCAAGAGTTTGTGAACTGCAAAATCCAGCCTGGGAAGGTGGTTGTGTTC - 60
1 - G T M A Q E F V N C K I Q P G K V V V F - 20
61 - ATCAAGCCCACCTGCCCGTACTGCAGGAGGGCCCAAGAGATCCTCAGTCAATTGCCCATC - 120
21 - I K P T C P Y C R R A Q E I L S Q L P I - 40
121 - AAACAAGGGCTTCTGGAATTTGTCGATATCACAGCCACCAACCACACTAACGAGATTCAA - 180
41 - K Q G L L E F V D I T A T N H T N E I Q - 60
181 - GATTATTTGCAACAGCTCACGGGAGCAAGAACGGTGCCTCGAGTCTTTATTGGTAAAGAT - 240
61 - D Y L Q Q L T G A R T V P R V F I G K D - 80
241 - TGTATAGGCGGATGCAGTGATCTAGTCTCTTTGCAACAGAGTGGGGAACTGCTGACGCGG - 300
81 - C I G G C S D L V S L Q Q S G E L L T R - 100
301 - CTAAAGCAGATTGGAGCTCTGCAGACTAGTGGTGGTTCAGGTGGTGGTGGTTCAGGTGGT - 360
101 - L K Q I G A L Q T S G G S G G G G S G G - 120
361 - GGTGGTTCAGGTGGAGGAGGATCAGGAGGAGGAGGATCAGGAGGAGGAGGATCAGGAGGA - 420
121 - G G S G G G G S G G G G S G G G G S G G - 140
421 - GAATTCGTGAGCAAGGGCGAGGAGCTGTTCACCGGGGTGGTGCCCATCCTGGTCGAGCTG - 480
141 - E F V S K G E E L F T G V V P I L V E L - 160
481 - GACGGCGACGTAAACGGCCACAAGTTCAGCGTGTCCGGCGAGGGCGAGGGCGATGCCACC - 540
161 - D G D V N G H K F S V S G E G E G D A T - 180
541 - TACGGCAAGCTGACCCTGAAGTTCATCTCCACCACCGGCAAGCTGCCCGTGCCCTGGCCC - 600
181 - Y G K L T L K F I S T T G K L P V P W P - 200
601 - ACCCTCGTGACCACCCTGACCTACGGCGTGCAGTGCTTCAGCCGCTACCCCGACCACATG - 660
201 - T L V T T L T Y G V Q C F S R Y P D H M - 220
661 - AAGCAGCACGACTTCTTCAAGTCCGCCATGCCCGAAGGCTACGTCCAGGAGCGCACCATC - 720
221 - K Q H D F F K S A M P E G Y V Q E R T I - 240
721 - TTCTTCAAGGACGACGGCAACTACAAGACCCGCGCCGAGGTGAAGTTCGAGGGCGACACC - 780
241 - F F K D D G N Y K T R A E V K F E G D T - 260
Appendix
129
781 - CTGGTGAACCGCATCGAGCTGAAGGGCATCGACTTCAAGGAGGACGGCAACATCCTGGGG - 840
261 - L V N R I E L K G I D F K E D G N I L G - 280
841 - CACAAGCTGGAGTACAACTACAACTGCCACAACGTCTATATCATGGCCGACAAGCAGAAG - 900
281 - H K L E Y N Y N C H N V Y I M A D K Q K - 300
901 - AACGGCATCAAGGTGAACTTCAAGATCCGCCACAACATCGAGGACGGCAGCGTGCAGCTC - 960
301 - N G I K V N F K I R H N I E D G S V Q L - 320
961 - GCCGACCACTACCAGCAGAACACCCCCATCGGCGACGGCCCCGTGCTGCTGCCCGACAAC -1020
321 - A D H Y Q Q N T P I G D G P V L L P D N - 340
1021 - CACTACCTGAGCACCTGCTCCGCCCTGAGCAAAGACCCCAACGAGAAGCGCGATCACATG -1080
341 - H Y L S T C S A L S K D P N E K R D H M - 360
1081 - GTCCTGCTGGAGTTCGTGACCGCCGCCGGGATCACTCTCGGCATGGACGAGCTGTACAAG -1140
361 - V L L E F V T A A G I T L G M D E L Y K - 380
1141 - ATTGGTACC - 1149
381 - I G T - 383
In pDC2-CAM-[hGrx1-roGFP2]-attP plasmid: T mutated to A. roGFP2-hGrx1 1 - GGTACCATGGTGAGCAAGGGCGAGGAGCTGTTCACCGGGGTGGTGCCCATCCTGGTCGAG - 60
1 - G T M V S K G E E L F T G V V P I L V E - 20
61 - CTGGACGGCGACGTAAACGGCCACAAGTTCAGCGTGTCCGGCGAGGGCGAGGGCGATGCC - 120
21 - L D G D V N G H K F S V S G E G E G D A - 40
121 - ACCTACGGCAAGCTGACCCTGAAGTTCATCTCCACCACCGGCAAGCTGCCCGTGCCCTGG - 180
41 - T Y G K L T L K F I S T T G K L P V P W - 60
181 - CCCACCCTCGTGACCACCCTGACCTACGGCGTGCAGTGCTTCAGCCGCTACCCCGACCAC - 240
61 - P T L V T T L T Y G V Q C F S R Y P D H - 80
241 - ATGAAGCAGCACGACTTCTTCAAGTCCGCCATGCCCGAAGGCTACGTCCAGGAGCGCACC - 300
81 - M K Q H D F F K S A M P E G Y V Q E R T - 100
301 - ATCTTCTTCAAGGACGACGGCAACTACAAGACCCGCGCCGAGGTGAAGTTCGAGGGCGAC - 360
101 - I F F K D D G N Y K T R A E V K F E G D - 120
361 - ACCCTGGTGAACCGCATCGAGCTGAAGGGCATCGACTTCAAGGAGGACGGCAACATCCTG - 420
121 - T L V N R I E L K G I D F K E D G N I L - 140
421 - GGGCACAAGCTGGAGTACAACTACAACTGCCACAACGTCTATATCATGGCCGACAAGCAG - 480
141 - G H K L E Y N Y N C H N V Y I M A D K Q - 160
481 - AAGAACGGCATCAAGGTGAACTTCAAGATCCGCCACAACATCGAGGACGGCAGCGTGCAG - 540
161 - K N G I K V N F K I R H N I E D G S V Q - 180
541 - CTCGCCGACCACTACCAGCAGAACACCCCCATCGGCGACGGCCCCGTGCTGCTGCCCGAC - 600
181 - L A D H Y Q Q N T P I G D G P V L L P D - 200
601 - AACCACTACCTGAGCACCTGCTCCGCCCTGAGCAAAGACCCCAACGAGAAGCGCGATCAC - 660
201 - N H Y L S T C S A L S K D P N E K R D H - 220
661 - ATGGTCCTGCTGGAGTTCGTGACCGCCGCCGGGATCACTCTCGGCATGGACGAGCTGTAC - 720
221 - M V L L E F V T A A G I T L G M D E L Y - 240
Appendix
130
721 - AAGACTAGTGGTGGTTCAGGTGGTGGTGGTTCAGGTGGTGGTGGTTCAGGTGGAGGAGGA - 780
241 - K T S G G S G G G G S G G G G S G G G G - 260
781 - TCAGGAGGAGGAGGATCAGGAGGAGGAGGATCAGGAGGAGAATTCGCTCAAGAGTTTGTG - 840
261 – S G G G G S G G G G S G G E F A Q E F V - 280
841 - AACTGCAAAATCCAGCCTGGGAAGGTGGTTGTGTTCATCAAGCCCACCTGCCCGTACTGC - 900
281 – N C K I Q P G K V V V F I K P T C P Y C - 300
901 – AGGAGGGCCCAAGAGATCCTCAGTCAATTGCCCATCAAACAAGGGCTTCTGGAATTTGTC - 960
301 – R R A Q E I L S Q L P I K Q G L L E F V - 320
961 - GATATCACAGCCACCAACCACACTAACGAGATTCAAGATTATTTGCAACAGCTCACGGGA -1020
321 – D I T A T N H T N E I Q D Y L Q Q L T G - 340
1021 - GCAAGAACGGTGCCTCGAGTCTTTATTGGTAAAGATTGTATAGGCGGATGCAGTGATCTA -1080
341 – A R T V P R V F I G K D C I G G C S D L - 360
1081 - GTCTCTTTGCAACAGAGTGGGGAACTGCTGACGCGGCTAAAGCAGATTGGAGCTCTGCAG -1140
361 – V S L Q Q S G E L L T R L K Q I G A L Q - 380
1141 - ATTGGTACC -1149
381 – I G T - 383
sfroGFP2 1 - ATGGTTAGTAAAGGAGAAGAACTTTTCACTGGAGTTGTCCCAATTCTTGTTGAATTAGAT - 60
1 - M V S K G E E L F T G V V P I L V E L D - 20
61 - GGTGATGTTAATGGGCACAAATTTTCTGTCAGAGGAGAGGGTGAAGGTGATGCAACAAAT - 120
21 - G D V N G H K F S V R G E G E G D A T N - 40
121 - GGAAAACTTACCCTTAAATTTATTAGTACTACTGGAAAACTACCTGTTCCATGGCCAACA - 180
41 - G K L T L K F I S T T G K L P V P W P T - 60
181 - CTTGTCACTACTCTTACTTATGGTGTCCAATGCTTTAGTAGATACCCAGATCATATGAAA - 240
61 - L V T T L T Y G V Q C F S R Y P D H M K - 80
241 - AGACATGACTTTTTCAAGAGTGCCATGCCCGAAGGTTATGTACAGGAAAGAACTATAAGT - 300
81 - R H D F F K S A M P E G Y V Q E R T I S - 100
301 - TTCAAAGATGACGGGACATACAAGACACGTGCTGAAGTCAAGTTTGAAGGTGATACCCTT - 360
101 - F K D D G T Y K T R A E V K F E G D T L - 120
361 - GTTAATAGAATCGAGTTAAAAGGTATTGATTTTAAAGAAGATGGAAACATTCTTGGACAC - 420
121 - V N R I E L K G I D F K E D G N I L G H - 140
421 - AAATTGGAATACAACTTTAACTGTCACAATGTATACATCACTGCAGACAAACAAAAGAAT - 480
141 - K L E Y N F N C H N V Y I T A D K Q K N - 160
481 - GGAATCAAAGCAAACTTCAAAATTAGACACAACGTAGAAGATGGAAGCGTTCAACTAGCA - 540
161 - G I K A N F K I R H N V E D G S V Q L A - 180
541 - GACCATTATCAACAAAATACTCCAATTGGCGATGGCCCTGTCCTTTTACCAGACAACCAT - 600
181 - D H Y Q Q N T P I G D G P V L L P D N H - 200
601 - TACCTGTCCACATGTTCTGTACTTTCGAAAGATCCCAACGAAAAGAGAGACCACATGGTC - 660
201 - Y L S T C S V L S K D P N E K R D H M V - 220
661 - CTTCTTGAGAGAGTAACAGCTGCTGGGATTACACATGGCATGGATGAACTATACAAATAA - 720
221 - L L E R V T A A G I T H G M D E L Y K * - 240
Appendix
131
Superfolder mutations are depicted in grey.
pHluorin 1 - ATGAGTAAAGGAGAAGAACTTTTCACTGGAGTTGTCCCAATTCTTGTTGAATTAGATGGT - 60
1 - M S K G E E L F T G V V P I L V E L D G - 20
61 - GATGTTAATGGGCACAAATTTTCTGTCAGTGGAGAGGGTGAAGGTGATGCAACATACGGA - 120
21 - D V N G H K F S V S G E G E G D A T Y G - 40
121 - AAACTTACCCTTAAATTTATTTGCACTACTGGAAAACTACCTGTTCCATGGCCAACACTT - 180
41 - K L T L K F I C T T G K L P V P W P T L - 60
181 - GTCACTACTTTCTCTTATGGTGTTCAATGCTTTTCAAGATACCCAGATCATATGAAACGG - 240
61 - V T T F S Y G V Q C F S R Y P D H M K R - 80
241 - CATGACTTTTTCAAGAGTGCCATGCCCGAAGGTTATGTACAGGAAAGAACTATATTTTTC - 300
81 - H D F F K S A M P E G Y V Q E R T I F F - 100
301 - AAAGATGACGGGAACTACAAGACACGTGCTGAAGTCAAGTTTGAAGGTGATACCCTTGTT - 360
101 - K D D G N Y K T R A E V K F E G D T L V - 120
361 - AATAGAATCGAGTTAAAAGGTATTGATTTTAAAGATGATGGAAACATTCTTGGACACAAA - 420
121 - N R I E L K G I D F K D D G N I L G H K - 140
421 - TTGGAATACAACTATAACGAGCACTTGGTGTACATCATGGCAGACAAACAAAAGAATGGT - 480
141 - L E Y N Y N E H L V Y I M A D K Q K N G - 160
481 - ACCAAAGCTATCTTTCAAGTTCACCACAACATTGAAGATGGAGGCGTTCAACTAGCAGAC - 540
161 - T K A I F Q V H H N I E D G G V Q L A D - 180
541 - CATTATCAACAAAATACTCCAATTGGCGATGGCCCTGTCCTTTTACCAGACAACCATTAC - 600
181 - H Y Q Q N T P I G D G P V L L P D N H Y - 200
601 - CTGCACACACAATCTGCCCTTTCGAAAGATCCCAACGAAAAGAGAGACCACATGGTCCTT - 660
201 - L H T Q S A L S K D P N E K R D H M V L - 220
661 - CTTGAGTTTGTAACAGCTGCTGGGATTACACATGGCATGGATGAACTATACAAATAA - 720
221 - L E F V T A A G I T H G M D E L Y K * - 240
Acyl carrier protein 1 – GGTACCATGAAGATCTTATTACTTTGTATAATTTTTCTATATTATGTTAACGCTTTTAAA – 60
1 - G T M K I L L L C I I F L Y Y V N A F K - 20
61 – AATACACAAAAAGATGGAGTGTCCTTACAAATATTAAAAAAGAAAAGAAGCAACCAAGTG - 120
21 – N T Q K D G V L S Q I L K K K R S N Q V - 40
121 – AATTTTTTAAATAGAAAAAATGATTACAATTTGATAAAAAATAAAAACCCATCTAGCTCT - 180
41 – N F L N R K N D Y N L I K N K N P S S S - 60
181 - TTAAAAGGTACC - 192
61 – L K G T - 64
Citrate synthase 1 – GGTACCATGGAAGGAATAAGATACCTATCATGCAATAAAATTTTGTATAAAAGAACAGGG - 60
1 – G T M E G I R Y L S C N K I L Y K R T G - 20
61 – TCTACAAAAACGCTTATAAATTCATTAAGAAAAAGATATGAGCATAATAATTTTAAAAAG - 120
21 - S T K T L I N S L R K R Y E H N N F K K - 40
Appendix
132
121 – AAAACTTGTGAACAAGTATTAAATACTGTAAATAAATTGCATAATGAAAAGCGATATTTT - 180
41 - K T C E Q V L N T V N K L H N E K R Y F - 60
181 – AATTTTTCTTGTTCTTTTACAAAATCCAGTAGATGGAATATTTGTATGAATAGACATAAC – 240
61 - N F S C S F T K S S R W N I C M N R H N - 80
241 – AGTCGTTTTTTTTCTAGCAATGAATCTAATAAGAATTTATATCTTGAAAATTATGCTAAT – 300
81 - S R F F S S N E S N K N L Y L E N Y A N - 100
301 – ATTAGAAAACATATTAATAGTATAGATAATGAAGAATCTGTTATTATGAATATTTTGAAA – 360
101 - I R K H I N S I D N E E S V I M N I L K - 120
361 – GGTACC - 366
121 – G T - 140
Plasmepsin IV 1 – GGTACCATGGCTCTTACCGTTAAAGAAGAAGAATTTTCGAATACATTGATTAAAAATGCT - 60 1 – G T M A L T V K E E E F S N T L I K N A - 20
61 – TCAGCATTTGATCGATTGAAATTAGGTAATTTGAAGAACTTGAAAATCCAGAAAAAGCTT - 120
21 - S A F D R L K L G N L K N L K I Q K K L - 40
121 – CAGTTTTTATATTTAATATTGTTTGTCCTTATTACGGGTGTGTTTTTCTTTTTTTTGATT - 180
41 - Q F L Y L I L F V L I T G V F F F F L I - 60
181 - GGAAATTTTTATTCACATCGCAAGTTGTATCAAGTTGGTACC - 223
61 - G N F Y S H R K L Y Q V G T - 74
STEVOR
1 – ATGAAGATGTATAACCTTAAAATGTTATTGTTTAACTTTTTAATAAATGTTTTAGTATTA - 60 1 – M K M Y N L K M L L F N F L I N V L V L - 20
61 – CCACATTATGAAAATTATCAAAATAACCAT - 90
21 - P H Y E N Y Q N N H - 30