fused salt concentration cells with transference transport...
TRANSCRIPT
This work has been digitalized and published in 2013 by Verlag Zeitschrift für Naturforschung in cooperation with the Max Planck Society for the Advancement of Science under a Creative Commons Attribution4.0 International License.
Dieses Werk wurde im Jahr 2013 vom Verlag Zeitschrift für Naturforschungin Zusammenarbeit mit der Max-Planck-Gesellschaft zur Förderung derWissenschaften e.V. digitalisiert und unter folgender Lizenz veröffentlicht:Creative Commons Namensnennung 4.0 Lizenz.
Fused Salt Concentration Cells with Transference Transport Numbers of Molten Alkali Chloride and Silver Chloride Mixtures R. Conradt, J. Richter, and H. Wettich
Institut für Physikalische Chemie der R W T H Aachen
Z. Naturforsch. 38 a, 1 2 8 - 1 3 4 (1983); received October 22, 1982
Dedicated to Professor Alfred Klemm on the occasion of his 70th birthday
By emf measurements on concentrat ion cells with silver electrodes the t ransport numbers of molten NaCl + AgCl, KCl + AgCl, RbCl + AgCl, and CsCl + AgCl have been determined over the whole concentration range at tempera tures between 800 and 1075 K. All systems show an "inversion poin t" (equal cation mobili t ies), which shifts to h igher silver chloride concentrations with higher temperatures . At high dilutions the di luted cation is always the less mobi le one.
This paper reports on the transport numbers of the systems NaCl + AgCl, KCl + AgCl, RbCl + AgCl, and CsCl + AgCl over the whole concentration range and temperatures between 800 and 1075 K, as obtained from e.m.f.-measurements.
Experimental
The cells were of the type:
terminal
Ag
•PVIII
terminal electrode melt 1 melt II electrode
Ag Ag MCl+AgCl (V , )
MCl+AgCl (-VII)
Ag
M I <P\ <P\\\ <P\ <P\\ <P\\ <PVI
r T" T" T
(1)
M stands for Na, K, Rb, and Cs. T ' denotes the temperature of the equipment, T" of the electrodes and the melts. The (p-, are electrical potentials, and x\ and A'n two different mole fractions of silver chloride. The double line indicates the liquid junc-tion. The measurable e.m.f. (P = cpwIn — <pvii depends on the composition and temperature and contains the liquid junction potential <pu - (px.
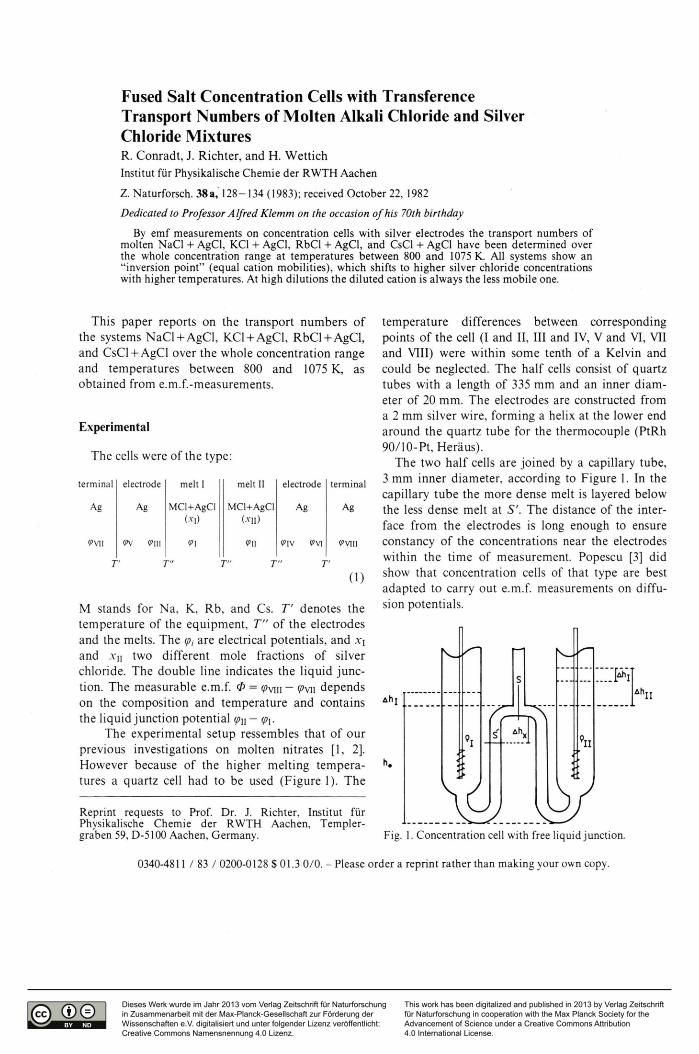
The experimental setup ressembles that of our previous investigations on molten nitrates [1, 2], However because of the higher melting tempera-tures a quartz cell had to be used (Figure 1). The
Reprint requests to Prof. Dr. J. Richter , Institut fü r Physikalische Chemie der R W T H Aachen, Templer -graben 59, D-5100 Aachen, Germany.
temperature differences between corresponding points of the cell (I and II, III and IV, V and VI, VII and VIII) were within some tenth of a Kelvin and could be neglected. The half cells consist of quartz tubes with a length of 335 mm and an inner diam-eter of 20 mm. The electrodes are constructed from a 2 mm silver wire, forming a helix at the lower end around the quartz tube for the thermocouple (PtRh 90/10-Pt, Heräus).
The two half cells are joined by a capillary tube, 3 mm inner diameter, according to Figure 1. In the capillary tube the more dense melt is layered below the less dense melt at 5". The distance of the inter-face f rom the electrodes is long enough to ensure constancy of the concentrations near the electrodes within the time of measurement. Popescu [3] did show that concentration cells of that type are best adapted to carry out e.m.f. measurements on diffu-sion potentials.
Ahj
h.
T
Fig. 1. Concentra t ion cell with free liquid junction.
0340-4811 / 83 / 0200-144 $ 01.3 0 /0 . - Please order a reprint ra ther than making your own copy.
R. Conradt et al. • Fused Salt Concentration Cells with Transference 129
Concentration differences J X\ — xh ^ 0.2 where used. All measurements were summed up and referred to pure AgCl. The temperatures were chosen according to the phase diagram of the mixtures [4], As highest temperatures, 1090 K was chosen for NaCl + AgCl and 1075 K for the three other systems. The lowest temperature was some 10 K higher than the melting point of the higher melting component, but at least at 775 K, which is above the melting point for the reference melt AgCl (730 K). Due to suggestions by Stern [5, 6] that at mole fractions .xA g a ^ 0 . 1 2 the reaction
Ag + AlkCl AgCl + Alk
takes place, measurements below -xAgci = 0.15 were not evaluated though our own measurements did show that the e.m.f. data below this mole fraction are not affected by this reaction.
The filling amounts of the half cells resulted from the geometry of the cell and the demand that the phases have to meet at the junction level S'. The volumes of the half cells up to the height h0 (Fig. 1) were evaluated to be 15.5 ml. First the phases are separated by a slight excess pressure of argon, put on the middle capillary tube. When the pressure is reduced, the phases meet at 5. In order to shift the junction from S to S' (Ahx = 10 mm), an additional volume AVU = A • A/?n has to be added to phase II with the smaller density gn (A: sectional area of the wide tube). With that the filling amounts of the half cells result to be:
m\ = 15.5 ml gi;
m | | = (15.5 ml + AFJJ) .
The shift of the interface from S to S\ causes a shift of the levels in the wide tubes by A hi = 2 mm.
The densities and £n of the mixtures were calculated by linear interpolations from the densities of the pure components [7]. The shift of the junction level from S to S' causes a very narrow zone of mixing. The separation and contacting of the two phases by means of a combined pressure and protective gas apparatus is described in details by Conradt [8],
The cell is heated in a furnace "ASK 200" Fibro-thal, Bülten and Kanthal, with three heating zones, each being separately regulated. The e.m.f. of the thermocouples and the electrodes are recorded by a digital multimeter 191, Keithley.
Theory and Results
From the sum of the equilibrium potential differ-ence (<p\ - (p\\]) + ((p\\— (p\\) and the liquid junction potential {(p\\-<p\), one gets [9] the measurable e.m.f. of the concentration cell with transference (1)
" t F<t> = RT \ — d \n(x2f2) • (2)
i x \ Therein it is assumed that the thermal diffusion potentials {(p\—(p\\\) and {(p\\— <pw) of the elec-trodes and the contact potentials (<pvii— <Pv) and i<P\i — <Pvm) compensates each other. This is the case in the experiment. F is the Faraday constant, R the gas constant, and T the temperature. ta is the trans-port number of the constituent a, a = Na, K, Rb, and Cs. .X| and .x2 are the mole fractions of com-ponent 1 and 2, respectively, and f2 the activity coefficient of AgCl. In the following x2 always stand for *Agci- It has to be stressed that (2) is only valid for melts of the type AC 4 BC [10]. The common anion constituent y = CI is the reference substance of the " H i t t o r f ' f rame of reference, where
tx 4 fy = 1 and ty = 0
are always valid (ß = Ag). From the binary systems mentioned above, three
types of isothermal-isobaric galvanic cells may be constructed:
T y p e B B : B j BC j AC + BC | B
Type C C : C j BC | AC 4 BC | C
Type BC: B | AC 4 BC | C .
Cells of the type BB and CC are concentration cells with transference, the e.m.f.'s <£BB and &cc of which are referred to the standard melt. As usual the standard melt is the pure component with the ion species for which the electrodes are reversible (.v2= 1). In <2>bb the noncommon ion constituent determines the potential, in &Cc the common ion constituent. The cell of the type BC is a chemical cell, whose measurable e.m.f. 0 is referred to the e.m.f. (P' of the standard melt: tf>Bc = <P —
The e.m.f. 0 B B is given by (2). Cell (1) is an example for the type BB. The e.m.f. according to Haase [9], is
11 t — Y F(PCC=RT\ ^ d In (.Y2 f2) (4)
i -v,
130 R. Conrad t et al. • Fused Salt Concentrat ion Cells with Transference 130
and the e.m.f. <£Bc is
F0QC = -RT\n(x2f2).
The combinat ion of (2), (4), and (5) gives
5 0 BC <Pf
I A I \ Ö-V2 T.P or
0 C C = - J ty-X, ld<P ' B C
9 . Y 2
d.v2 ,
(5)
(6)
(7) T.P
respectively. Thus f rom (6) and (7) taking (5) into account we get
^ C C = ^ B B + ^ b c - (8)
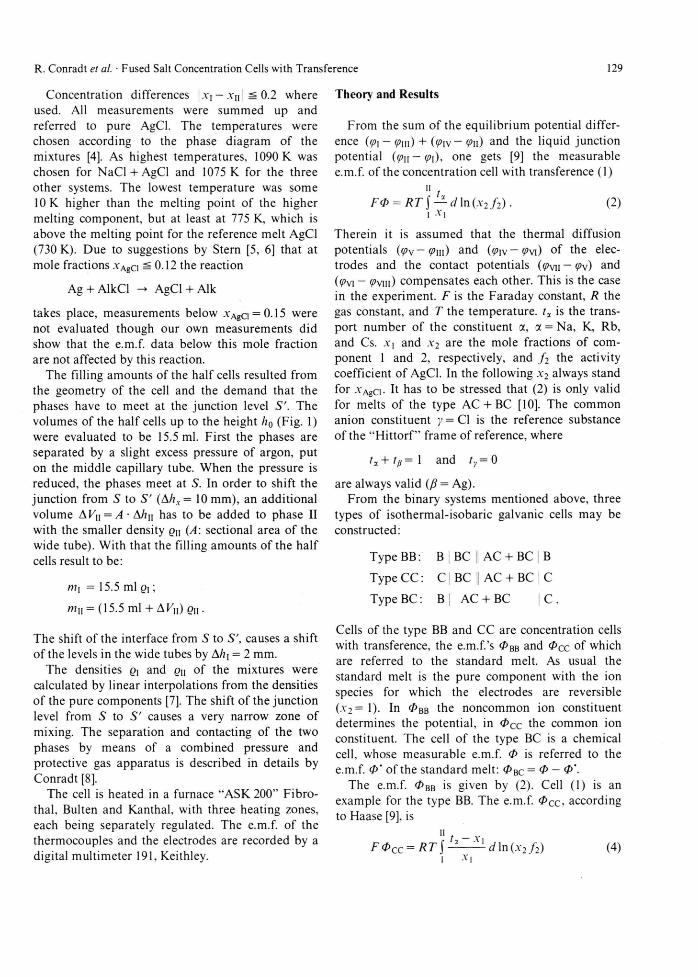
Table 1. The constants c and d of (12) for the evaluat ion of the e.m.f. <*>BB of the system NaCl + AgCl, KCl + AgCl. RbCl + AgCl, and CsCl + AgCl. Mean deviat ion ö<Pßß
and m a x i m u m deviation <5<£>BB .
System Mole Constants Mean Max. System fraction dev. dev.
• YAgCl c - d - 103 <5<Z>bb <5<Z>BB
~mV mV K" 1 mV mV
NaCl + AgCl 0.15 82.03 216.12 0.7 1.4 NaCl + AgCl 0.2 68.10 181.21 0.6 1.3 0.3 52.96 137.13 0.5 1.0 0.4 40.62 105.02 0.4 0.9 0.5 30.00 79.24 0.4 0.7 0.6 21.77 58.58 0.3 0.6 0.7 14.57 40.74 0.2 0.4 0.8 9.43 26.08 0.2 0.3 0.9 4.52 12.50 0.2 0.3
KCl + AgCl 0.15 10.65 229.22 0.9 1.7 KCl + AgCl 0.2 11.76 199.46 0.8 1.6 0.3 14.28 154.63 0.7 1.3 0.4 16.11 120.10 0.6 1.1 0.5 15.08 90.01 0.5 0.9 0.6 13.51 65.29 0.4 0.8 0.7 10.81 44.06 0.3 0.6 0.8 7.36 26.19 0.2 0.4 0.9 5.00 13.11 0.3 0.5
RbCl + AgCl 0.1 -33.46 265.70 0.8 1.6 RbCl + AgCl 0.2 --21.20 196.75 0.7 1.3 0.3 -- 9.61 153.81 0.5 1.1 0.4 0.54 120.53 0.4 0.9 0.5 6.69 91.23 0.4 0.7 0.6 8.53 64.76 0.3 0.6 0.7 8.23 42.90 0.2 0.5 0.8 6.31 25.05 0.2 0.3 0.9 4.00 11.39 0.2 0.3
CsCl + AgCl 0.1 -85.73 255.87 0.8 1.6 CsCl + AgCl 0.2 --63.51 192.24 0.7 1.3 0.3 --39.79 153.24 0.6 1.1 0.4 --16.65 123.66 0.5 1.0 0.5 -- 1.44 95.32 0.4 0.8 0.6 5.32 67.80 0.3 0.6 0.7 6.75 43.82 0.2 0.5 0.8 5.65 24.97 0.2 0.3 0.9 3.52 11.03 0.2 0.3
This means that only two of the three e.m.f.'s of the cells considered above are independent of each other.
For the systems studied in this paper, the equa-tions
0 ' B B
and
t-, = ~ Xi
/ , = -Vi
<£BC 0'cc
0R
(9)
(10) BC
result f rom (6) and (7), where the prime indicates d i f ferent ia t ion with respect to x2, at constant T and P. At the concentrat ion where the funct ion /a(.Y|) - .Y| changes sign (inversion point), one has
0 ' c r = O. ( 1 1 ) The measured e.m.f. of cell (1) depends linearly on tempera ture at constant .Y2:
0 BB : c + dT.
In Table 1 the coefficients c and d of the investigat-ed systems are listed together with the m a x i m u m and mean error of the e.m.f.
The transport numbers are evaluated according to (9), where also the derivat ion of 0 B C and with that the activity coefficient comes in. We have suggested a consistency test [11], to be able to choose reliable l i terature da ta for <2>BC. According to it, for all four investigated systems, the 0BC's of Pelton and Flen-gas [12] were taken for the evaluation of (9). The experimental transport numbers may be fitted by the following polynomial depending on the com-position and the t empera ture of the melt:
= -xi + -v2 [(qo + q\ In T) ^
+ ( / -o+r , In + + In T):v?].
Looking at the concentrat ion dependence, (13) has the form of an extended Porter expression.
For all four systems the values of the constants qo,...,S\ are s u m m e d up in Table 2. They are at least valid in the t empera ture range f rom 500 to 800 °C. Table 3 lists the transport numbers /a of all four systems at 1075 K as calculated according to (9), the absolute m a x i m u m errors öt%, the mean errors ötx, the parameters of the polynomial (13), and the mobil i ty ratios u j u p . The errors listed in Table 3 result f rom the propagat ion of the mean and m a x i m u m errors of the e.m.f. values entering
R. Conradt et al. • Fused Salt Concentration Cells with Transference 131
Table 2. Values of the parameters q0,..., Si of (13).
NaCl + AgCl
KCl + AgCl
RbCl + AgCl
CsCl + AgCl
<7o - 6.7573 - 2.2653 - 1.8900 - 4.8507 q\ 0.9487 0.2762 0.2219 0.6562 r0 28.1197 -14.4401 -15.1501 -10.3731 r\ - 3.9293 2.2774 2.3729 1.6496
-39 .4882 15.0086 14.7740 21.8325 5.6093 - 2.2479 - 2.1969 - 3.1666
Table 3. Transport numbers, (a = Na, K, Rb, Cs), absolute m a x i m u m and mean errors, dtx and S t f i t s according to (13), txfn, and mobility ratio, ujuß, of the systems NaCl + AgCl, KCl + AgCl, RbCl + AgCl, and CsCl + AgCl at 1075 K
-YAgCI ' a 5t% ötx 'a fit ujup
NaCl + AgCl
0.1 — — — 0.920 1.278 0.2 0.830 0.060 O . O l o 0.833 1.247 0.3 0.735 O . O 6 5 O . O I 5 0.739 1.213 0.4 0.65s O . O 8 5 O . O I 5 0.639 1.180 0.5 0.530 0.080 O . O I 5 0.532 1.137 0.6 0.410 O . O 6 5 O . O I 5 0.421 1.091 0.7 0.310 0.050 O . O l o 0.309 1.043 0.8 0.200 0.035 O . O O 5 0.198 0.988 0.9 0.095 0.020 O . O O 5 0.094 0.934
KCl + AgCl
0.1 — — — 0.938 1.681 0.2 0,900 0.045 O . O l o 0.863 1.575 0.3 0.765 0.05s O . O l o 0.773 1.459 0.4 0.680 0.055 O . O l o 0.670 1.354 0.5 0.55s 0.05s O . O l o 0.555 1.247 0.6 0.430 0.050 O . O l o 0.433 1.146 0.7 0.305 0.035 O . O l o 0.308 1.039 0.8 0.185 0.020 O . O O 5 0.188 0.926 0.9 O . O 8 5 O . O I 5 O . O O 5 0.082 0.804
RbCl + AgCl
0.1 — — — 0.943 1.838 0.2 0.870 0.025 O . O O 5 0.869 1.658 0.3 0.780 0.030 O . O l o 0.778 1.502 0.4 0.665 0.035 O . O O 5 0.673 1.372 0.5 0.545 0.035 O . O O 5 0.556 1.252 0.6 0.445 0.030 O . O O 5 0.432 1.141 0.7 0.315 0.030 O . O O 5 0.307 1.034 0.8 0.185 0.020 O . O O 5 0.187 0.920 0.9 0.080 O . O l o O.OOo 0.082 0.804
CsCl + AgCl
0.1 — — — 0.948 2.026 0.2 O . 8 6 5 0.045 O . O l o 0.875 1.750 0.3 0.795 0.050 O . O l o 0.783 1.546 0.4 0.690 0.050 O . O l o 0.676 1.391 0.5 0.550 0.045 O . O l o 0.558 1.262 0.6 0.425 0.040 O . O l o 0.434 1.150 0.7 0.310 0.035 O . O l o 0.310 1.048 0.8 0.195 0.025 O . O O 5 0.192 0.950 0.9 O . O 8 5 0.020 O . O O 5 0.086 0.847
Na1.0
K 1.0
Rbl.O
Cs 1.0
0,75
0,25
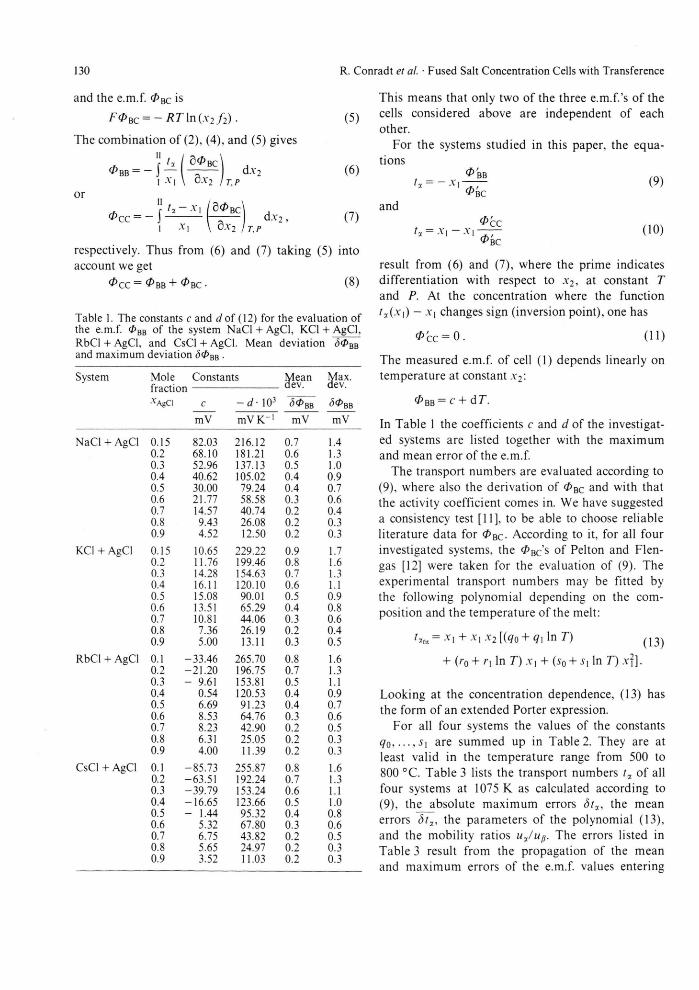
Fig. 2. Transport number of the alkali ion constituents in the systems NaCl + AgCl, KCl + AgCl, RbCl + AgCl, and CsCl + AgCl at 960 K as a function of the mole fraction *AgCI •
(9). F i g u r e 2 s h o w s t h e c o n c e n t r a t i o n d e p e n d e n c e of t h e t r a n s p o r t n u m b e r s o f t h e a lka l i i o n c o n s t i t u e n t s in t he s y s t e m s N a C l 4 A g C l , K C l + A g C l , R b C l + A g C l , a n d C s C l 4 A g C l , all a t 960 K .
Discuss ion
T h e o c c u r r e n c e o f i n v e r s i o n p o i n t s , w h i c h h a s b e e n d i s cove red in 1960 by Pe r i e a n d C h e m l a [13], is well set t led f o r m a n y sys t ems b u t in s o m e cases t h e r e exist c o n t r o v e r s a r y e x p e r i m e n t a l results. T h u s f o r the sys tems A g N 0 3 + K N 0 3 a n d A g N 0 3 + R b N 0 3
at 3 5 0 ° C inve r s ion p o i n t s h a v e b e e n f o u n d at A a c h e n [2], [1] w h i l e t h e y w o u l d n o t exis t a c c o r d i n g to D u k e a n d O w e n s [14] a n d to O k a d a a n d K a w a m u r a [15], r e spec t ive ly . T h e r e f o r e , in t h e f o l l o w i n g it sha l l b e i n v e s t i g a t e d if f o r t h e f o u r s y s t e m s of t h e p r e s e n t s t udy the e x i s t e n c e o f i n v e r s i o n p o i n t s w i t h s t a n d s
132 R. Conradt et al. • Fused Salt Concentration Cells with Transference 132
mV
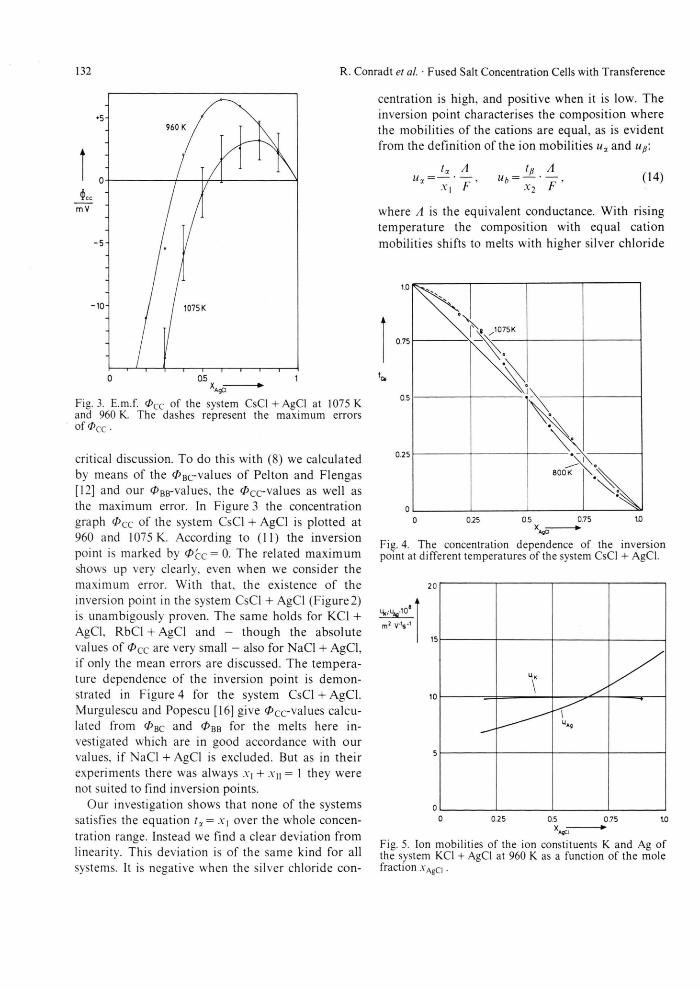
Fig. 3. E.m.f. 0 C C of the system CsCl + AgCl at 1075 K and 960 K. The dashes represent the maximum errors of 0 C C .
critical discussion. To do this with (8) we calculated by means of the $B C -values of Pelton and Flengas [12] and our 0B B-values, the <Z>cc-values as well as the maximum error. In Figure 3 the concentration graph 0 C c o f the system CsCl 4 AgCl is plotted at 960 and 1075 K. According to (11) the inversion point is marked by 0'cc = 0- The related max imum shows up very clearly, even when we consider the maximum error. With that, the existence of the inversion point in the system CsCl 4 AgCl (Figure2) is unambigously proven. The same holds for KCl + AgCl, RbCl + AgCl and - though the absolute values of 0 C C are very small - also for NaCl + AgCl, if only the mean errors are discussed. The tempera-ture dependence of the inversion point is demon-strated in Figure 4 for the system CsCl 4 AgCl. Murgulescu and Popescu [16] give 0cc-values calcu-lated from 0 B C and 0 B B for the melts here in-vestigated which are in good accordance with our values, if NaCl + AgCl is excluded. But as in their experiments there was always .V| -I- a"» = 1 they were not suited to find inversion points.
Our investigation shows that none of the systems satisfies the equation tx = .Y, over the whole concen-tration range. Instead we find a clear deviation f rom linearity. This deviation is of the same kind for all systems. It is negative when the silver chloride con-
centration is high, and positive when it is low. The inversion point characterises the composition where the mobilities of the cations are equal, as is evident from the definition of the ion mobilities and Up.
A_ ~F Mb ll
*2
A ~F
( 1 4 )
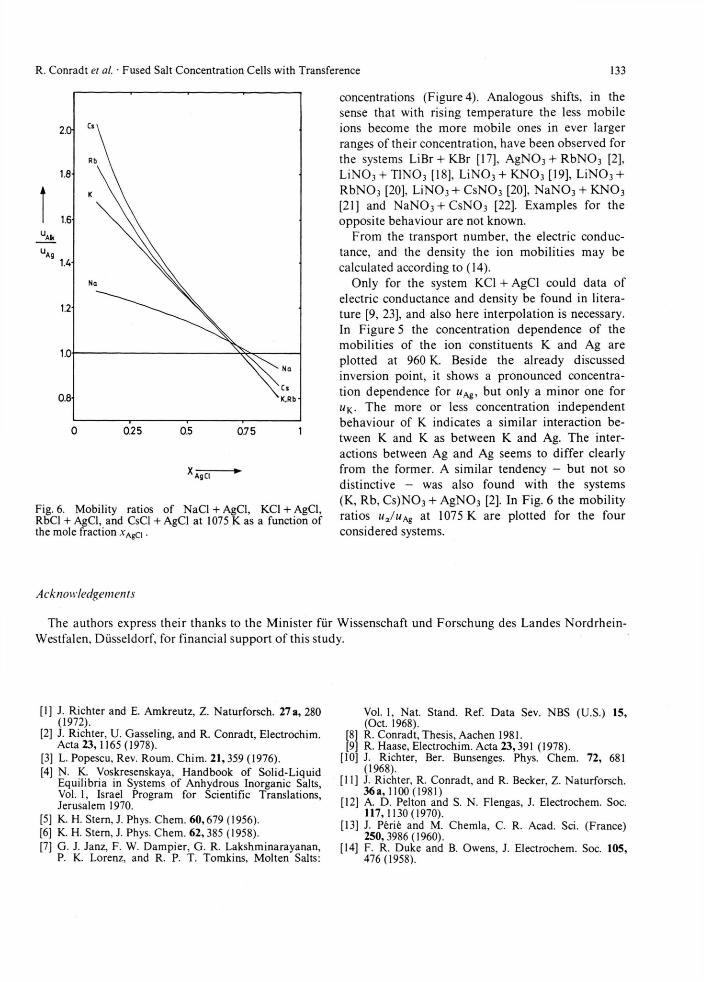
where A is the equivalent conductance. With rising temperature the composition with equal cation mobilities shifts to melts with higher silver chloride
0.75
0.5
\ \ S g 1075K \ \ \ V
\
\ > 800 K \
0.25
Fig. 4. The concentration dependence of the inversion point at different temperatures of the system CsCl + AgCl.
20
10°
m2 V V
> "1
U*3
0.5 X.
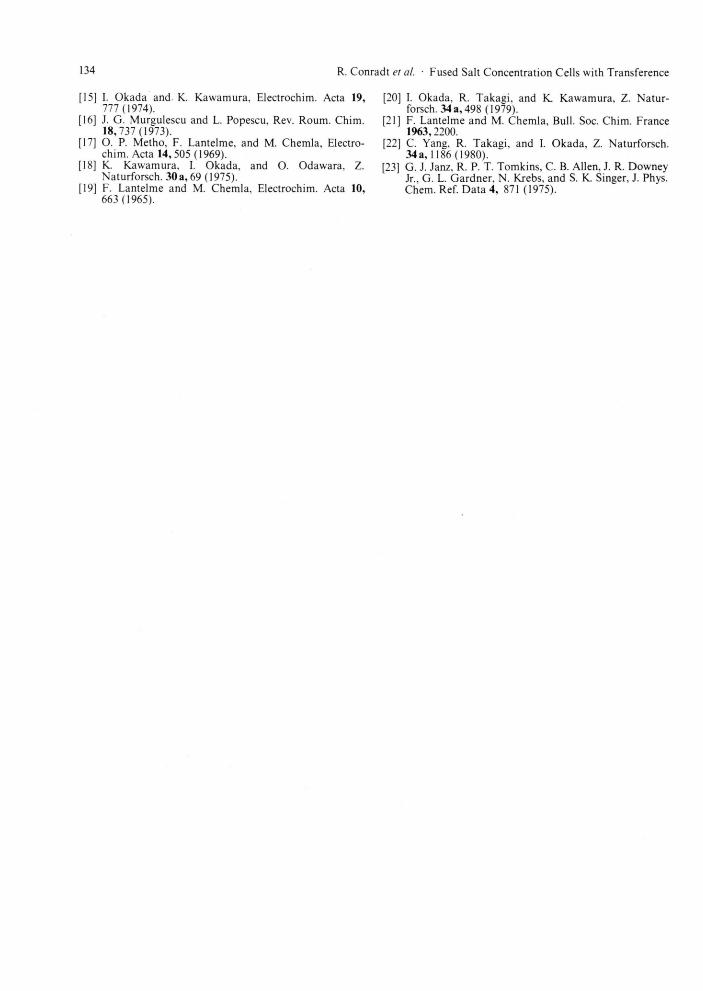
Fig. 5. Ion mobilities of the ion constituents K and Ag of the system KCl + AgCl at 960 K as a function of the mole fraction .vA g a .
R. Conradt et al. • Fused Salt Concentration Cells with Transference 133
XXS5 -
Fig. 6. Mobility ratios of NaCl + AgCl, KCl + AgCl, RbCl + AgCl, and CsCl + AgCl at 1075 K as a function of the mole fraction .vAgC1.
concentrations (Figure 4). Analogous shifts, in the sense that with rising tempera ture the less mobi le ions become the more mobile ones in ever larger ranges of their concentration, have been observed for the systems LiBr + KBr [17], A g N 0 3 + R b N 0 3 [2], L i N 0 3 + T l N 0 3 [18], L i N 0 3 + K N 0 3 [19], L i N 0 3 + R b N 0 3 [20], L i N 0 3 + C s N 0 3 [20], N a N 0 3 + K N 0 3
[21] and N a N 0 3 + C s N 0 3 [22], Examples for the opposite behaviour are not known.
From the transport number , the electric conduc-tance, and the density the ion mobili t ies may be calculated according to (14).
Only for the system KCl + AgCl could data of electric conductance and density be found in litera-ture [9, 23], and also here interpolation is necessary. In Figure 5 the concentration dependence of the mobilit ies of the ion constituents K and Ag are plotted at 960 K. Beside the already discussed inversion point, it shows a pronounced concentra-tion dependence for wAg, bu t only a minor one for wK. The more or less concentration independent behaviour of K indicates a similar interaction be-tween K and K as between K and Ag. The inter-actions between Ag and Ag seems to di f fer clearly f rom the former. A similar tendency - but not so distinctive - was also found with the systems (K, Rb, C s ) N 0 3 + A g N 0 3 [2], In Fig. 6 the mobili ty ratios wa/wAg at 1075 K are plotted for the four considered systems.
Acknowledgements
The authors express their thanks to the Minister für Wissenschaft und Forschung des Landes Nordrhe in -Westfalen, Düsseldorf, for f inancial suppor t of this study.
[1] J. Richter and E. Amkreutz, Z. Naturforsch. 27 a, 280 (1972).
[2] J. Richter, U. Gasseling, and R. Conradt, Electrochim. Acta 23,1165 (1978).
[3] L. Popescu, Rev. Roum. Chim. 21 ,359 (1976). [4] N. K. Voskresenskaya, Handbook of Solid-Liquid
Equilibria in Systems of Anhydrous Inorganic Salts, Vol. 1, Israel Program for Scientific Translations, Jerusalem 1970.
[5] K. H. Stern, J. Phys. Chem. 60 ,679 (1956). [6] K. H. Stern, J. Phys. Chem. 62,385 (1958). [7] G. J. Janz, F. W. Dampier , G. R. Lakshminarayanan,
P. K. Lorenz, and R. P. T. Tomkins, Molten Salts:
Vol. 1, Nat. Stand. Ref. Data Sev. NBS (U.S.) 15, (Oct. 1968).
[8] R. Conradt, Thesis, Aachen 1981. [9] R. Haase, Electrochim. Acta 23,391 (1978).
[10] J. Richter, Ber. Bunsenges. Phys. Chem. 72, 681 (1968).
[11] J. Richter, R. Conradt, and R. Becker, Z. Naturforsch. 36 a, 1100 (1981)
[12] A. D. Pelton and S. N. Flengas, J. Electrochem. Soc. 117,1130(1970).
[13] J. Perie and M. Chemla, C. R. Acad. Sei. (France) 250, 3986(1960).
[14] F. R. Duke and B. Owens, J. Electrochem. Soc. 105, 476 (1958).
134 R. Conradt et al. • Fused Salt Concentration Cells with Transference 134
[15] I. Okada and K. Kawamura, Electrochim. Acta 19, 111 (1974).
[16] J. G. Murgulescu and L. Popescu, Rev. Roum. Chim. 18,737 (1973).
[17] O. P. Metho. F. Lantelme, and M. Chemla, Electro-chim. Acta 14,505 (1969).
[18] K. Kawamura, I. Okada, and O. Odawara. Z. Naturforsch. 30 a, 69 (1975).
[19] F. Lantelme and M. Chemla, Electrochim. Acta 10, 663 (1965).
[20] I. Okada, R. Takagi, and K Kawamura, Z. Natur-forsch. 34 a, 498 (1979).
[21] F. Lantelme and M. Chemla, Bull. Soc. Chim. France 1963,2200.
[22] C. Yang, R. Takagi, and I. Okada, Z. Naturforsch. 34 a, 1186 (1980).
[23] G. J. Janz. R. P. T. Tomkins, C. B. Allen, J. R. Downey Jr., G. L. Gardner , N. Krebs, and S. K. Singer, J. Phys. Chem. Ref. Data 4, 871 (1975).