investigation on harsh environmental e ects on polymer …elib.dlr.de/91126/2/92020i.pdf ·...
TRANSCRIPT
Investigation on harsh environmental effects on polymer fiberoptic link for aircraft systems
Sandy Cherian*1, Holger Spangenberg1, Reinhard Caspary2
1Institut für Flugsystemtechnik, Deutsches Zentrum für Luft- und Raumfahrt e.V. (DLR), Lilienthalplatz 7,38108 Braunschweig ;2Technische Universität Braunschweig, Institut für Hochfrequenztechnik, Schleinitzstr.22,38106 Braunschweig, Germany
ABSTRACT
To integrate polymer �ber based physical layer for avionic data network, it is necessary to understand theimpact and cause of harsh environments on polymer �ber optic components and harnesses. Since temperatureand vibration have a signi�cant in�uence, we investigate the variation in optical transmittance and monitor theendurance of di�erent types of connector and splices under extreme aircraft environments. Presently, there isno speci�c aerospace standard for the application of polymer �ber and components in the aircraft data network.Therefore, in the paper we examine and de�ne the thermal cycling and vibration measurement set up and methodsto evaluate the performance capability of the physical layer of the data network. Some of the interesting resultsobserved during the measurements are also presented.
Keywords: Polymer optical �ber, thermal cycling, vibration measurements
1. INTRODUCTION
Fly-by-light systems in aircraft gained immense interest during the last few years as the �ber optic based datatransmission in telecommunication and automotive industry matured. A variety of applications in the aerospaceindustry bene�ted from the high data transmission capacity together with improved security, immunity to elec-tromagnetic interferences, higher reliability of �ber optic media. However, a stringent requirement of aircraftsystem data network does not allow the direct mapping of the �ber optic technology from telecommunicationand automotive industry. Furthermore, fewer nodes, shorter link lengths and extended performance under harshenvironment questions the necessary requirements of optical media for aircraft applications. In order to exploitthe full advantage of optical media, we initiated a research on the prospects of integrating polymer optical �ber(POF) instead of silica �ber on aircraft data network. POF with its large core diameter and numerical aperturehas acceptable �exibility, relaxed connector tolerance, easy and e�cient coupling to high numerical aperturelight sources, as well as quick and easy termination procedures.
In order to design a reliable system for avionics data communication it is necessary to understand the impactsof harsh environments on the polymer optic �ber link. We conducted a detailed study on the requirements as aresult of the stringent requirements of aircraft systems. The general harsh environmental requirements mainlyinclude the temperature requirements and mechanical requirements. The speci�c requirements are according tothe components used in the data link, path or position of the components, data rate of the link.
The �rst part of section 2 gives a brief overview of the major deviations to be considered for the design ofPOF physical layer in comparison to silica �ber based on a baseline study on di�erent military standards[1,2, 4].The section 2.1 and 2.2 examine the detailed harsh environmental requirements and measurement methods onthe �ber optic link and its components. The results and discussion part describes the in�uence of temperatureand vibration on �ber optic components and harness.
Photonics Applications for Aviation, Aerospace, Commercial, and Harsh Environments V,edited by Alex A. Kazemi, et. al., Proc. of SPIE Vol. 9202, 92020I · © 2014 SPIE
CCC code: 0277-786X/14/$18 · doi: 10.1117/12.2061767
Proc. of SPIE Vol. 9202 92020I-1
Downloaded From: http://proceedings.spiedigitallibrary.org/ on 10/01/2014 Terms of Use: http://spiedl.org/terms
2. ENVIRONMENTAL REQUIREMENTS
The requirements for the aircraft systems are di�erent from the telecom/automotive industry. This is mainlydue to the di�erence in the methods to measure, monitor and detect faults and deterioration of performance ofthe data network. For the aircraft data networks, the link length is in meters rather than in kilometers. Besides,the number of nodes in the aircraft data networks are fewer in comparison to millions of nodes present in telecomnetworks. Furthermore, aircraft systems are required to operate under extreme operating environments. Forexample an aircraft system can experience a temperature variation of -45 °C to +85 °C depending on the area ofapplication. Therefore, integration of polymer optical �ber based physical layer requires a detailed identi�cationof performance and operating requirements and also stable and reliable measurement methods for the acceptanceand validation of components and devices.
Initially, we conducted a baseline study on the existing standards and requirements of silica �ber fromtelecom, automotive and aircraft industry. However, the di�erences in the material properties and performancecharacteristics of silica and polymer �ber did not allow the direct adaptation of the requirements. Importantparameters to ensure the networks capability to operate according to a design speci�cation are physical propertiesand optical properties. Physical properties are �ber geometry and material characteristic; optical properties aremainly attenuation, optical cross talk, return loss, numerical aperture, bandwidth, refractive index pro�le of the�ber. Hence in this section we brie�y explain the major performance deviations taken into account for polymeroptical �ber in comparison with silica �ber for aircraft applications.
Polymer optical �ber is a step-index multimode �ber which has a core diameter of 980 μm and numericalaperture of 0.50, while silica �ber has a core diameter of 9 μm (single mode) and 62.5 μm (multimode). Inaddition, for airborne application the recommended transmission windows of silica �ber are 850 nm, 1300 nm,and 1550 nm. These transmission windows are preferred because silica �ber experiences lower attenuation of0.2 dB/km at these wavelengths[3]. However, these recommended transmission windows are not applicable forPOF since they have higher attenuation at these wavelengths. POF maintain lower attenuation at 450 nm,530 nm and 650 nm. Accordingly, we derived stable attenuation measurement for POF based on MIL-STD-1678and Telecom standards and conducted the measurements on 6 �ber samples[1,3]. By virtue of these resultswe agreed to have 650 nm transmission window for POF applications, which permits the lower attenuation of0.2 dB/m and also the ready availability of matured transmitter technologies. As attenuation of POF signi�cantlyvaries with regard to the length, the preferred �ber length for data communication is constrained approximatelyto 100m. Silica �bers in contrast can operate for 100 km with lower attenuation. However, for aircraft applicationshort lengths of 50m are preferred between the nodes. Furthermore, this large core multimode �ber experiences aconsiderable variation in power distribution through the modes due to the external disturbances as temperature,vibration, shock etc.
The �ber optic link under consideration for avionic application consists of polymer optical �ber (POF) withhigh temperature, �ber optic connectors with special terminus for POF, special POF mechanical splices, LEDbased transmitter with a wavelength of 650 nm, and PIN photo diode as receiver. The deterioration in theperformance of other components in the link (such as connectors, splices) are necessary to be analyzed for thecalculation of accurate power budget and design of transmission paths with an acceptable loss. Consideringthe fact that there is no standardized POF connector terminus or mechanical splices, we derived and de�nedthe performance requirements and measurement methods such as attenuation, insertion loss, optical return loss,optical cross talk etc. based on the military standards. 6 samples of each SMA, ST, SC and MIL D38999connectors, �ber and splices underwent for the measurement of optical characteristion of the components. Wefollowed the general measurement methods as stated in MIL-STD- 1678 with modi�cation according to theproperties of each POF component. By considering the numerical aperture, core diameter and number of modesof the �ber the insertion loss of the connector and splices can be in the range of 0.5 - 1.5 dB which matches themanufacturer values as well. As stated in the above paragaraph �ber shows an attenuation of 0.2 dB/m. A cutback method with di�erent launching conditions was used. In order to get a stable measurement meathod weobtained di�erent over�lled launching conditions by lense setup, microscopic setup and setup with mode mixer.The data analysis from each measurement shows for the performance characterisation of �ber it is necessary toinclude a mode mixer for stable and reliable results. Detailed explanation on the performance requirements andmeasurement methods of �ber components is not given here as it is out of the scope of this paper.
Proc. of SPIE Vol. 9202 92020I-2
Downloaded From: http://proceedings.spiedigitallibrary.org/ on 10/01/2014 Terms of Use: http://spiedl.org/terms
The performance and reliable operation of these �ber optic components is certainly in�uenced by the stringentenvironmental requirement in aircraft. In this paper, we examined the harsh environmental requirements andmeasurement methods by considering the performance requirements as a metric for evaluating the endurance ofthe components at extended operating conditions. These measurement methods are de�ned by taking accountof the special properties of POF, such as the glass transition temperature Tg of PMMA, large core diameter andthe constraints of existing military standards MIL-STD-1687, MIL-STD-1540. Additionally,we investigated theendurance of di�erent connectors such as SMA, SC, ST, MIL D38999 under extended operating conditions since�ber optic connectors and splices have extensive impact on the link loss. In this paper we limit the discussion ofharsh environmental measurements to high temperature and vibration measurement de�nition and methods.
2.1 High temperature measurements
This section describes the derivation of thermal cycling measurement method for polymer �ber optic harness byconsidering its component properties and existing aircraft standards such as MIL-STD-1678[1]. The measurementsetup consisted of a light source(650 nm), photo detector, reference �ber, di�erent types of connectors (SMA,SC, ST and MIL D38999), splices, and temperature chamber. An integrating sphere silicon photo diode witha power meter is used for monitoring the deterioration of optical performance of the components and harnessunder extreme use conditions. We speci�cally used this type of detector to get an accurate monitoring regardlessof beam shape, angle of incidence and polarization. The photo detector has a wavelength range of 350-1100 nmand a power range of 1µW - 500mW. The temperature chamber with a range of -70 °C to +200 °C is used for thethermal cycling. As we discussed in the earlier section, the length of the �ber was restricted due to attenuatione�ects. Therefore we modi�ed the standard length of the reference �ber to 13m which allowed 3 times cut backmethod for attenuation measurement.
We realized and maintained a set of initial test conditions throughout the measurements to obtain a stableand reproducible set of measurement results. Firstly, standard ambient conditions of 23 ± 5 °C/ 73 ± 9 °F and20 to 70% RH were realized. Secondly, we carefully avoided all sharp bends, twist and maintained a minimumbend diameter greater than or equal to the minimum long term bend diameter (20 x cable diameter). Thirdly,we obtained an over�lled launch condition at the source - �ber interface. Finally, we carefully polished andprepared the end face of the �ber.
Prior to thermal cycling, the device under tests (DUT) were tested for attenuation, optical transmittanceand insertion loss. By taking account of these optical performance characteristics, the �ber material propertiesand the aircraft environmental requirements, we modi�ed the span of the temperature pro�le to -45 °C to +85 °Cfor polymer �ber harness[1,3, 4]. Thermal cycling was started by placing the prepared DUT in the chamber andmaintaining an ambient condition and monitoring the optical transmittance for a duration of 4 hours. This timeduration allowed the sample and other measurement devices to achieve a stable condition. In the �rst step, weramped down the temperature to a minimum of -45 °C and maintained this low temperature for 15 minutes.In the second step, the temperature was ramped up to +85 °C and maintained for 15 minutes. Eventually, thetemperature pro�le of the sample was brought back to the standard initial condition. This cycle was repeated9 times more for each sample. Each sample endured a thermal cycling of approximately 30 hours. Initially,a reference �ber was subjected to the thermal cycling, followed by other DUTs (connectors and splices). Thisreference �ber serves as the monitor �ber for the insertion loss of other passive components in the link.Theconnector samples used for measurements were MIL D38999, SMA, ST and SC type. The splices that underwentmeasurements were splices with and without index matching gel.
2.2 Vibration measurement setup
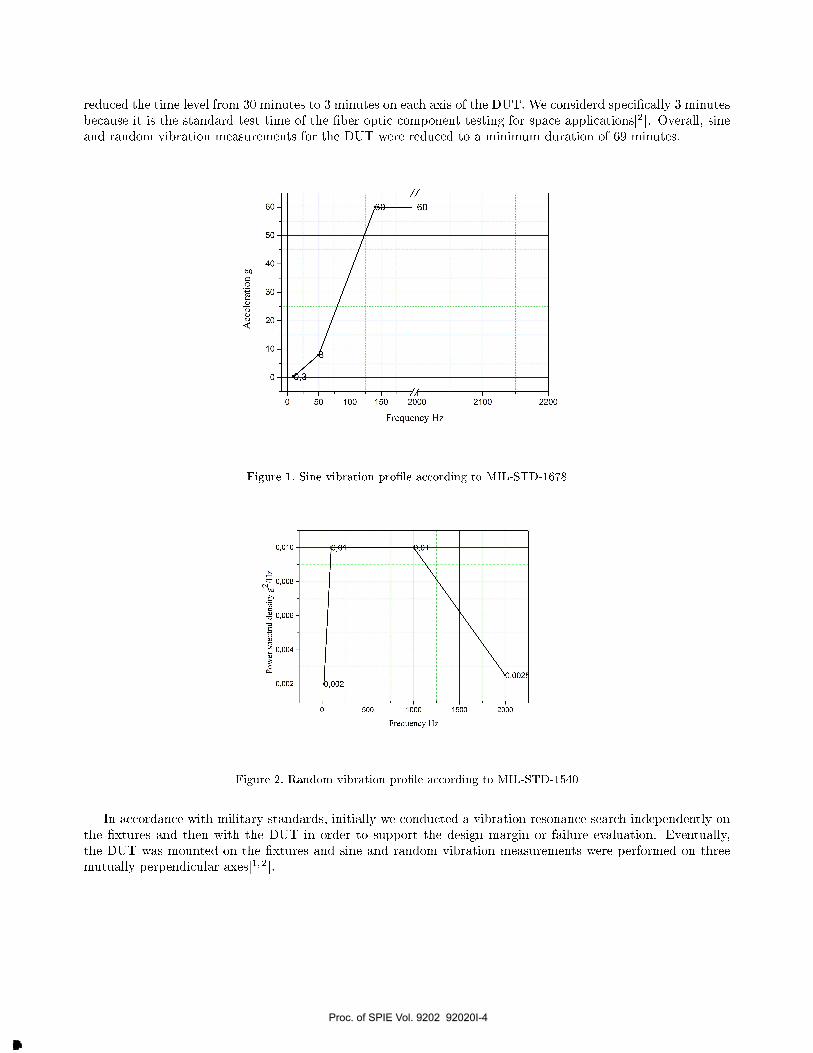
This section explains vibration measurements performed on polymer �ber optic link to demonstrate its opera-tional capability under extended environment. As a baseline pro�le, we adopted the sine and random vibrationinput level from MIL-STD-1678 and MIL-STD-1540 shown in Figure 1 and 2[1,2]. The DUTs used were �ber,4 samples of MIL D38999 (with 5 inserts) and mechanical splice. We planned to perform 23 measurements,each with a duration of 30 minutes to evaluate the performance degradation and monitor the endurance ofcomponents. A measurement was performed on the �rst sample for 30 minutes. Since there was no considerabledeviation on the power transmission or any signal discontinuity and the limit of the shaker was exceeded, we
Proc. of SPIE Vol. 9202 92020I-3
Downloaded From: http://proceedings.spiedigitallibrary.org/ on 10/01/2014 Terms of Use: http://spiedl.org/terms
60
50
40
30
20
10
50 100 150 2000
Frequency Hz
2100 2200
0,010
b 0,006
. 0,0043oPr
0,002
,01
b,002.
0 500 1000 1500
Frequency Hz
,002E
2000
reduced the time level from 30 minutes to 3 minutes on each axis of the DUT. We considerd speci�cally 3 minutesbecause it is the standard test time of the �ber optic component testing for space applications[2]. Overall, sineand random vibration measurements for the DUT were reduced to a minimum duration of 69 minutes.
Figure 1. Sine vibration pro�le according to MIL-STD-1678
Figure 2. Random vibration pro�le according to MIL-STD-1540
In accordance with military standards, initially we conducted a vibration resonance search independently onthe �xtures and then with the DUT in order to support the design margin or failure evaluation. Eventually,the DUT was mounted on the �xtures and sine and random vibration measurements were performed on threemutually perpendicular axes[1,2].
Proc. of SPIE Vol. 9202 92020I-4
Downloaded From: http://proceedings.spiedigitallibrary.org/ on 10/01/2014 Terms of Use: http://spiedl.org/terms
,
4
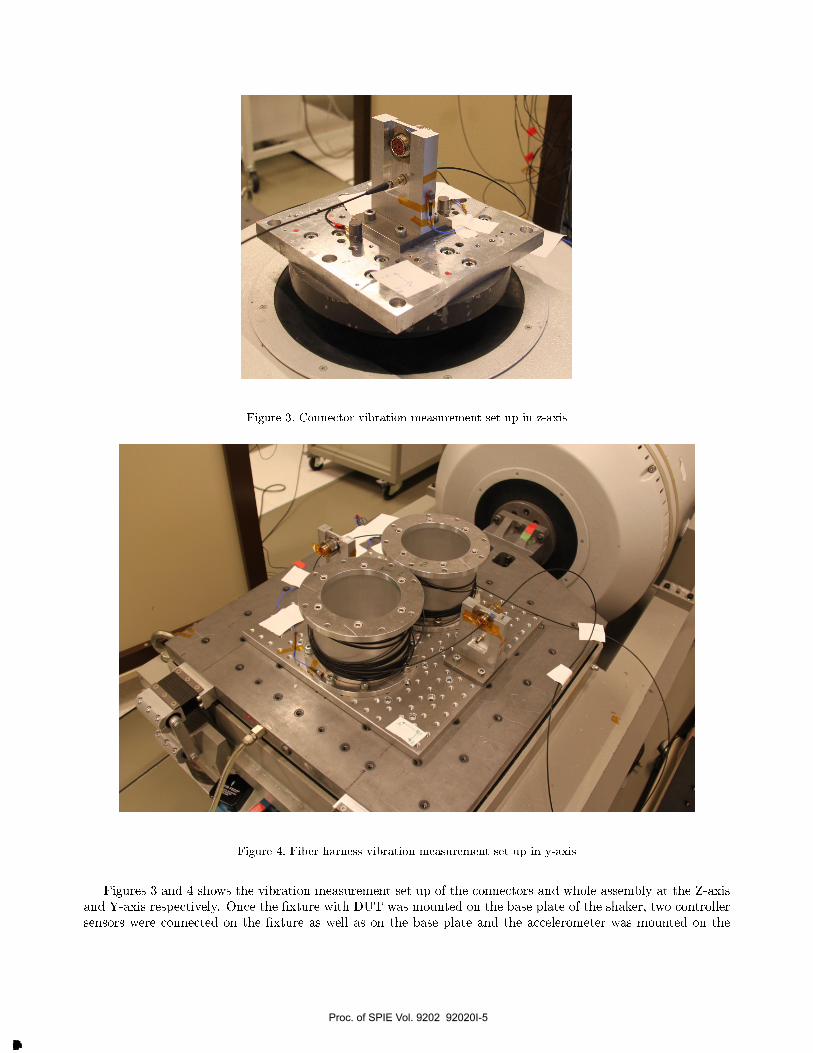
Figure 3. Connector vibration measurement set up in z-axis
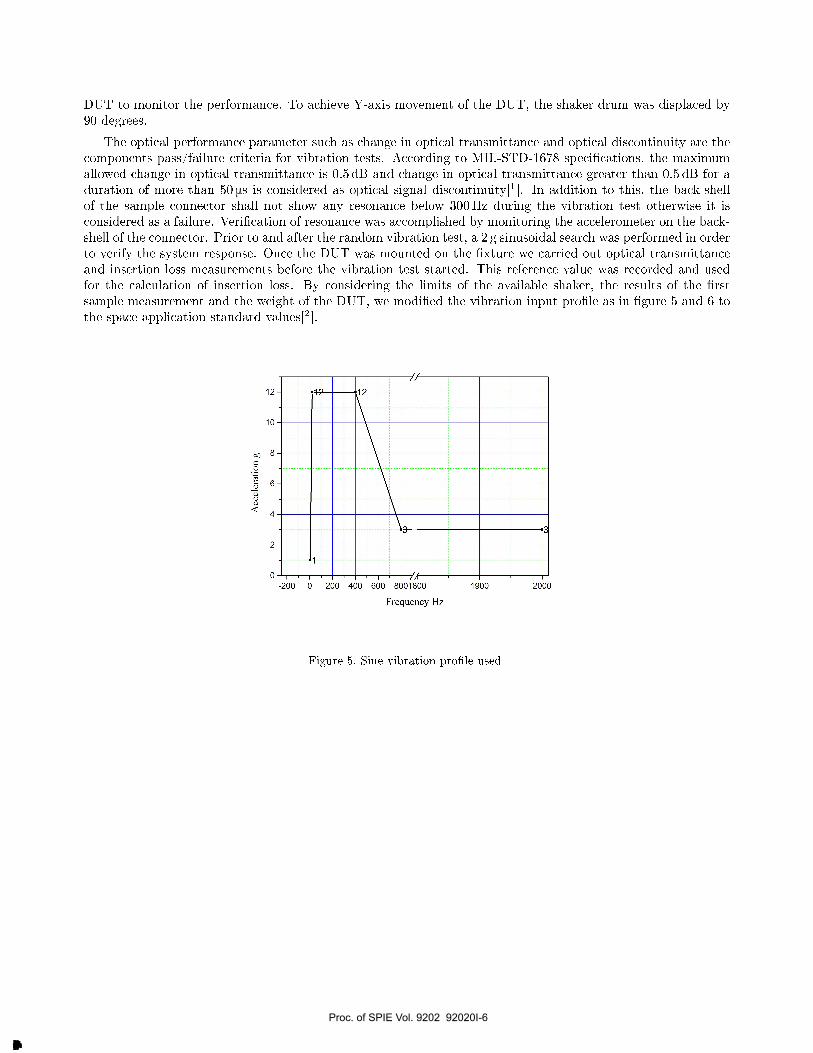
Figure 4. Fiber harness vibration measurement set up in y-axis
Figures 3 and 4 shows the vibration measurement set up of the connectors and whole assembly at the Z-axisand Y-axis respectively. Once the �xture with DUT was mounted on the base plate of the shaker, two controllersensors were connected on the �xture as well as on the base plate and the accelerometer was mounted on the
Proc. of SPIE Vol. 9202 92020I-5
Downloaded From: http://proceedings.spiedigitallibrary.org/ on 10/01/2014 Terms of Use: http://spiedl.org/terms
12-
10
6,U
4
2
13
o r=1
-200 0 200 400 600 8001800 1900 2000
Frequency Hz
DUT to monitor the performance. To achieve Y-axis movement of the DUT, the shaker drum was displaced by90 degrees.
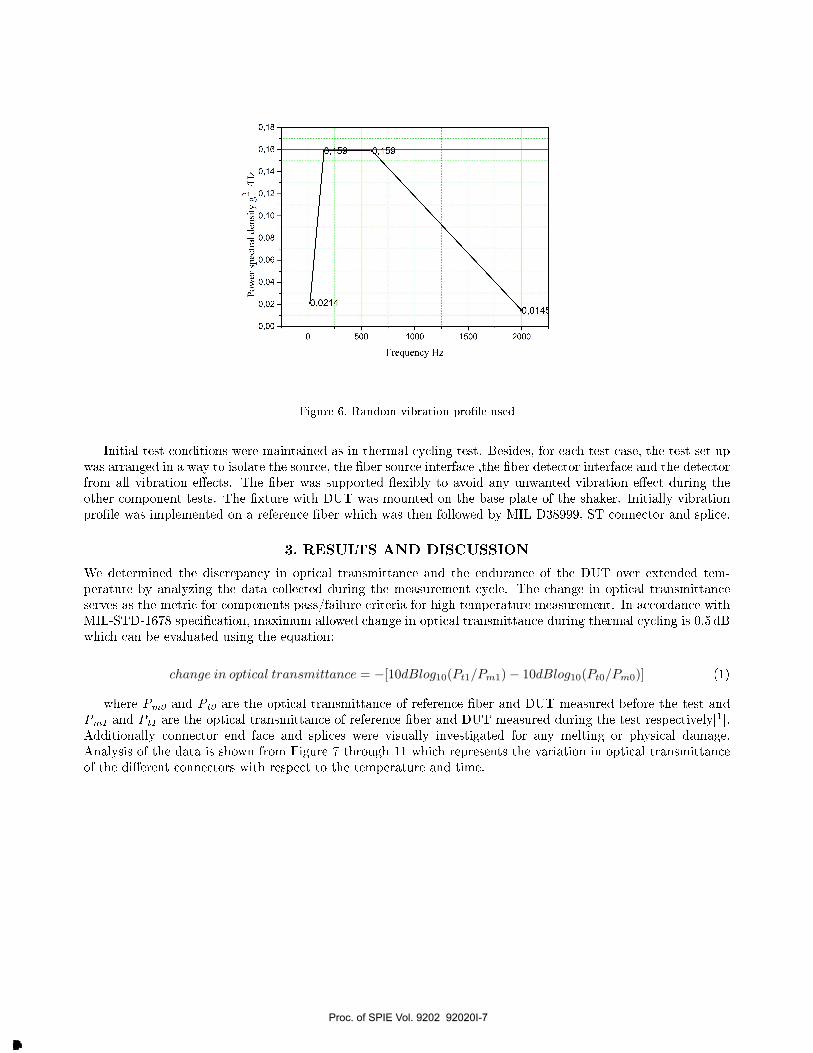
The optical performance parameter such as change in optical transmittance and optical discontinuity are thecomponents pass/failure criteria for vibration tests. According to MIL-STD-1678 speci�cations, the maximumallowed change in optical transmittance is 0.5 dB and change in optical transmittance greater than 0.5 dB for aduration of more than 50 μs is considered as optical signal discontinuity[1]. In addition to this, the back-shellof the sample connector shall not show any resonance below 300Hz during the vibration test otherwise it isconsidered as a failure. Veri�cation of resonance was accomplished by monitoring the accelerometer on the back-shell of the connector. Prior to and after the random vibration test, a 2 g sinusoidal search was performed in orderto verify the system response. Once the DUT was mounted on the �xture we carried out optical transmittanceand insertion loss measurements before the vibration test started. This reference value was recorded and usedfor the calculation of insertion loss. By considering the limits of the available shaker, the results of the �rstsample measurement and the weight of the DUT, we modi�ed the vibration input pro�le as in �gure 5 and 6 tothe space application standard values[2].
Figure 5. Sine vibration pro�le used
Proc. of SPIE Vol. 9202 92020I-6
Downloaded From: http://proceedings.spiedigitallibrary.org/ on 10/01/2014 Terms of Use: http://spiedl.org/terms
0,18
0,16
0,14
c-A 0,12
0,10
0,08
Q, 0,06
0,04
á0,02
0,00
11,021'4
500 1000
Frequency Hz
1500
,014E
2000
Figure 6. Random vibration pro�le used
Initial test conditions were maintained as in thermal cycling test. Besides, for each test case, the test set upwas arranged in a way to isolate the source, the �ber source interface ,the �ber detector interface and the detectorfrom all vibration e�ects. The �ber was supported �exibly to avoid any unwanted vibration e�ect during theother component tests. The �xture with DUT was mounted on the base plate of the shaker. Initially vibrationpro�le was implemented on a reference �ber which was then followed by MIL D38999, ST connector and splice.
3. RESULTS AND DISCUSSION
We determined the discrepancy in optical transmittance and the endurance of the DUT over extended tem-perature by analyzing the data collected during the measurement cycle. The change in optical transmittanceserves as the metric for components pass/failure criteria for high temperature measurement. In accordance withMIL-STD-1678 speci�cation, maximum allowed change in optical transmittance during thermal cycling is 0.5 dBwhich can be evaluated using the equation:
change in optical transmittance = −[10dBlog10(Pt1/Pm1)− 10dBlog10(Pt0/Pm0)] (1)
where Pm0 and Pt0 are the optical transmittance of reference �ber and DUT measured before the test andPm1 and Pt1 are the optical transmittance of reference �ber and DUT measured during the test respectively[1].Additionally connector end face and splices were visually investigated for any melting or physical damage.Analysis of the data is shown from Figure 7 through 11 which represents the variation in optical transmittanceof the di�erent connectors with respect to the temperature and time.
Proc. of SPIE Vol. 9202 92020I-7
Downloaded From: http://proceedings.spiedigitallibrary.org/ on 10/01/2014 Terms of Use: http://spiedl.org/terms
0,12
0,08
0,04
W 0,00-c,
°,J -0,04
0,08
-0,12
-60 -40 -20 0 20 40
Temperature °C
60 80 100
0,12
0,08 -
0,04
0,00
-0,04
0,08
-0,12 -
11-
0 20000 40000 60000 80000 100000 120000
Time in second
0,4
0,2
0,0
-0,2
0,4
0,6
0,8
1,0
1,2-60 -40 -20 0 20 40
Temperature °C
60 80 100
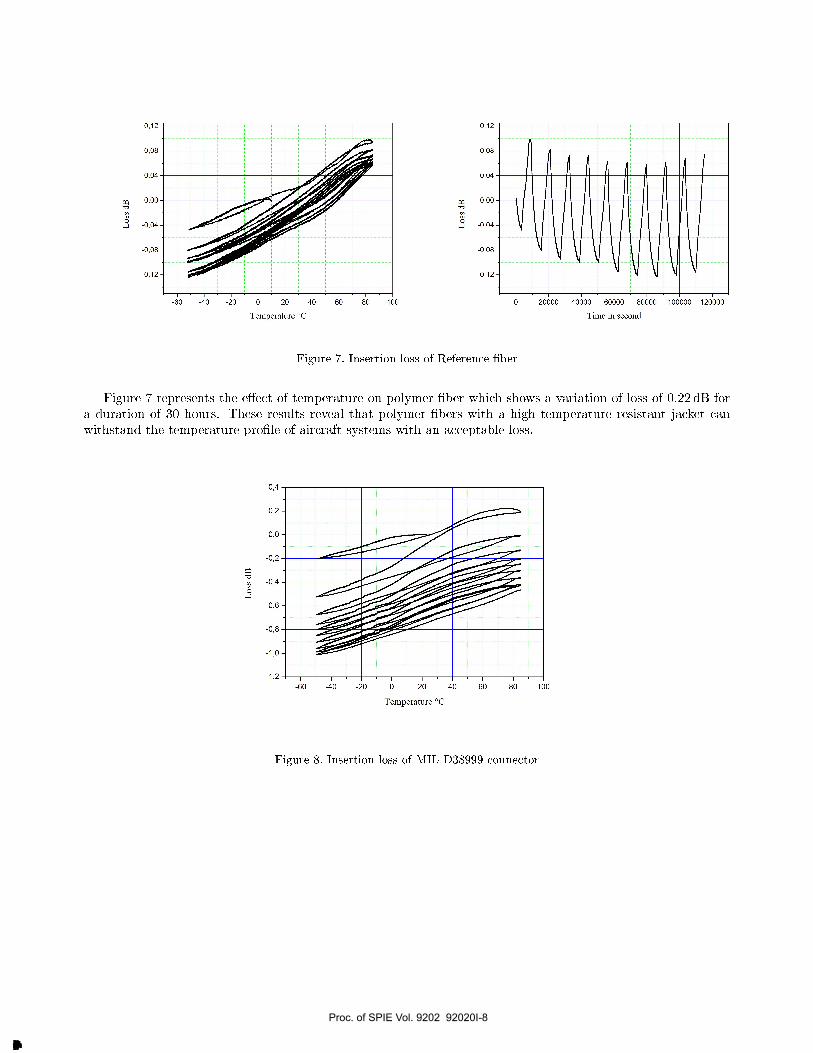
Figure 7. Insertion loss of Reference �ber
Figure 7 represents the e�ect of temperature on polymer �ber which shows a variation of loss of 0.22 dB fora duration of 30 hours. These results reveal that polymer �bers with a high temperature resistant jacket canwithstand the temperature pro�le of aircraft systems with an acceptable loss.
Figure 8. Insertion loss of MIL D38999 connector
Proc. of SPIE Vol. 9202 92020I-8
Downloaded From: http://proceedings.spiedigitallibrary.org/ on 10/01/2014 Terms of Use: http://spiedl.org/terms
0,2
0,4
0,6
0,8
1,0
1,2
1,4
1,6
-60 -40 -20 0 20 40
Temperature °C
60 80 100
0,6
0,4
0,2
0,0
0,2
0,4
0,6
-60 -40 -20 0 20 40
Temperature °C
60 80 100
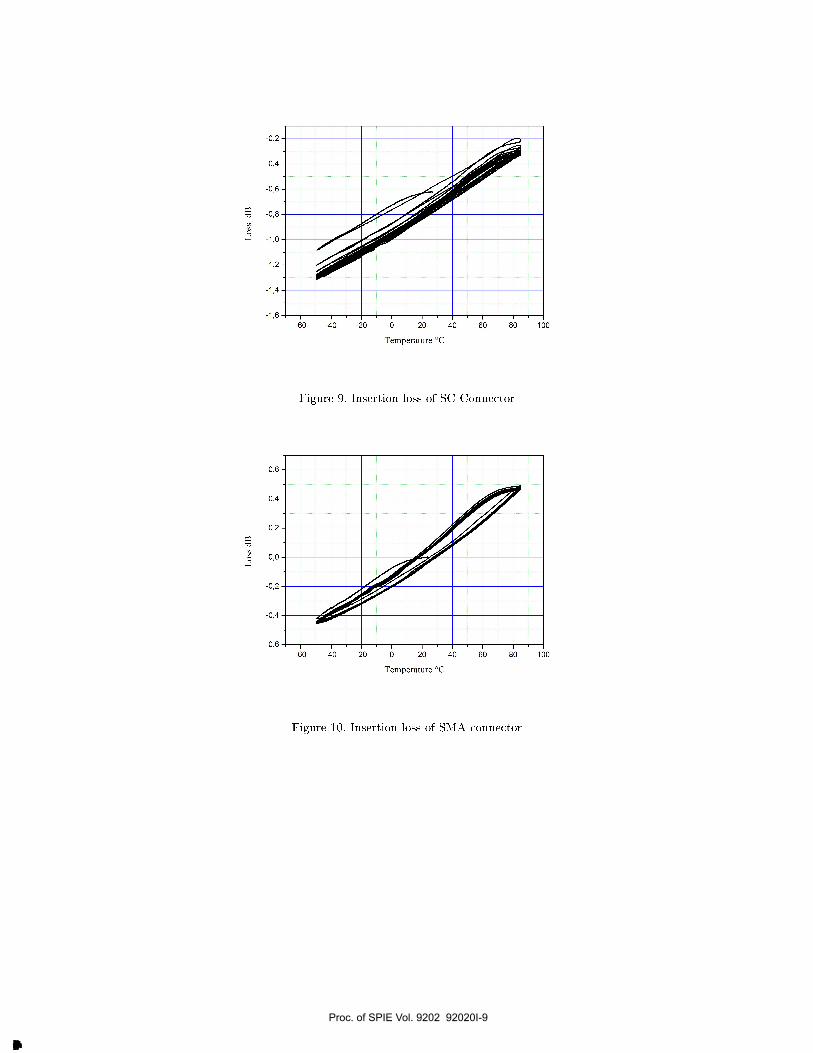
Figure 9. Insertion loss of SC Connector
Figure 10. Insertion loss of SMA connector
Proc. of SPIE Vol. 9202 92020I-9
Downloaded From: http://proceedings.spiedigitallibrary.org/ on 10/01/2014 Terms of Use: http://spiedl.org/terms
0,3
0,2
0,1
0,0
0,1
0,2
0,3
-60 -40 -20 0 20 40
Temperature °C
60 80 100
0,2
0,0
0,2
0,4
b 0,6
-60 -40 -20 0 20 40
Temperature °C
60 80 100
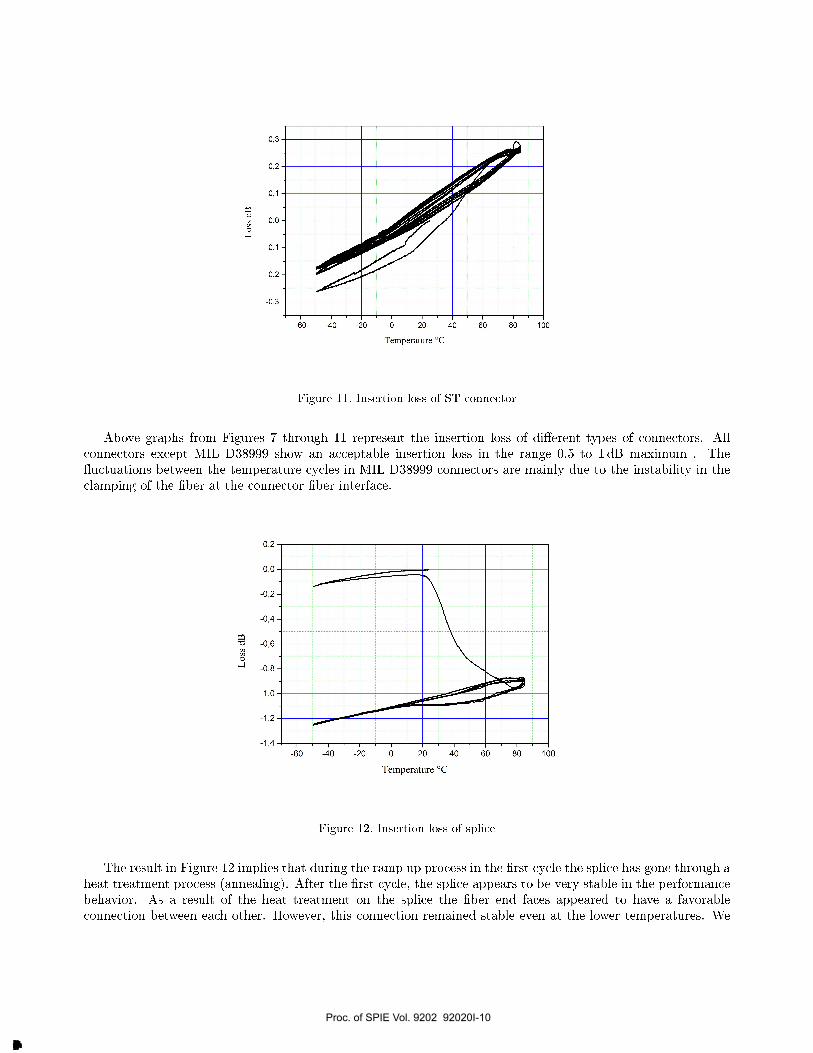
Figure 11. Insertion loss of ST connector
Above graphs from Figures 7 through 11 represent the insertion loss of di�erent types of connectors. Allconnectors except MIL D38999 show an acceptable insertion loss in the range 0.5 to 1 dB maximum . The�uctuations between the temperature cycles in MIL D38999 connectors are mainly due to the instability in theclamping of the �ber at the connector �ber interface.
Figure 12. Insertion loss of splice
The result in Figure 12 implies that during the ramp up process in the �rst cycle the splice has gone through aheat treatment process (annealing). After the �rst cycle, the splice appears to be very stable in the performancebehavior. As a result of the heat treatment on the splice the �ber end faces appeared to have a favorableconnection between each other. However, this connection remained stable even at the lower temperatures. We
Proc. of SPIE Vol. 9202 92020I-10
Downloaded From: http://proceedings.spiedigitallibrary.org/ on 10/01/2014 Terms of Use: http://spiedl.org/terms
used 4 samples to verify the behavior in which all of them showed a similar loss pattern under thermal cycles.Therefore it is advised to use mechanical splices after the annealing process.
We also determined the impact of vibration on the optical transmittance of the �ber optic componentsand harness. The variation in optical transmittance is calculated by using Eq (1) and optical discontinuity iscalculated after each event by
(ΔD) = 10dBlog10(Pt1/Pt0) (2)
where Pt0 is the optical transmittance of DUT measured before the test and Pt1 is the optical transmittanceof DUT measured during the test [1,2].
The analyzed data reveals that the vibration a�ected the insertion loss of the components by 0.02 dB which isextremely less than the allowed maximum value. The graphs are not shown here since there were no interestingobservations made with respect to the insertion loss. Besides, during the test we did not experience any opticalsignal discontinuity. After the test we examined the �ber,connectors and splice for any physical damage. However,there were no signi�cant visible physical distortion, breakage or displacement on the �ber/connectors/splices orat the �ber connector interface which can induce a signal discontinuity.
4. CONCLUSION
High temperature measurement data presented here explain that one can expect an optical performance variationof 0.5 to 2 dB loss for connectors and splices. However, these values are in the range of manufacturer typicalinsertion loss values. The connectors showed a stable behavior over the duration of 30 hours of temperaturemeasurements without damaging the �ber. Military connectors experienced slightly higher �uctuations betweeneach temperature cycles than expected manufacturer values. Additionally, vibration measurements did not showany considerable variation in the performance or any signal discontinuity of connectors and splice.
In conclusion, we proposed a stable and reliable test setup and methods for POF, large core �ber connectorsand splices. We demonstrated the necessity of modifying the standard requirement value for large core polymer�ber and its link components. In general this work introduces the �rst step towards the development of standardsthat enable polymer �ber data networks for aircraft applications.
ACKNOWLEDGMENTS
We would like to thank the department of Flugversuchstechnik und IT, FT, DLR Braunschweig and Institut fürRaumfahrtsysteme, DLR Bremen for helping us in the measurements.
REFERENCES
1. MIL-STD- 1678, Fiber Optic Cabling System Requirements and Measurements, Department of DefenseStandard Practice, 23 July 2009
2. MIL-STD-1540, Test Requirements for Launch Upper Stage and Space Vehicle, Department of Defense Stan-dard Practice, 15 September 1994
3. Peter E Zamzow, Olaf Ziemann,Werner Daum,and Jurgen Krauser, Polymer Optical Fiber for Data Com-munication, Springer, Berlin, 2002
4. RTCA/DO 160E, Environmental Conditions and Test Procedure for Airborne Equipments, Radio TechnicalCommission for Aeronautics, 12 September 2004
Proc. of SPIE Vol. 9202 92020I-11
Downloaded From: http://proceedings.spiedigitallibrary.org/ on 10/01/2014 Terms of Use: http://spiedl.org/terms