jamesburg public schools
TRANSCRIPT
Jamesburg Public Schools Algebra Curriculum Map
JAMESBURG PUBLIC SCHOOLS
ALGEBRA CURRICULUM FRAMEWORK
ALGEBRA
Jamesburg Public Schools Algebra Curriculum Map
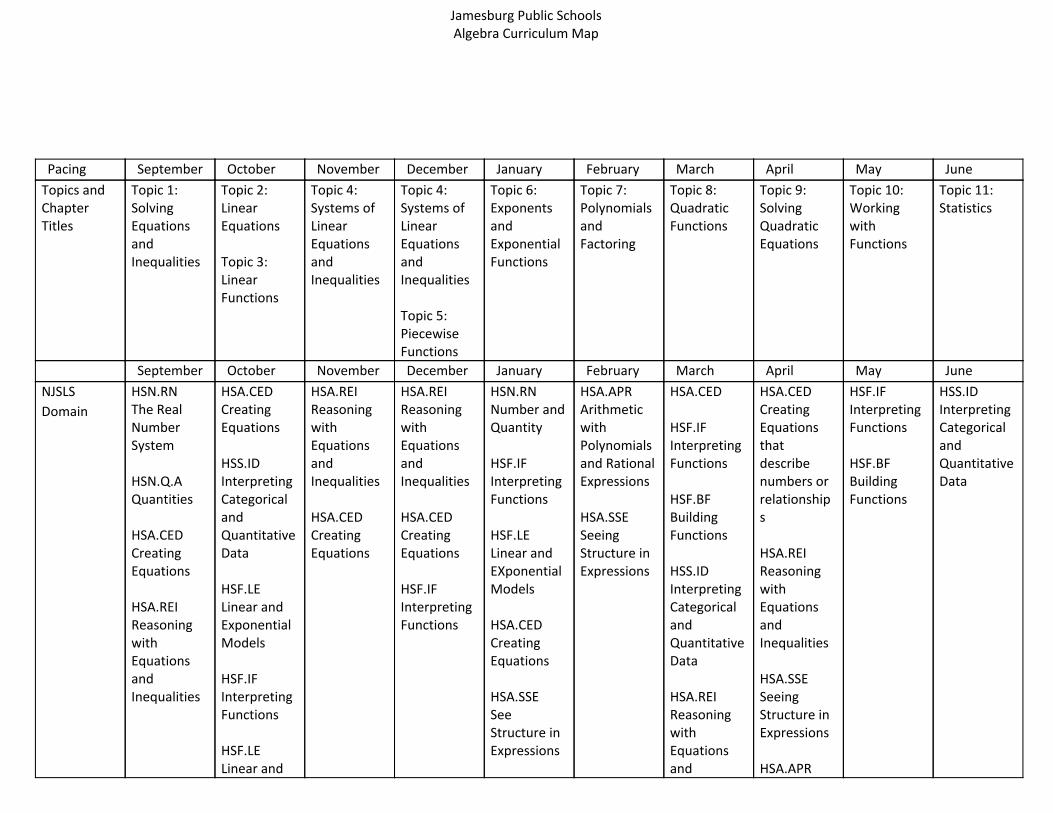
Pacing September October November December January February March April May June
Topics and Chapter Titles
Topic 1: Solving Equations and Inequalities
Topic 2: Linear Equations Topic 3: Linear Functions
Topic 4: Systems of Linear Equations and Inequalities
Topic 4: Systems of Linear Equations and Inequalities Topic 5: Piecewise Functions
Topic 6: Exponents and Exponential Functions
Topic 7: Polynomials and Factoring
Topic 8: Quadratic Functions
Topic 9: Solving Quadratic Equations
Topic 10: Working with Functions
Topic 11: Statistics
September October November December January February March April May June
NJSLS
Domain
HSN.RN The Real Number System HSN.Q.A Quantities HSA.CED Creating Equations HSA.REI Reasoning with Equations and Inequalities
HSA.CED Creating Equations HSS.ID Interpreting Categorical and Quantitative Data HSF.LE Linear and Exponential Models HSF.IF InterpretingFunctions HSF.LE Linear and
HSA.REI Reasoning with Equations and Inequalities HSA.CED Creating Equations
HSA.REI Reasoning with Equations and Inequalities HSA.CED Creating Equations HSF.IF Interpreting Functions
HSN.RN Number and Quantity HSF.IF Interpreting Functions HSF.LE Linear and EXponential Models HSA.CED Creating Equations HSA.SSE See Structure in Expressions
HSA.APR Arithmetic with Polynomials and Rational Expressions HSA.SSE Seeing Structure in Expressions
HSA.CED HSF.IF Interpreting Functions HSF.BF Building Functions HSS.ID Interpreting Categorical and Quantitative Data HSA.REI Reasoning with Equations and
HSA.CED Creating Equations that describe numbers or relationships HSA.REI Reasoning with Equations and Inequalities HSA.SSE Seeing Structure in Expressions HSA.APR
HSF.IF InterpretingFunctions HSF.BF Building Functions
HSS.ID Interpreting Categorical and Quantitative Data
Jamesburg Public Schools Algebra Curriculum Map
Exponential Models HSF.BF Building Functions HSS.ID Interpreting Categorical and Quantitative Data
HSF.BF Building Functions
Inequalities HSF.F.IF Interpreting Functions HSF.LE Linear and Exponential Models
Arithmetic with Polynomials and Rational Expressions HSF.IF InterpretingFunctions HSN.RN The Real Number System
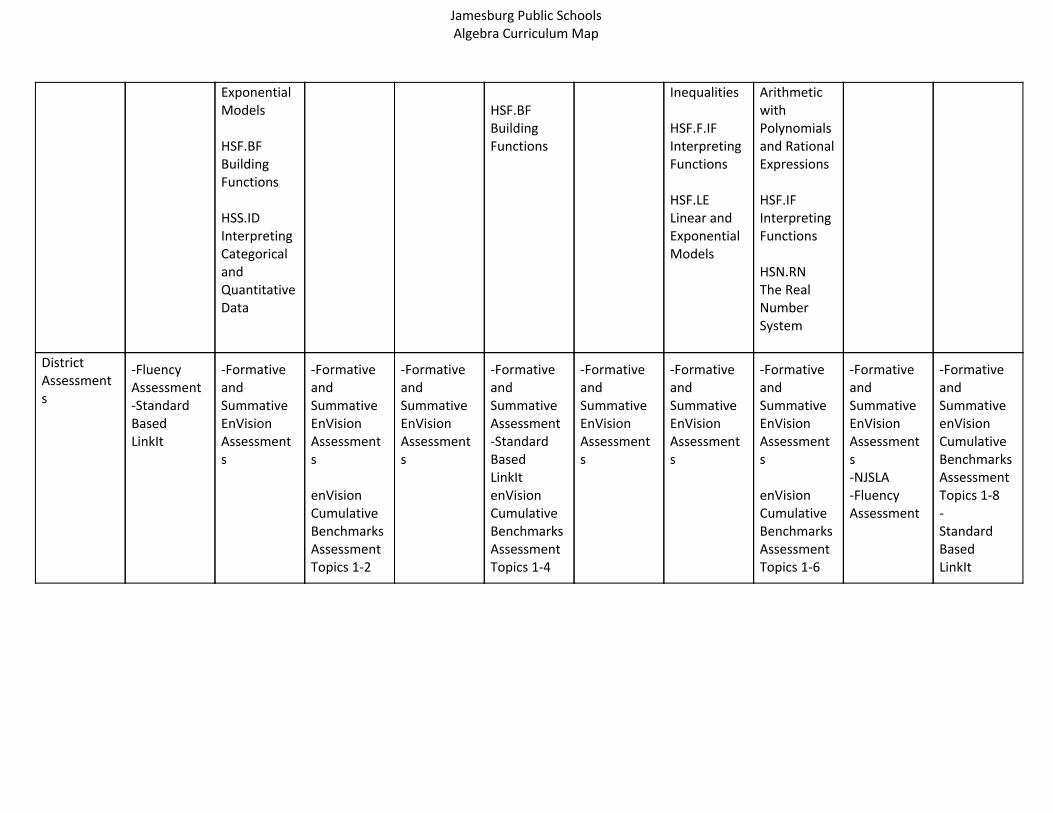
District Assessments
-Fluency Assessment -Standard Based LinkIt
-Formative and Summative EnVision Assessments
-Formative and Summative EnVision Assessments enVision Cumulative Benchmarks Assessment Topics 1-2
-Formative and Summative EnVision Assessments
-Formative and Summative Assessment -Standard Based LinkIt enVision Cumulative Benchmarks Assessment Topics 1-4
-Formative and Summative EnVision Assessments
-Formative and Summative EnVision Assessments
-Formative and Summative EnVision Assessments enVision Cumulative Benchmarks Assessment Topics 1-6
-Formative and Summative EnVision Assessments -NJSLA -Fluency Assessment
-Formative and Summative enVision Cumulative Benchmarks Assessment Topics 1-8 - Standard Based LinkIt
Jamesburg Public Schools Algebra Curriculum Map
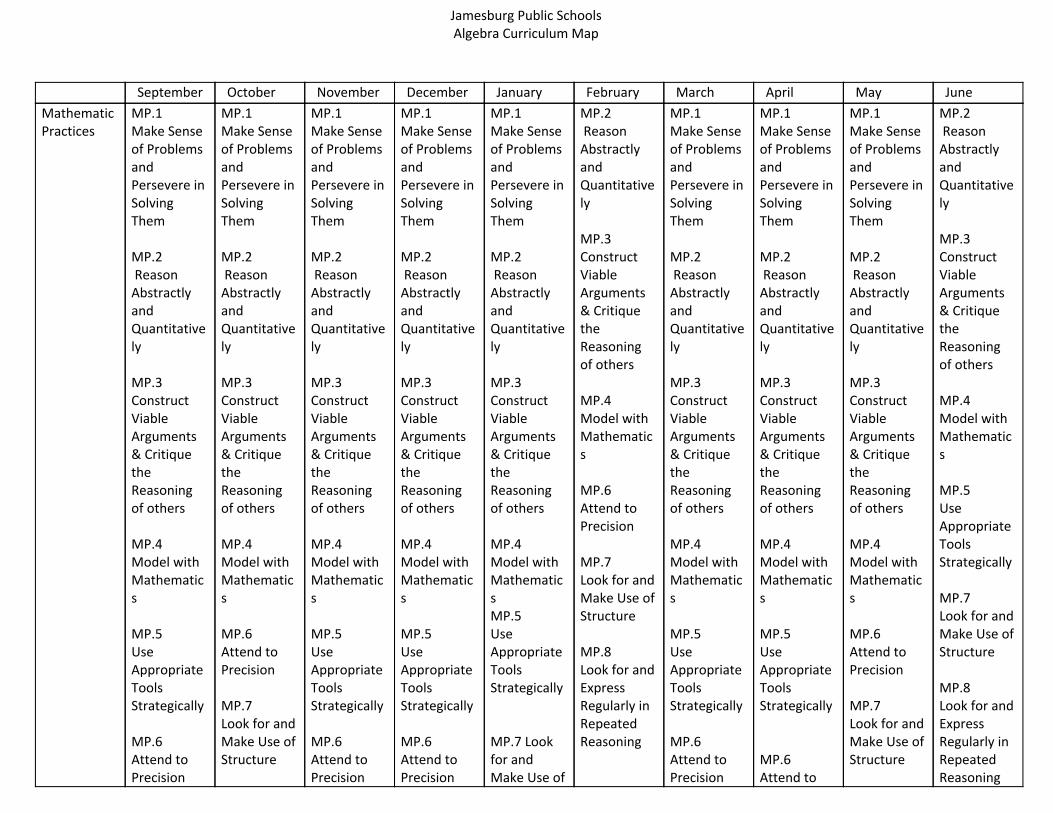
September October November December January February March April May June
Mathematic Practices
MP.1 Make Sense of Problems and Persevere in Solving Them MP.2 Reason Abstractly and Quantitatively MP.3 Construct Viable Arguments & Critique the Reasoning of others MP.4 Model with Mathematics MP.5 Use Appropriate Tools Strategically MP.6 Attend to Precision
MP.1 Make Sense of Problems and Persevere in Solving Them MP.2 Reason Abstractly and Quantitatively MP.3 Construct Viable Arguments & Critique the Reasoning of others MP.4 Model with Mathematics MP.6 Attend to Precision MP.7 Look for and Make Use of Structure
MP.1 Make Sense of Problems and Persevere in Solving Them MP.2 Reason Abstractly and Quantitatively MP.3 Construct Viable Arguments & Critique the Reasoning of others MP.4 Model with Mathematics MP.5 Use Appropriate Tools Strategically MP.6 Attend to Precision
MP.1 Make Sense of Problems and Persevere in Solving Them MP.2 Reason Abstractly and Quantitatively MP.3 Construct Viable Arguments & Critique the Reasoning of others MP.4 Model with Mathematics MP.5 Use Appropriate Tools Strategically MP.6 Attend to Precision
MP.1 Make Sense of Problems and Persevere in Solving Them MP.2 Reason Abstractly and Quantitatively MP.3 Construct Viable Arguments & Critique the Reasoning of others MP.4 Model with Mathematics MP.5 Use Appropriate Tools Strategically MP.7 Look for and Make Use of
MP.2 Reason Abstractly and Quantitatively MP.3 Construct Viable Arguments & Critique the Reasoning of others MP.4 Model with Mathematics MP.6 Attend to Precision MP.7 Look for and Make Use of Structure MP.8 Look for and Express Regularly in Repeated Reasoning
MP.1 Make Sense of Problems and Persevere in Solving Them MP.2 Reason Abstractly and Quantitatively MP.3 Construct Viable Arguments & Critique the Reasoning of others MP.4 Model with Mathematics MP.5 Use Appropriate Tools Strategically MP.6 Attend to Precision
MP.1 Make Sense of Problems and Persevere in Solving Them MP.2 Reason Abstractly and Quantitatively MP.3 Construct Viable Arguments & Critique the Reasoning of others MP.4 Model with Mathematics MP.5 Use Appropriate Tools Strategically MP.6 Attend to
MP.1 Make Sense of Problems and Persevere in Solving Them MP.2 Reason Abstractly and Quantitatively MP.3 Construct Viable Arguments & Critique the Reasoning of others MP.4 Model with Mathematics MP.6 Attend to Precision MP.7 Look for and Make Use of Structure
MP.2 Reason Abstractly and Quantitatively MP.3 Construct Viable Arguments & Critique the Reasoning of others MP.4 Model with Mathematics MP.5 Use Appropriate Tools Strategically MP.7 Look for and Make Use of Structure MP.8 Look for and Express Regularly in Repeated Reasoning
Jamesburg Public Schools Algebra Curriculum Map
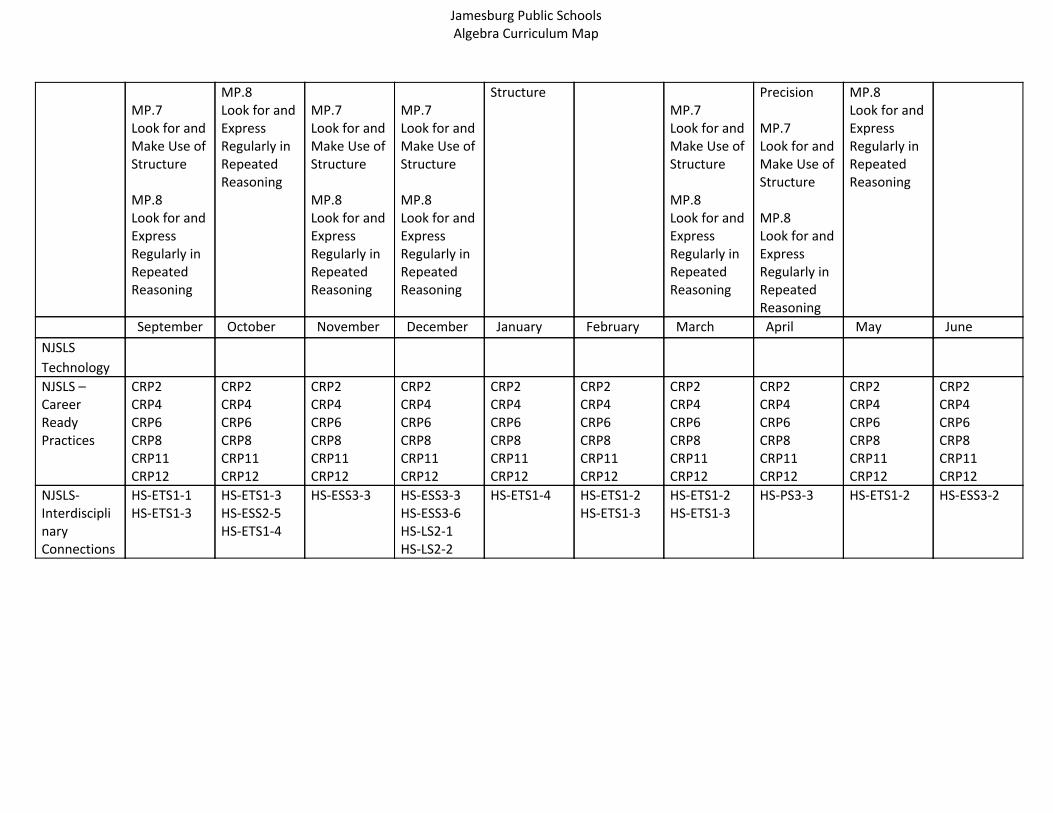
MP.7 Look for and Make Use of Structure MP.8 Look for and Express Regularly in Repeated Reasoning
MP.8 Look for and Express Regularly in Repeated Reasoning
MP.7 Look for and Make Use of Structure MP.8 Look for and Express Regularly in Repeated Reasoning
MP.7 Look for and Make Use of Structure MP.8 Look for and Express Regularly in Repeated Reasoning
Structure
MP.7 Look for and Make Use of Structure MP.8 Look for and Express Regularly in Repeated Reasoning
Precision MP.7 Look for and Make Use of Structure MP.8 Look for and Express Regularly in Repeated Reasoning
MP.8 Look for and Express Regularly in Repeated Reasoning
September October November December January February March April May June
NJSLS
Technology
NJSLS – Career Ready Practices
CRP2 CRP4 CRP6 CRP8 CRP11 CRP12
CRP2 CRP4 CRP6 CRP8 CRP11 CRP12
CRP2 CRP4 CRP6 CRP8 CRP11 CRP12
CRP2 CRP4 CRP6 CRP8 CRP11 CRP12
CRP2 CRP4 CRP6 CRP8 CRP11 CRP12
CRP2 CRP4 CRP6 CRP8 CRP11 CRP12
CRP2 CRP4 CRP6 CRP8 CRP11 CRP12
CRP2 CRP4 CRP6 CRP8 CRP11 CRP12
CRP2 CRP4 CRP6 CRP8 CRP11 CRP12
CRP2 CRP4 CRP6 CRP8 CRP11 CRP12
NJSLS- Interdisciplinary Connections
HS-ETS1-1 HS-ETS1-3
HS-ETS1-3 HS-ESS2-5 HS-ETS1-4
HS-ESS3-3 HS-ESS3-3 HS-ESS3-6 HS-LS2-1 HS-LS2-2
HS-ETS1-4 HS-ETS1-2 HS-ETS1-3
HS-ETS1-2 HS-ETS1-3
HS-PS3-3 HS-ETS1-2 HS-ESS3-2
Jamesburg Public Schools Algebra Curriculum Map
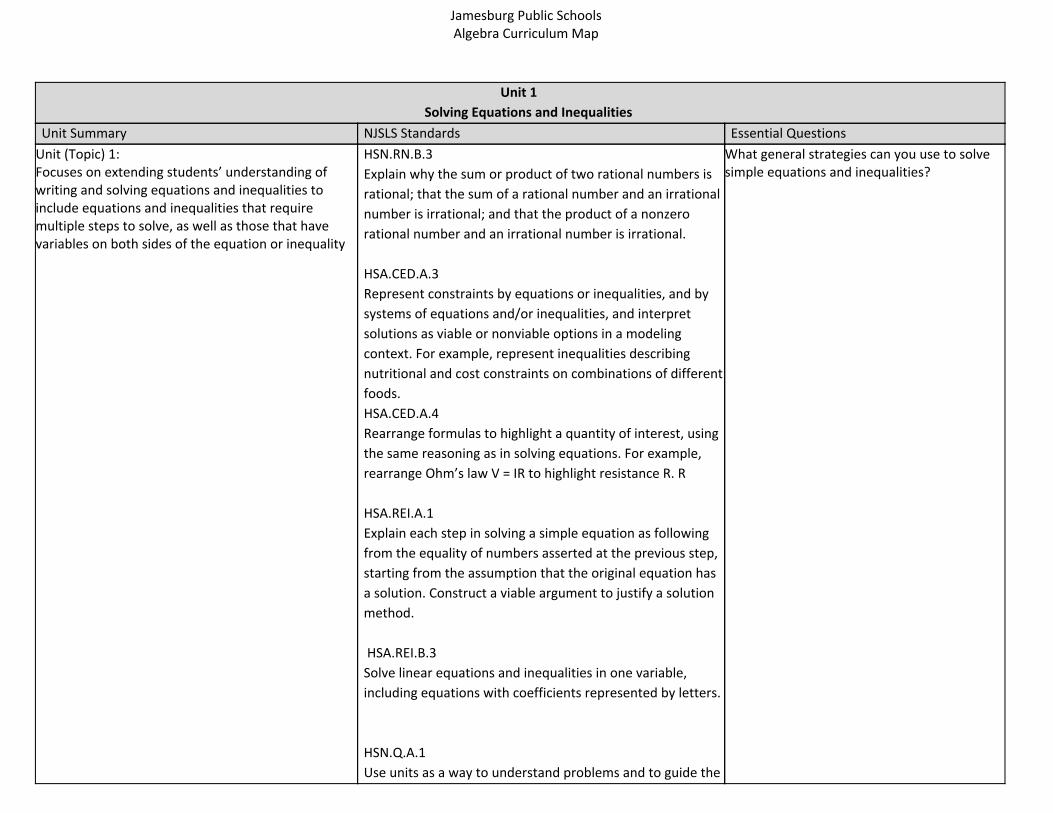
Unit 1
Solving Equations and Inequalities
Unit Summary NJSLS Standards Essential Questions
Unit (Topic) 1: Focuses on extending students’ understanding of writing and solving equations and inequalities to include equations and inequalities that require multiple steps to solve, as well as those that have variables on both sides of the equation or inequality
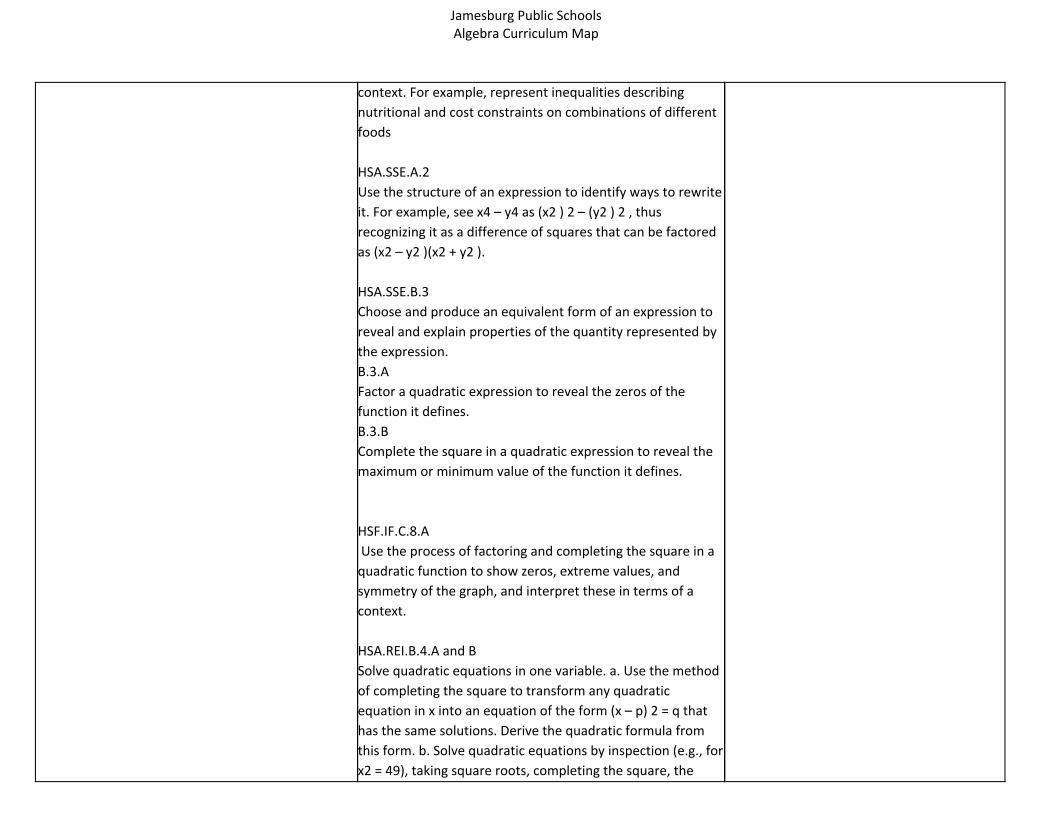
HSN.RN.B.3
Explain why the sum or product of two rational numbers is
rational; that the sum of a rational number and an irrational
number is irrational; and that the product of a nonzero
rational number and an irrational number is irrational.
HSA.CED.A.3
Represent constraints by equations or inequalities, and by
systems of equations and/or inequalities, and interpret
solutions as viable or nonviable options in a modeling
context. For example, represent inequalities describing
nutritional and cost constraints on combinations of different
foods.
HSA.CED.A.4
Rearrange formulas to highlight a quantity of interest, using
the same reasoning as in solving equations. For example,
rearrange Ohm’s law V = IR to highlight resistance R. R
HSA.REI.A.1
Explain each step in solving a simple equation as following
from the equality of numbers asserted at the previous step,
starting from the assumption that the original equation has
a solution. Construct a viable argument to justify a solution
method.
HSA.REI.B.3
Solve linear equations and inequalities in one variable,
including equations with coefficients represented by letters.
HSN.Q.A.1
Use units as a way to understand problems and to guide the
What general strategies can you use to solve simple equations and inequalities?
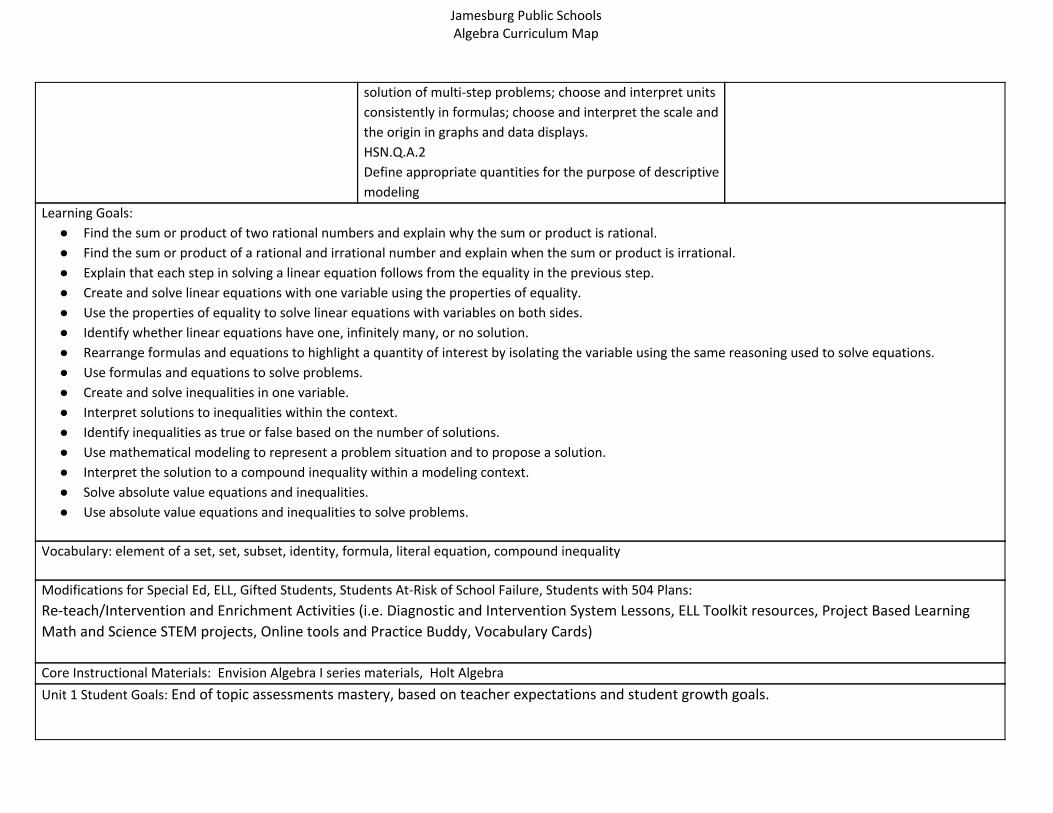
Jamesburg Public Schools Algebra Curriculum Map
solution of multi-step problems; choose and interpret units
consistently in formulas; choose and interpret the scale and
the origin in graphs and data displays.
HSN.Q.A.2
Define appropriate quantities for the purpose of descriptive
modeling
Learning Goals:
● Find the sum or product of two rational numbers and explain why the sum or product is rational.
● Find the sum or product of a rational and irrational number and explain when the sum or product is irrational.
● Explain that each step in solving a linear equation follows from the equality in the previous step.
● Create and solve linear equations with one variable using the properties of equality.
● Use the properties of equality to solve linear equations with variables on both sides.
● Identify whether linear equations have one, infinitely many, or no solution.
● Rearrange formulas and equations to highlight a quantity of interest by isolating the variable using the same reasoning used to solve equations.
● Use formulas and equations to solve problems.
● Create and solve inequalities in one variable.
● Interpret solutions to inequalities within the context.
● Identify inequalities as true or false based on the number of solutions.
● Use mathematical modeling to represent a problem situation and to propose a solution.
● Interpret the solution to a compound inequality within a modeling context.
● Solve absolute value equations and inequalities.
● Use absolute value equations and inequalities to solve problems.
Vocabulary: element of a set, set, subset, identity, formula, literal equation, compound inequality
Modifications for Special Ed, ELL, Gifted Students, Students At-Risk of School Failure, Students with 504 Plans:
Re-teach/Intervention and Enrichment Activities (i.e. Diagnostic and Intervention System Lessons, ELL Toolkit resources, Project Based Learning
Math and Science STEM projects, Online tools and Practice Buddy, Vocabulary Cards)
Core Instructional Materials: Envision Algebra I series materials, Holt Algebra
Unit 1 Student Goals: End of topic assessments mastery, based on teacher expectations and student growth goals.
Jamesburg Public Schools Algebra Curriculum Map
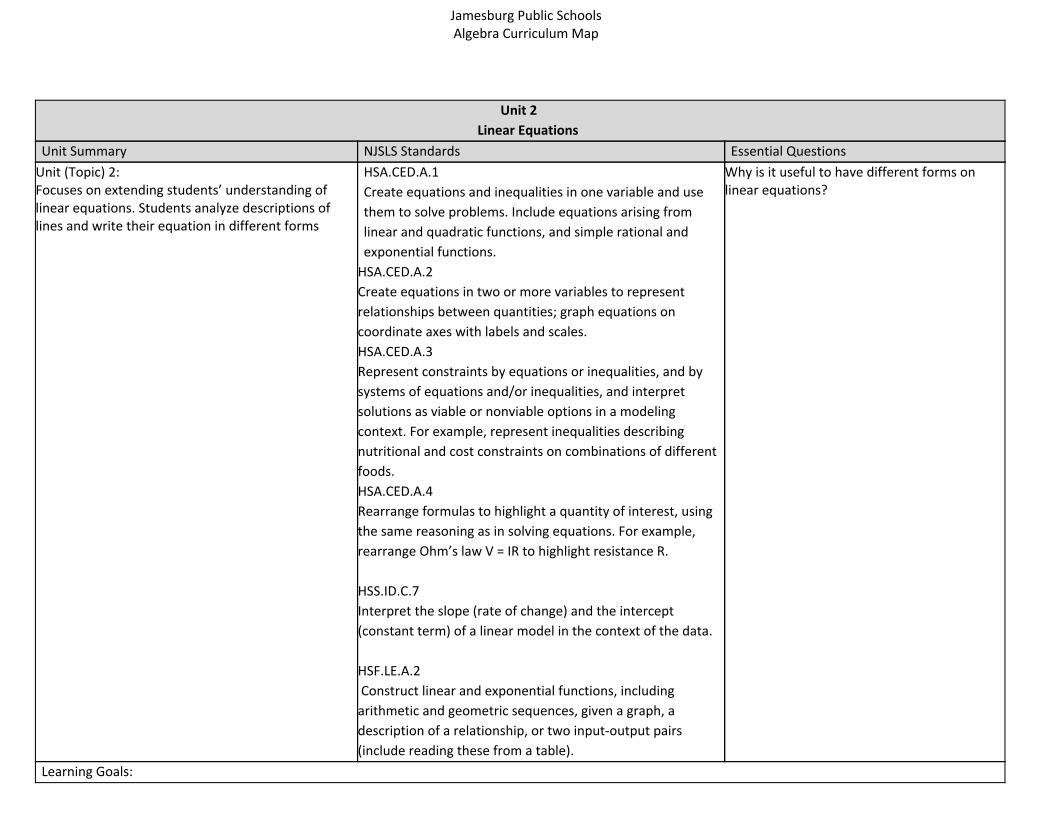
Unit 2
Linear Equations
Unit Summary NJSLS Standards Essential Questions
Unit (Topic) 2: Focuses on extending students’ understanding of linear equations. Students analyze descriptions of lines and write their equation in different forms
HSA.CED.A.1
Create equations and inequalities in one variable and use
them to solve problems. Include equations arising from
linear and quadratic functions, and simple rational and
exponential functions.
HSA.CED.A.2
Create equations in two or more variables to represent
relationships between quantities; graph equations on
coordinate axes with labels and scales.
HSA.CED.A.3
Represent constraints by equations or inequalities, and by
systems of equations and/or inequalities, and interpret
solutions as viable or nonviable options in a modeling
context. For example, represent inequalities describing
nutritional and cost constraints on combinations of different
foods.
HSA.CED.A.4
Rearrange formulas to highlight a quantity of interest, using
the same reasoning as in solving equations. For example,
rearrange Ohm’s law V = IR to highlight resistance R.
HSS.ID.C.7
Interpret the slope (rate of change) and the intercept
(constant term) of a linear model in the context of the data.
HSF.LE.A.2
Construct linear and exponential functions, including
arithmetic and geometric sequences, given a graph, a
description of a relationship, or two input-output pairs
(include reading these from a table).
Why is it useful to have different forms on linear equations?
Learning Goals:
Jamesburg Public Schools Algebra Curriculum Map
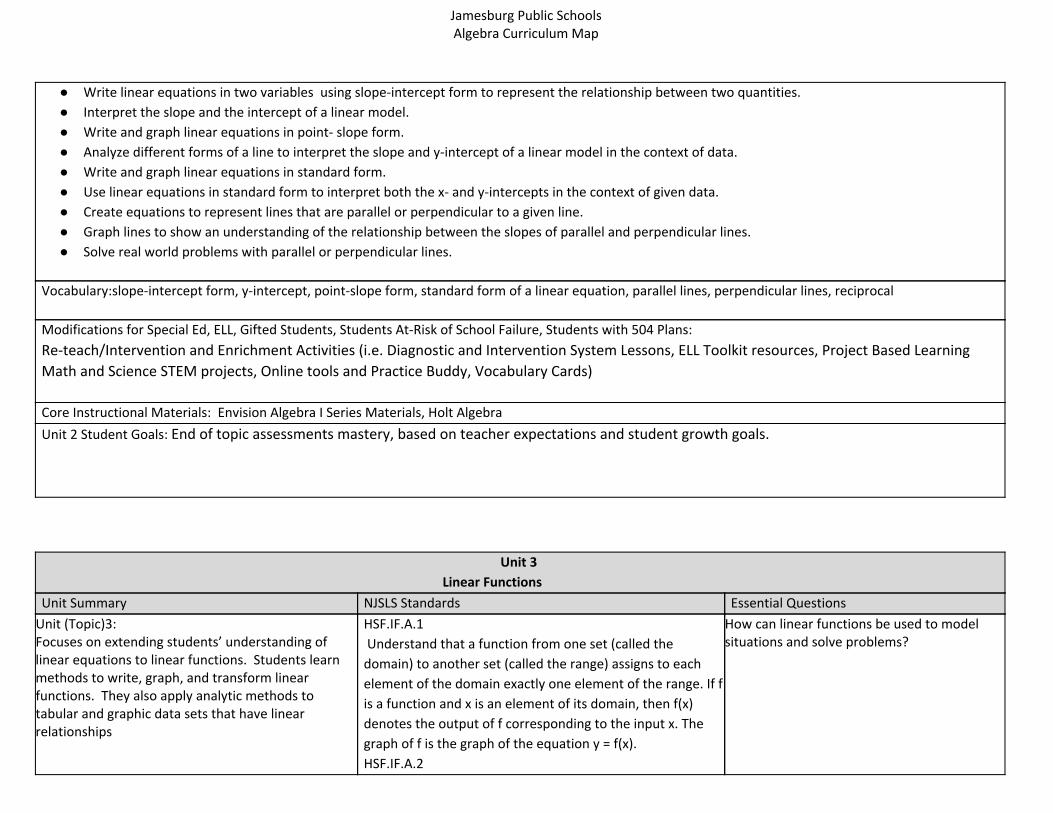
● Write linear equations in two variables using slope-intercept form to represent the relationship between two quantities.
● Interpret the slope and the intercept of a linear model.
● Write and graph linear equations in point- slope form.
● Analyze different forms of a line to interpret the slope and y-intercept of a linear model in the context of data.
● Write and graph linear equations in standard form.
● Use linear equations in standard form to interpret both the x- and y-intercepts in the context of given data.
● Create equations to represent lines that are parallel or perpendicular to a given line.
● Graph lines to show an understanding of the relationship between the slopes of parallel and perpendicular lines.
● Solve real world problems with parallel or perpendicular lines.
Vocabulary:slope-intercept form, y-intercept, point-slope form, standard form of a linear equation, parallel lines, perpendicular lines, reciprocal
Modifications for Special Ed, ELL, Gifted Students, Students At-Risk of School Failure, Students with 504 Plans:
Re-teach/Intervention and Enrichment Activities (i.e. Diagnostic and Intervention System Lessons, ELL Toolkit resources, Project Based Learning
Math and Science STEM projects, Online tools and Practice Buddy, Vocabulary Cards)
Core Instructional Materials: Envision Algebra I Series Materials, Holt Algebra
Unit 2 Student Goals: End of topic assessments mastery, based on teacher expectations and student growth goals.
Unit 3
Linear Functions
Unit Summary NJSLS Standards Essential Questions
Unit (Topic)3: Focuses on extending students’ understanding of linear equations to linear functions. Students learn methods to write, graph, and transform linear functions. They also apply analytic methods to tabular and graphic data sets that have linear relationships
HSF.IF.A.1
Understand that a function from one set (called the
domain) to another set (called the range) assigns to each
element of the domain exactly one element of the range. If f
is a function and x is an element of its domain, then f(x)
denotes the output of f corresponding to the input x. The
graph of f is the graph of the equation y = f(x).
HSF.IF.A.2
How can linear functions be used to model situations and solve problems?
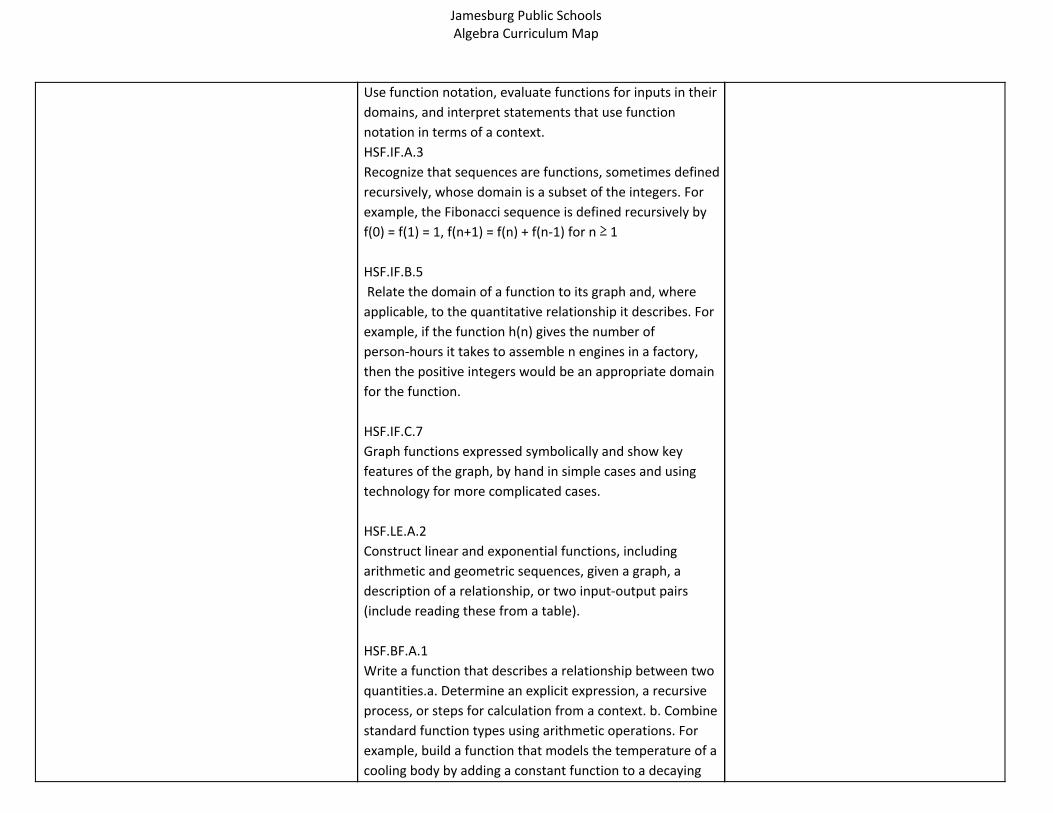
Jamesburg Public Schools Algebra Curriculum Map
Use function notation, evaluate functions for inputs in their
domains, and interpret statements that use function
notation in terms of a context.
HSF.IF.A.3
Recognize that sequences are functions, sometimes defined
recursively, whose domain is a subset of the integers. For
example, the Fibonacci sequence is defined recursively by
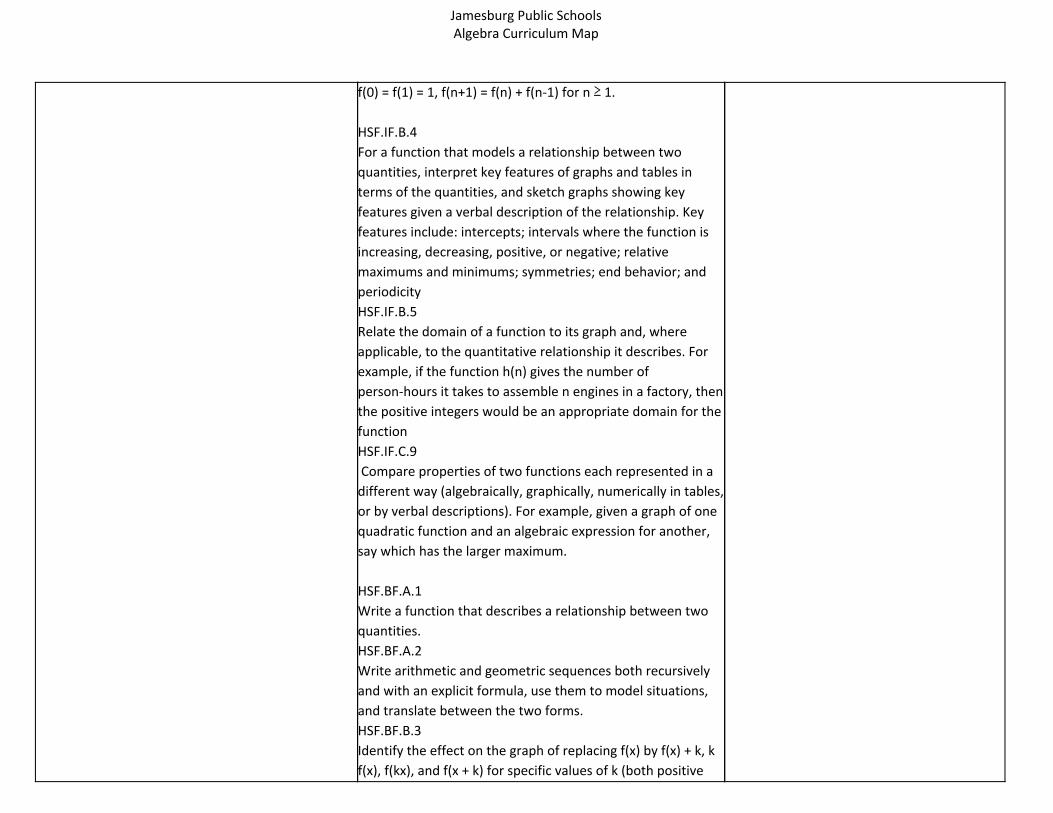
f(0) = f(1) = 1, f(n+1) = f(n) + f(n-1) for n ≥ 1
HSF.IF.B.5
Relate the domain of a function to its graph and, where
applicable, to the quantitative relationship it describes. For
example, if the function h(n) gives the number of
person-hours it takes to assemble n engines in a factory,
then the positive integers would be an appropriate domain
for the function.
HSF.IF.C.7
Graph functions expressed symbolically and show key
features of the graph, by hand in simple cases and using
technology for more complicated cases.
HSF.LE.A.2
Construct linear and exponential functions, including
arithmetic and geometric sequences, given a graph, a
description of a relationship, or two input-output pairs
(include reading these from a table).
HSF.BF.A.1
Write a function that describes a relationship between two
quantities.a. Determine an explicit expression, a recursive
process, or steps for calculation from a context. b. Combine
standard function types using arithmetic operations. For
example, build a function that models the temperature of a
cooling body by adding a constant function to a decaying
Jamesburg Public Schools Algebra Curriculum Map
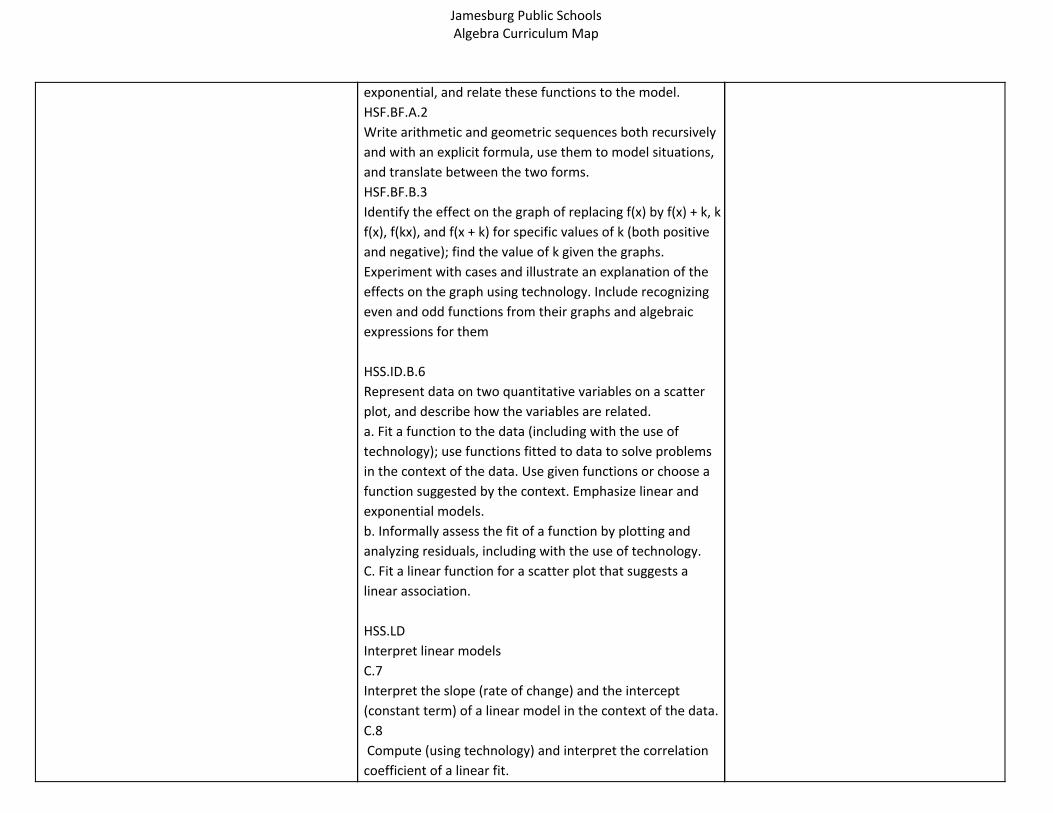
exponential, and relate these functions to the model.
HSF.BF.A.2
Write arithmetic and geometric sequences both recursively
and with an explicit formula, use them to model situations,
and translate between the two forms.
HSF.BF.B.3
Identify the effect on the graph of replacing f(x) by f(x) + k, k
f(x), f(kx), and f(x + k) for specific values of k (both positive
and negative); find the value of k given the graphs.
Experiment with cases and illustrate an explanation of the
effects on the graph using technology. Include recognizing
even and odd functions from their graphs and algebraic
expressions for them
HSS.ID.B.6
Represent data on two quantitative variables on a scatter
plot, and describe how the variables are related.
a. Fit a function to the data (including with the use of
technology); use functions fitted to data to solve problems
in the context of the data. Use given functions or choose a
function suggested by the context. Emphasize linear and
exponential models.
b. Informally assess the fit of a function by plotting and
analyzing residuals, including with the use of technology.
C. Fit a linear function for a scatter plot that suggests a
linear association.
HSS.LD
Interpret linear models
C.7
Interpret the slope (rate of change) and the intercept
(constant term) of a linear model in the context of the data.
C.8
Compute (using technology) and interpret the correlation
coefficient of a linear fit.
Jamesburg Public Schools Algebra Curriculum Map
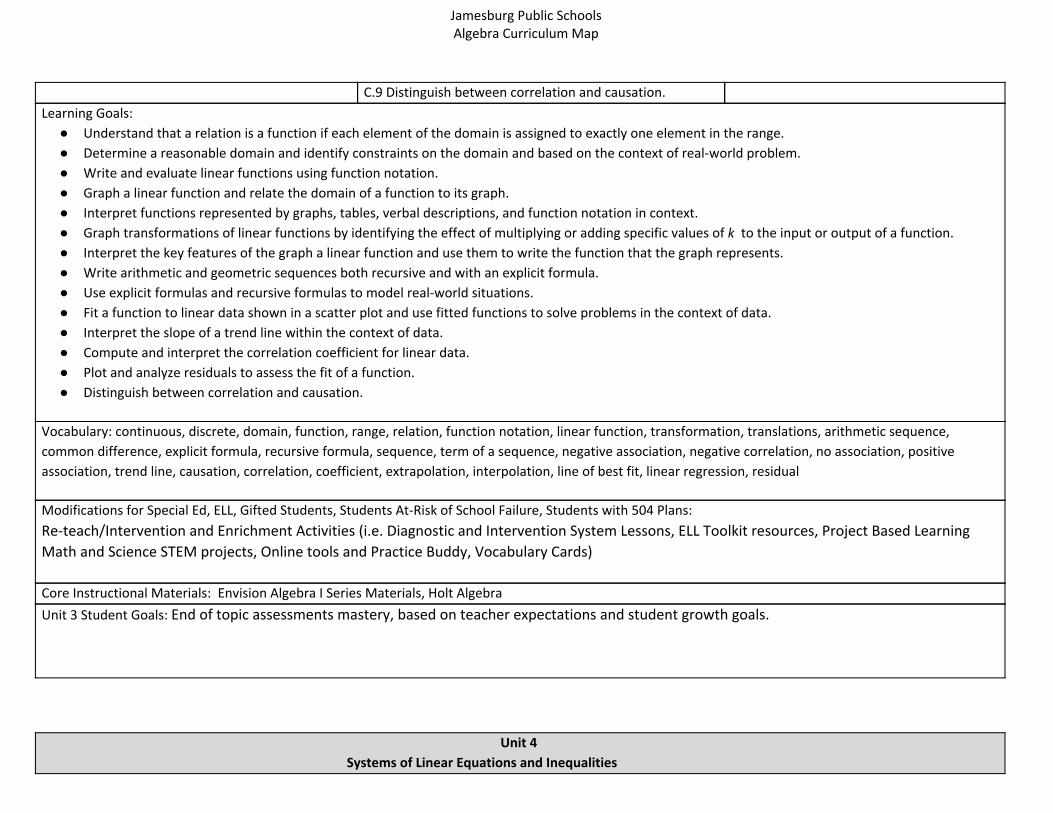
C.9 Distinguish between correlation and causation.
Learning Goals:
● Understand that a relation is a function if each element of the domain is assigned to exactly one element in the range.
● Determine a reasonable domain and identify constraints on the domain and based on the context of real-world problem.
● Write and evaluate linear functions using function notation.
● Graph a linear function and relate the domain of a function to its graph.
● Interpret functions represented by graphs, tables, verbal descriptions, and function notation in context.
● Graph transformations of linear functions by identifying the effect of multiplying or adding specific values of k to the input or output of a function.
● Interpret the key features of the graph a linear function and use them to write the function that the graph represents.
● Write arithmetic and geometric sequences both recursive and with an explicit formula.
● Use explicit formulas and recursive formulas to model real-world situations.
● Fit a function to linear data shown in a scatter plot and use fitted functions to solve problems in the context of data.
● Interpret the slope of a trend line within the context of data.
● Compute and interpret the correlation coefficient for linear data.
● Plot and analyze residuals to assess the fit of a function.
● Distinguish between correlation and causation.
Vocabulary: continuous, discrete, domain, function, range, relation, function notation, linear function, transformation, translations, arithmetic sequence,
common difference, explicit formula, recursive formula, sequence, term of a sequence, negative association, negative correlation, no association, positive
association, trend line, causation, correlation, coefficient, extrapolation, interpolation, line of best fit, linear regression, residual
Modifications for Special Ed, ELL, Gifted Students, Students At-Risk of School Failure, Students with 504 Plans:
Re-teach/Intervention and Enrichment Activities (i.e. Diagnostic and Intervention System Lessons, ELL Toolkit resources, Project Based Learning
Math and Science STEM projects, Online tools and Practice Buddy, Vocabulary Cards)
Core Instructional Materials: Envision Algebra I Series Materials, Holt Algebra
Unit 3 Student Goals: End of topic assessments mastery, based on teacher expectations and student growth goals.
Unit 4
Systems of Linear Equations and Inequalities
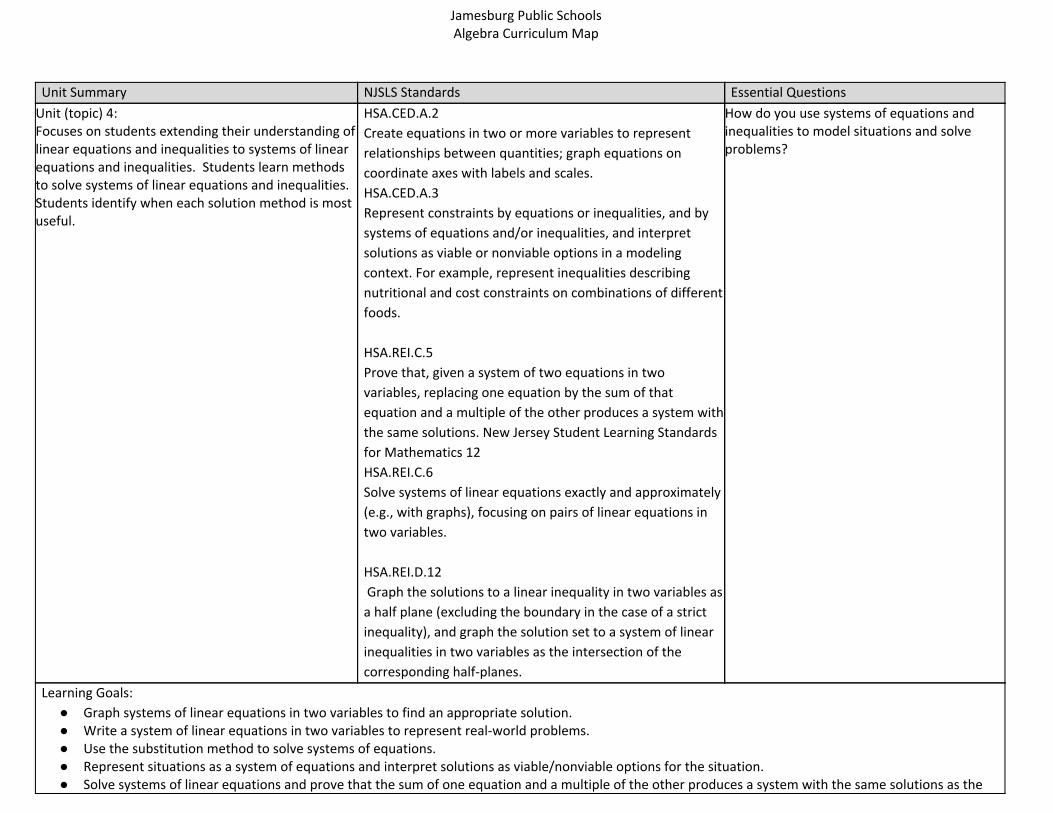
Jamesburg Public Schools Algebra Curriculum Map
Unit Summary NJSLS Standards Essential Questions
Unit (topic) 4: Focuses on students extending their understanding of linear equations and inequalities to systems of linear equations and inequalities. Students learn methods to solve systems of linear equations and inequalities. Students identify when each solution method is most useful.
HSA.CED.A.2
Create equations in two or more variables to represent
relationships between quantities; graph equations on
coordinate axes with labels and scales.
HSA.CED.A.3
Represent constraints by equations or inequalities, and by
systems of equations and/or inequalities, and interpret
solutions as viable or nonviable options in a modeling
context. For example, represent inequalities describing
nutritional and cost constraints on combinations of different
foods.
HSA.REI.C.5
Prove that, given a system of two equations in two
variables, replacing one equation by the sum of that
equation and a multiple of the other produces a system with
the same solutions. New Jersey Student Learning Standards
for Mathematics 12
HSA.REI.C.6
Solve systems of linear equations exactly and approximately
(e.g., with graphs), focusing on pairs of linear equations in
two variables.
HSA.REI.D.12
Graph the solutions to a linear inequality in two variables as
a half plane (excluding the boundary in the case of a strict
inequality), and graph the solution set to a system of linear
inequalities in two variables as the intersection of the
corresponding half-planes.
How do you use systems of equations and inequalities to model situations and solve problems?
Learning Goals:
● Graph systems of linear equations in two variables to find an appropriate solution. ● Write a system of linear equations in two variables to represent real-world problems. ● Use the substitution method to solve systems of equations. ● Represent situations as a system of equations and interpret solutions as viable/nonviable options for the situation. ● Solve systems of linear equations and prove that the sum of one equation and a multiple of the other produces a system with the same solutions as the
Jamesburg Public Schools Algebra Curriculum Map
original system. ● Represent constraints with a system of equations in a modeling context. ● Graph solutions to linear inequalities in two variables ● Represent constraints with inequalities and interpret solutions as viable or nonviable options in a modeling context. ● Graph the solution set of a system of linear inequalities in two variables. ● Interpret solutions of linear inequalities in a modeling context.
Vocabulary: Linear inequality in two variables, solution of an inequality in two variables, solution of a system of linear inequalities
Modifications for Special Ed, ELL, Gifted Students, Students At-Risk of School Failure, Students with 504 Plans:
Re-teach/Intervention and Enrichment Activities (i.e. Diagnostic and Intervention System Lessons, ELL Toolkit resources, Project Based Learning
Math and Science STEM projects, Online tools and Practice Buddy, Vocabulary Cards)
Core Instructional Materials: Envision Algebra I Series Materials, Holt Algebra
Unit 4 Student Goals: End of topic assessments mastery, based on teacher expectations and student growth goals.
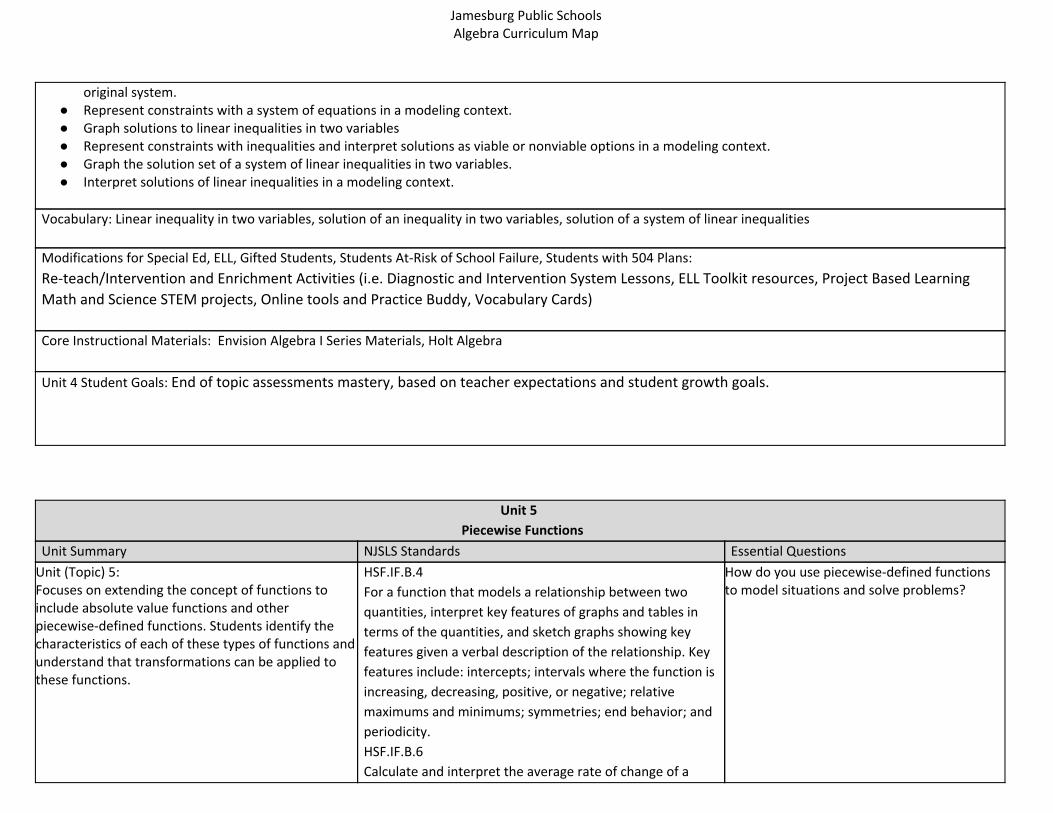
Unit 5
Piecewise Functions
Unit Summary NJSLS Standards Essential Questions
Unit (Topic) 5: Focuses on extending the concept of functions to include absolute value functions and other piecewise-defined functions. Students identify the characteristics of each of these types of functions and understand that transformations can be applied to these functions.
HSF.IF.B.4
For a function that models a relationship between two
quantities, interpret key features of graphs and tables in
terms of the quantities, and sketch graphs showing key
features given a verbal description of the relationship. Key
features include: intercepts; intervals where the function is
increasing, decreasing, positive, or negative; relative
maximums and minimums; symmetries; end behavior; and
periodicity.
HSF.IF.B.6
Calculate and interpret the average rate of change of a
How do you use piecewise-defined functions to model situations and solve problems?
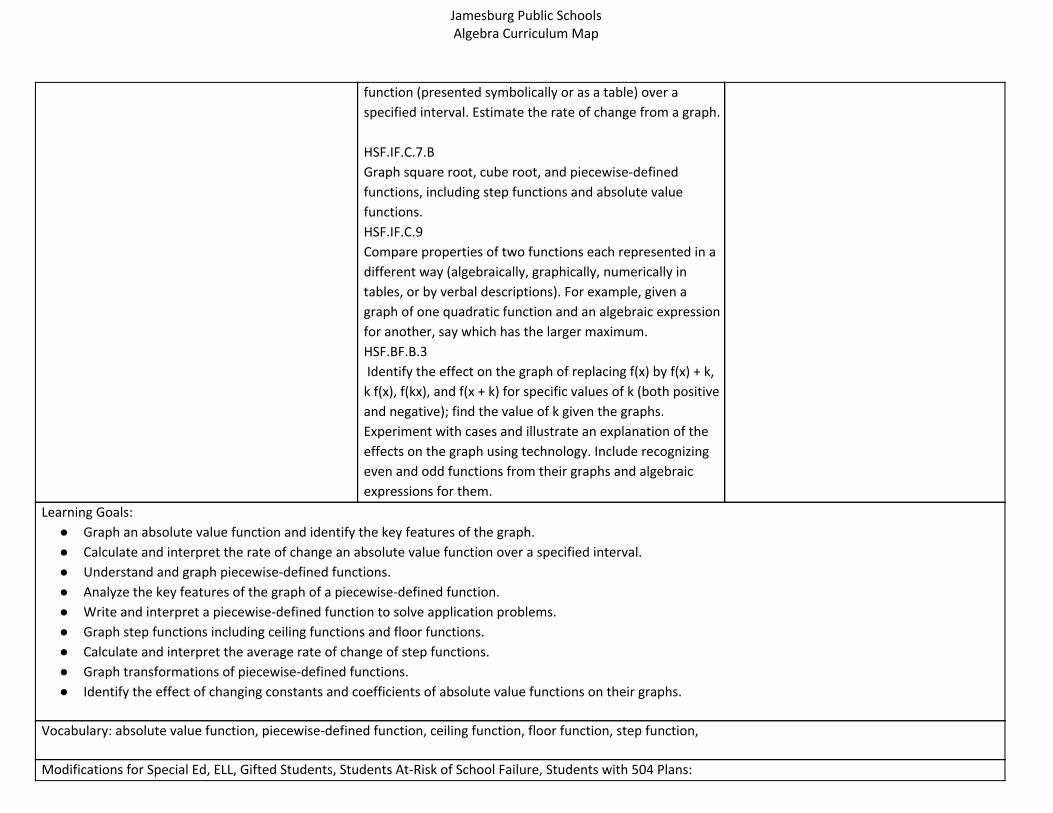
Jamesburg Public Schools Algebra Curriculum Map
function (presented symbolically or as a table) over a
specified interval. Estimate the rate of change from a graph.
HSF.IF.C.7.B
Graph square root, cube root, and piecewise-defined
functions, including step functions and absolute value
functions.
HSF.IF.C.9
Compare properties of two functions each represented in a
different way (algebraically, graphically, numerically in
tables, or by verbal descriptions). For example, given a
graph of one quadratic function and an algebraic expression
for another, say which has the larger maximum.
HSF.BF.B.3
Identify the effect on the graph of replacing f(x) by f(x) + k,
k f(x), f(kx), and f(x + k) for specific values of k (both positive
and negative); find the value of k given the graphs.
Experiment with cases and illustrate an explanation of the
effects on the graph using technology. Include recognizing
even and odd functions from their graphs and algebraic
expressions for them.
Learning Goals:
● Graph an absolute value function and identify the key features of the graph.
● Calculate and interpret the rate of change an absolute value function over a specified interval.
● Understand and graph piecewise-defined functions.
● Analyze the key features of the graph of a piecewise-defined function.
● Write and interpret a piecewise-defined function to solve application problems.
● Graph step functions including ceiling functions and floor functions.
● Calculate and interpret the average rate of change of step functions.
● Graph transformations of piecewise-defined functions.
● Identify the effect of changing constants and coefficients of absolute value functions on their graphs.
Vocabulary: absolute value function, piecewise-defined function, ceiling function, floor function, step function,
Modifications for Special Ed, ELL, Gifted Students, Students At-Risk of School Failure, Students with 504 Plans:
Jamesburg Public Schools Algebra Curriculum Map
Re-teach/Intervention and Enrichment Activities (i.e. Diagnostic and Intervention System Lessons, ELL Toolkit resources, Project Based Learning
Math and Science STEM projects, Online tools and Practice Buddy, Vocabulary Cards)
Core Instructional Materials: Envision Algebra I Series Materials, Holt Algebra
Unit 5 Student Goals: End of topic assessments mastery, based on teacher expectations and student growth goals.
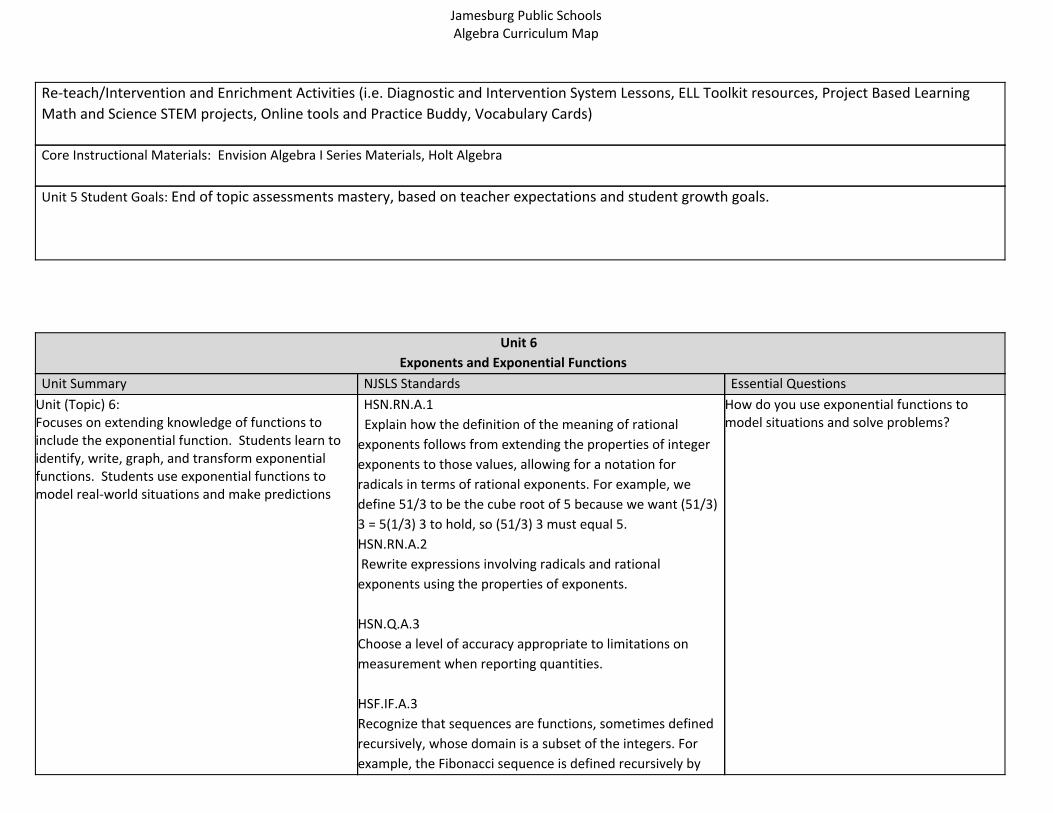
Unit 6
Exponents and Exponential Functions
Unit Summary NJSLS Standards Essential Questions
Unit (Topic) 6: Focuses on extending knowledge of functions to include the exponential function. Students learn to identify, write, graph, and transform exponential functions. Students use exponential functions to model real-world situations and make predictions
HSN.RN.A.1
Explain how the definition of the meaning of rational
exponents follows from extending the properties of integer
exponents to those values, allowing for a notation for
radicals in terms of rational exponents. For example, we
define 51/3 to be the cube root of 5 because we want (51/3)
3 = 5(1/3) 3 to hold, so (51/3) 3 must equal 5.
HSN.RN.A.2
Rewrite expressions involving radicals and rational
exponents using the properties of exponents.
HSN.Q.A.3
Choose a level of accuracy appropriate to limitations on
measurement when reporting quantities.
HSF.IF.A.3
Recognize that sequences are functions, sometimes defined
recursively, whose domain is a subset of the integers. For
example, the Fibonacci sequence is defined recursively by
How do you use exponential functions to model situations and solve problems?
Jamesburg Public Schools Algebra Curriculum Map
f(0) = f(1) = 1, f(n+1) = f(n) + f(n-1) for n ≥ 1.
HSF.IF.B.4
For a function that models a relationship between two
quantities, interpret key features of graphs and tables in
terms of the quantities, and sketch graphs showing key
features given a verbal description of the relationship. Key
features include: intercepts; intervals where the function is
increasing, decreasing, positive, or negative; relative
maximums and minimums; symmetries; end behavior; and
periodicity
HSF.IF.B.5
Relate the domain of a function to its graph and, where
applicable, to the quantitative relationship it describes. For
example, if the function h(n) gives the number of
person-hours it takes to assemble n engines in a factory, then
the positive integers would be an appropriate domain for the
function
HSF.IF.C.9
Compare properties of two functions each represented in a
different way (algebraically, graphically, numerically in tables,
or by verbal descriptions). For example, given a graph of one
quadratic function and an algebraic expression for another,
say which has the larger maximum.
HSF.BF.A.1
Write a function that describes a relationship between two
quantities.
HSF.BF.A.2
Write arithmetic and geometric sequences both recursively
and with an explicit formula, use them to model situations,
and translate between the two forms.
HSF.BF.B.3
Identify the effect on the graph of replacing f(x) by f(x) + k, k
f(x), f(kx), and f(x + k) for specific values of k (both positive
Jamesburg Public Schools Algebra Curriculum Map
and negative); find the value of k given the graphs.
Experiment with cases and illustrate an explanation of the
effects on the graph using technology. Include recognizing
even and odd functions from their graphs and algebraic
expressions for them.
HSF.LE.A.1
Distinguish between situations that can be modeled with
linear functions and with exponential functions.
HSF.LE.A1.A
Prove that linear functions grow by equal differences over
equal intervals, and that exponential functions grow by equal
factors over equal intervals
HSF.LE.A
Construct linear and exponential functions, including
arithmetic and geometric sequences, given a graph, a
description of a relationship, or two input-output pairs
(include reading these from a table)
HSF.LE.B.5
Interpret the parameters in a linear or exponential function
in terms of a context.
HSA.SSE.A.1.B
Interpret complicated expressions by viewing one or more of
their parts as a single entity. For example, interpret P(1+r) n
as the product of P and a factor not depending on P
HSA.SSE.B.3.C
Use the properties of exponents to transform expressions for
exponential functions. For example the expression 1.15t can
be rewritten as (1.151/12) 12t ≈1.01212t to reveal the
approximate equivalent monthly interest rate if the annual
rate is 15%
Learning Goals:
● Extend the properties of integer exponents to rational exponents to rewrite radical expressions using rational exponents.
● Solve equations with rational exponents using the properties of exponents
Jamesburg Public Schools Algebra Curriculum Map
● Sketch graphs showing key features of exponential functions
● Write exponential functions using tables and graphs.
● Compare linear and exponential functions.
● Construct exponential growth and decay functions given a description of a relationship.
● Recognize if a situation can be modeled with exponential growth or exponential decay, and interpret the parameters of the model in context.
● Find explicit and recursive formulas for geometric sequences.
● Translate between recursive and explicit formulas for geometric sequences.
● Construct exponential functions to represent geometric sequences.
● Translate the graph of an exponential function vertically and horizontally, identifying the effect different values of h and k have on the graph of the
function.
● Compare characteristics of two exponential functions represented in different ways, such as tables and graphs.
Vocabulary: rational exponent, asymptote, constant ratio, exponential function, compound interest, decay factor, exponential decay, exponential growth,
growth factor, geometric sequence
Modifications for Special Ed, ELL, Gifted Students, Students At-Risk of School Failure, Students with 504 Plans:
Re-teach/Intervention and Enrichment Activities (i.e. Diagnostic and Intervention System Lessons, ELL Toolkit resources, Project Based Learning
Math and Science STEM projects, Online tools and Practice Buddy, Vocabulary Cards)
Core Instructional Materials: Envision Algebra I Series Materials, Holt Algebra
Unit 6 Student Goals: End of topic assessments mastery, based on teacher expectations and student growth goals.
Unit 7
Polynomials and Factoring
Unit Summary NJSLS Standards Essential Questions
Unit (Topic) 7: Focuses on extending polynomials. Students identify the parts and factors of polynomials. Students understand how to factor trinomials using the
HSA.APR.A.1
HSA.SSE.A.1
Interpret expressions that represent a quantity in terms of
How do you work with polynomials to rewrite expressions and solve problems?
Jamesburg Public Schools Algebra Curriculum Map
greatest common factor, binomial factors, and special patterns. Students learn methods to add, subtract, and multiply polynomials.
its context.
1.A
Interpret parts of an expression, such as terms, factors, and
coefficients. b. Interpret complicated expressions by viewing
one or more of their parts as a single entity. For example,
interpret P(1+r) n as the product of P and a factor not
depending on P
HSA.SSE.A.2
Use the structure of an expression to identify ways to
rewrite it. For example, see x4 – y4 as (x2 ) 2 – (y2 ) 2 , thus
recognizing it as a difference of squares that can be factored
as (x2 – y2 )(x2 + y2 ).
HSA.APR.A.1
Understand that polynomials form a system analogous to
the integers, namely, they are closed under the operations
of addition, subtraction, and multiplication; add, subtract,
and multiply polynomials.
Learning Goals:
● Identify the parts of a polynomial ● Classify polynomials by number of terms and by degree ● Write a polynomial in standard form ● Add or subtract two polynomials ● Use the Distributive Property with polynomials, recognizing that polynomials are closed under multiplication ● Multiply polynomials using a table and an area model ● Determine the square of a binomial ● Find the product of a sum and difference of two squares ● Solve real-world problems involving the square of a binomial ● Find the greatest common factor of the terms of a polynomial ● Use the structure of a polynomial to rewrite it in factored form ● Factor polynomials that represent real-world problems ● Factor a trinomial in the form x^2+bx+c by finding two binomial factors whose product is equal to the trinomial ● Identify and use patterns in the signs of the coefficients of the terms of a trinomial expression ● Identify the common factor of the coefficients in the terms of a trinomial expression when a is not equal to 1 ● Write a quadratic trinomial as a product of two binomial factors ● Identify and factor a trinomial that is a perfect square or a binomial that is a difference of two squares
Jamesburg Public Schools Algebra Curriculum Map
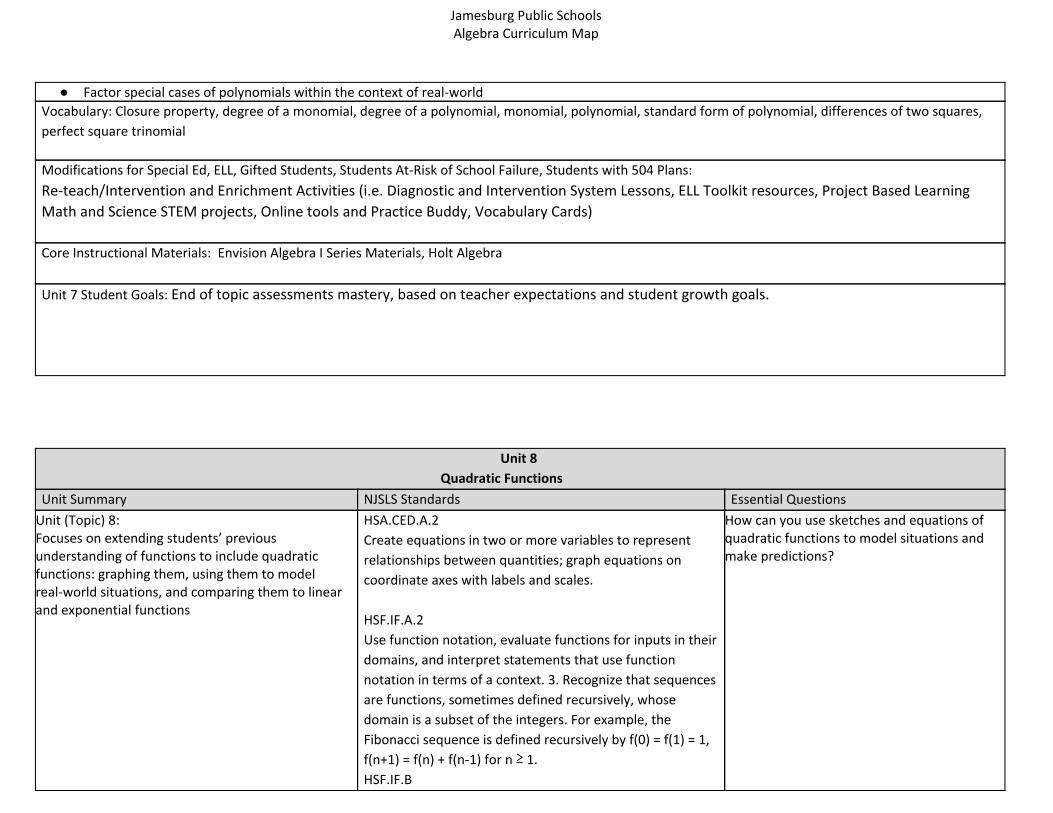
● Factor special cases of polynomials within the context of real-world Vocabulary: Closure property, degree of a monomial, degree of a polynomial, monomial, polynomial, standard form of polynomial, differences of two squares,
perfect square trinomial
Modifications for Special Ed, ELL, Gifted Students, Students At-Risk of School Failure, Students with 504 Plans:
Re-teach/Intervention and Enrichment Activities (i.e. Diagnostic and Intervention System Lessons, ELL Toolkit resources, Project Based Learning
Math and Science STEM projects, Online tools and Practice Buddy, Vocabulary Cards)
Core Instructional Materials: Envision Algebra I Series Materials, Holt Algebra
Unit 7 Student Goals: End of topic assessments mastery, based on teacher expectations and student growth goals.
Unit 8
Quadratic Functions
Unit Summary NJSLS Standards Essential Questions
Unit (Topic) 8: Focuses on extending students’ previous understanding of functions to include quadratic functions: graphing them, using them to model real-world situations, and comparing them to linear and exponential functions
HSA.CED.A.2
Create equations in two or more variables to represent
relationships between quantities; graph equations on
coordinate axes with labels and scales.
HSF.IF.A.2
Use function notation, evaluate functions for inputs in their
domains, and interpret statements that use function
notation in terms of a context. 3. Recognize that sequences
are functions, sometimes defined recursively, whose
domain is a subset of the integers. For example, the
Fibonacci sequence is defined recursively by f(0) = f(1) = 1,
f(n+1) = f(n) + f(n-1) for n ≥ 1.
HSF.IF.B
How can you use sketches and equations of quadratic functions to model situations and make predictions?
Jamesburg Public Schools Algebra Curriculum Map
Interpret functions that arise in applications in terms of the
context
B.4
For a function that models a relationship between two
quantities, interpret key features of graphs and tables in
terms of the quantities, and sketch graphs showing key
features given a verbal description of the relationship. Key
features include: intercepts; intervals where the function is
increasing, decreasing, positive, or negative; relative
maximums and minimums; symmetries; end behavior; and
periodicity.
B.6
Calculate and interpret the average rate of change of a
function (presented symbolically or as a table) over a
specified interval. Estimate the rate of change from a graph
C. 7
Graph functions expressed symbolically and show key
features of the graph, by hand in simple cases and using
technology for more complicated cases.
C.7.A
Graph linear and quadratic functions and show intercepts,
maxima, and minima.
C.8
Write a function defined by an expression in different but
equivalent forms to reveal and explain different properties of
the function.
C.9
Compare properties of two functions each represented in a
different way (algebraically, graphically, numerically in tables,
or by verbal descriptions). For example, given a graph of one
quadratic function and an algebraic expression for another,
say which has the larger maximum.
HSF.BF.A.1
Write a function that describes a relationship between two
Jamesburg Public Schools Algebra Curriculum Map
quantities
HSF.BF.B.3
Identify the effect on the graph of replacing f(x) by f(x) + k, k
f(x), f(kx), and f(x + k) for specific values of k (both positive
and negative); find the value of k given the graphs.
Experiment with cases and illustrate an explanation of the
effects on the graph using technology. Include recognizing
even and odd functions from their graphs and algebraic
expressions for them.
HSS.ID.B.6.A
Fit a function to the data (including with the use of
technology); use functions fitted to data to solve problems in
the context of the data. Use given functions or choose a
function suggested by the context. Emphasize linear and
exponential models.
HSS.ID.B.6.B
Informally assess the fit of a function by plotting and
analyzing residuals, including with the use of technology.
HSA.REI.D.10
Understand that the graph of an equation in two variables is
the set of all its solutions plotted in the coordinate plane,
often forming a curve (which could be a line)
Learning Goals:
● Identify key features of the graph of a quadratic function using graphs, tables, and equations
● Explain the effect of the value of a on the quadratic parent function
● Identify key features of the graph of quadratic functions written in vertex form
● Graph quadratic functions in vertex form
● Graph quadratic functions in standard form and show intercepts, maxima, and minima
● Determine how the values of a,b,and c affect the graph of f(x)=ax^2+bx+c
● Identify key features of parabolas
● Compare properties of quadratic functions presented in different forms (algebraically, in a table, graphically)
● Use quadratic functions fitted to data to model real-world situations
● Use the vertical motion model to write an equation
Jamesburg Public Schools Algebra Curriculum Map
● Compare a model to a data set by analyzing and evaluating residuals
● Determine which model-linear, exponential, or quadratic - best fits a set of data
● Use fitted functions to solve problems in the context of data
Vocabulary: parabola, quadratic parent function, vertex form of a quadratic function, vertical motion regression,
Modifications for Special Ed, ELL, Gifted Students, Students At-Risk of School Failure, Students with 504 Plans:
Re-teach/Intervention and Enrichment Activities (i.e. Diagnostic and Intervention System Lessons, ELL Toolkit resources, Project Based Learning
Math and Science STEM projects, Online tools and Practice Buddy, Vocabulary Cards)
Core Instructional Materials: Envision Algebra I Series Materials, Holt Algebra
Unit 8 Student Goals: End of topic assessments mastery, based on teacher expectations and student growth goals.
Unit 9
Unit Summary NJSLS Standards Essential Questions
Unit (Topic) 9: Focuses on extending knowledge of quadratic functions. Students learn to solve quadratic equations using tables, graphs and factoring. Students also solve quadratic equations using square roots, completing the square, and the quadratic formula. Students learn different methods, such as graphing, elimination, and substitution, for solving linear-quadratic systems
HSA.CED.A
A.1
Create equations and inequalities in one variable and use
them to solve problems. Include equations arising from linear
and quadratic functions, and simple rational and exponential
functions.
A.2
Create equations in two or more variables to represent
relationships between quantities; graph equations on
coordinate axes with labels and scales.
A.3
Represent constraints by equations or inequalities, and by
systems of equations and/or inequalities, and interpret
solutions as viable or nonviable options in a modeling
How do you use quadratic equations to model situations and solve problems?
Jamesburg Public Schools Algebra Curriculum Map
context. For example, represent inequalities describing
nutritional and cost constraints on combinations of different
foods
HSA.SSE.A.2
Use the structure of an expression to identify ways to rewrite
it. For example, see x4 – y4 as (x2 ) 2 – (y2 ) 2 , thus
recognizing it as a difference of squares that can be factored
as (x2 – y2 )(x2 + y2 ).
HSA.SSE.B.3
Choose and produce an equivalent form of an expression to
reveal and explain properties of the quantity represented by
the expression.
B.3.A
Factor a quadratic expression to reveal the zeros of the
function it defines.
B.3.B
Complete the square in a quadratic expression to reveal the
maximum or minimum value of the function it defines.
HSF.IF.C.8.A
Use the process of factoring and completing the square in a
quadratic function to show zeros, extreme values, and
symmetry of the graph, and interpret these in terms of a
context.
HSA.REI.B.4.A and B
Solve quadratic equations in one variable. a. Use the method
of completing the square to transform any quadratic
equation in x into an equation of the form (x – p) 2 = q that
has the same solutions. Derive the quadratic formula from
this form. b. Solve quadratic equations by inspection (e.g., for
x2 = 49), taking square roots, completing the square, the
Jamesburg Public Schools Algebra Curriculum Map
quadratic formula and factoring, as appropriate to the initial
form of the equation. Recognize when the quadratic formula
gives complex solutions and write them as a ± bi for real
numbers a and b.
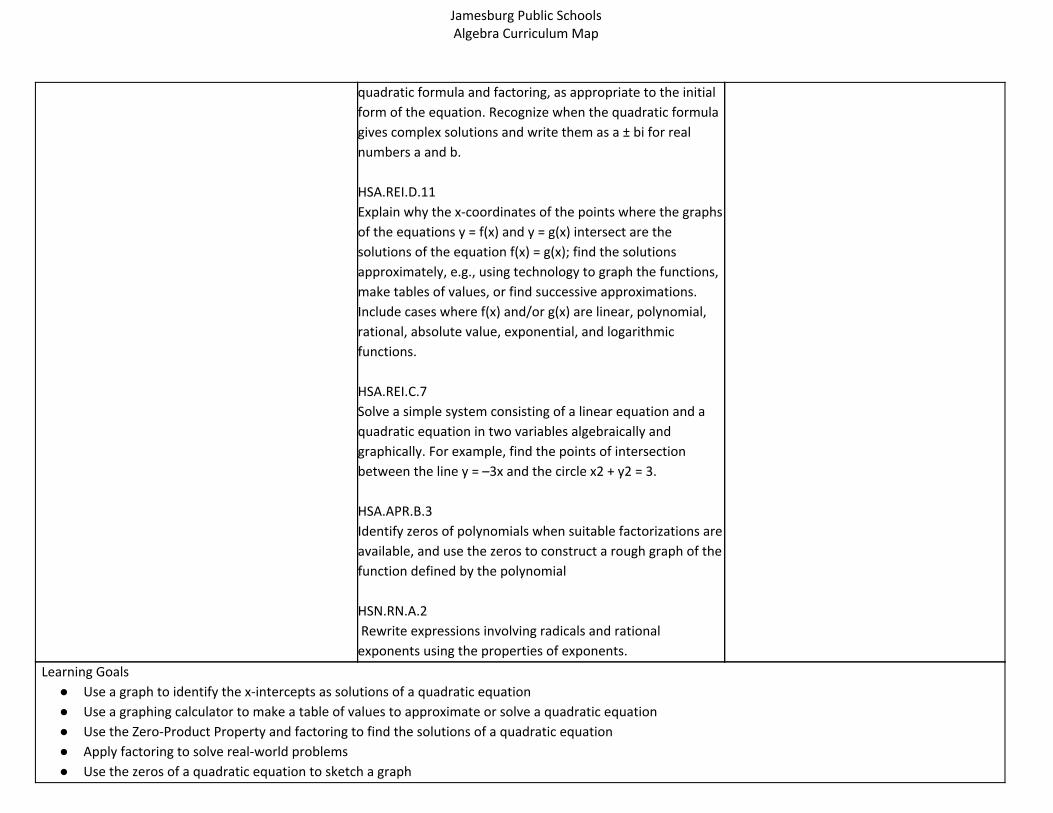
HSA.REI.D.11
Explain why the x-coordinates of the points where the graphs
of the equations y = f(x) and y = g(x) intersect are the
solutions of the equation f(x) = g(x); find the solutions
approximately, e.g., using technology to graph the functions,
make tables of values, or find successive approximations.
Include cases where f(x) and/or g(x) are linear, polynomial,
rational, absolute value, exponential, and logarithmic
functions.
HSA.REI.C.7
Solve a simple system consisting of a linear equation and a
quadratic equation in two variables algebraically and
graphically. For example, find the points of intersection
between the line y = –3x and the circle x2 + y2 = 3.
HSA.APR.B.3
Identify zeros of polynomials when suitable factorizations are
available, and use the zeros to construct a rough graph of the
function defined by the polynomial
HSN.RN.A.2
Rewrite expressions involving radicals and rational
exponents using the properties of exponents.
Learning Goals
● Use a graph to identify the x-intercepts as solutions of a quadratic equation
● Use a graphing calculator to make a table of values to approximate or solve a quadratic equation
● Use the Zero-Product Property and factoring to find the solutions of a quadratic equation
● Apply factoring to solve real-world problems
● Use the zeros of a quadratic equation to sketch a graph
Jamesburg Public Schools Algebra Curriculum Map
● Write the factored form of a quadratic function from a graph
● Use properties of exponents to rewrite radical expressions
● Multiply radical expressions
● Write a radical expression to model or represent a real-world problem
● Solve quadratic equations by finding square roots
● Determine reasonable solutions for real-world problems
● Solve a quadratic trinomial by completing the square to transform a quadratic equation into a perfect square trinomial
● Use completing the square to write a quadratic equation i n vertex form
● Derive the quadratic formula by completing the square
● Solve quadratic equations in one variable by using the quadratic formula
● Use the discriminant to determine the number and type of solutions to a quadratic equation
● Describe a linear-quadratic system of equations
● Solve a linear-quadratic system of equations by graphing, elimination, or substitution
Vocabulary: quadratic equation, zeros of a function, standard form of a quadratic function, Zero-Product Property, Product Property of Square Roots, completing
the square, discriminant, quadratic formula, root, linear-quadratic system
Modifications for Special Ed, ELL, Gifted Students, Students At-Risk of School Failure, Students with 504 Plans:
Re-teach/Intervention and Enrichment Activities (i.e. Diagnostic and Intervention System Lessons, ELL Toolkit resources, Project Based Learning
Math and Science STEM projects, Online tools and Practice Buddy, Vocabulary Cards)
Core Instructional Materials: Envision Algebra I Series Materials, Holt Algebra
Unit 9 Student Goals: End of topic assessments mastery, based on teacher expectations and student growth goals.
Unit 10
Working with Functions
Unit Summary NJSLS Standards Essential Questions
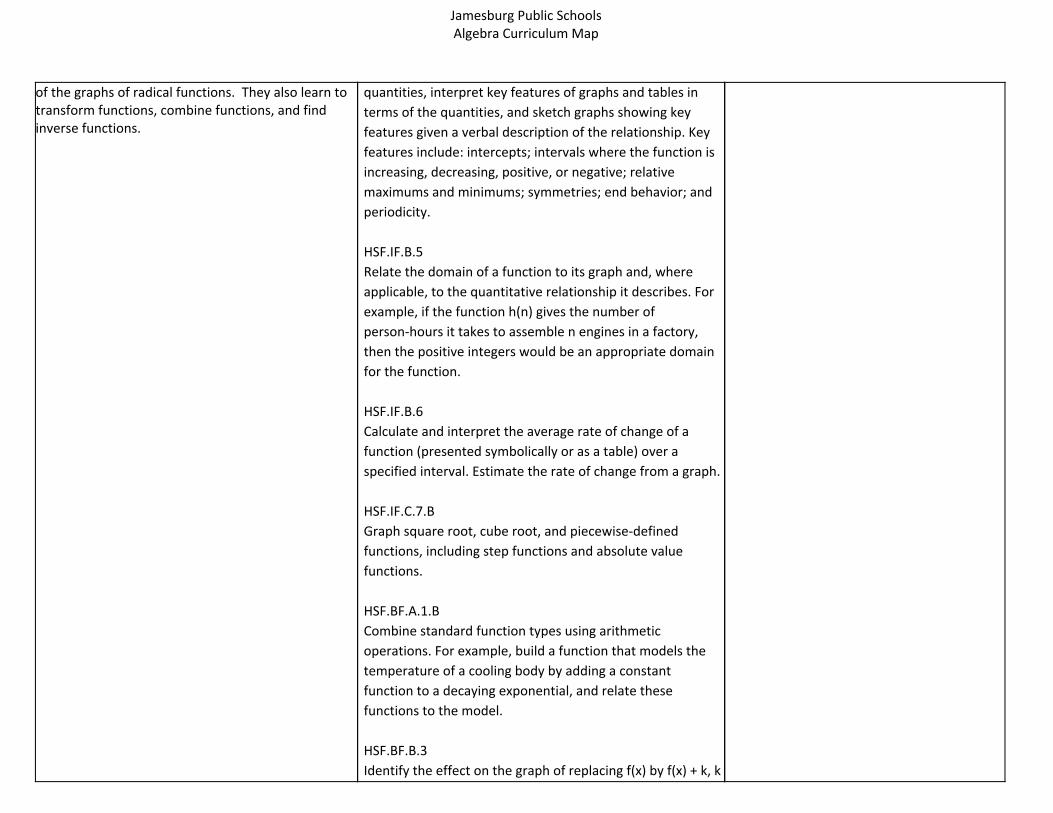
Unit (Topic) 10: Extends students’ knowledge of functions to include radical functions. Students identify the key features
HSF.IF.B.4
For a function that models a relationship between two
What are some operations on functions that you can use to create models and solve problems?
Jamesburg Public Schools Algebra Curriculum Map
of the graphs of radical functions. They also learn to transform functions, combine functions, and find inverse functions.
quantities, interpret key features of graphs and tables in
terms of the quantities, and sketch graphs showing key
features given a verbal description of the relationship. Key
features include: intercepts; intervals where the function is
increasing, decreasing, positive, or negative; relative
maximums and minimums; symmetries; end behavior; and
periodicity.
HSF.IF.B.5
Relate the domain of a function to its graph and, where
applicable, to the quantitative relationship it describes. For
example, if the function h(n) gives the number of
person-hours it takes to assemble n engines in a factory,
then the positive integers would be an appropriate domain
for the function.
HSF.IF.B.6
Calculate and interpret the average rate of change of a
function (presented symbolically or as a table) over a
specified interval. Estimate the rate of change from a graph.
HSF.IF.C.7.B
Graph square root, cube root, and piecewise-defined
functions, including step functions and absolute value
functions.
HSF.BF.A.1.B
Combine standard function types using arithmetic
operations. For example, build a function that models the
temperature of a cooling body by adding a constant
function to a decaying exponential, and relate these
functions to the model.
HSF.BF.B.3
Identify the effect on the graph of replacing f(x) by f(x) + k, k
Jamesburg Public Schools Algebra Curriculum Map
f(x), f(kx), and f(x + k) for specific values of k (both positive
and negative); find the value of k given the graphs.
Experiment with cases and illustrate an explanation of the
effects on the graph using technology. Include recognizing
even and odd functions from their graphs and algebraic
expressions for them.
HSF.BF.B.4
Find inverse functions.
HSF.BF.B.4.A
Solve an equation of the form f(x) = c for a simple function f
that has an inverse and write an expression for the inverse.
For example, f(x) =2 x3 or f(x) = (x+1)/(x–1) for x ≠1.
Learning Goals:
● Graph translations of the square root function ● Calculate and interpret the average rate of change for a square root function over a specified interval ● Identify key features of the graph of cube root functions and graph translations of them ● Model real-world situations using the cube root function ● Calculate and interpret The average rate of change of a cube root function over a specific interval ● Relate the domain and range of a function to its graph ● Analyze the key features of the graph of a function to identify the type of function it represents ● Graph translations of absolute value, exponential, quadratic, and radical functions ● Determine how combining translations affects the key features of the graph of a function ● Identify the effect on the graph of a function of multiplying the output by -1 ● Identify the effect on the graph of a function of replacing f(x) by kf(x) or F(kx) for specific values of k ● Combine functions using arithmetic operations, including addition, subtraction, and multiplication ● Combine functions to solve real world problems ● Write an equation for the inverse of a linear function ● Write the inverse of a quadratic function after restricting the domain so the original function is one-to-one
Vocabulary: square root function, cube root function, inverse of a function
Modifications for Special Ed, ELL, Gifted Students, Students At-Risk of School Failure, Students with 504 Plans:
Re-teach/Intervention and Enrichment Activities (i.e. Diagnostic and Intervention System Lessons, ELL Toolkit resources, Project Based Learning
Math and Science STEM projects, Online tools and Practice Buddy, Vocabulary Cards)
Core Instructional Materials: Envision Algebra I Series Materials, Holt Algebra
Jamesburg Public Schools Algebra Curriculum Map
Unit 10 Student Goals: End of topic assessments mastery, based on teacher expectations and student growth goals.
Unit 11
Statistics
Unit Summary NJSLS Standards Essential Questions
Unit (Topic) 11: Focuses on extending students’ knowledge of dot plots, box plots, and histograms. Students identify that standard deviation is used to compare a specific value to other values. Students understand how to find joint, marginal, and relative frequencies. Students learn methods to interpret data displays and create inferences based on the data
HSS.ID.A
A.1
Represent data with plots on the real number line (dot
plots, histograms, and box plots).
A.2
Use statistics appropriate to the shape of the data
distribution to compare center (median, mean) and spread
(interquartile range, standard deviation) of two or more
different data sets.
A.3
Interpret differences in shape, center, and spread in the
context of the data sets, accounting for possible effects of
extreme data points (outliers).
HSS.ID.B.5
Summarize categorical data for two categories in two-way
frequency tables. Interpret relative frequencies in the
context of the data (including joint, marginal, and
conditional relative frequencies). Recognize possible
associations and trends in the data
How do use statistics to model situations and solve problems?
Learning Goals:
● Represent data using dot plots, box plots, and histograms ● Interpret the data displayed in dot plots, box plots, and histograms within the context of the data that it represents ● Use measures of center to interpret and compare data sets displayed in dot plots, box plots, and histograms ● Explain and account for the effect of outliers on measures of center and variability ● Use measures of variability, such as the MAD and IQR, to interpret the compare the data sets ● Interpret and compare differences in the shape, center, and spread of data of different data sets
Jamesburg Public Schools Algebra Curriculum Map
● Determine the relationship between the mean and median of a data set when the shape of the data is evenly spread, skewed right, or skewed left ● Interpret differences in the variability of spread in the context of a data set ● Calculate the standard deviation of a data set and use it to compare and interpret data sets ● Organize and summarize categorical data by creating two-way frequency tables ● Calculate and interpret joint and marginal frequencies, joint and marginal relative frequencies, and conditional relative frequencies, and use them to make
inferences about a population Vocabulary: normal distribution, standard deviation, variance, conditional relative frequency, joint frequency, joint relative frequency, marginal frequency,
marginal relative frequency,
Modifications for Special Ed, ELL, Gifted Students, Students At-Risk of School Failure, Students with 504 Plans:
Re-teach/Intervention and Enrichment Activities (i.e. Diagnostic and Intervention System Lessons, ELL Toolkit resources, Project Based Learning
Math and Science STEM projects, Online tools and Practice Buddy, Vocabulary Cards)
Core Instructional Materials: Envision Algebra I Series Materials, Holt Algebra
Unit 11 Student Goals: End of topic assessments mastery, based on teacher expectations and student growth goals.